
Role of Furin in Colon Cancer Stem Cells Malignant Phenotype and Expression of LGR5 and NANOG in KRAS and BRAF-Mutated Colon Tumors

 , , , , and
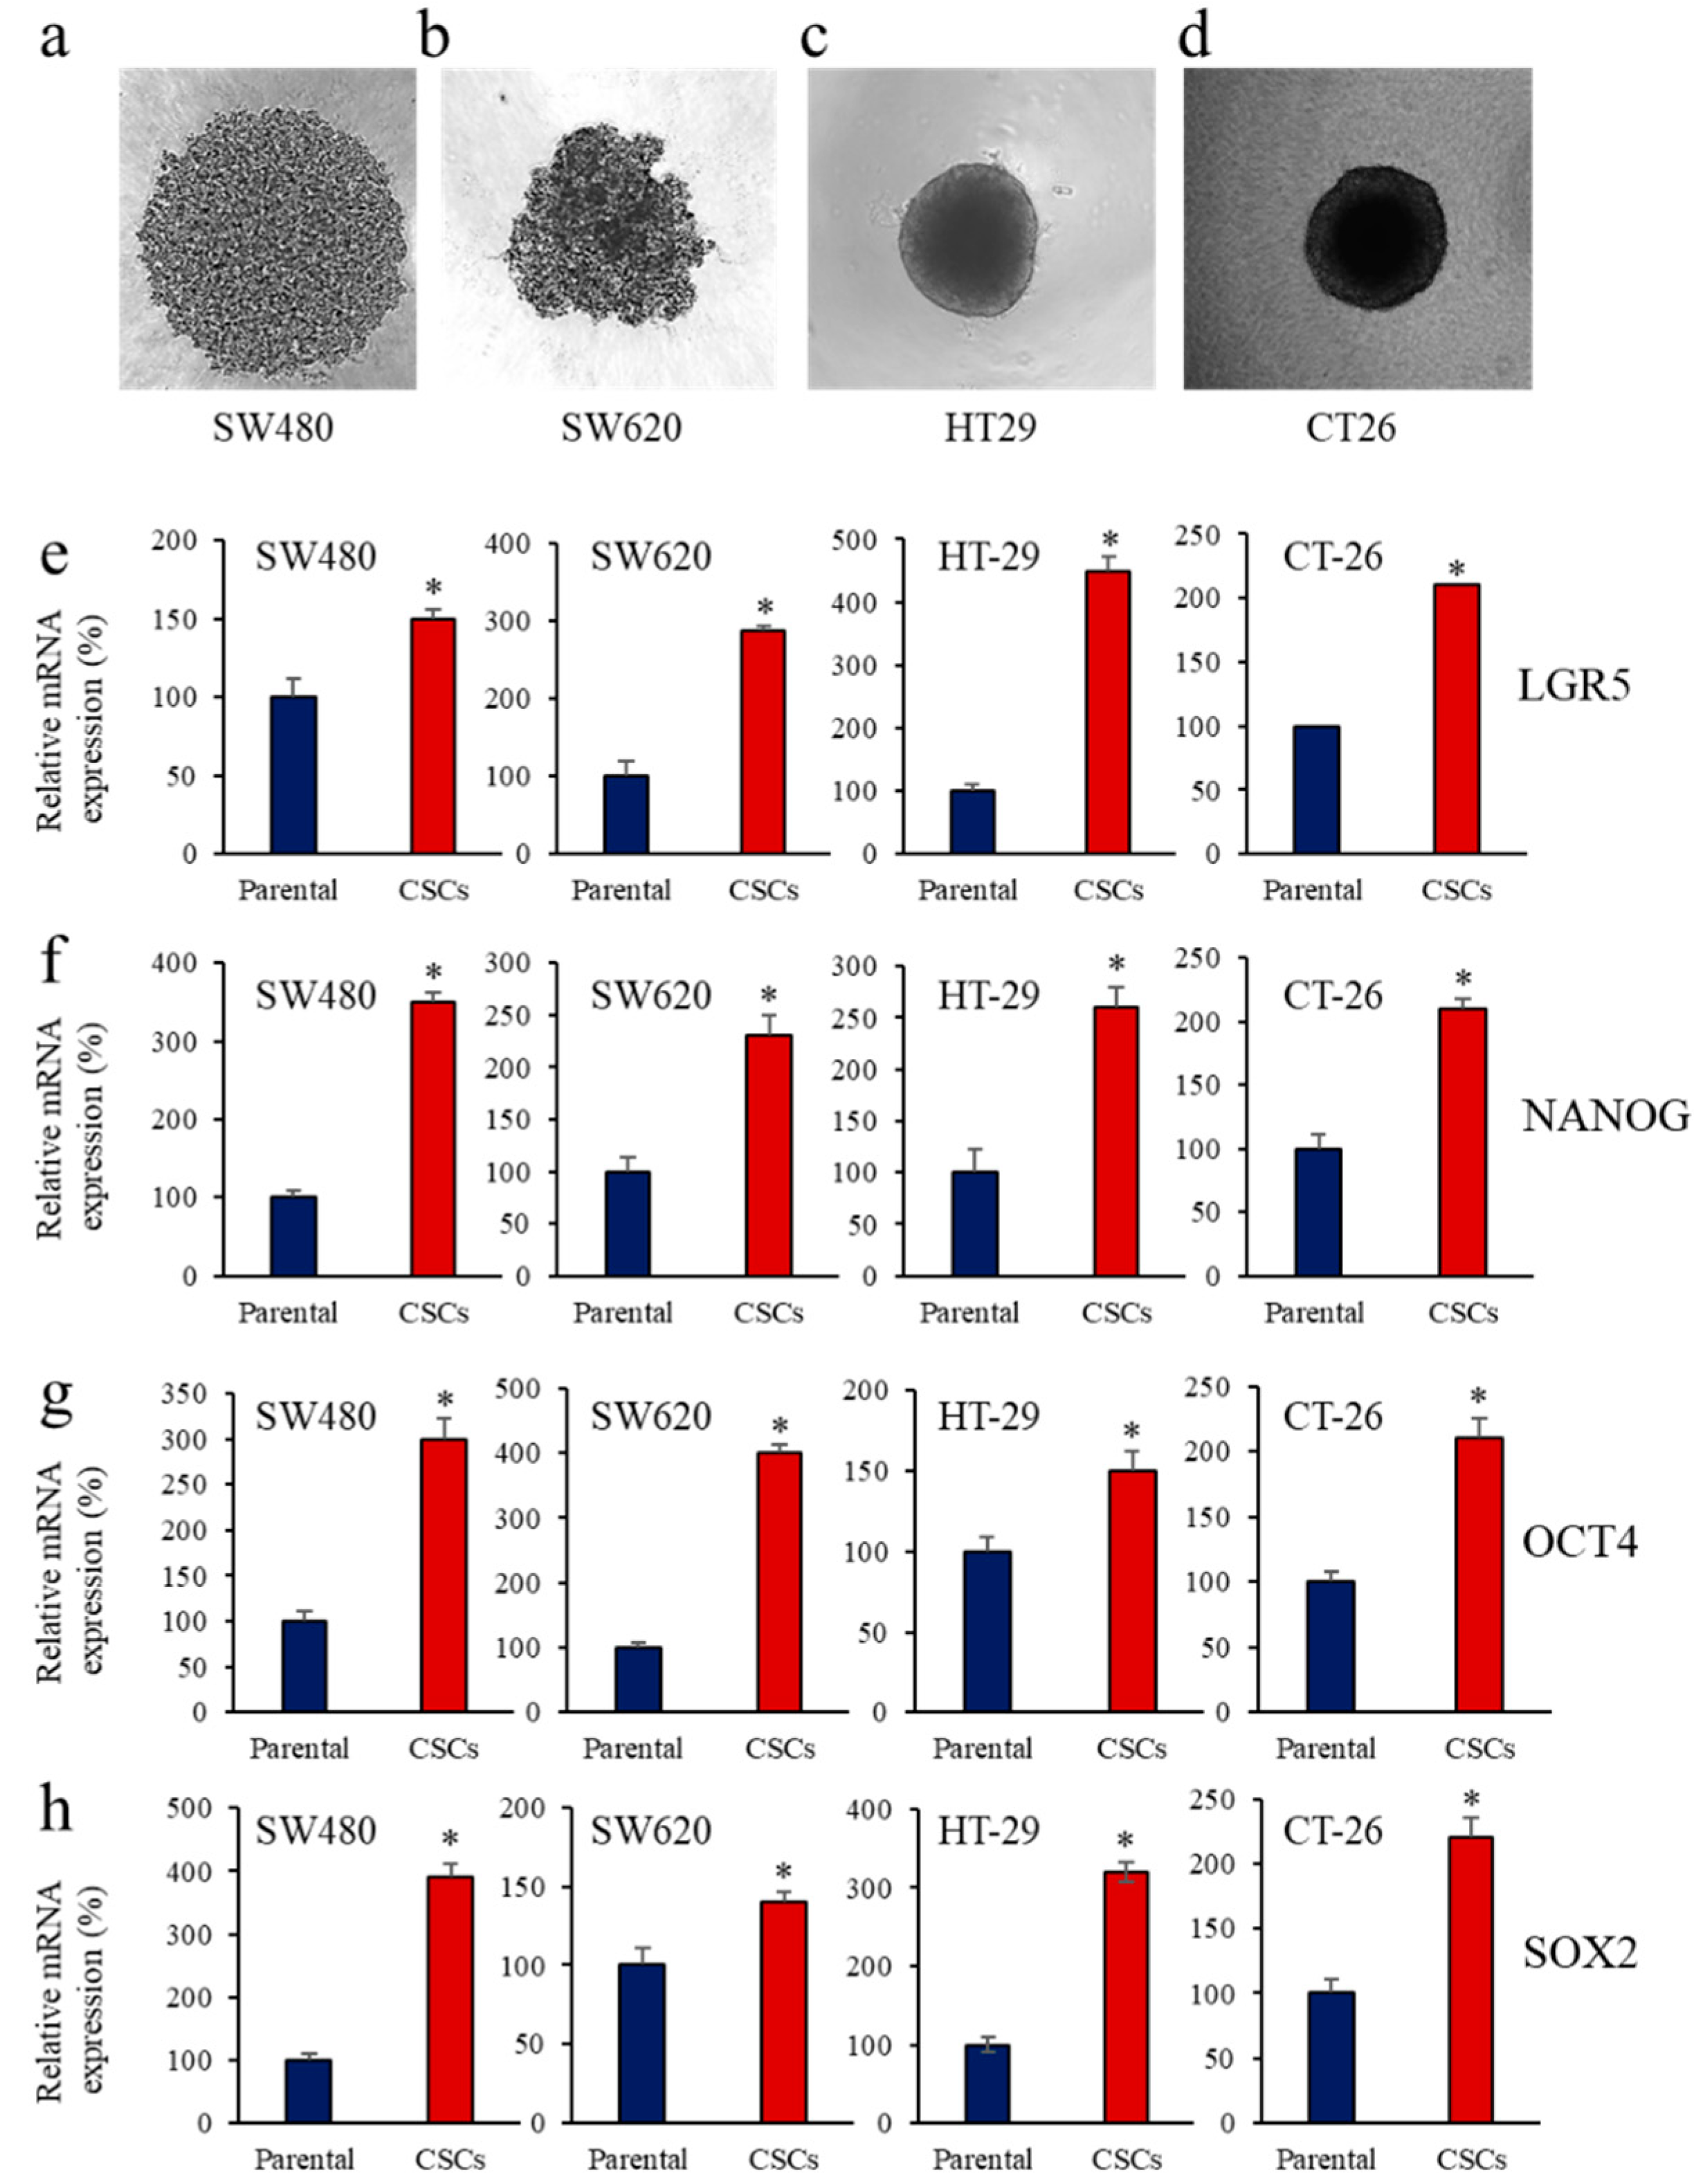
Abstract
:Simple Summary
Abstract
1. Introduction
2. Materials and Methods
2.1. Cell Culture and Formation of SPHEROIDS Mimicking CSCs
2.2. RNA Extraction and Quantitative Real-Time PCR
2.3. Spheroid Growth and Collagen Invasion Assays
2.4. Proprotein Convertases Activity Assay
2.5. Cell Viability Assay
2.6. Mouse Model
2.7. Statistical Analysis
3. Results
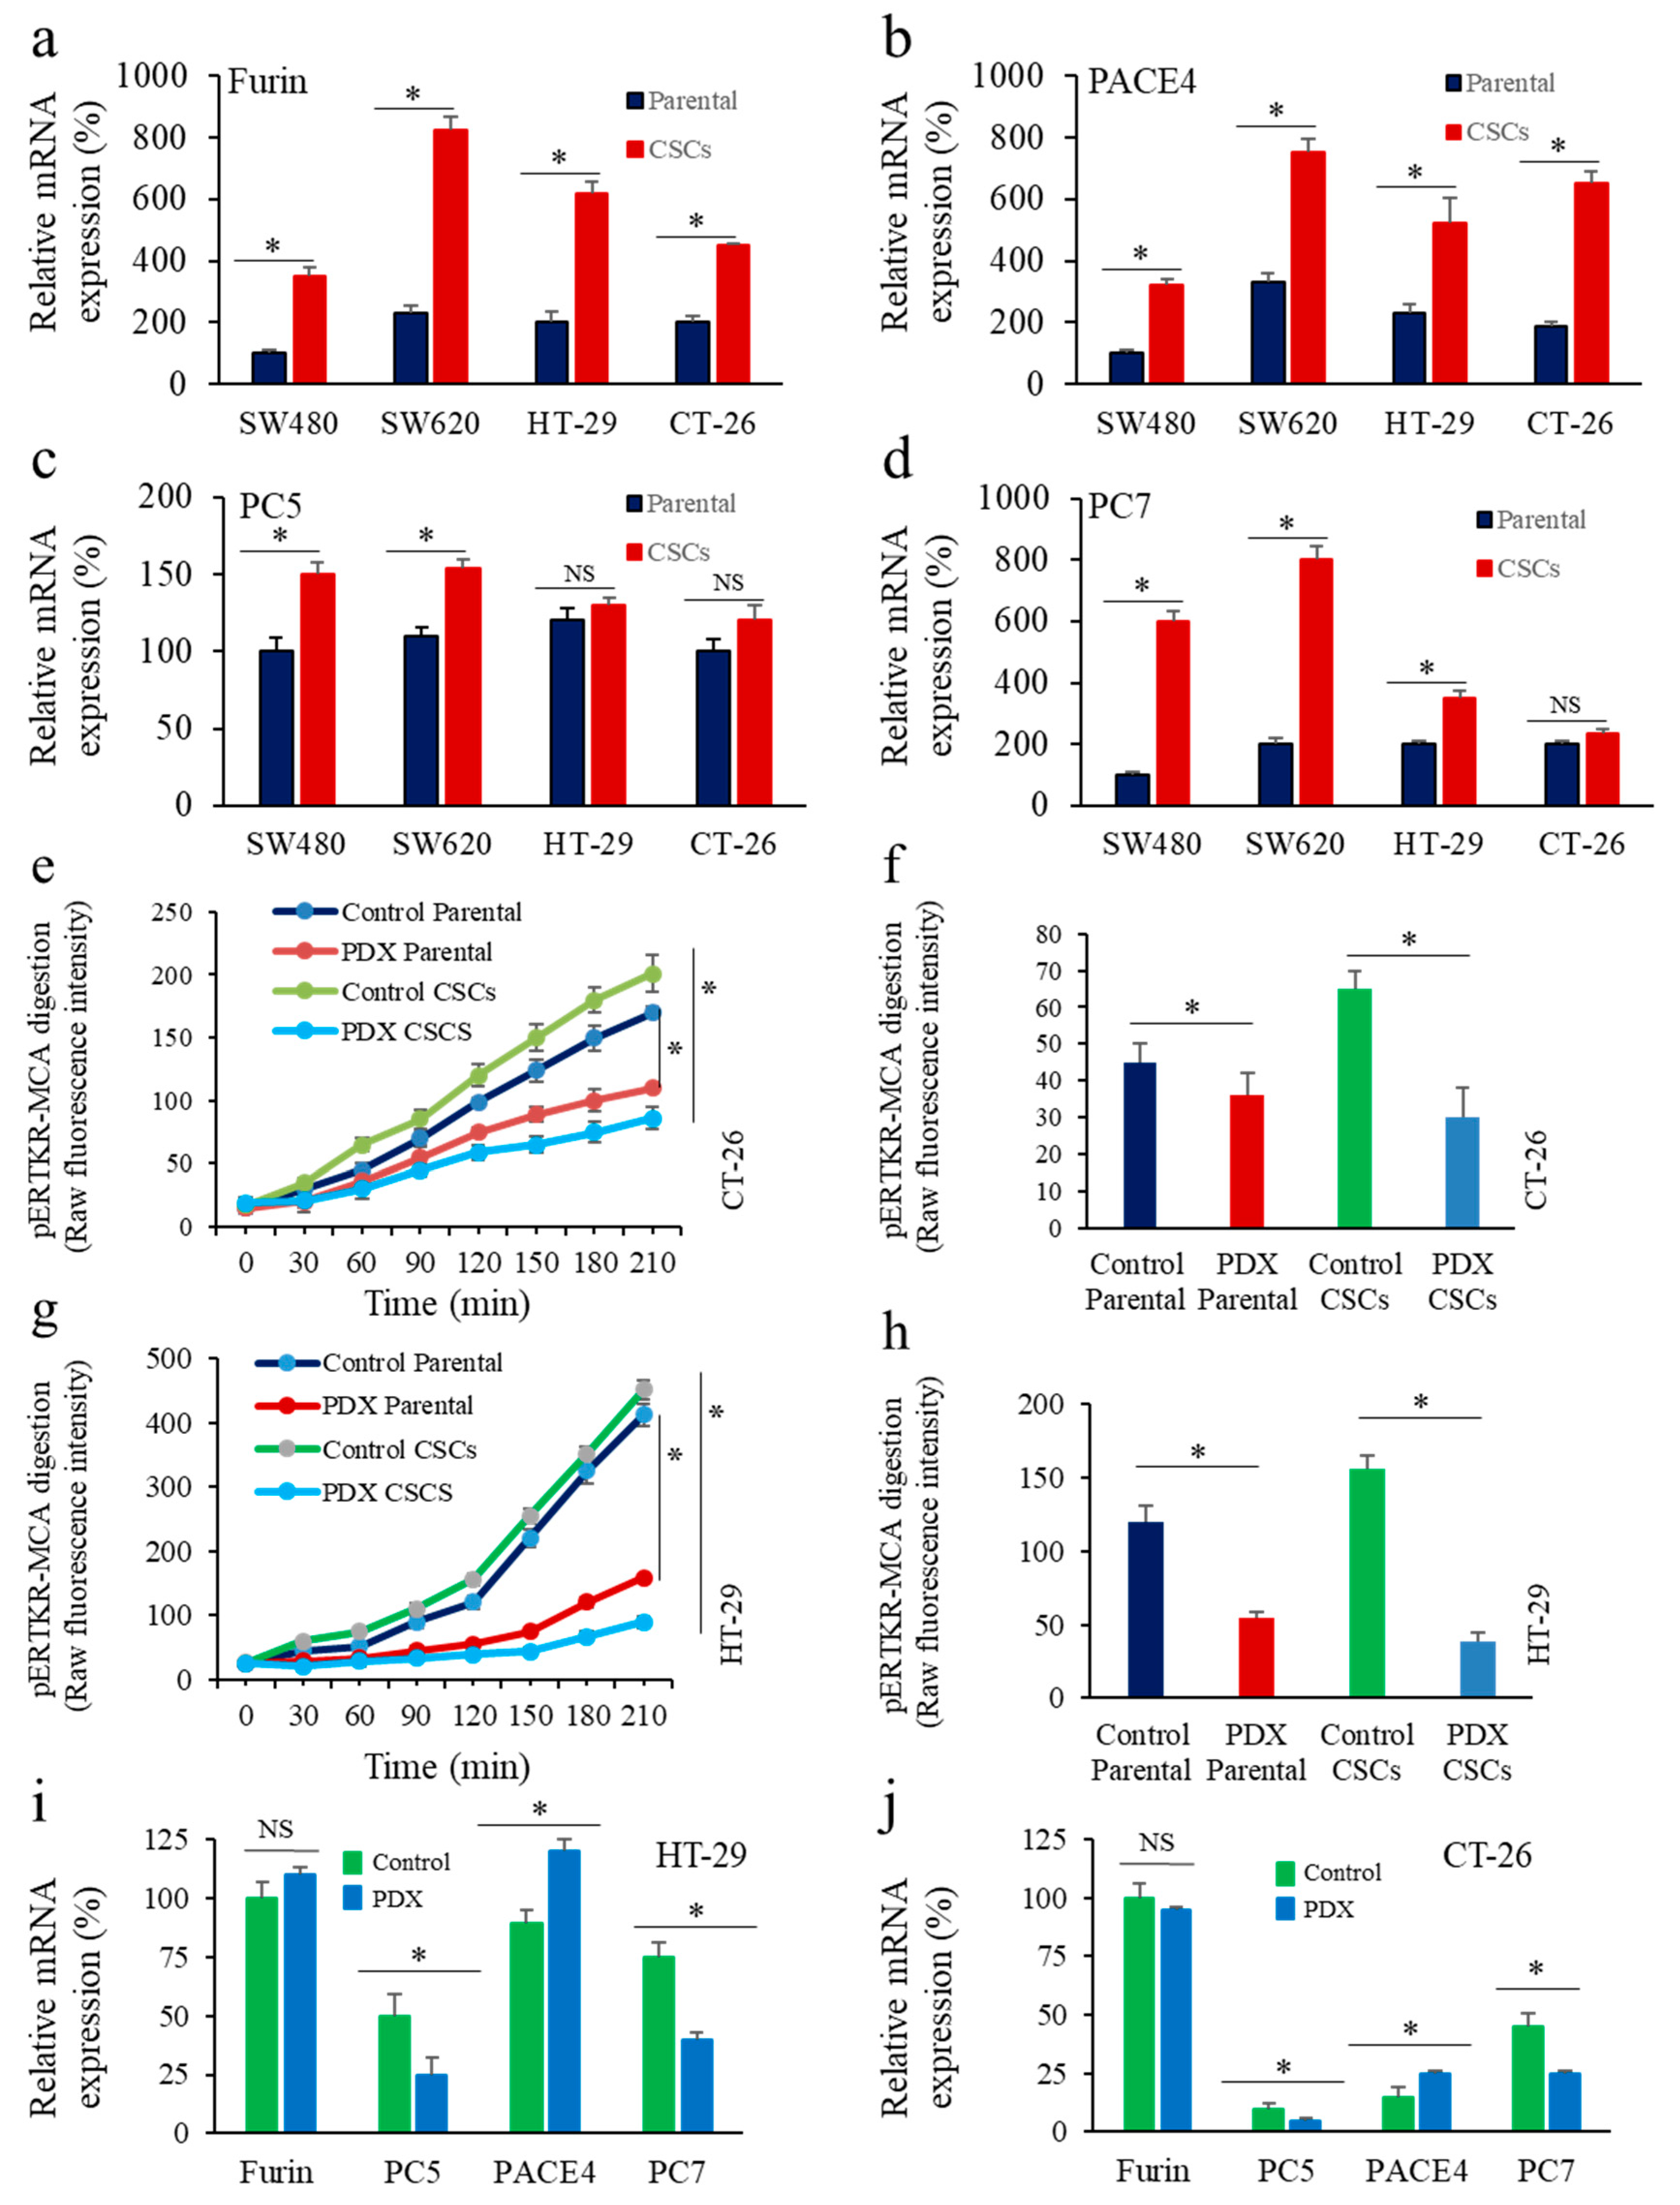
3.1. Enrichment of CSCs after Sphere-Forming Is Associated with Altered Proprotein Convertases (PCs) Expression
3.2. Inhibition of PCs Activity and CSC Gene Expression
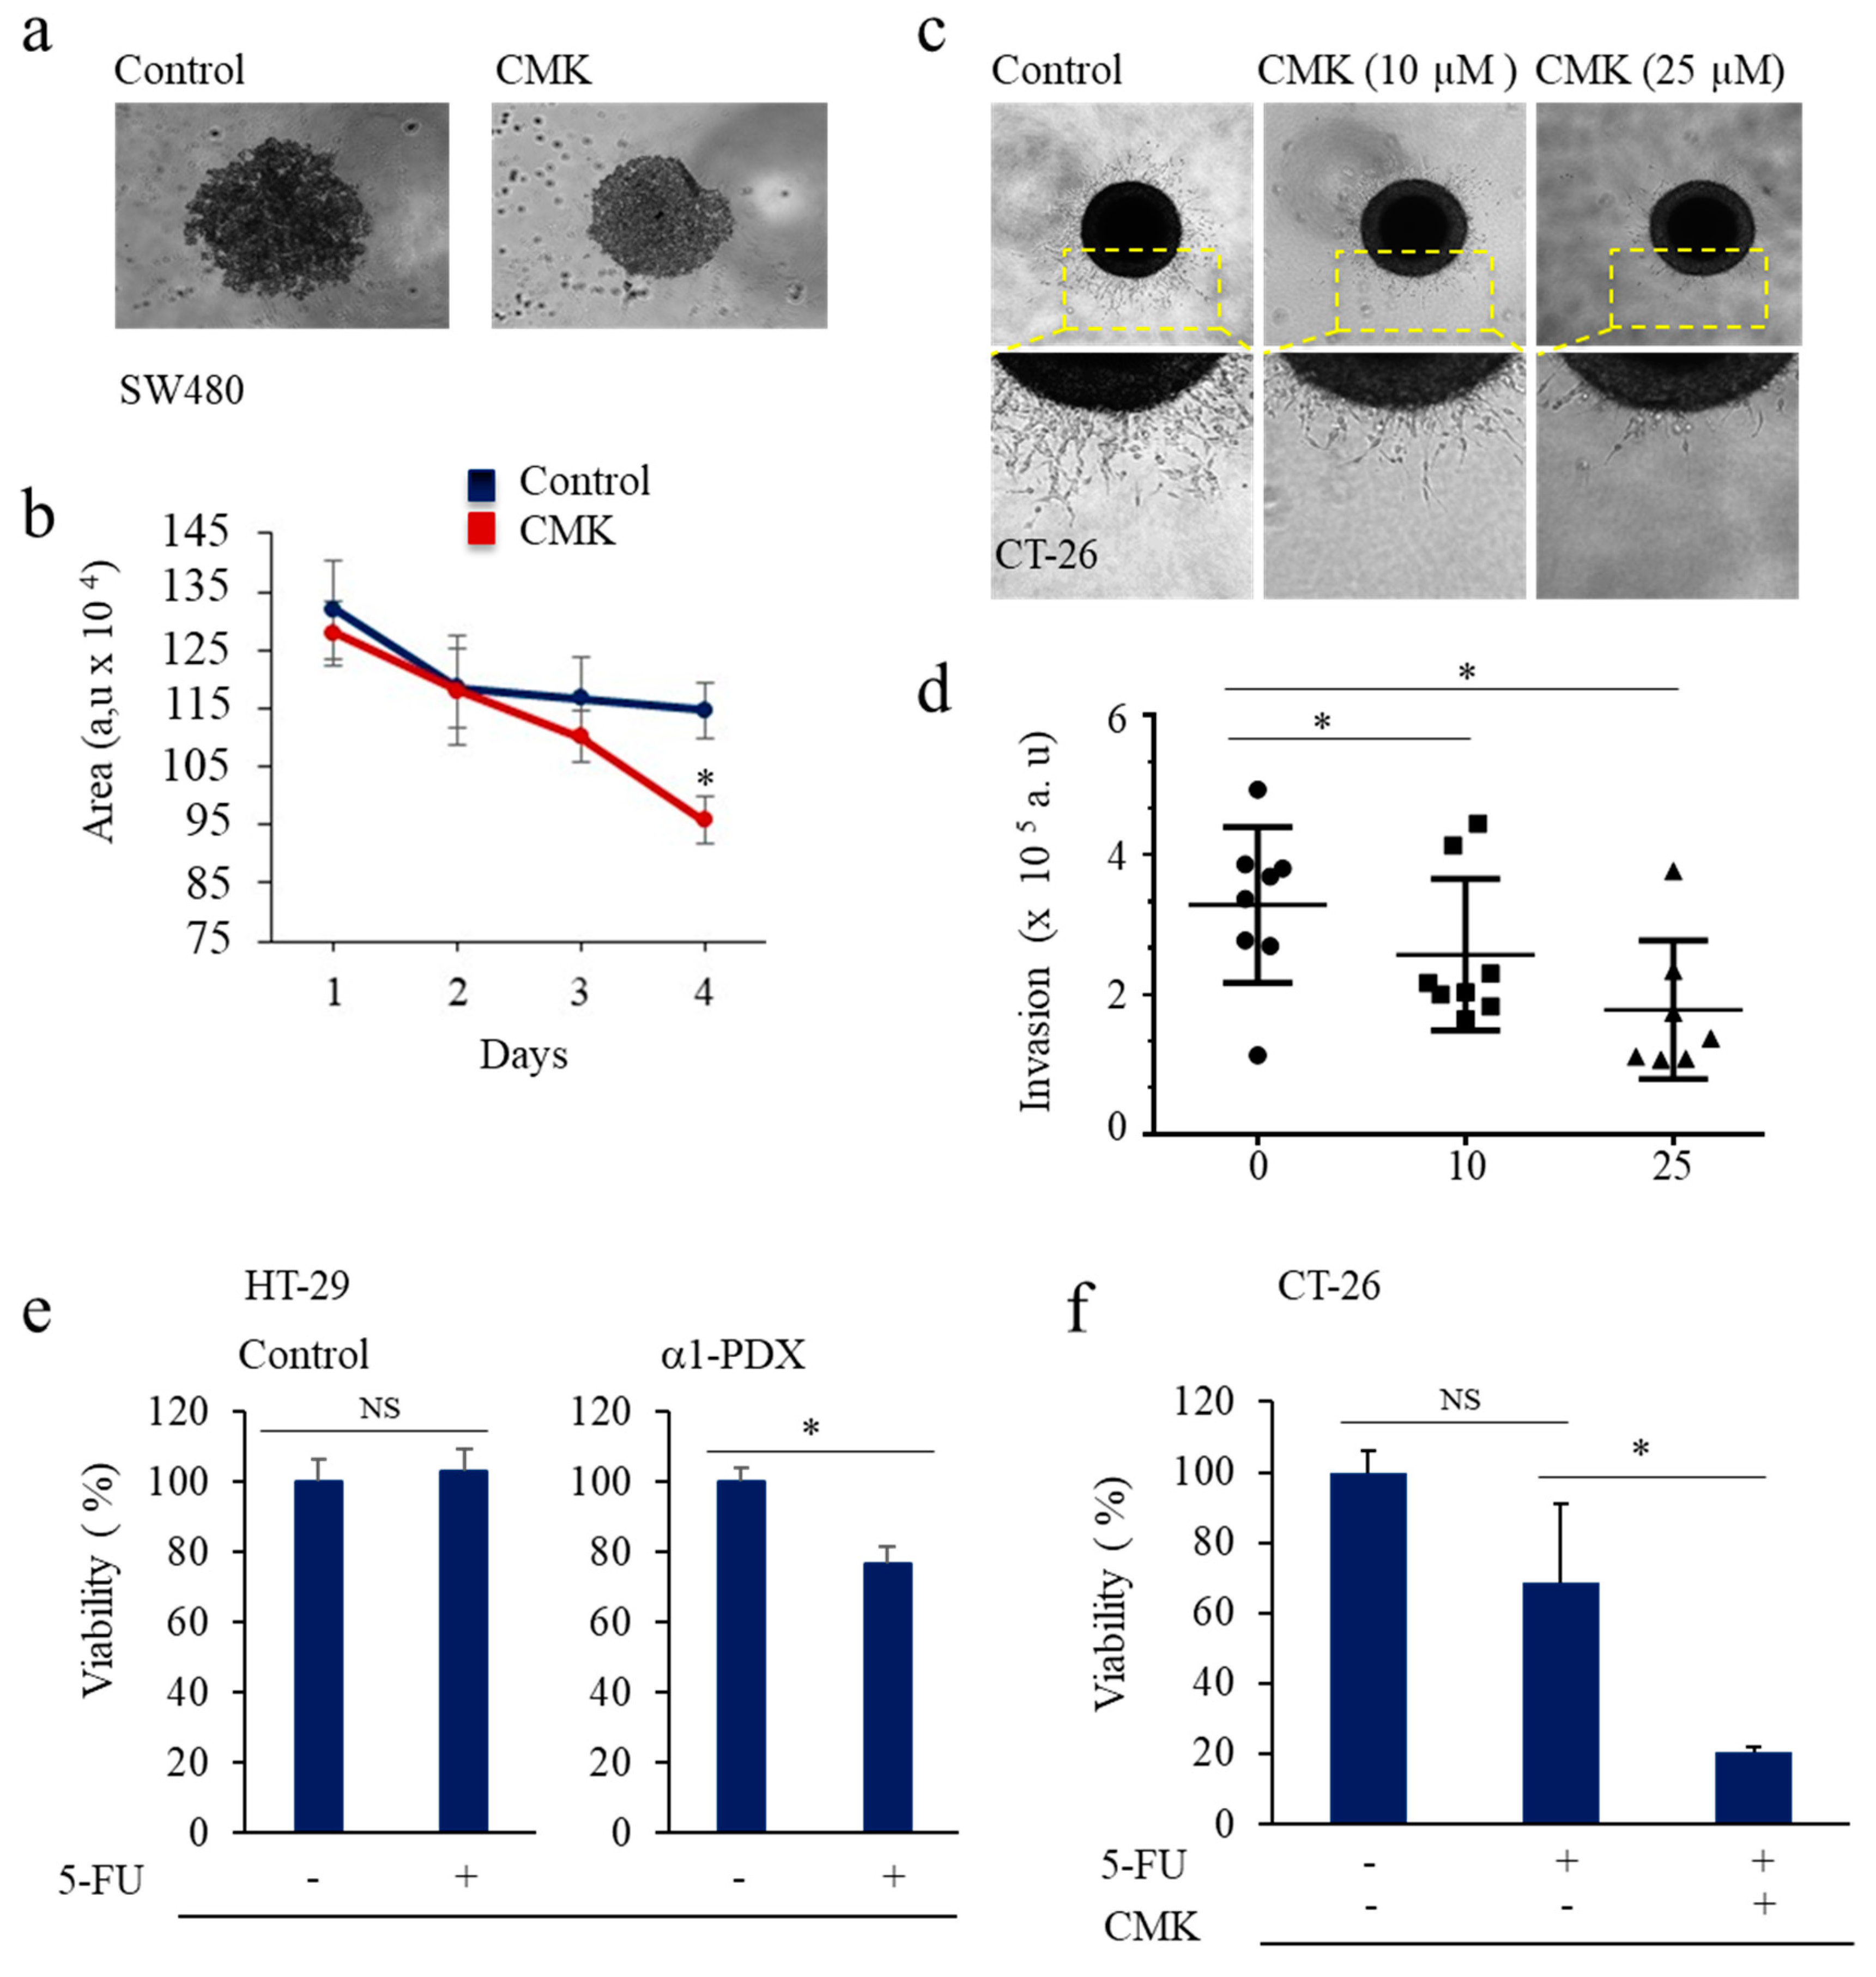
3.3. PCs Inhibition Promotes CSCs Proliferation and Invasion Blockade
3.4. Inhibition of PCs Activity Increases Chemoresistance to 5-FU
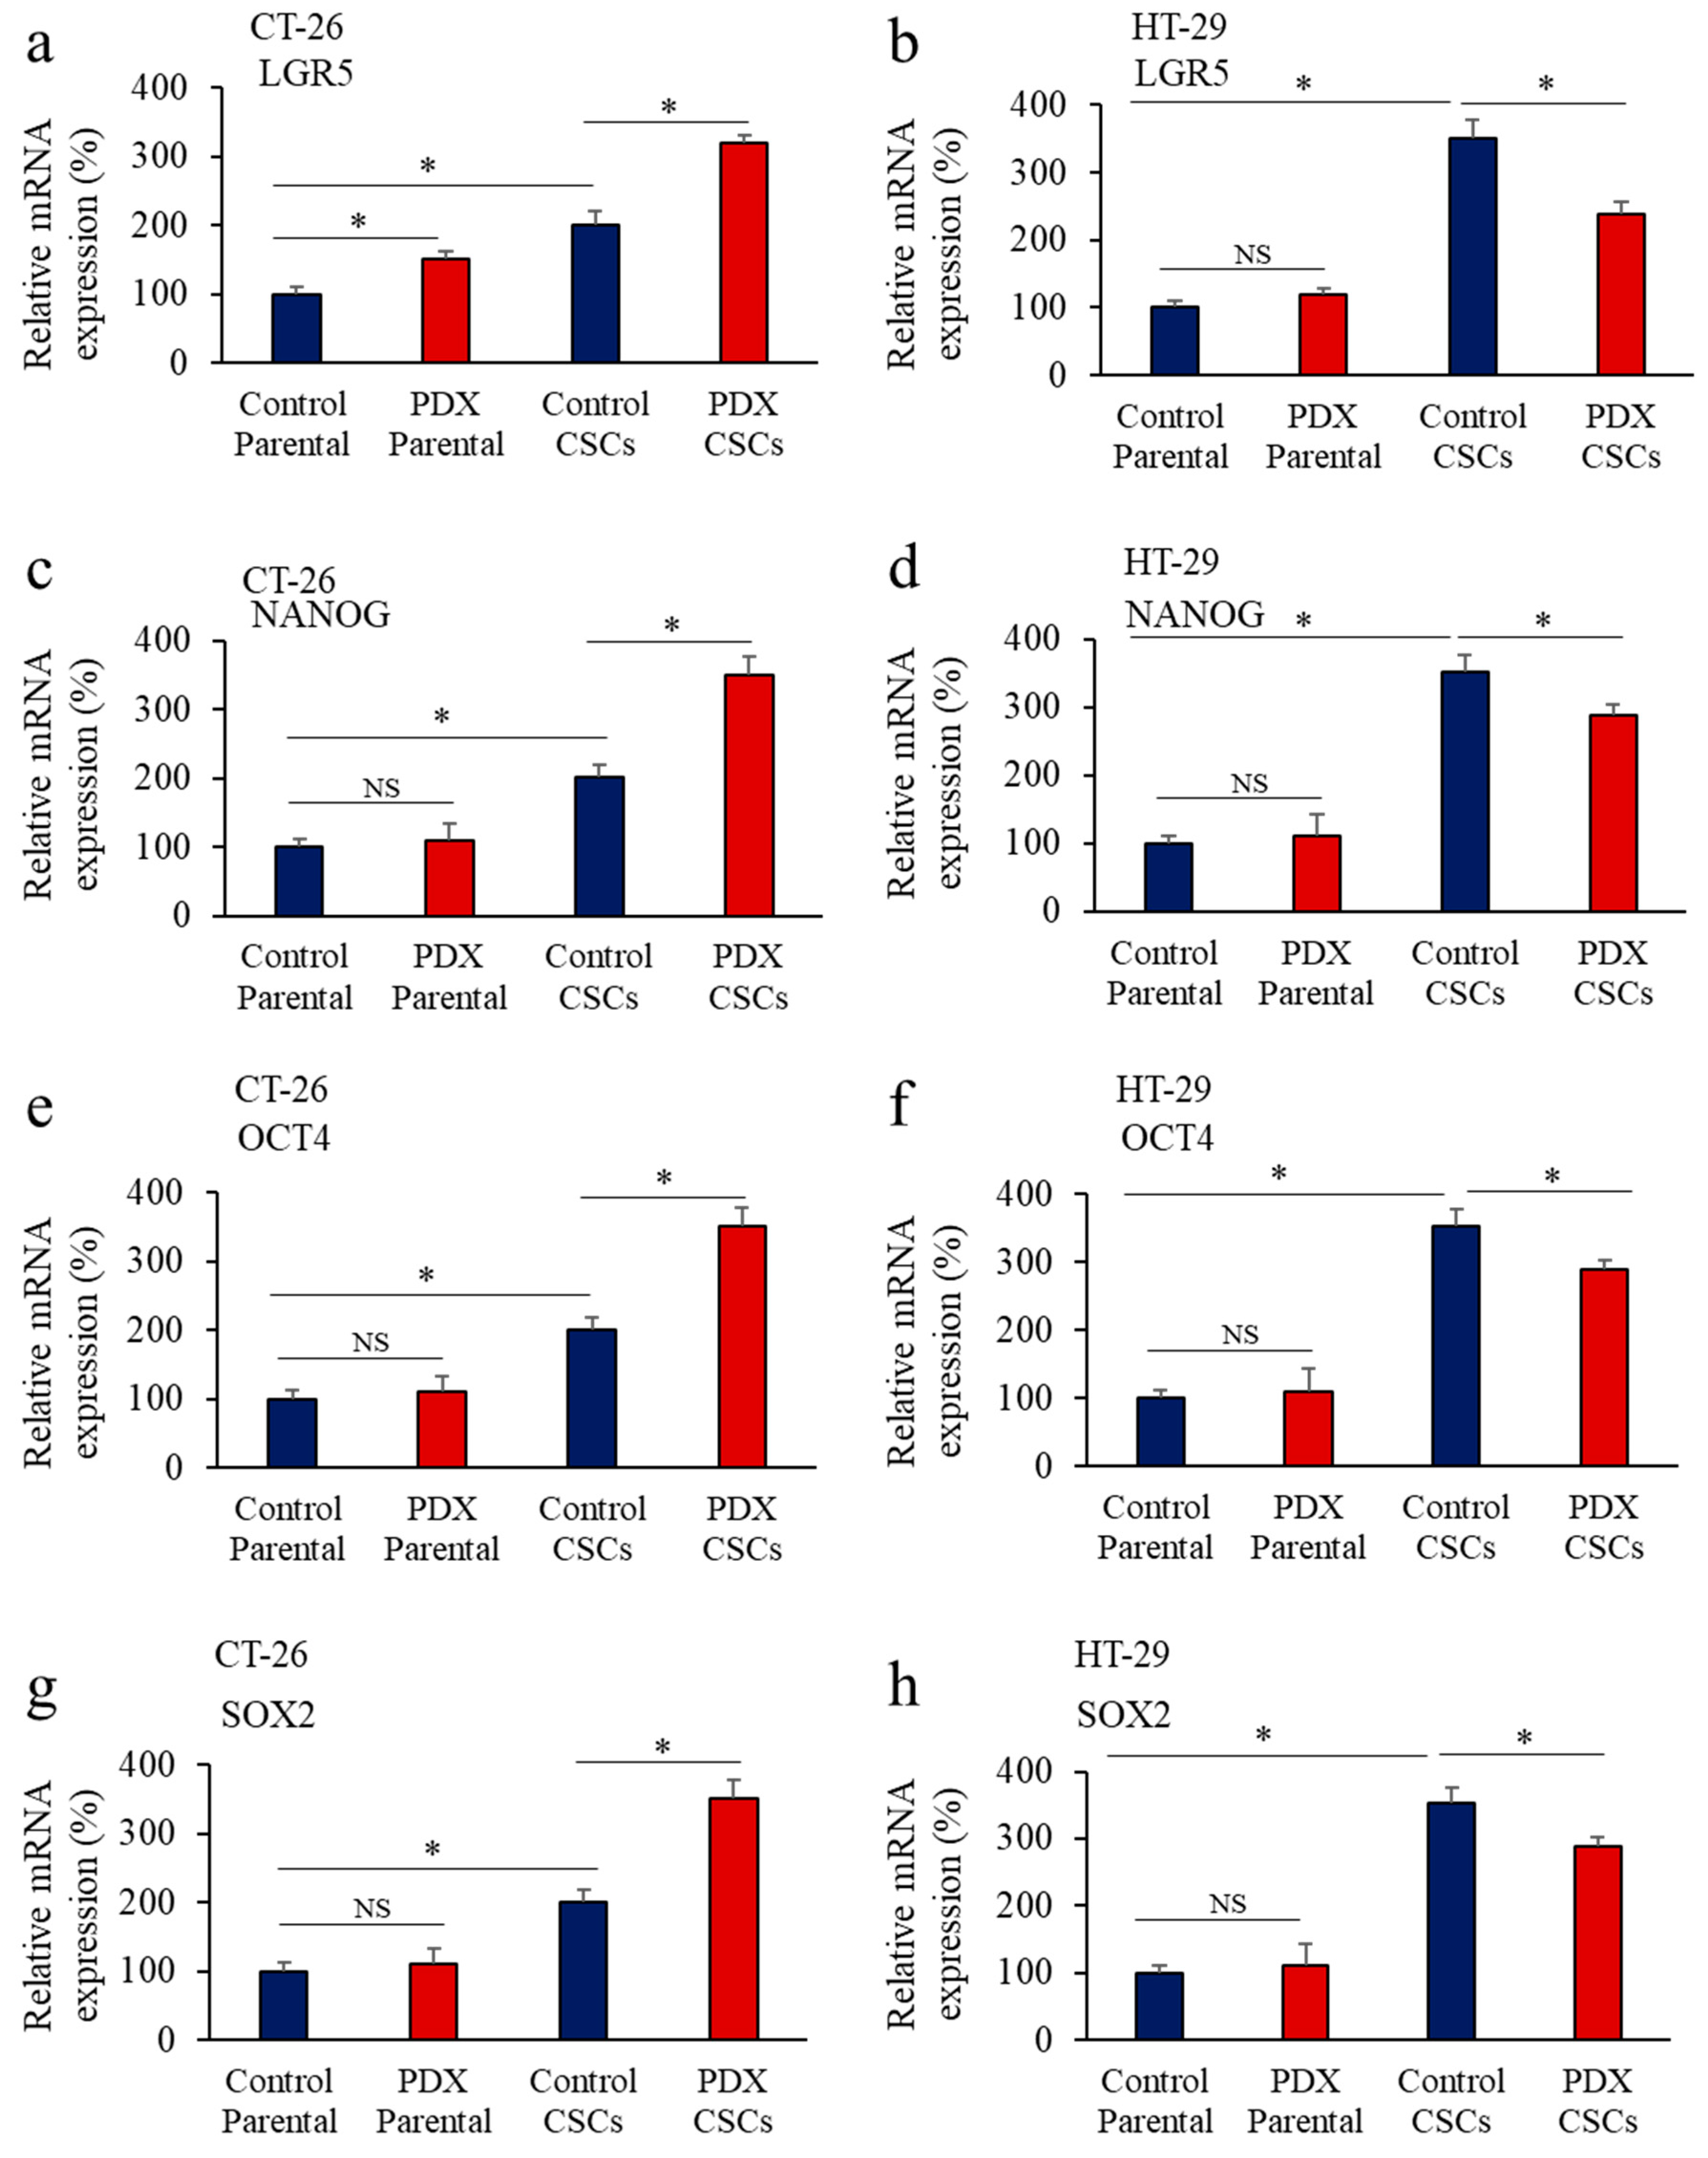
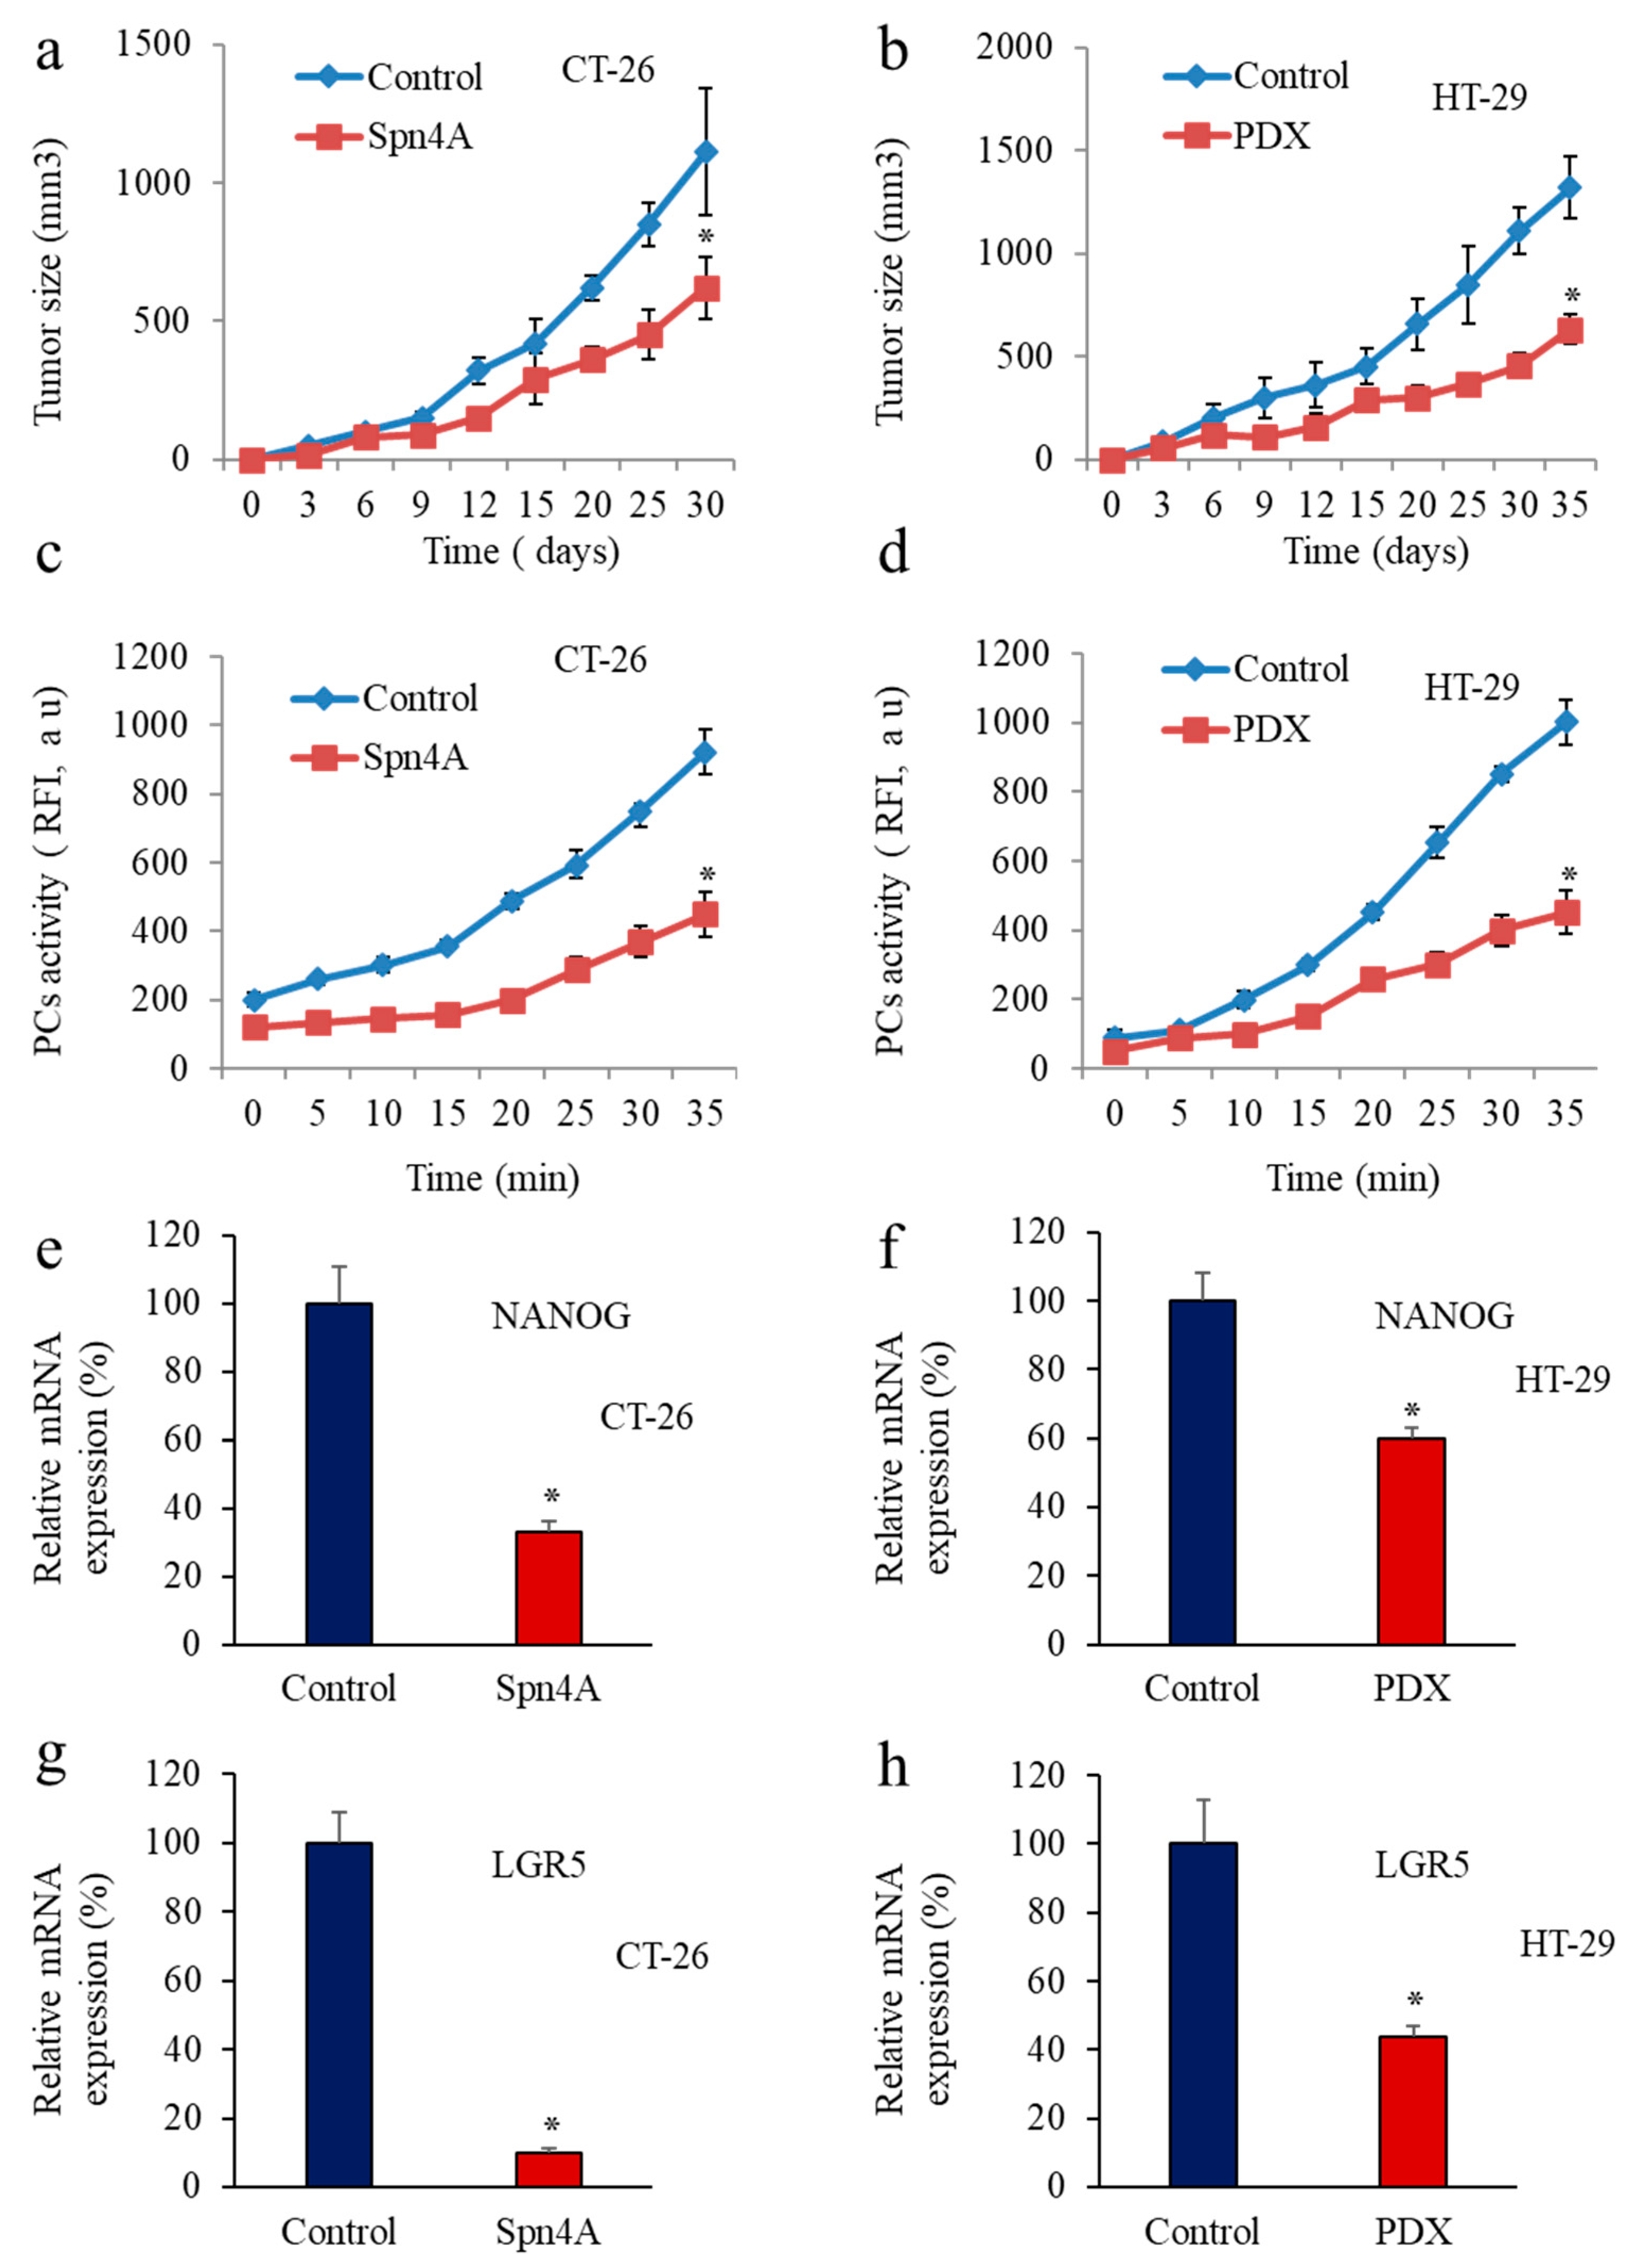
3.5. Inhbition of PCs in Colon Cancer Cells Reprsses LGR5 and NANOG Expression in Mice-Induced Tumors
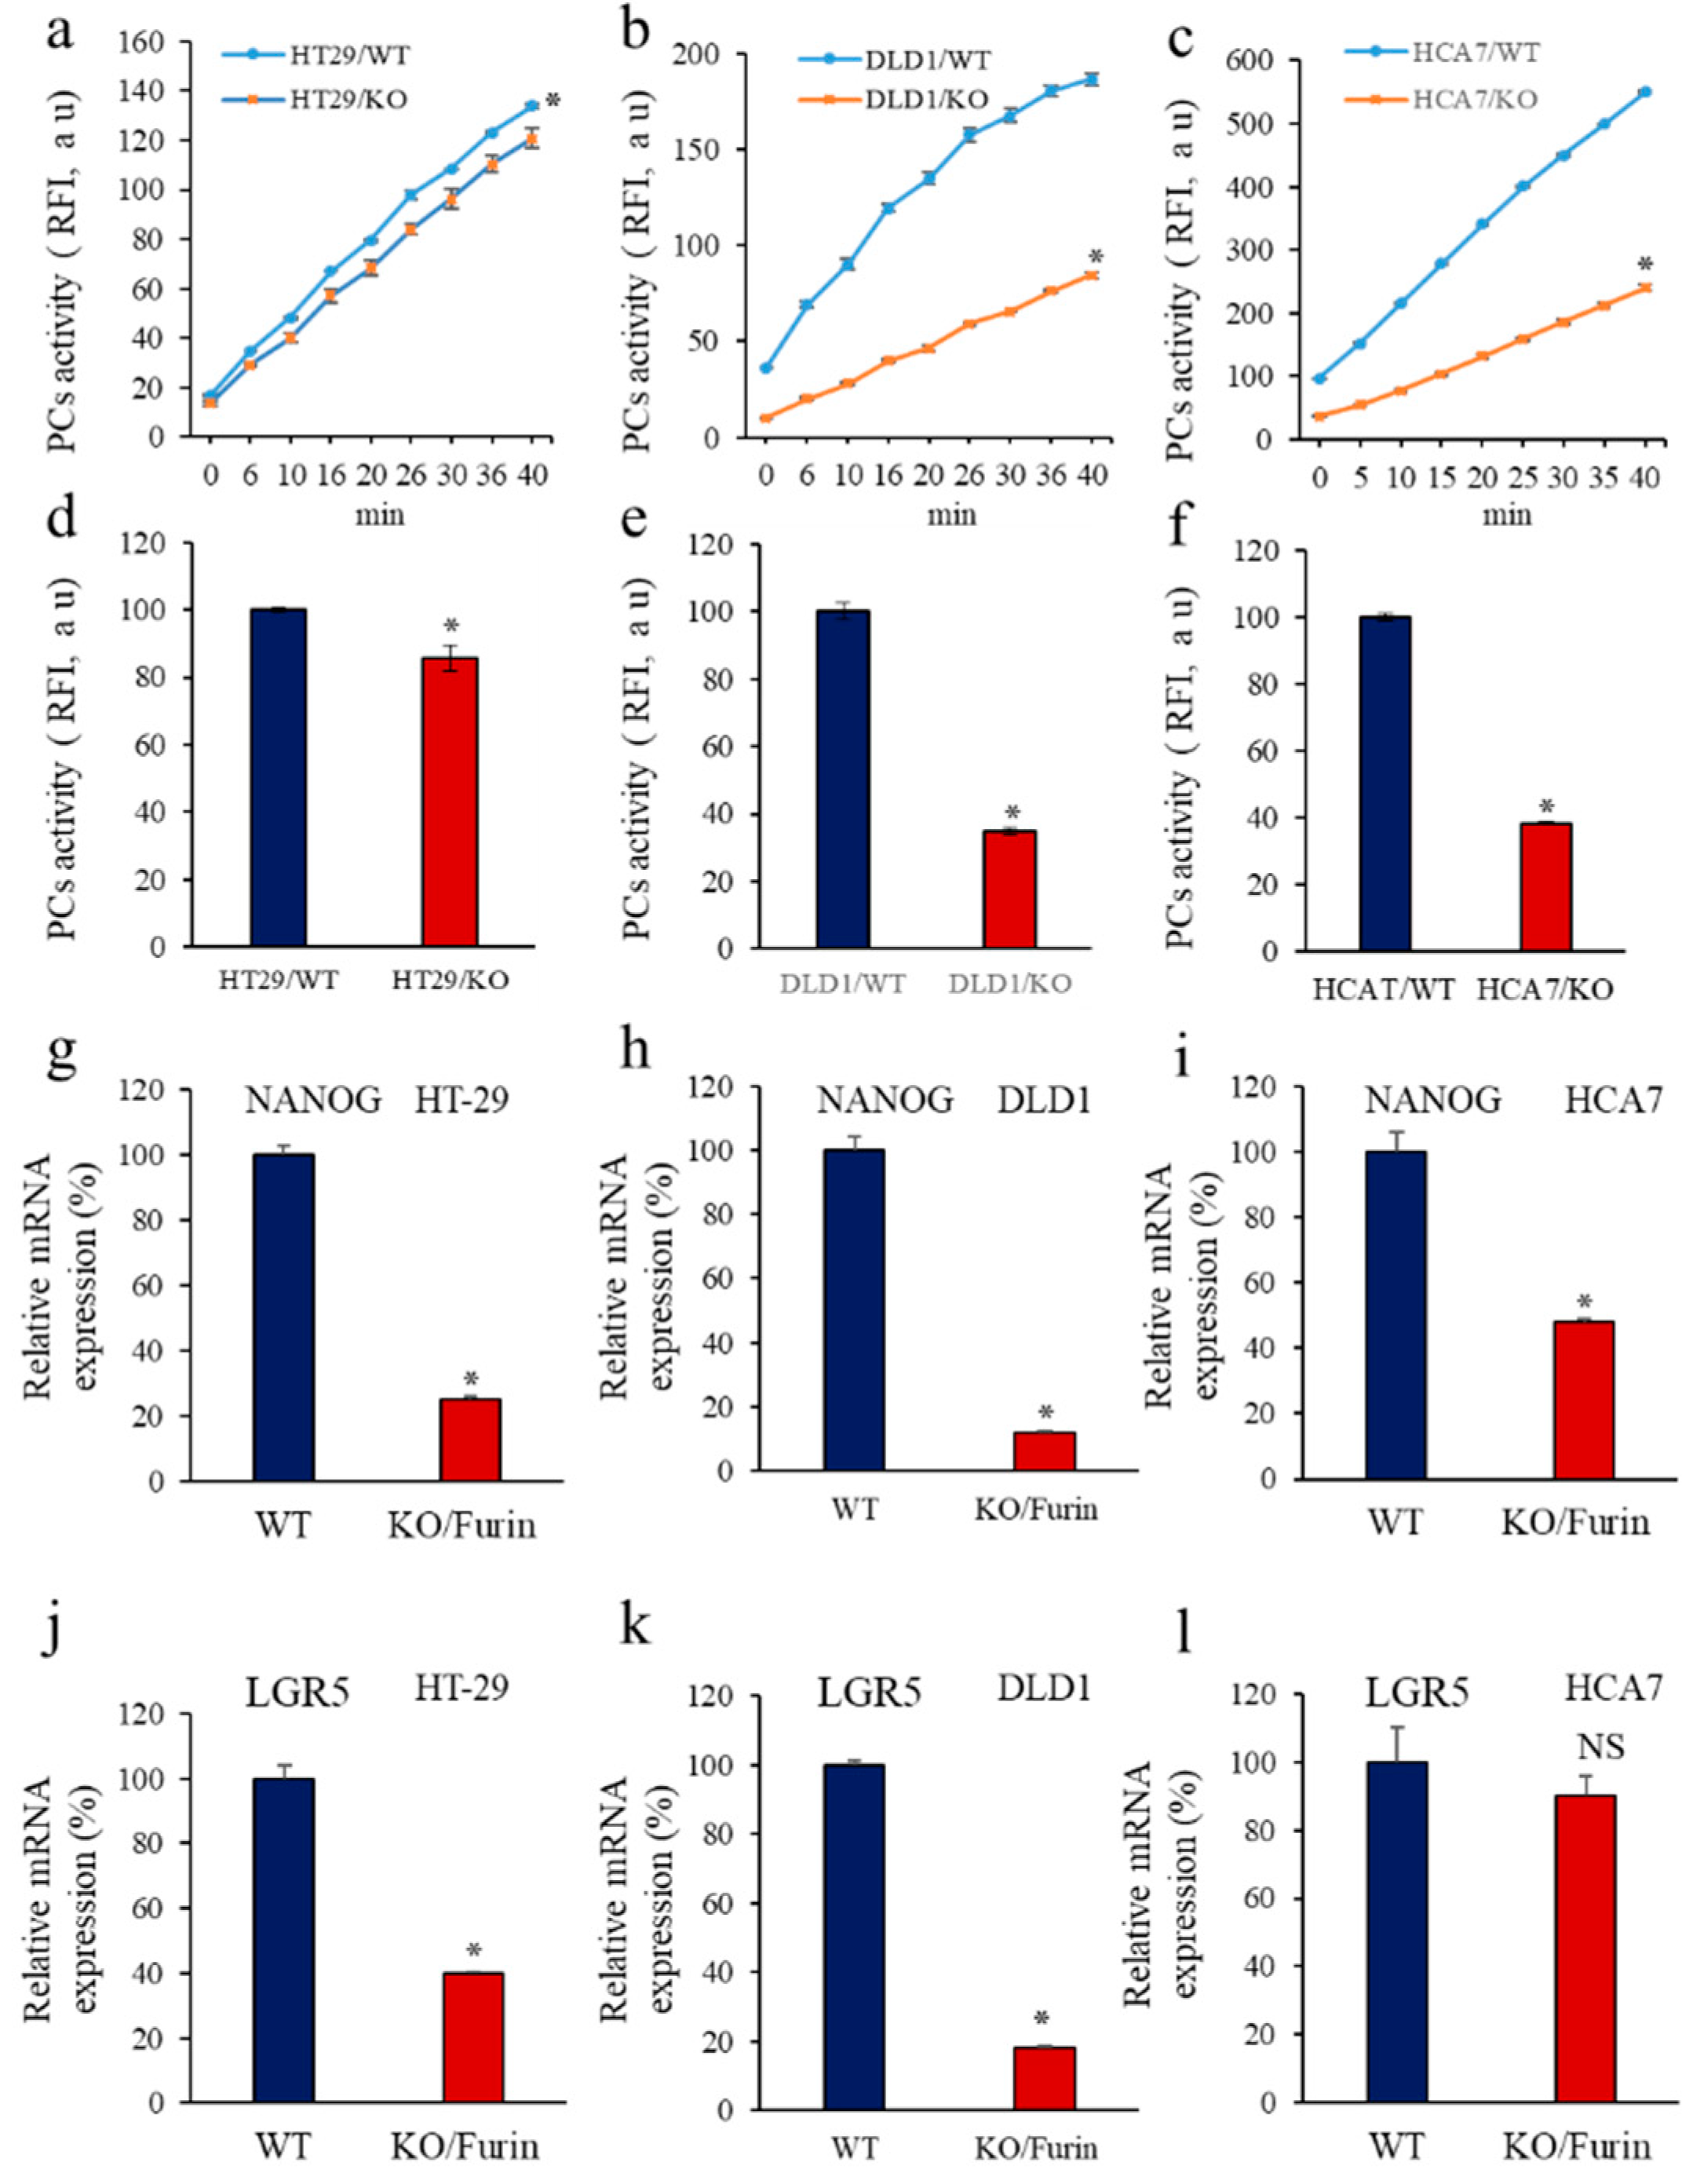
3.6. Furin Silencing Mediates Repression of LGR5 and NANOG in Mice-Induced Tumors with KRAS or BRAF Mutation
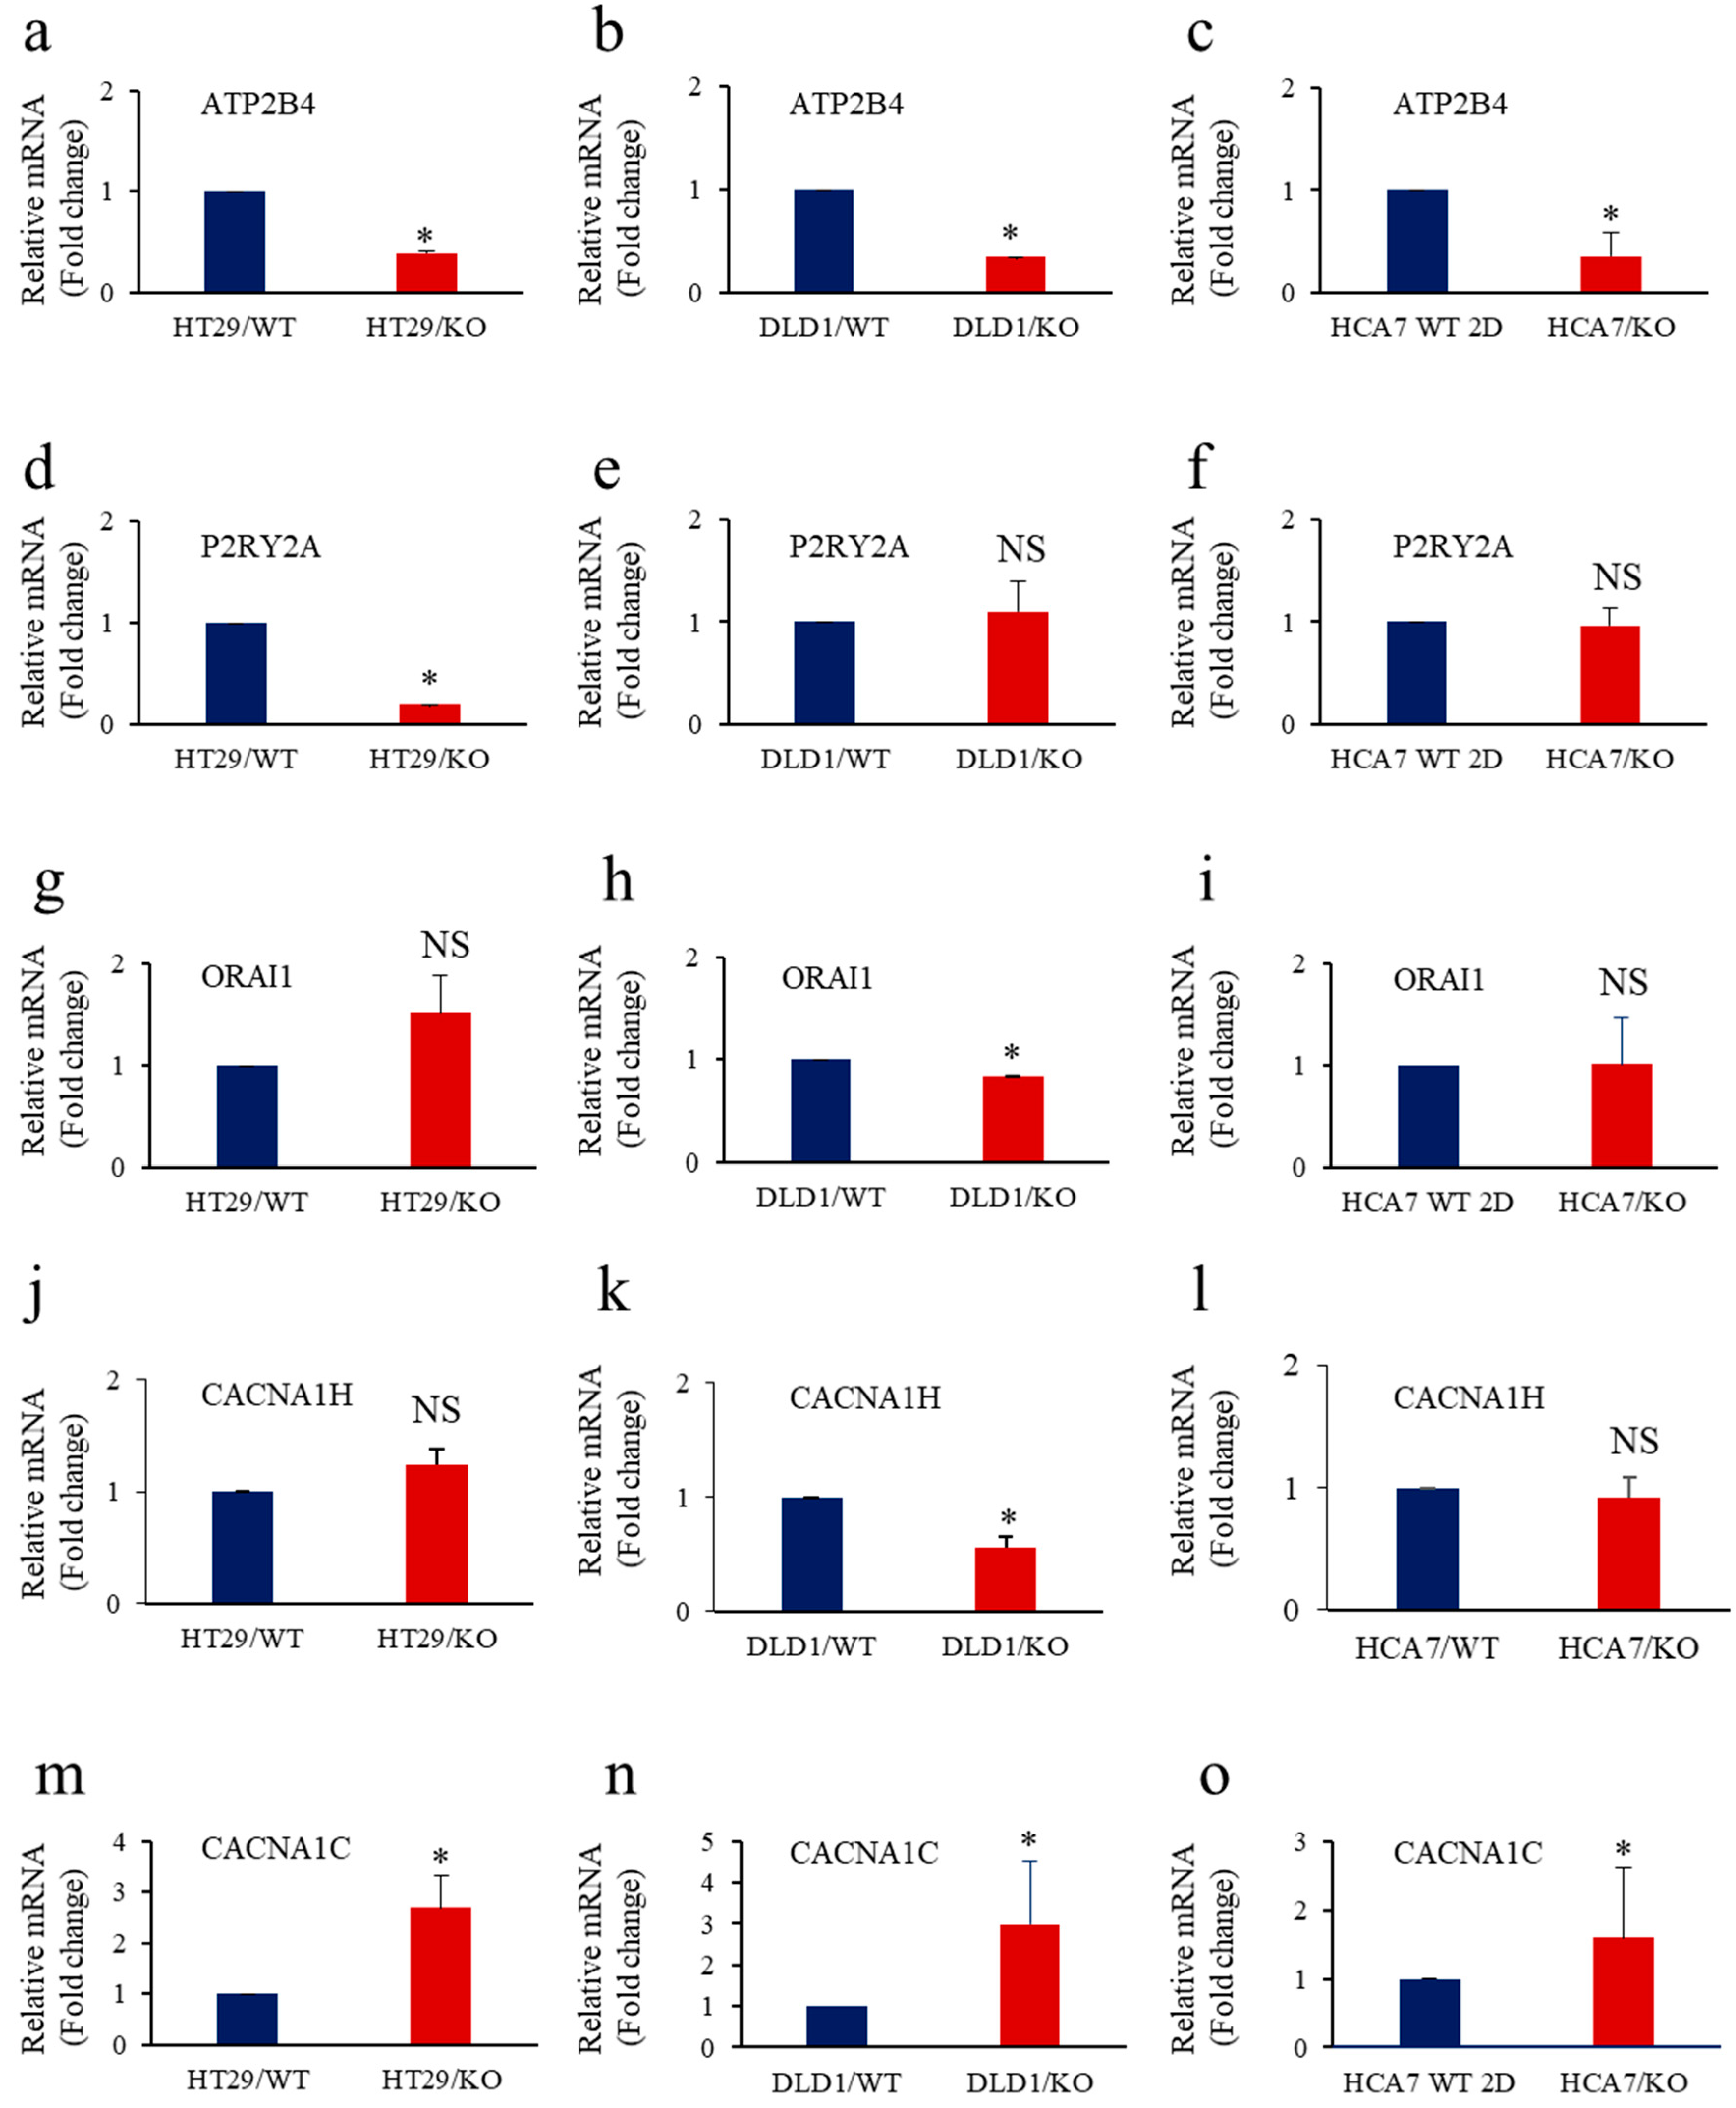
3.7. Calcium Regulators’ Expression in Cancer Cells with Repressed Furin and KRAS or BRAF Mutation
4. Discussion
5. Conclusions
Supplementary Materials
Author Contributions
Funding
Institutional Review Board Statement
Informed Consent Statement
Data Availability Statement
Acknowledgments
Conflicts of Interest
References
- Siegel, R.L.; Miller, K.D.; Jemal, A. Cancer statistics, 2020. CA Cancer J. Clin. 2020, 70, 7–30. [Google Scholar] [CrossRef] [PubMed]
- Phelps, R.A.; Chidester, S.; Dehghanizadeh, S.; Phelps, J.; Sandoval, I.T.; Rai, K.; Broadbent, T.; Sarkar, S.; Burt, R.W.; Jones, D.A. A two-step model for colon adenoma initiation and progression caused by APC loss. Cell 2009, 137, 623–634. [Google Scholar] [CrossRef] [PubMed] [Green Version]
- Fearon, E.R.; Vogelstein, B. A genetic model for colorectal tumorigenesis. Cell 1990, 61, 759–767. [Google Scholar] [CrossRef]
- De Simone, V.; Ronchetti, G.; Franzè, E.; Colantoni, A.; Ortenzi, A.; Fantini, M.C.; Rizzo, A.; Sica, G.S.; Sileri, P.; Rossi, P.; et al. Interleukin-21 sustains inflammatory signals that contribute to sporadic colon tumorigenesis. Oncotarget 2015, 6, 9908–9923. [Google Scholar] [CrossRef] [PubMed]
- Kinzler, K.W.; Vogelstein, B. Lessons from hereditary colorectal cancer. Cell 1996, 87, 159–170. [Google Scholar] [CrossRef] [Green Version]
- Brink, M.; de Goeij, A.F.P.M.; Weijenberg, M.P.; Roemen, G.M.J.M.; Lentjes, M.H.F.M.; Pachen, M.M.M.; Smits, K.M.; de Bruïne, A.P.; Goldbohm, R.A.; van den Brandt, P.A. K-ras oncogene mutations in sporadic colorectal cancer in The Netherlands Cohort Study. Carcinogenesis 2003, 24, 703–710. [Google Scholar] [CrossRef] [PubMed] [Green Version]
- Moon, B.-S.; Jeong, W.-J.; Park, J.; Kim, T.I.; Min, D.S.; Choi, K.-Y. Role of oncogenic K-Ras in cancer stem cell activation by aberrant Wnt/β-catenin signaling. J. Natl. Cancer Inst. 2014, 106, djt373. [Google Scholar] [CrossRef] [Green Version]
- Chaffer, C.L.; Weinberg, R.A. A perspective on cancer cell metastasis. Science 2011, 331, 1559–1564. [Google Scholar] [CrossRef]
- Schepers, A.G.; Snippert, H.J.; Stange, D.E.; van den Born, M.; van Es, J.H.; van de Wetering, M.; Clevers, H. Lineage tracing reveals Lgr5+ stem cell activity in mouse intestinal adenomas. Science 2012, 337, 730–735. [Google Scholar] [CrossRef] [Green Version]
- Baccelli, I.; Trumpp, A. The evolving concept of cancer and metastasis stem cells. J. Cell Biol. 2012, 198, 281–293. [Google Scholar] [CrossRef]
- Zhu, L.; Gibson, P.; Currle, D.S.; Tong, Y.; Richardson, R.J.; Bayazitov, I.T.; Poppleton, H.; Zakharenko, S.; Ellison, D.W.; Gilbertson, R.J. Prominin 1 marks intestinal stem cells that are susceptible to neoplastic transformation. Nature 2009, 457, 603–607. [Google Scholar] [CrossRef] [Green Version]
- Barker, N.; Ridgway, R.A.; van Es, J.H.; van de Wetering, M.; Begthel, H.; van den Born, M.; Danenberg, E.; Clarke, A.R.; Sansom, O.J.; Clevers, H. Crypt stem cells as the cells-of-origin of intestinal cancer. Nature 2009, 457, 608–611. [Google Scholar] [CrossRef] [PubMed]
- Cozzio, A.; Passegué, E.; Ayton, P.M.; Karsunky, H.; Cleary, M.L.; Weissman, I.L. Similar MLL-associated leukemias arising from self-renewing stem cells and short-lived myeloid progenitors. Genes Dev. 2003, 17, 3029–3035. [Google Scholar] [CrossRef] [Green Version]
- Barker, N.; van Es, J.H.; Kuipers, J.; Kujala, P.; van den Born, M.; Cozijnsen, M.; Haegebarth, A.; Korving, J.; Begthel, H.; Peters, P.J.; et al. Identification of stem cells in small intestine and colon by marker gene Lgr5. Nature 2007, 449, 1003–1007. [Google Scholar] [CrossRef] [PubMed]
- Van der Flier, L.G.; Sabates-Bellver, J.; Oving, I.; Haegebarth, A.; De Palo, M.; Anti, M.; Van Gijn, M.E.; Suijkerbuijk, S.; Van de Wetering, M.; Marra, G.; et al. The Intestinal Wnt/TCF Signature. Gastroenterology 2007, 132, 628–632. [Google Scholar] [CrossRef] [PubMed]
- Uchida, H.; Yamazaki, K.; Fukuma, M.; Yamada, T.; Hayashida, T.; Hasegawa, H.; Kitajima, M.; Kitagawa, Y.; Sakamoto, M. Overexpression of leucine-rich repeat-containing G protein-coupled receptor 5 in colorectal cancer. Cancer Sci. 2010, 101, 1731–1737. [Google Scholar] [CrossRef] [PubMed]
- Hsu, H.-C.; Liu, Y.-S.; Tseng, K.-C.; Hsu, C.-L.; Liang, Y.; Yang, T.-S.; Chen, J.-S.; Tang, R.-P.; Chen, S.-J.; Chen, H.-C. Overexpression of Lgr5 correlates with resistance to 5-FU-based chemotherapy in colorectal cancer. Int. J. Colorectal Dis. 2013, 28, 1535–1546. [Google Scholar] [CrossRef] [PubMed]
- Chambers, I.; Colby, D.; Robertson, M.; Nichols, J.; Lee, S.; Tweedie, S.; Smith, A. Functional expression cloning of Nanog, a pluripotency sustaining factor in embryonic stem cells. Cell 2003, 113, 643–655. [Google Scholar] [CrossRef] [Green Version]
- Ibrahim, E.E.; Babaei-Jadidi, R.; Saadeddin, A.; Spencer-Dene, B.; Hossaini, S.; Abuzinadah, M.; Li, N.; Fadhil, W.; Ilyas, M.; Bonnet, D.; et al. Embryonic NANOG activity defines colorectal cancer stem cells and modulates through AP1- and TCF-dependent mechanisms. Stem Cells 2012, 30, 2076–2087. [Google Scholar] [CrossRef]
- Mattoo, A.R.; Zhang, J.; Espinoza, L.A.; Jessup, J.M. Inhibition of NANOG/NANOGP8 downregulates MCL-1 in colorectal cancer cells and enhances the therapeutic efficacy of BH3 mimetics. Clin. Cancer Res. 2014, 20, 5446–5455. [Google Scholar] [CrossRef] [Green Version]
- Wang, H.; Liu, B.; Wang, J.; Li, J.; Gong, Y.; Li, S.; Wang, C.; Cui, B.; Xue, X.; Yang, M.; et al. Reduction of Nanog Mediates the Inhibitory Effect of Aspirin on Tumor Growth and Stemness in Colorectal Cancer. Cell. Physiol. Biochem. 2017, 44, 1051–1063. [Google Scholar] [CrossRef] [PubMed]
- Meng, H.-M.; Zheng, P.; Wang, X.-Y.; Liu, C.; Sui, H.-M.; Wu, S.-J.; Zhou, J.; Ding, Y.-Q.; Li, J. Over-expression of Nanog predicts tumor progression and poor prognosis in colorectal cancer. Cancer Biol. Ther. 2010, 9, 295–302. [Google Scholar] [CrossRef] [PubMed] [Green Version]
- Lin, T.; Ding, Y.-Q.; Li, J.-M. Overexpression of Nanog protein is associated with poor prognosis in gastric adenocarcinoma. Med. Oncol. 2012, 29, 878–885. [Google Scholar] [CrossRef] [PubMed]
- Wee, S.; Niklasson, M.; Marinescu, V.D.; Segerman, A.; Schmidt, L.; Hermansson, A.; Dirks, P.; Forsberg-Nilsson, K.; Westermark, B.; Uhrbom, L.; et al. Selective calcium sensitivity in immature glioma cancer stem cells. PLoS ONE 2014, 9, e115698. [Google Scholar] [CrossRef] [PubMed]
- Patergnani, S.; Danese, A.; Bouhamida, E.; Aguiari, G.; Previati, M.; Pinton, P.; Giorgi, C. Various Aspects of Calcium Signaling in the Regulation of Apoptosis, Autophagy, Cell Proliferation, and Cancer. Int. J. Mol. Sci. 2020, 21, 8323. [Google Scholar] [CrossRef] [PubMed]
- He, Z.; Khatib, A.-M.; Creemers, J.W.M. Loss of the proprotein convertase Furin in T cells represses mammary tumorigenesis in oncogene-driven triple negative breast cancer. Cancer Lett. 2020, 484, 40–49. [Google Scholar] [CrossRef] [PubMed]
- Ma, J.; Evrard, S.; Badiola, I.; Siegfried, G.; Khatib, A.-M. Regulation of the proprotein convertases expression and activity during regenerative angiogenesis: Role of hypoxia-inducible factor (HIF). Eur. J. Cell Biol. 2017, 96, 457–468. [Google Scholar] [CrossRef] [PubMed]
- Siegfried, G.; Descarpentrie, J.; Evrard, S.; Khatib, A.-M. Proprotein convertases: Key players in inflammation-related malignancies and metastasis. Cancer Lett. 2020, 473, 50–61. [Google Scholar] [CrossRef] [PubMed]
- Tomé, M.; Pappalardo, A.; Soulet, F.; López, J.J.; Olaizola, J.; Leger, Y.; Dubreuil, M.; Mouchard, A.; Fessart, D.; Delom, F.; et al. Inactivation of Proprotein Convertases in T Cells Inhibits PD-1 Expression and Creates a Favorable Immune Microenvironment in Colorectal Cancer. Cancer Res. 2019, 79, 5008–5021. [Google Scholar] [CrossRef] [PubMed] [Green Version]
- Sfaxi, F.; Scamuffa, N.; Lalou, C.; Ma, J.; Metrakos, P.; Siegfried, G.; Ragg, H.; Bikfalvi, A.; Calvo, F.; Khatib, A.-M. Repression of liver colorectal metastasis by the serpin Spn4A a naturally occurring inhibitor of the constitutive secretory proprotein convertases. Oncotarget 2014, 5, 4195–4210. [Google Scholar] [CrossRef] [Green Version]
- Gerovska, D.; García-Gallastegi, P.; Descarpentrie, J.; Crende, O.; Casado-Andrés, M.; Martín, A.; Eguia, J.; Khatib, A.-M.; Araúzo-Bravo, M.J.; Badiola, I. Proprotein convertases blockage up-regulates specifically metallothioneins coding genes in human colon cancer stem cells. Biochim. Biophys. Acta (BBA)-Mol. Cell Res. 2021, 1868, 118912. [Google Scholar] [CrossRef] [PubMed]
- López, J.J.; Siegfried, G.; Cantonero, C.; Soulet, F.; Descarpentrie, J.; Smani, T.; Badiola, I.; Pernot, S.; Evrard, S.; Rosado, J.A.; et al. Furin Prodomain ppFurin Enhances Ca2+ Entry Through Orai and TRPC6 Channels’ Activation in Breast Cancer Cells. Cancers 2021, 13, 1670. [Google Scholar] [CrossRef] [PubMed]
- Scamuffa, N.; Siegfried, G.; Bontemps, Y.; Ma, L.; Basak, A.; Cherel, G.; Calvo, F.; Seidah, N.G.; Khatib, A.-M. Selective inhibition of proprotein convertases represses the metastatic potential of human colorectal tumor cells. J. Clin. Investig. 2008, 118, 352–363. [Google Scholar] [CrossRef] [PubMed] [Green Version]
- He, Z.; Thorrez, L.; Siegfried, G.; Meulemans, S.; Evrard, S.; Tejpar, S.; Khatib, A.-M.; Creemers, J.W.M. The proprotein convertase furin is a pro-oncogenic driver in KRAS and BRAF driven colorectal cancer. Oncogene 2020, 39, 3571–3587. [Google Scholar] [CrossRef] [PubMed]
- Guyon, J.; Andrique, L.; Pujol, N.; Røsland, G.V.; Recher, G.; Bikfalvi, A.; Daubon, T. A 3D Spheroid Model for Glioblastoma. J. Vis. Exp. 2020, 158, e60998. [Google Scholar] [CrossRef] [PubMed]
- Lalou, C.; Scamuffa, N.; Mourah, S.; Plassa, F.; Podgorniak, M.-P.; Soufir, N.; Dumaz, N.; Calvo, F.; Basset-Seguin, N.; Khatib, A.-M. Inhibition of the proprotein convertases represses the invasiveness of human primary melanoma cells with altered p53, CDKN2A and N-Ras genes. PLoS ONE 2010, 5, e9992. [Google Scholar] [CrossRef] [PubMed] [Green Version]
- Villoutreix, B.O.; Khatib, A.-M.; Cheng, Y.; Miteva, M.A.; Maréchal, X.; Vidal, J.; Reboud-Ravaux, M. Blockade of the malignant phenotype by β-subunit selective noncovalent inhibition of immuno- and constitutive proteasomes. Oncotarget 2017, 8, 10437–10449. [Google Scholar] [CrossRef] [Green Version]
- Aspinall, S.L.; Good, C.B.; Zhao, X.; Cunningham, F.E.; Heron, B.B.; Geraci, M.; Passero, V.; Stone, R.A.; Smith, K.J.; Rogers, R.; et al. Adjuvant chemotherapy for stage III colon cancer: Relative dose intensity and survival among veterans. BMC Cancer 2015, 15, 62. [Google Scholar] [CrossRef] [Green Version]
- Morgan, R.G.; Mortensson, E.; Williams, A.C. Targeting LGR5 in Colorectal Cancer: Therapeutic gold or too plastic? Br. J. Cancer 2018, 118, 1410–1418. [Google Scholar] [CrossRef] [PubMed]
- Tajada, S.; Villalobos, C. Calcium Permeable Channels in Cancer Hallmarks. Front. Pharmacol. 2020, 11, 968. [Google Scholar] [CrossRef]
- Adam, F.; Khatib, A.-M.; Lopez, J.J.; Vatier, C.; Turpin, S.; Muscat, A.; Soulet, F.; Aries, A.; Jardin, I.; Bobe, R.; et al. Apelin: An antithrombotic factor that inhibits platelet function. Blood 2016, 127, 908–920. [Google Scholar] [CrossRef] [Green Version]
- Soulet, F.; Bodineau, C.; Hooks, K.B.; Descarpentrie, J.; Alves, I.; Dubreuil, M.; Mouchard, A.; Eugenie, M.; Hoepffner, J.-L.; López, J.J.; et al. ELA/APELA precursor cleaved by furin displays tumor suppressor function in renal cell carcinoma through mTORC1 activation. JCI Insight 2020, 5, e129070. [Google Scholar] [CrossRef] [PubMed]
- Ribiczey, P.; Tordai, A.; Andrikovics, H.; Filoteo, A.G.; Penniston, J.T.; Enouf, J.; Enyedi, A.; Papp, B.; Kovács, T. Isoform-specific up-regulation of plasma membrane Ca2+ATPase expression during colon and gastric cancer cell differentiation. Cell Calcium 2007, 42, 590–605. [Google Scholar] [CrossRef] [Green Version]
- Künzli, B.M.; Berberat, P.O.; Giese, T.; Csizmadia, E.; Kaczmarek, E.; Baker, C.; Halaceli, I.; Büchler, M.W.; Friess, H.; Robson, S.C. Upregulation of CD39/NTPDases and P2 receptors in human pancreatic disease. Am. J. Physiol. -Gastrointest. Liver Physiol. 2007, 292, G223–G230. [Google Scholar] [CrossRef] [PubMed] [Green Version]
- Gui, L.; Wang, Z.; Han, J.; Ma, H.; Li, Z. High Expression of Orai1 Enhances Cell Proliferation and is Associated with Poor Prognosis in Human Colorectal Cancer. Clin. Lab. 2016, 62, 1689–1698. [Google Scholar] [CrossRef]
- Voltage-Gated Calcium Channels: Novel Targets for Cancer therapy—PubMed. Available online: https://pubmed-ncbi-nlm-nih-gov.proxy.insermbiblio.inist.fr/28781648/ (accessed on 30 January 2022).
- Xie, Y.-H.; Chen, Y.-X.; Fang, J.-Y. Comprehensive review of targeted therapy for colorectal cancer. Signal Transduct. Target. Ther. 2020, 5, 22. [Google Scholar] [CrossRef] [PubMed]
- Ibarrola-Villava, M.; Cervantes, A.; Bardelli, A. Preclinical models for precision oncology. Biochim. Biophys. Acta Rev. Cancer 2018, 1870, 239–246. [Google Scholar] [CrossRef]
- Eun, K.; Ham, S.W.; Kim, H. Cancer stem cell heterogeneity: Origin and new perspectives on CSC targeting. BMB Rep. 2017, 50, 117–125. [Google Scholar] [CrossRef] [PubMed]
- The Origin of Cancer Stem Cells—PubMed. Available online: https://pubmed-ncbi-nlm-nih-gov.proxy.insermbiblio.inist.fr/22202093/ (accessed on 30 January 2022).
- Moore, K.A.; Lemischka, I.R. Stem cells and their niches. Science 2006, 311, 1880–1885. [Google Scholar] [CrossRef] [Green Version]
- Hollier, B.G.; Evans, K.; Mani, S.A. The epithelial-to-mesenchymal transition and cancer stem cells: A coalition against cancer therapies. J. Mammary Gland. Biol. Neoplasia 2009, 14, 29–43. [Google Scholar] [CrossRef] [PubMed]
- Liu, X.; Yan, K.; Lin, X.; Zhao, L.; An, W.; Wang, C.; Liu, X. The Association between BRAF (V600E) Mutation and Pathological Features in PTC. Eur. Arch. Otorhinolaryngol. 2014, 271, 3041–3052. [Google Scholar] [CrossRef]
- Herr, R.; Köhler, M.; Andrlová, H.; Weinberg, F.; Möller, Y.; Halbach, S.; Lutz, L.; Mastroianni, J.; Klose, M.; Bittermann, N.; et al. B-Raf inhibitors induce epithelial differentiation in BRAF-mutant colorectal cancer cells. Cancer Res. 2015, 75, 216–229. [Google Scholar] [CrossRef] [PubMed] [Green Version]
- Yang, L.; Shi, P.; Zhao, G.; Xu, J.; Peng, W.; Zhang, J.; Zhang, G.; Wang, X.; Dong, Z.; Chen, F.; et al. Targeting cancer stem cell pathways for cancer therapy. Signal Transduct. Target. Ther. 2020, 5, 8. [Google Scholar] [CrossRef] [Green Version]
- Li, G.-R.; Deng, X.-L. Functional ion channels in stem cells. World J. Stem Cells 2011, 3, 19–24. [Google Scholar] [CrossRef] [Green Version]
- Pillozzi, S.; Becchetti, A. Ion channels in hematopoietic and mesenchymal stem cells. Stem Cells Int. 2012, 2012, 217910. [Google Scholar] [CrossRef]
- Forostyak, O.; Forostyak, S.; Kortus, S.; Sykova, E.; Verkhratsky, A.; Dayanithi, G. Physiology of Ca(2+) signalling in stem cells of different origins and differentiation stages. Cell Calcium 2016, 59, 57–66. [Google Scholar] [CrossRef]
- The P2Y2 Nucleotide Receptor Mediates the Proliferation and Migration of Human Hepatocellular Carcinoma Cells Induced by ATP—PubMed. Available online: https://pubmed-ncbi-nlm-nih-gov.proxy.insermbiblio.inist.fr/24847054/ (accessed on 30 January 2022).
- Curry, M.C.; Luk, N.A.; Kenny, P.A.; Roberts-Thomson, S.J.; Monteith, G.R. Distinct regulation of cytoplasmic calcium signals and cell death pathways by different plasma membrane calcium ATPase isoforms in MDA-MB-231 breast cancer cells. J. Biol. Chem. 2012, 287, 28598–28608. [Google Scholar] [CrossRef] [PubMed] [Green Version]
- Plasma Membrane Calcium ATPase 4 and the Remodeling of Calcium Homeostasis in Human colon Cancer Cells—PubMed. Available online: https://pubmed-ncbi-nlm-nih-gov.proxy.insermbiblio.inist.fr/19755660/ (accessed on 30 January 2022).
- Robles-Martínez, L.; Garay, E.; Martel-Gallegos, M.G.; Cisneros-Mejorado, A.; Pérez-Montiel, D.; Lara, A.; Arellano, R.O. Kca3.1 Activation Via P2y2 Purinergic Receptors Promotes Human Ovarian Cancer Cell (Skov-3) Migration. Sci. Rep. 2017, 7, 4340. [Google Scholar] [CrossRef] [Green Version]
- Pylayeva-Gupta, Y.; Grabocka, E.; Bar-Sagi, D. RAS oncogenes: Weaving a tumorigenic web. Nat. Rev. Cancer 2011, 11, 761–774. [Google Scholar] [CrossRef] [PubMed] [Green Version]
- Fritsche-Guenther, R.; Witzel, F.; Sieber, A.; Herr, R.; Schmidt, N.; Braun, S.; Brummer, T.; Sers, C.; Blüthgen, N. Strong negative feedback from Erk to Raf confers robustness to MAPK signalling. Mol. Syst. Biol. 2011, 7, 489. [Google Scholar] [CrossRef]
- Fearon, E.R. Molecular genetics of colorectal cancer. Annu. Rev. Pathol. 2011, 6, 479–507. [Google Scholar] [CrossRef] [PubMed]


Publisher’s Note: MDPI stays neutral with regard to jurisdictional claims in published maps and institutional affiliations. |
© 2022 by the authors. Licensee MDPI, Basel, Switzerland. This article is an open access article distributed under the terms and conditions of the Creative Commons Attribution (CC BY) license (https://creativecommons.org/licenses/by/4.0/).
Share and Cite
Descarpentrie, J.; Araúzo-Bravo, M.J.; He, Z.; François, A.; González, Á.; Garcia-Gallastegi, P.; Badiola, I.; Evrard, S.; Pernot, S.; Creemers, J.W.M.; et al. Role of Furin in Colon Cancer Stem Cells Malignant Phenotype and Expression of LGR5 and NANOG in KRAS and BRAF-Mutated Colon Tumors. Cancers 2022, 14, 1195. https://doi.org/10.3390/cancers14051195
Descarpentrie J, Araúzo-Bravo MJ, He Z, François A, González Á, Garcia-Gallastegi P, Badiola I, Evrard S, Pernot S, Creemers JWM, et al. Role of Furin in Colon Cancer Stem Cells Malignant Phenotype and Expression of LGR5 and NANOG in KRAS and BRAF-Mutated Colon Tumors. Cancers. 2022; 14(5):1195. https://doi.org/10.3390/cancers14051195
Chicago/Turabian StyleDescarpentrie, Jean, Marcos J. Araúzo-Bravo, Zongsheng He, Alexia François, Álvaro González, Patricia Garcia-Gallastegi, Iker Badiola, Serge Evrard, Simon Pernot, John W. M. Creemers, and et al. 2022. "Role of Furin in Colon Cancer Stem Cells Malignant Phenotype and Expression of LGR5 and NANOG in KRAS and BRAF-Mutated Colon Tumors" Cancers 14, no. 5: 1195. https://doi.org/10.3390/cancers14051195