
Quantitative Diffusion-Weighted Imaging Analyses to Predict Response to Neoadjuvant Immunotherapy in Patients with Locally Advanced Head and Neck Carcinoma
 ,
,
Abstract
:Simple Summary
Abstract
1. Introduction
2. Materials and Methods
2.1. Patient Population and Trail Treatment Details
2.2. Mr Imaging Acquisition
2.3. Postprocessing and Feature Extraction
2.4. Outcome Assessment
2.5. Statistical Analysis
3. Results
4. Discussion
5. Conclusions
Author Contributions
Funding
Institutional Review Board Statement
Informed Consent Statement
Data Availability Statement
Conflicts of Interest
Appendix A

| Image Parameters per Scanner (N = 44) | |||
|---|---|---|---|
| Scanner Name | Achieva | Achieva dStream | Ingenia |
| Field strength | 1.5 T | 3 T | 3 T |
| Scanner coils | Flex coils or Head and neck coil | Flex coils or Head and neck coil | Flex coil and Posterior coil |
| Acquired DWI | |||
| b-values | 0, 100, 300, 500, 800 Or 0, 200, 1000 | 0, 200, 1000 | 0, 200, 1000 |
| FOV (mm) | 230–250 × 225–250 | 230 × 230 | 230 × 230 |
| Voxel size (mm) | 0.90–0.98 × 0.90–0.98 × 3.0–4.0 | 0.90 × 0.90 × 4.0 | 0.90 × 0.90 × 4.0 |
| TR (ms) | 4309–5697 | 3588–3682 | 4777 |
| TE (ms) | 79.6–80.8 | 66.9–68.7 | 75.3 |
| Echo train length | 35–41 | 35 | 35 |
| n = 31 | n = 12 | n = 1 | |
Appendix B
| Stability of the Features over the Varying MR Scanners | |
|---|---|
| First order Parameter | p-Value |
| Mean ADC (10−3 mm2/s) | 0.045 * |
| Median ADC (10−3 mm2/s) | 0.035 * |
| Range | 0.047 * |
| Interquartile range | 0.026 * |
| Min ADC (10−3 mm2/s) | 0.457 |
| Max ADC (10−3 mm2/s) | 0.039 * |
| 10th Percentile | 0.459 |
| 90th Percentile | 0.005 * |
| Mean absolute deviation | 0.018 * |
| Robust mean absolute deviation | 0.027 * |
| Root mean sqared | 0.030 * |
| Energy (× 108) | 0.934 |
| Total Energy (× 108) | 0.934 |
| Entropy | 0.134 |
| Skewness | 0.613 |
| Kurtosis | 0.664 |
| Uniformity | 0.140 |
| Variance | 0.008 * |
| Shape Parameter | |
| Volume (cm3) | 0.957 |
| Voxel volume (cm3) | 0.959 |
| Surface Area (cm2) | 0.994 |
| Surface Area/Volume ratio | 0.699 |
| Sphericity | 0.680 |
| 3D diameter (cm) | 0.507 |
| 2D diameter(Slice) (cm) | 0.803 |
| 2D diameter(Column) (cm) | 0.993 |
| 2D diameter(Row) (cm) | 0.716 |
| Major Axis Length (cm) | 0.744 |
| Minor Axis Length (cm) | 0.929 |
| Least Axis Length (cm) | 0.948 |
| Elongation | 0.709 |
| Flatness | 0.823 |
Appendix C

| Original_shape_Elongation | 0.004676323 |
| Original_shape_Flatness | −0.002742821 |
| Original_shape_leastaxislength | −0.007783686 |
| Original_shape_majoraxislength | 0.005426275 |
| Original_shape_Maximum2DDiameterColumn | −0.019181670 |
| Original_shape_Maximum2DDiameterRow | −0.003339790 |
| Original_shape_Maximum2DDiameterSlice | 0.004553167 |
| Original_shape_Maximum3DDiameter | 0.007477649 |
| Original_shape_meshvolume | −0.028966045 |
| Original_shape_minoraxislength | 0.003421239 |
| Original_shape_Sphericity | −0.028505174 |
| Original_shape_surfacearea | −0.019315614 |
| Original_shape_surfacevolumeratio | 0.015172713 |
| Original_shape_voxelvolume | −0.028593257 |
| Original_firstorder_10Percentile | 0.024333887 |
| Original_firstorder_Energy | −0.024443317 |
| Original_firstorder_Entropy | 0.029719833 |
| Original_firstorder_Kurtosis | −0.050362785 |
| Original_firstorder_Minimum | 0.016563633 |
| Original_firstorder_Skewness | −0.053308390 |
| Original_firstorder_totalenergy | −0.024438481 |
| Original_firstorder_Uniformity | −0.039594121 |
References
- Rozeman, E.A.; Hoefsmit, E.P.; Reijers, I.L.M.; Saw, R.P.M.; Versluis, J.M.; Krijgsman, O.; Dimitriadis, P.; Sikorska, K.; van de Wiel, B.A.; Eriksson, H.; et al. Survival and biomarker analyses from the OpACIN-neo and OpACIN neoadjuvant immunotherapy trials in stage III melanoma. Nat. Med. 2021, 27, 256–263. [Google Scholar] [CrossRef] [PubMed]
- Huang, J.; Zhang, J.; Shi, C.; Liu, L.; Wei, Y. Survival, recurrence and toxicity of HNSCC in comparison of a radiotherapy combination with cisplatin versus cetuximab: A meta-analysis. BMC Cancer 2016, 16, 689. [Google Scholar] [CrossRef] [PubMed] [Green Version]
- Du, E.; Mazul, A.L.; Farquhar, D.; Brennan, P.; Anantharaman, D.; Abedi-Ardekani, B.; Weissler, M.C.; Hayes, D.N.; Olshan, A.F.; Zevallos, J.P. Long-term Survival in Head and Neck Cancer: Impact of Site, Stage, Smoking, and Human Papillomavirus Status. Laryngoscope 2019, 129, 2506–2513. [Google Scholar] [CrossRef] [PubMed]
- Bernier, J.; Domenge, C.; Ozsahin, M.; Matuszewska, K.; Lefèbvre, J.-L.; Greiner, R.H.; Giralt, J.; Maingon, P.; Rolland, F.; Bolla, M.; et al. European Organization for Research and Treatment of Cancer Trial 22931. Postoperative Irradiation with or without Concomitant Chemotherapy for Locally Advanced Head and Neck Cancer. N. Engl. J. Med. 2004, 350, 1945–1952. [Google Scholar] [CrossRef] [Green Version]
- Seiwert, T.Y. ASCO Expanding the Reach of Anti–PD-1 Therapy. Cancer Discov. 2015, 5, 684–685. [Google Scholar] [CrossRef] [Green Version]
- Ferris, R.L.; Blumenschein, G., Jr.; Fayette, J.; Guigay, J.; Colevas, A.D.; Licitra, L.; Harrington, K.J.; Kasper, S.; Vokes, E.E.; Even, C.; et al. Nivolumab vs investigator’s choice in recurrent or metastatic squamous cell carcinoma of the head and neck: 2-year long-term survival update of CheckMate 141 with analyses by tumor PD-L1 expression. Oral Oncol. 2018, 81, 45–51. [Google Scholar] [CrossRef]
- Schoenfeld, J.D.; Hanna, G.J.; Jo, V.Y.; Rawal, B.; Chen, Y.-H.; Catalano, P.S.; Lako, A.; Ciantra, Z.; Weirather, J.L.; Criscitiello, S.; et al. Neoadjuvant Nivolumab or Nivolumab Plus Ipilimumab in Untreated Oral Cavity Squamous Cell Carcinoma. A Phase 2 Open-Label Randomized Clinical Trial. JAMA Oncol. 2020, 6, 1563–1570. [Google Scholar] [CrossRef]
- Vos, J.L.; Elbers, J.B.W.; Krijgsman, O.; Traets, J.J.H.; Qiao, X.; van der Leun, A.M.; Lubeck, Y.; Seignette, I.M.; Smit, L.A.; Willems, S.M.; et al. Neoadjuvant immunotherapy with nivolumab and ipilimumab induces major pathological responses in patients with head and neck squamous cell carcinoma. Nat. Commun. 2021, 12, 7348. [Google Scholar] [CrossRef]
- Eisenhauer, E.A.; Therasse, P.; Bogaerts, J.; Schwartz, L.H.; Sargent, D.; Ford, R.; Dancey, J.; Arbuck, S.; Gwyther, S.; Mooney, M.; et al. New response evaluation criteria in solid tumours: Revised RECIST guideline (version 1.1). Eur. J. Cancer 2009, 45, 228–247. [Google Scholar] [CrossRef]
- Cohen, E.E.W.; Bell, R.B.; Bifulco, C.B.; Burtness, B.; Gillison, M.L.; Harrington, K.J.; Le, Q.-T.; Lee, N.Y.; Leidner, R.; Lewis, R.L.; et al. The Society for Immunotherapy of Cancer consensus statement on immunotherapy for the treatment of squamous cell carcinoma of the head and neck (HNSCC). J. Immunother. Cancer 2019, 7, 184. [Google Scholar] [CrossRef]
- Haddad, R.; Concha-Benavente, F.; Blumenschein, G., Jr.; Fayette, J.; Guigay, J.; Colevas, A.D.; Licitra, L.; Kasper, S.; Vokes, E.E.; Worden, F.; et al. Nivolumab treatment beyond RECIST-defined progression in recurrent or metastatic squamous cell carcinoma of the head and neck in CheckMate 141: A subgroup analysis of a randomized phase 3 clinical trial. Cancer 2019, 125, 3208–3218. [Google Scholar] [CrossRef] [PubMed] [Green Version]
- Vos, J.L.; Zuur, C.L.; Smit, L.A.; de Boer, J.P.; Al-Mamgani, A.; van den Brekel, M.W.M.; Haanen, J.B.A.G.; Vogel, W.V. [18F]FDG-PET accurately identifies pathological response early upon neoadjuvant immune checkpoint blockade in head and neck squamous cell carcinoma. Eur. J. Nucl. Med. Mol. Imaging. 2021, 49, 2010–2022. [Google Scholar] [CrossRef] [PubMed]
- Driessen, J.P.; Van Kempen, P.M.W.; Van Der Heijden, G.J.; Philippens, M.E.P.; Pameijer, F.A.; Stegeman, I.; Terhaard, C.H.J.; Janssen, L.M.; Grolman, W. Diffusion-weighted imaging in head and neck squamous cell carcinomas: A systematic review. Head Neck 2013, 37, 440–448. [Google Scholar] [CrossRef]
- Payabvash, S. Quantitative diffusion magnetic resonance imaging in head and neck tumors. Quant. Imaging Med. Surg. 2018, 8, 1052–1065. [Google Scholar] [CrossRef] [PubMed]
- Meyer, H.J.; Leifels, L.; Hamerla, G.; Höhn, A.K.; Surov, A. ADC-histogram analysis in head and neck squamous cell carcinoma. Associations with different histopathological features including expression of EGFR, VEGF, HIF-1α, Her 2 and p53. A preliminary study. Magn. Reson. Imaging 2018, 54, 214–217. [Google Scholar] [CrossRef]
- Swartz, J.E.; Driessen, J.P.; van Kempen, P.M.; de Bree, R.; Janssen, L.M.; Pameijer, F.A.; Terhaard, C.H.; Philippens, M.E.; Willems, S. Influence of tumor and microenvironment characteristics on diffusion-weighted imaging in oropharyngeal carcinoma: A pilot study. Oral Oncol. 2018, 77, 9–15. [Google Scholar] [CrossRef]
- Surov, A.; Meyer, H.J.; Wienke, A. Correlation between apparent diffusion coefficient (ADC) and cellularity is different in several tumors: A meta-analysis. Oncotarget 2017, 8, 59492–59499. [Google Scholar] [CrossRef] [Green Version]
- Bos, P.; van der Hulst, H.J.; Brekel, M.W.V.D.; Schats, W.; Jasperse, B.; Beets-Tan, R.G.; Castelijns, J.A. Prognostic functional MR imaging parameters in head and neck squamous cell carcinoma: A systematic review. Eur. J. Radiol. 2021, 144, 109952. [Google Scholar] [CrossRef]
- Martens, R.M.; Koopman, T.; Lavini, C.; Ali, M.; Peeters, C.F.W.; Noij, D.P.; Zwezerijnen, G.; Marcus, J.T.; Vergeer, M.R.; Leemans, C.R.; et al. Multiparametric functional MRI and 18F-FDG-PET for survival prediction in patients with head and neck squamous cell carcinoma treated with (chemo)radiation. Eur. Radiol. 2021, 31, 616–628. [Google Scholar] [CrossRef]
- Fedorov, A.; Beichel, R.; Kalpathy-Cramer, J.; Finet, J.; Fillion-Robin, J.-C.; Pujol, S.; Bauer, C.; Jennings, D.; Fennessy, F.M.; Sonka, M.; et al. 3D Slicer as an Image Computing Platform for the Quantitative Imaging Network. Magn. Reson. Imaging 2012, 30, 1323–1341. [Google Scholar] [CrossRef]
- van Griethuysen, J.J.M.; Fedorov, A.; Parmar, C.; Hosny, A.; Aucoin, N.; Narayan, V.; Beets-Tan, R.G.H.; Fillion-Robin, J.-C.; Pieper, S.; Aerts, H.J.W.L. Computational Radiomics System to Decode the Radiographic Phenotype. Cancer Res. 2017, 77, e104–e107. [Google Scholar] [CrossRef] [PubMed] [Green Version]
- Cottrell, T.; Thompson, E.; Forde, P.; Stein, J.; Duffield, A.; Anagnostou, V.; Rekhtman, N.; Anders, R.; Cuda, J.; Illei, P.; et al. Pathologic features of response to neoadjuvant anti-PD-1 in resected non-small-cell lung carcinoma: A proposal for quantitative immune-related pathologic response criteria (irPRC). Ann. Oncol. 2018, 29, 1853–1860. [Google Scholar] [CrossRef]
- Tetzlaff, M.; Messina, J.; Stein, J.; Xu, X.; Amaria, R.; Blank, C.; van de Wiel, B.; Ferguson, P.; Rawson, R.; Ross, M.; et al. Pathological assessment of resection specimens after neoadjuvant therapy for metastatic melanoma. Ann. Oncol. 2018, 29, 1861–1868. [Google Scholar] [CrossRef] [PubMed]
- Fujima, N.; Hirata, K.; Shiga, T.; Li, R.; Yasuda, K.; Onimaru, R.; Tsuchiya, K.; Kano, S.; Mizumachi, T.; Homma, A.; et al. Integrating quantitative morphological and intratumoural textural characteristics in FDG-PET for the prediction of prognosis in pharynx squamous cell carcinoma patients. Clin. Radiol. 2018, 73, 1059.e1–1059.e8. [Google Scholar] [CrossRef] [PubMed] [Green Version]
- Fujima, N.; Shimizu, Y.; Yoshida, D.; Kano, S.; Mizumachi, T.; Homma, A.; Yasuda, K.; Onimaru, R.; Sakai, O.; Kudo, K.; et al. Multiparametric Analysis of Tumor Morphological and Functional MR Parameters Potentially Predicts Local Failure in Pharynx Squamous Cell Carcinoma Patients. J. Med. Investig. 2021, 68, 354–361. [Google Scholar] [CrossRef] [PubMed]
- Apostolova, I.; Steffen, I.G.; Wedel, F.; Lougovski, A.; Marnitz, S.; Derlin, T.; Amthauer, H.; Buchert, R.; Hofheinz, F.; Brenner, W. Asphericity of pretherapeutic tumour FDG uptake provides independent prognostic value in head-and-neck cancer. Eur. Radiol. 2014, 24, 2077–2087. [Google Scholar] [CrossRef] [PubMed]
- Bos, P.; Brekel, M.W.M.; Gouw, Z.A.R.; Al-Mamgani, A.; Waktola, S.; Aerts, H.J.W.L.; Beets-Tan, R.G.H.; Castelijns, J.A.; Jasperse, B. Clinical variables and magnetic resonance imaging-based radiomics predict human papillomavirus status of oropharyngeal cancer. Head Neck 2021, 43, 485–495. [Google Scholar] [CrossRef]
- Cantrell, S.C.; Peck, B.W.; Li, G.; Wei, Q.; Sturgis, E.M.; Ginsberg, L.E. Differences in Imaging Characteristics of HPV-Positive and HPV-Negative Oropharyngeal Cancers: A Blinded Matched-Pair Analysis. AJNR Am. J. Neuroradiol. 2013, 34, 2005–2009. [Google Scholar] [CrossRef] [PubMed]
- Heukelom, J.; Hamming, O.; Bartelink, H.; Hoebers, F.; Giralt, J.; Herlestam, T.; Verheij, M.; Brekel, M.V.D.; Vogel, W.; Slevin, N.; et al. Adaptive and innovative Radiation Treatment FOR improving Cancer treatment outcomE (ARTFORCE); a randomized controlled phase II trial for individualized treatment of head and neck cancer. BMC Cancer 2013, 13, 84. [Google Scholar] [CrossRef] [Green Version]
- Kuno, H.; Qureshi, M.; Chapman, M.; Li, B.; Andreu-Arasa, V.; Onoue, K.; Truong, M.; Sakai, O. CT Texture Analysis Potentially Predicts Local Failure in Head and Neck Squamous Cell Carcinoma Treated with Chemoradiotherapy. AJNR Am. J. Neuroradiol. 2017, 38, 2334–2340. [Google Scholar] [CrossRef]
- Knegjens, J.L.; Hauptmann, M.; Pameijer, F.A.; Balm, A.J.; Hoebers, F.J.; De Bois, J.A.; Kaanders, J.H.; Van Herpen, C.M.; Verhoef, C.G.; Wijers, O.B.; et al. Tumor volume as prognostic factor in chemoradiation for advanced head and neck cancer. Head Neck 2011, 33, 375–382. [Google Scholar] [CrossRef]
- Kimura, Y.; Sumi, M.; Ichikawa, Y.; Kawai, Y.; Nakamura, T. Volumetric MR Imaging of Oral, Maxillary Sinus, Oropharyngeal, and Hypopharyngeal Cancers: Correlation between Tumor Volume and Lymph Node Metastasis. AJNR Am. J. Neuroradiol. 2005, 26, 2384–2389. [Google Scholar] [PubMed]
- Dejaco, D.; Steinbichler, T.; Fischer, N.; Anegg, M.; Dudás, J.; Posch, A.; Widmann, G.; Riechelmann, H.; Schartinger, V.H. Prognostic value of tumor volume in patients with head and neck squamous cell carcinoma treated with primary surgery. Head Neck 2018, 40, 728–739. [Google Scholar] [CrossRef]
- Lok, B.H.; Setton, J.; Caria, N.; Romanyshyn, J.; Wolden, S.L.; Zelefsky, M.J.; Park, J.; Rowan, N.; Sherman, E.J.; Fury, M.G.; et al. Intensity-Modulated Radiation Therapy in Oropharyngeal Carcinoma: Effect of Tumor Volume on Clinical Outcomes. Int. J. Radiat. Oncol. Biol. Phys. 2012, 82, 1851–1857. [Google Scholar] [CrossRef] [PubMed] [Green Version]
- Bohlen, M.; Busch, C.J.; Sehner, S.; Forterre, F.; Bier, J.; Berliner, C.; Bußmann, L.; Münscher, A. Tumor volume as a predictive parameter in the sequential therapy (induction chemotherapy) of head and neck squamous cell carcinomas. Eur. Arch. Otorhinolaryngol 2019, 276, 1183–1189. [Google Scholar] [CrossRef] [PubMed]
- Meyer, H.-J.; Höhn, A.K.; Surov, A. Relationships between apparent diffusion coefficient (ADC) histogram analysis parameters and PD-L 1-expression in head and neck squamous cell carcinomas: A preliminary study. Radiol. Oncol. 2021, 55, 150–157. [Google Scholar] [CrossRef]
- Corino, V.; Bologna, M.; Calareso, G.; Licitra, L.; Ghi, M.; Rinaldi, G.; Caponigro, F.; Morelli, F.; Airoldi, M.; Allegrini, G.; et al. A CT-Based Radiomic Signature Can Be Prognostic for 10-Months Overall Survival in Metastatic Tumors Treated with Nivolumab: An Exploratory Study. Diagnostics 2021, 11, 979. [Google Scholar] [CrossRef]


| Baseline Characteristics (n = 24 Patients) | ||||
|---|---|---|---|---|
| All (n = 24) | Responders (n = 8) | Non-Responders (n = 16) | ||
| Age (years) | Mean (SD) | 62.3 ± 12.1 | 61.6 ± 8.6 | 61.3± 13.9 |
| Sex | Male | 16 (67%) | 6 (75%) | 10 (62.5%) |
| Female | 8 (33%) | 2 (25%) | 6 (37.5%) | |
| HPV-status | Positive | 1 (4%) | 1 (12.5%) | 0 |
| Negative | 23 (96%) | 7 (87.5%) | 16 (100%) | |
| Smoking | Never | 4 (17%) | 1 (12.5%) | 3 (18.8%) |
| Currently | 8 (33%) | 2 (25%) | 6 (37.5%) | |
| Quit >2 years ago | 12 (50%) | 5 (62.5%) | 7 (43.8%) | |
| Tumor location | Oral cavity | 21 (88%) | 7 (87.5%) | 14 (87.5%) |
| Oropharynx | 3 (13%) | 1 (12.5%) | 2 (12.5%) | |
| Tumor status | Primary | 17 (71%) | 7 (87.5%) | 10 (62.5%) |
| Recurrent | 4 (17%) | 1 (12.5%) | 3 (18.8%) | |
| Residual | 3 (13%) | 0 | 3 (18.8%) | |
| Clinical T-stage | T2 | 4 (17%) | 2 (25%) | 2 (12.5%) |
| T3 | 11 (46%) | 4 (50%) | 7 (43.8%) | |
| T4a | 9 (38%) | 2 (25%) | 7 (43.8%) | |
| Clinical n-stage | N0 | 13 (54%) | 4 (50%) | 9 (56.3%) |
| N1 | 6 (25%) | 3 (50%) | 2 (12.5% | |
| N2a | 1 (4%) | 0 | 1 (6.3%) | |
| N2b | 3 (13%) | 0 | 3 (18.8%) | |
| N2c | 1 (4%) | 0 | 1 (6.3%) | |
| AJCC disease stage | II | 1 (4%) | 1 (12.5%) | 0 |
| III | 8 (33%) | 5 (62.5%) | 3 (18.8%) | |
| IV | 8 (33%) | 1 (12.5%) | 7 (43.8%) | |
| Recurrent | 7 (29%) | 1 (12.5%) | 6 (37.5%) | |
| Immunotherapy regimen | NIVO MONO | 5 (21%) | 1 (12.5%) | 4 (25%) |
| COMBO | 19 (79%) | 7 (87.5%) | 12 (75%) | |
| Surgical treatment | Yes | 22 (92%) | 7 (87.5%) | 15 (93.8%) |
| No | 2 (8%) | 1 (12.5%) | 1 (6.2%) | |
| Mean of Responding and Non-Responding Tumor Features at Pre- and Post-Treatment and the Calculated Delta | ||||||
|---|---|---|---|---|---|---|
| Responders | Non Responders | |||||
| Pre-tr | Delta | Post-tr | Pre-tr | Delta | Post-tr | |
| (n = 7) | (n = 7) | (n = 8) | (n = 14) | (n = 13) | (n = 15) | |
| First-order Parameters | Mean ± SD | Mean ± SD | Mean ± SD | Mean ± SD | Mean ± SD | Mean ± SD |
| Min ADC (×10−3 mm2/s) | 0.49 ± 0.28 | 0.01 ± 0.35 | 0.44 ± 0.28 | 0.42 ± 0.21 | −0.07 ± 0.25 | 0.29 ± 0.22 |
| 10th percentile | 0.75 ± 0.24 | 0.03 ± 0.33 | 0.75 ± 0.23 | 0.81 ± 0.14 | −0.05 ± 0.13 | 0.74 ± 0.13 |
| Energy (×108) | 6.62 ± 8.33 | −2.64 ± 9.57 | 5.02 ± 3.74 | 11.78 ± 8.81 | 3.67 ± 12.70 | 26.45 ± 48.32 |
| Total energy (×108) | 52.94 ± 66.67 | −21.08 ± 76.54 | 40.12 ± 29.89 | 94.21 ± 70.50 | 29.32 ± 101.58 | 211.6 ± 386.6 |
| Entropy | 6.26 ± 0.71 * | 0.22 ± 0.74 | 6.56 ± 0.53 | 6.89 ± 0.41 * | −0.06 ± 0.45 | 6.99 ± 0.44 |
| Skewness | 0.37 ± 0.37 | −0.42 ± 0.36 | −0.06 ± 0.22 | 0.08 ± 0.25 | 0.02 ± 0.47 | 0.15 ± 0.41 |
| Kurtosis | 3.49 ± 0.84 | −0.64 ± 0.97 | 2.99 ± 0.52 | 3.36 ± 0.63 | 0.38 ± 1.05 | 3.72 ± 0.95 |
| Uniformity | 0.016 ± 0.008 | −0.003 ± 0.008 | 0.013 ± 0.005 | 0.010 ± 0.003 | 0.001 ± 0.003 | 0.010 ± 0.003 |
| Shape Parameters | ||||||
| Volume (cm3) | 2.81 ± 3.46 | −1.39 ± 3.85 | 2.29 ± 2.55 | 4.24 ± 3.13 | 1.81 ± 5.69 | 10.97 ± 20.12 |
| Voxel volume (cm3) | 2.92 ± 3.51 | −1.38 ± 3.92 | 2.43 ± 2.61 | 4.44 ± 3.21 | 1.83 ± 5.76 | 11.23 ± 20.21 |
| Surface area (cm2) | 14.87 ± 13.0 | −3.37 ± 15.98 | 15.13 ± 11.59 | 26.81 ± 17.95 | 6.85 ± 25.79 | 46.63 ± 56.67 |
| Surface area/volume ratio | 0.75 ± 0.26 | 0.11 ± 0.36 | 0.81 ± 0.22 | 0.72 ± 0.21 | 0.02 ± 0.24 | 0.70 ± 0.26 |
| Sphericity | 0.60 ± 0.06 * | −0.05 ± 0.13 | 0.54 ± 0.09 | 0.49 ± 0.09 * | −0.002 ± 0.09 | 0.46 ± 0.09 |
| 3D diameter (cm) | 2.86 ± 1.15 * | −0.01 ± 1.70 | 3.03 ± 0.88 * | 4.15 ± 1.09 * | −0.08 ± 1.39 | 4.51 ± 1.64 * |
| 2D diameter (Slice) (cm) | 2.37 ± 1.01 * | 0.02 ± 1.44 | 2.53 ± 0.71 | 3.47 ± 0.92 * | −0.003 ± 1.14 | 3.86 ± 1.62 |
| 2D diameter (Column) (cm) | 2.30 ± 0.88 | −0.25 ± 1.08 | 2.29 ± 0.90 | 2.86 ± 1.02 | 0.15 ± 0.99 | 3.43 ± 1.63 |
| 2D diameter (Row) (cm) | 2.50 ± 1.12 | −0.22 ± 1.37 | 2.52 ± 0.76 * | 3.57 ± 1.04 | −0.05 ± 1.37 | 3.96 ± 1.62 * |
| Major axis length (cm) | 2.41 ± 0.84 * | 0.16 ± 1.44 | 2.73 ± 0.81 * | 3.47 ± 0.85 * | 0.12 ± 1.32 | 3.85 ± 1.16 * |
| Minor axis length (cm) | 1.82 ± 0.67 | −0.06 ± 0.66 | 1.85 ± 0.50 | 2.23 ± 0.72 | −0.05 ± 0.62 | 2.55 ± 1.18 |
| Least axis length (cm) | 0.94 ± 0.50 | −0.05 ± 0.61 | 1.04 ± 0.51 | 1.49 ± 0.61 | −0.06 ± 0.47 | 1.78 ± 1.09 |
| Elongation | 0.76 ± 0.16 | −0.05 ± 0.23 | 0.70 ± 0.17 | 0.66 ± 0.21 | −0.06 ± 0.14 | 0.65 ± 0.16 |
| Flatness | 0.38 ± 0.07 | −0.02 ± 0.13 | 0.38 ± 0.14 | 0.43 ± 0.14 | −0.01 ± 0.12 | 0.44 ± 0.16 |
| Analyses of Features of Responding Tumors Versus Non-Responding Tumors (n = 24) | ||||||||||
|---|---|---|---|---|---|---|---|---|---|---|
| Pre-Treatment | Delta | Post-Treatment | ||||||||
| Univariate | Multivariate † | Univariate | Univariate | Multivariate † | ||||||
| First-order Parameters | p | β ± SE | p | β ± SE | p | β ± SE | p | β ± SE | p | β ± SE |
| Min ADC (10−3 mm2/s) | 0.366 | 0.551 | 0.171 | |||||||
| 10th percentile | 0.520 | 0.416 | 0.869 | |||||||
| Energy (×108) | 0.282 | 0.268 | 0.195 | |||||||
| Total Energy (×108) | 0.282 | 0.268 | 0.195 | |||||||
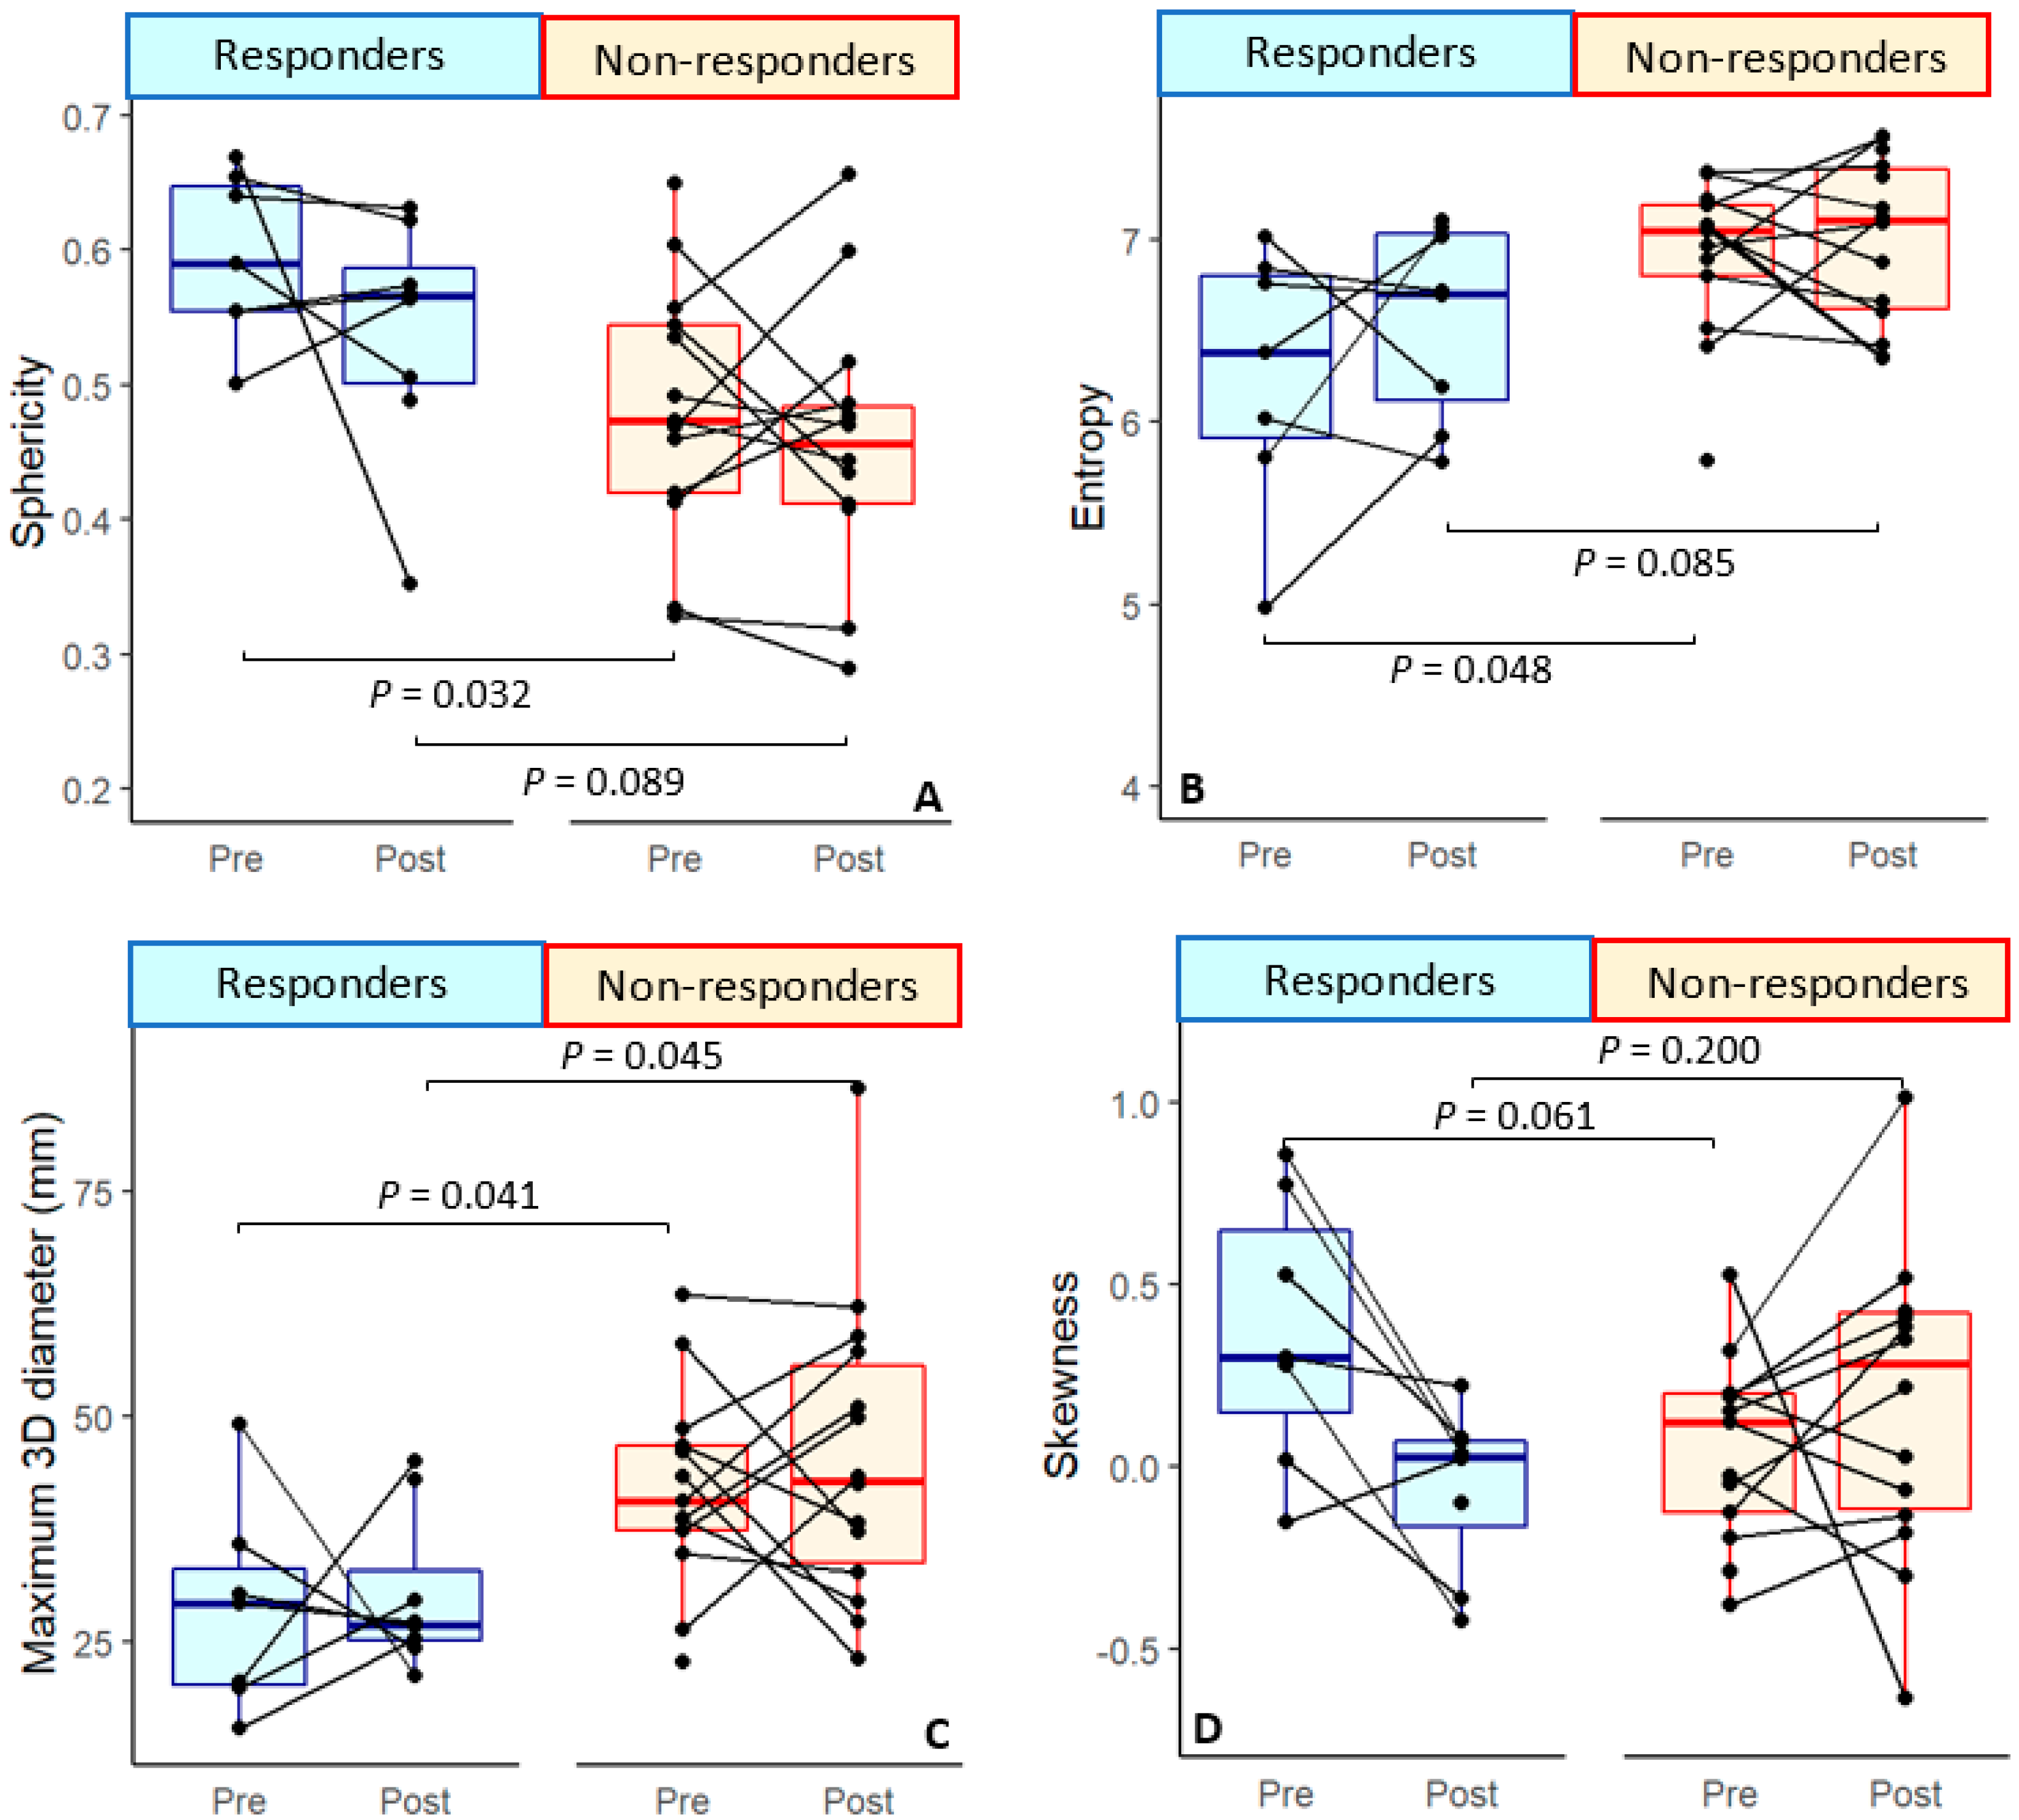
| Entropy | 0.048 * | −1.43 ± 0.69 | 0.033 * | −6.32 ± 2.97 | 0.285 | 0.067 | ||||
| Skewness | 0.061 | 0.066 | 0.200 | |||||||
| Kurtosis | 0.712 | 0.061 | 0.062 | |||||||
| Uniformity | 0.076 | 0.177 | 0.075 | |||||||
| Shape Parameters | ||||||||||
| Volume (cm3) | 0.343 | 0.212 | 0.197 | |||||||
| Voxel volume (cm3) | 0.323 | 0.216 | 0.192 | |||||||
| Surface area (cm2) | 0.162 | 0.347 | 0.136 | |||||||
| Surface area/volume ratio | 0.769 | 0.493 | 0.321 | |||||||
| Sphericity | 0.032 * | 1.84 ± 0.86 | 0.024 * | 2.57 ± 1.138 | 0.327 | 0.089 | ||||
| 3D diameter (cm) | 0.041 * | −1.47 ± 0.72 | 0.034 * | −2.29 ± 1.08 | 0.913 | 0.045 * | −1.75 ± 0.87 | 0.040 * | −1.88 ± 0.91 | |
| 2D diameter (Slice) (cm) | 0.038 * | −1.40 ± 0.68 | 0.028 * | −2.16 ± 0.98 | 0.961 | 0.056 | ||||
| 2D diameter (Column) (cm) | 0.226 | 0.398 | 0.104 | |||||||
| 2D diameter (Row) (cm) | 0.072 | 0.786 | 0.044 * | −2.34 ± 1.16 | 0.047 * | −2.440 ± 1.23 | ||||
| Major axis length (cm) | 0.038* | −1.57 ± 0.76 | 0.035 * | −2.121 ± 1.01 | 0.949 | 0.044 * | −1.34 ± 0.67 | 0.042 * | −1.428 ± 0.71 | |
| Minor axis length (cm) | 0.222 | 0.959 | 0.139 | |||||||
| Least axis length (cm) | 0.079 | 0.630 | 0.114 | |||||||
| Elongation | 0.304 | 0.848 | 0.450 | |||||||
| Flatness | 0.324 | 0.914 | 0.350 | |||||||
| Continuous (0–100) Tumor Regression Percentage Analyses with Feature (n = 22) | ||||||||||||
|---|---|---|---|---|---|---|---|---|---|---|---|---|
| Pre-Treatment | Delta | Post-Treatment | ||||||||||
| Univariate | Multivariate † | Univariate | Multivariate† | Univariate | Multivariate † | |||||||
| First order Parameters | p | β ± SE | p | β ± SE | p | β ± SE | p | β ± SE | p | β ± SE | p | β ± SE |
| Min ADC (10−3 mm2/s) | 0.437 | 0.868 | 0.201 | |||||||||
| 10th percentile | 0.569 | 0.340 | 0.565 | |||||||||
| Energy (×108) | 0.081 | 0.644 | 0.264 | |||||||||
| Total Energy (×108) | 0.081 | 0.644 | 0.264 | |||||||||
| Entropy | 0.046 * | −17.80 ± 9.93 | 0.024 * | −23.87 ± 9.53 | 0.240 | 0.085 | ||||||
| Skewness | 0.061 | 0.016 * | −20.88 ± 7.73 | 0.024 * | −21.63 ± 8.52 | 0.037 * | −17.37 ± 7.75 | 0.048 * | −18.05 ± 8.49 | |||
| Kurtosis | 0.971 | 0.134 | 0.096 | |||||||||
| Uniformity | 0.060 | 0.141 | 0.075 | |||||||||
| Shape Parameters | ||||||||||||
| Volume (cm3) | 0.095 | 0.467 | 0.274 | |||||||||
| Voxel volume (cm3) | 0.090 | 0.964 | 0.271 | |||||||||
| Surface area (cm2) | 0.078 | 0.772 | 0.175 | |||||||||
| Surface area/volume ratio | 0.363 | 0.964 | 0.413 | |||||||||
| Sphericity | 0.076 | 0.396 | 0.162 | |||||||||
| 3D diameter (cm) | 0.017 * | −21.44 ± 8.07 | 0.009 * | −26.47 ± 8.89 | 0.477 | 0.051 | ||||||
| 2D diameter (Slice) (cm) | 0.038 * | −19.18 ± 8.52 | 0.026 * | −23.39 ± 9.50 | 0.609 | 0.087 | ||||||
| 2D diameter (Column)(cm) | 0.219 | 0.629 | 0.083 | |||||||||
| 2D diameter (Row) (cm) | 0.027 * | −20.59 ± 8.49 | 0.015 * | −26.37 ± 9.54 | 0.819 | 0.034 * | −18.94 ± 8.28 | 0.040 * | −19.43 ± 8.75 | |||
| Major axis length (cm) | 0.008 * | −23.55 ± 7.77 | 0.006 * | −26.85 ± 8.32 | 0.531 | 0.041 * | −18.84 ± 8.60 | 0.055 | ||||
| Minor axis length (cm) | 0.522 | 0.888 | 0.195 | |||||||||
| Least axis length (cm) | 0.007 * | −27.45 ± 9.00 | 0.004 * | −33.07 ± 9.8 | 0.528 | 0.113 | ||||||
| Elongation | 0.051 | 0.327 | 0.580 | |||||||||
| Flatness | 0.214 | 0.923 | 0.287 | |||||||||
Publisher’s Note: MDPI stays neutral with regard to jurisdictional claims in published maps and institutional affiliations. |
© 2022 by the authors. Licensee MDPI, Basel, Switzerland. This article is an open access article distributed under the terms and conditions of the Creative Commons Attribution (CC BY) license (https://creativecommons.org/licenses/by/4.0/).
Share and Cite
van der Hulst, H.J.; Vos, J.L.; Tissier, R.; Smit, L.A.; Martens, R.M.; Beets-Tan, R.G.H.; van den Brekel, M.W.M.; Zuur, C.L.; Castelijns, J.A. Quantitative Diffusion-Weighted Imaging Analyses to Predict Response to Neoadjuvant Immunotherapy in Patients with Locally Advanced Head and Neck Carcinoma. Cancers 2022, 14, 6235. https://doi.org/10.3390/cancers14246235
van der Hulst HJ, Vos JL, Tissier R, Smit LA, Martens RM, Beets-Tan RGH, van den Brekel MWM, Zuur CL, Castelijns JA. Quantitative Diffusion-Weighted Imaging Analyses to Predict Response to Neoadjuvant Immunotherapy in Patients with Locally Advanced Head and Neck Carcinoma. Cancers. 2022; 14(24):6235. https://doi.org/10.3390/cancers14246235
Chicago/Turabian Stylevan der Hulst, Hedda J., Joris L. Vos, Renaud Tissier, Laura A. Smit, Roland M. Martens, Regina G. H. Beets-Tan, Michiel W. M. van den Brekel, Charlotte L. Zuur, and Jonas A. Castelijns. 2022. "Quantitative Diffusion-Weighted Imaging Analyses to Predict Response to Neoadjuvant Immunotherapy in Patients with Locally Advanced Head and Neck Carcinoma" Cancers 14, no. 24: 6235. https://doi.org/10.3390/cancers14246235