

SETD7 Expression Is Associated with Breast Cancer Survival Outcomes for Specific Molecular Subtypes: A Systematic Analysis of Publicly Available Datasets
 , , and
Abstract
:Simple Summary
Abstract
1. Introduction
2. Materials and Methods
2.1. Description of Datasets
2.2. Analysis of SETD7 Mutation and Copy Number
2.3. Analysis of SETD7 Expression Using Online Tools
2.4. Correlation of SETD7 with Breast Cancer Outcomes
2.5. Genes Associated with Differential SETD7 mRNA Expression in BC Subtypes
3. Results
3.1. Characterization of SETD7 Mutations, Copy Number, and Expression in BC
3.1.1. SETD7 Mutation and Copy Number Profile
3.1.2. Association of SETD7 Expression with Clinical Attributes
3.1.3. Association of SETD7 Expression with Clinically Relevant Signatures
3.2. Association of SETD7 Expression with Genomic Alterations and DNA Methylation
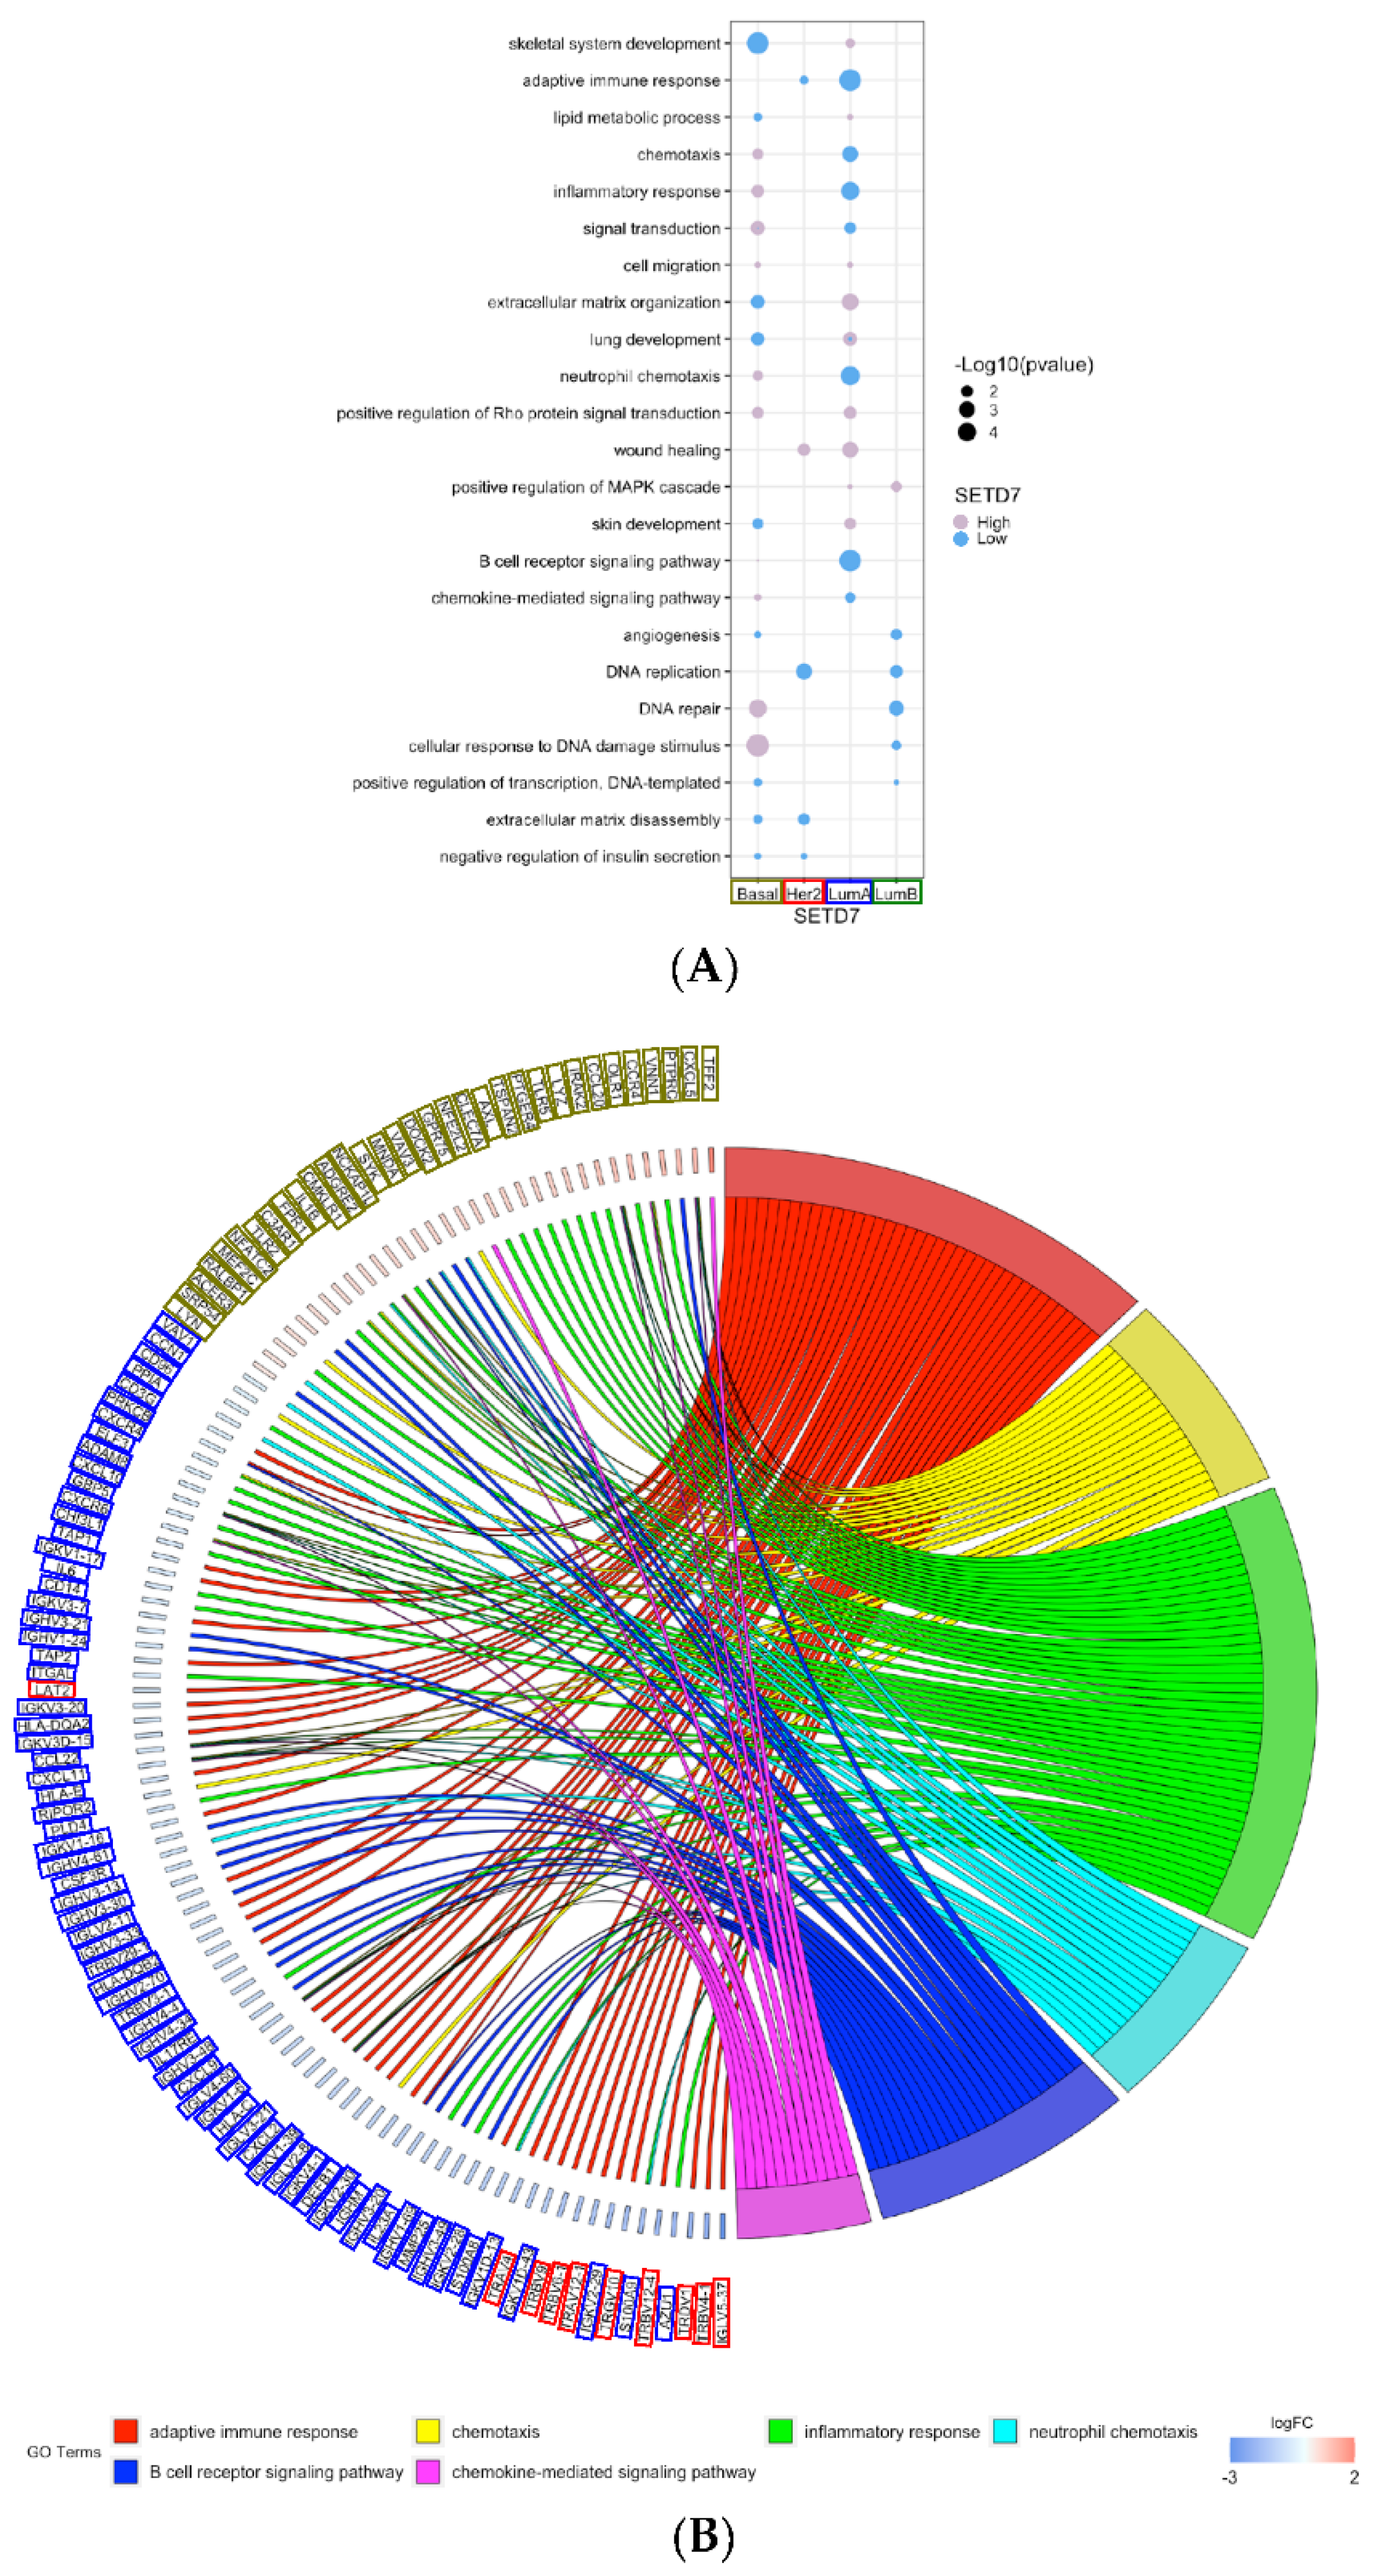
3.3. Gene Expression and Biological Processes Associated with Differential SETD7 mRNA Expression
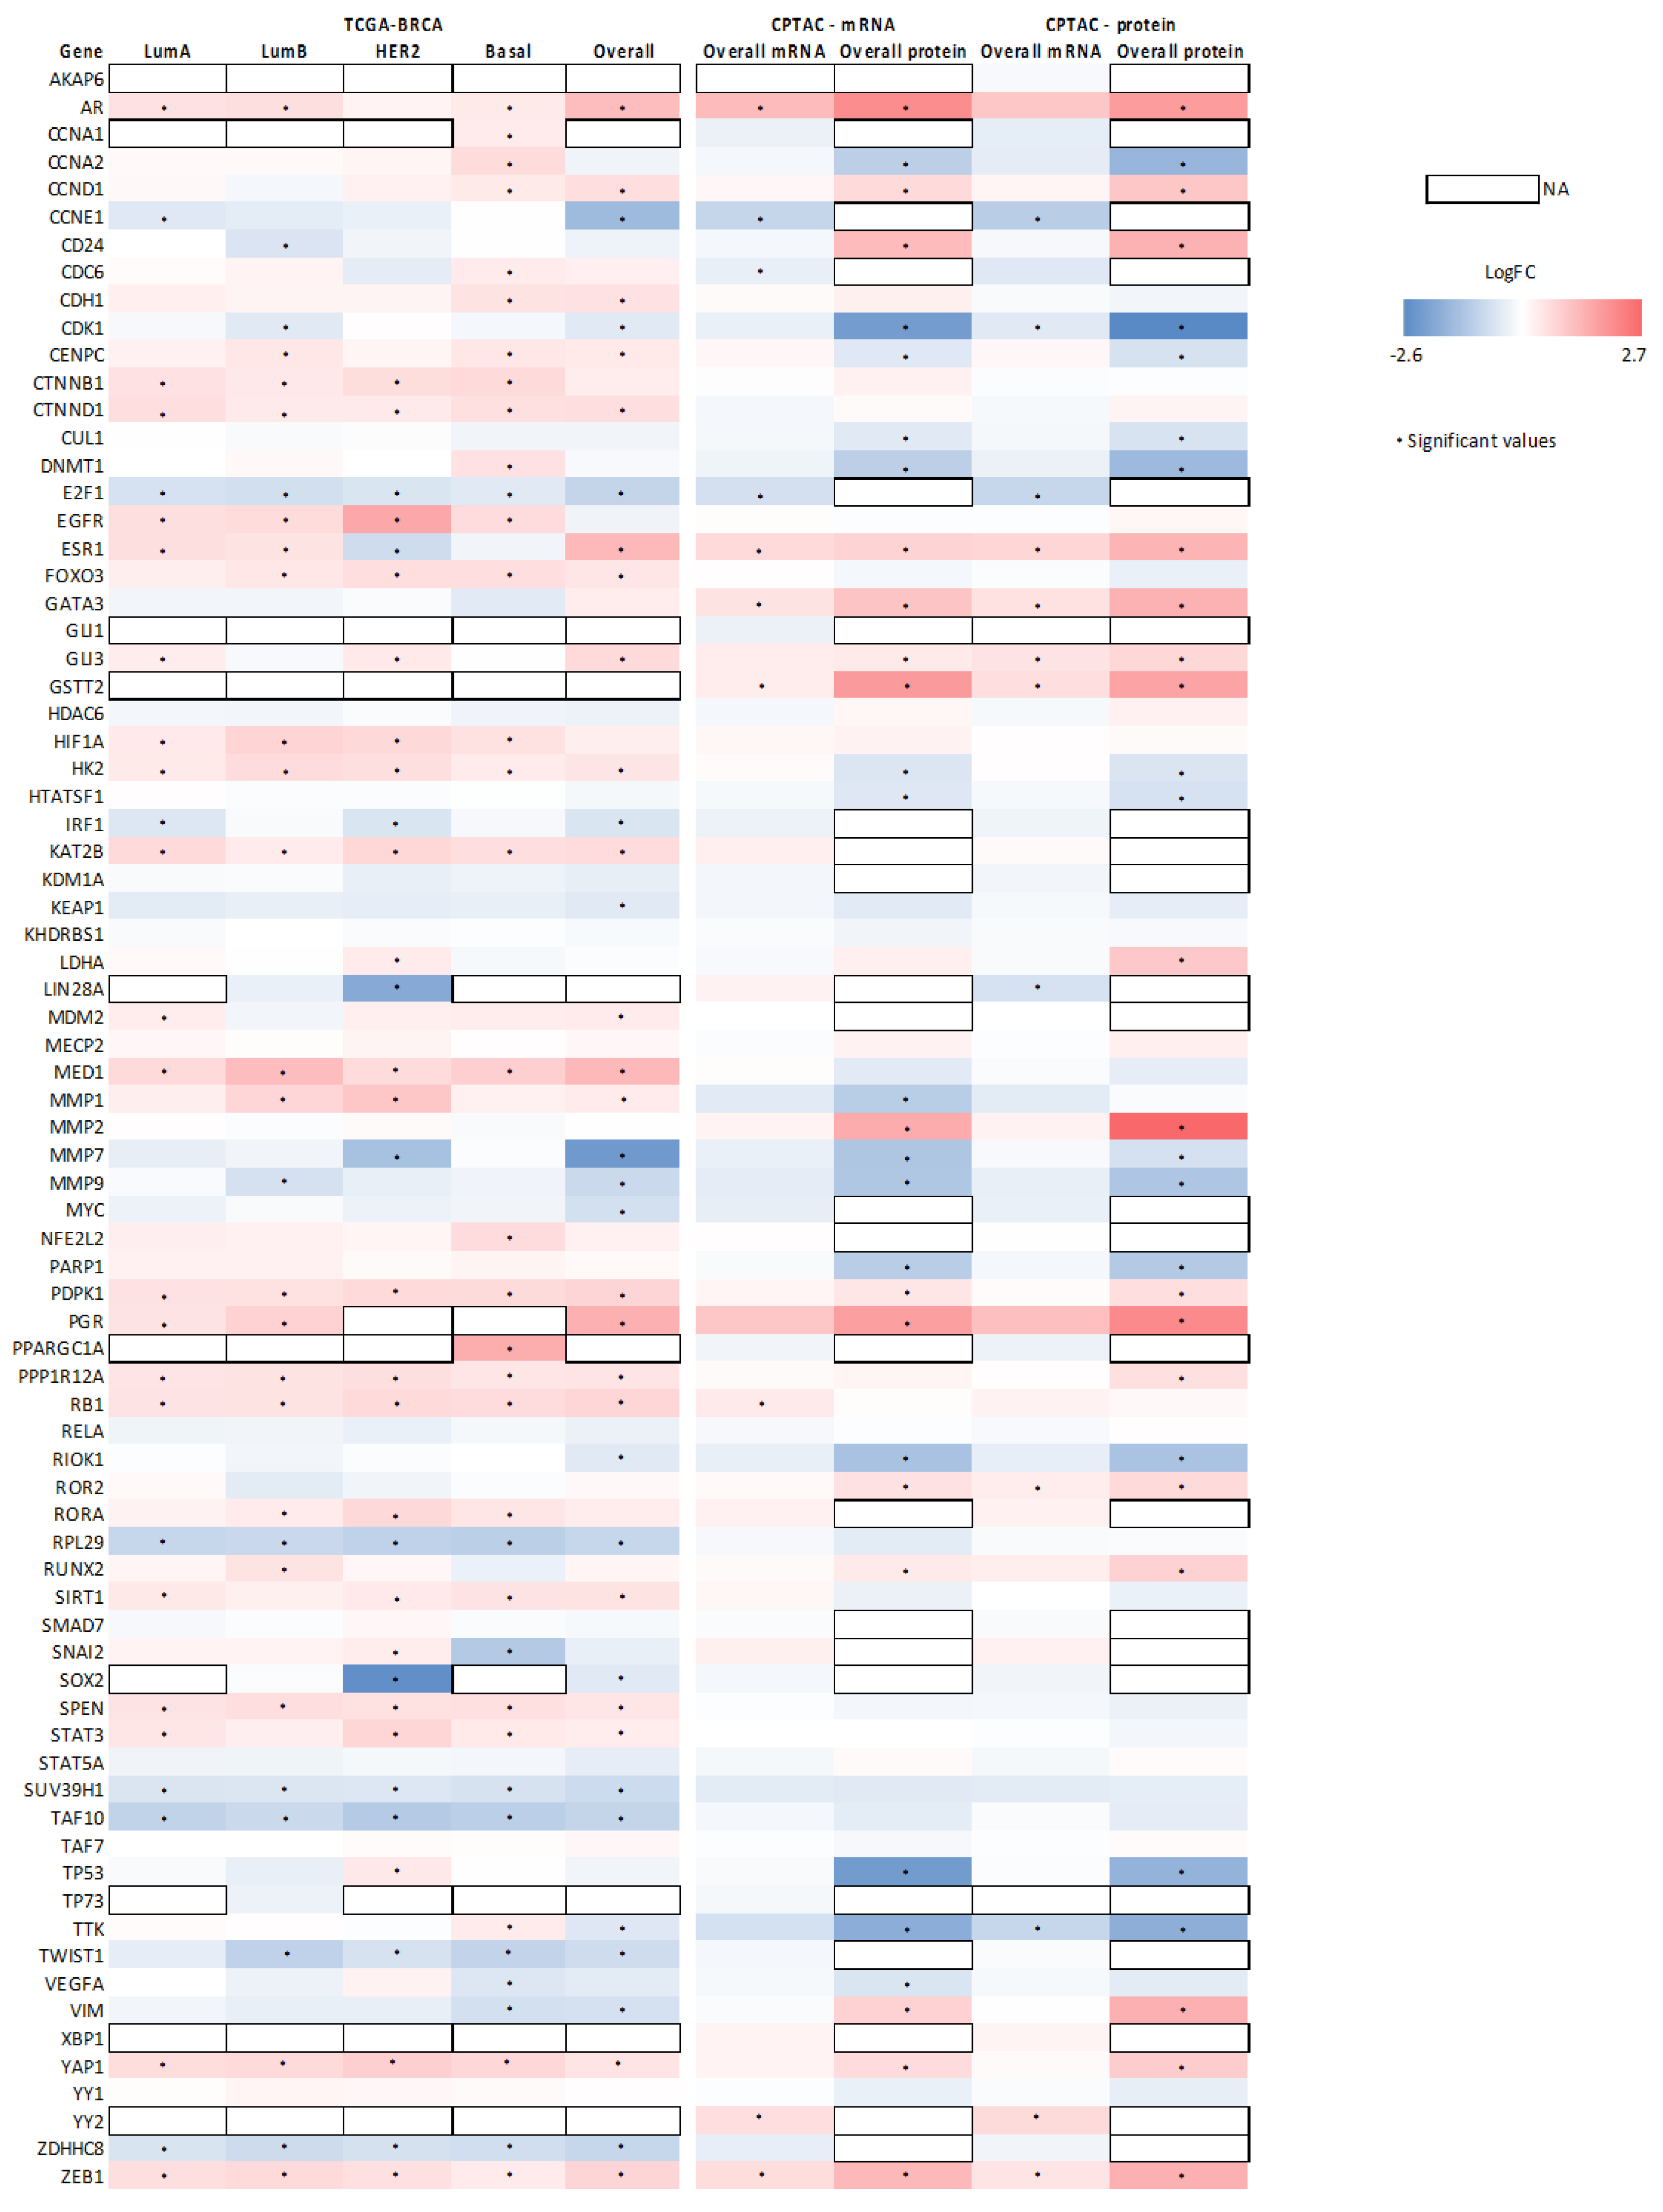
3.4. Association between SETD7 Expression and Its Target Proteins
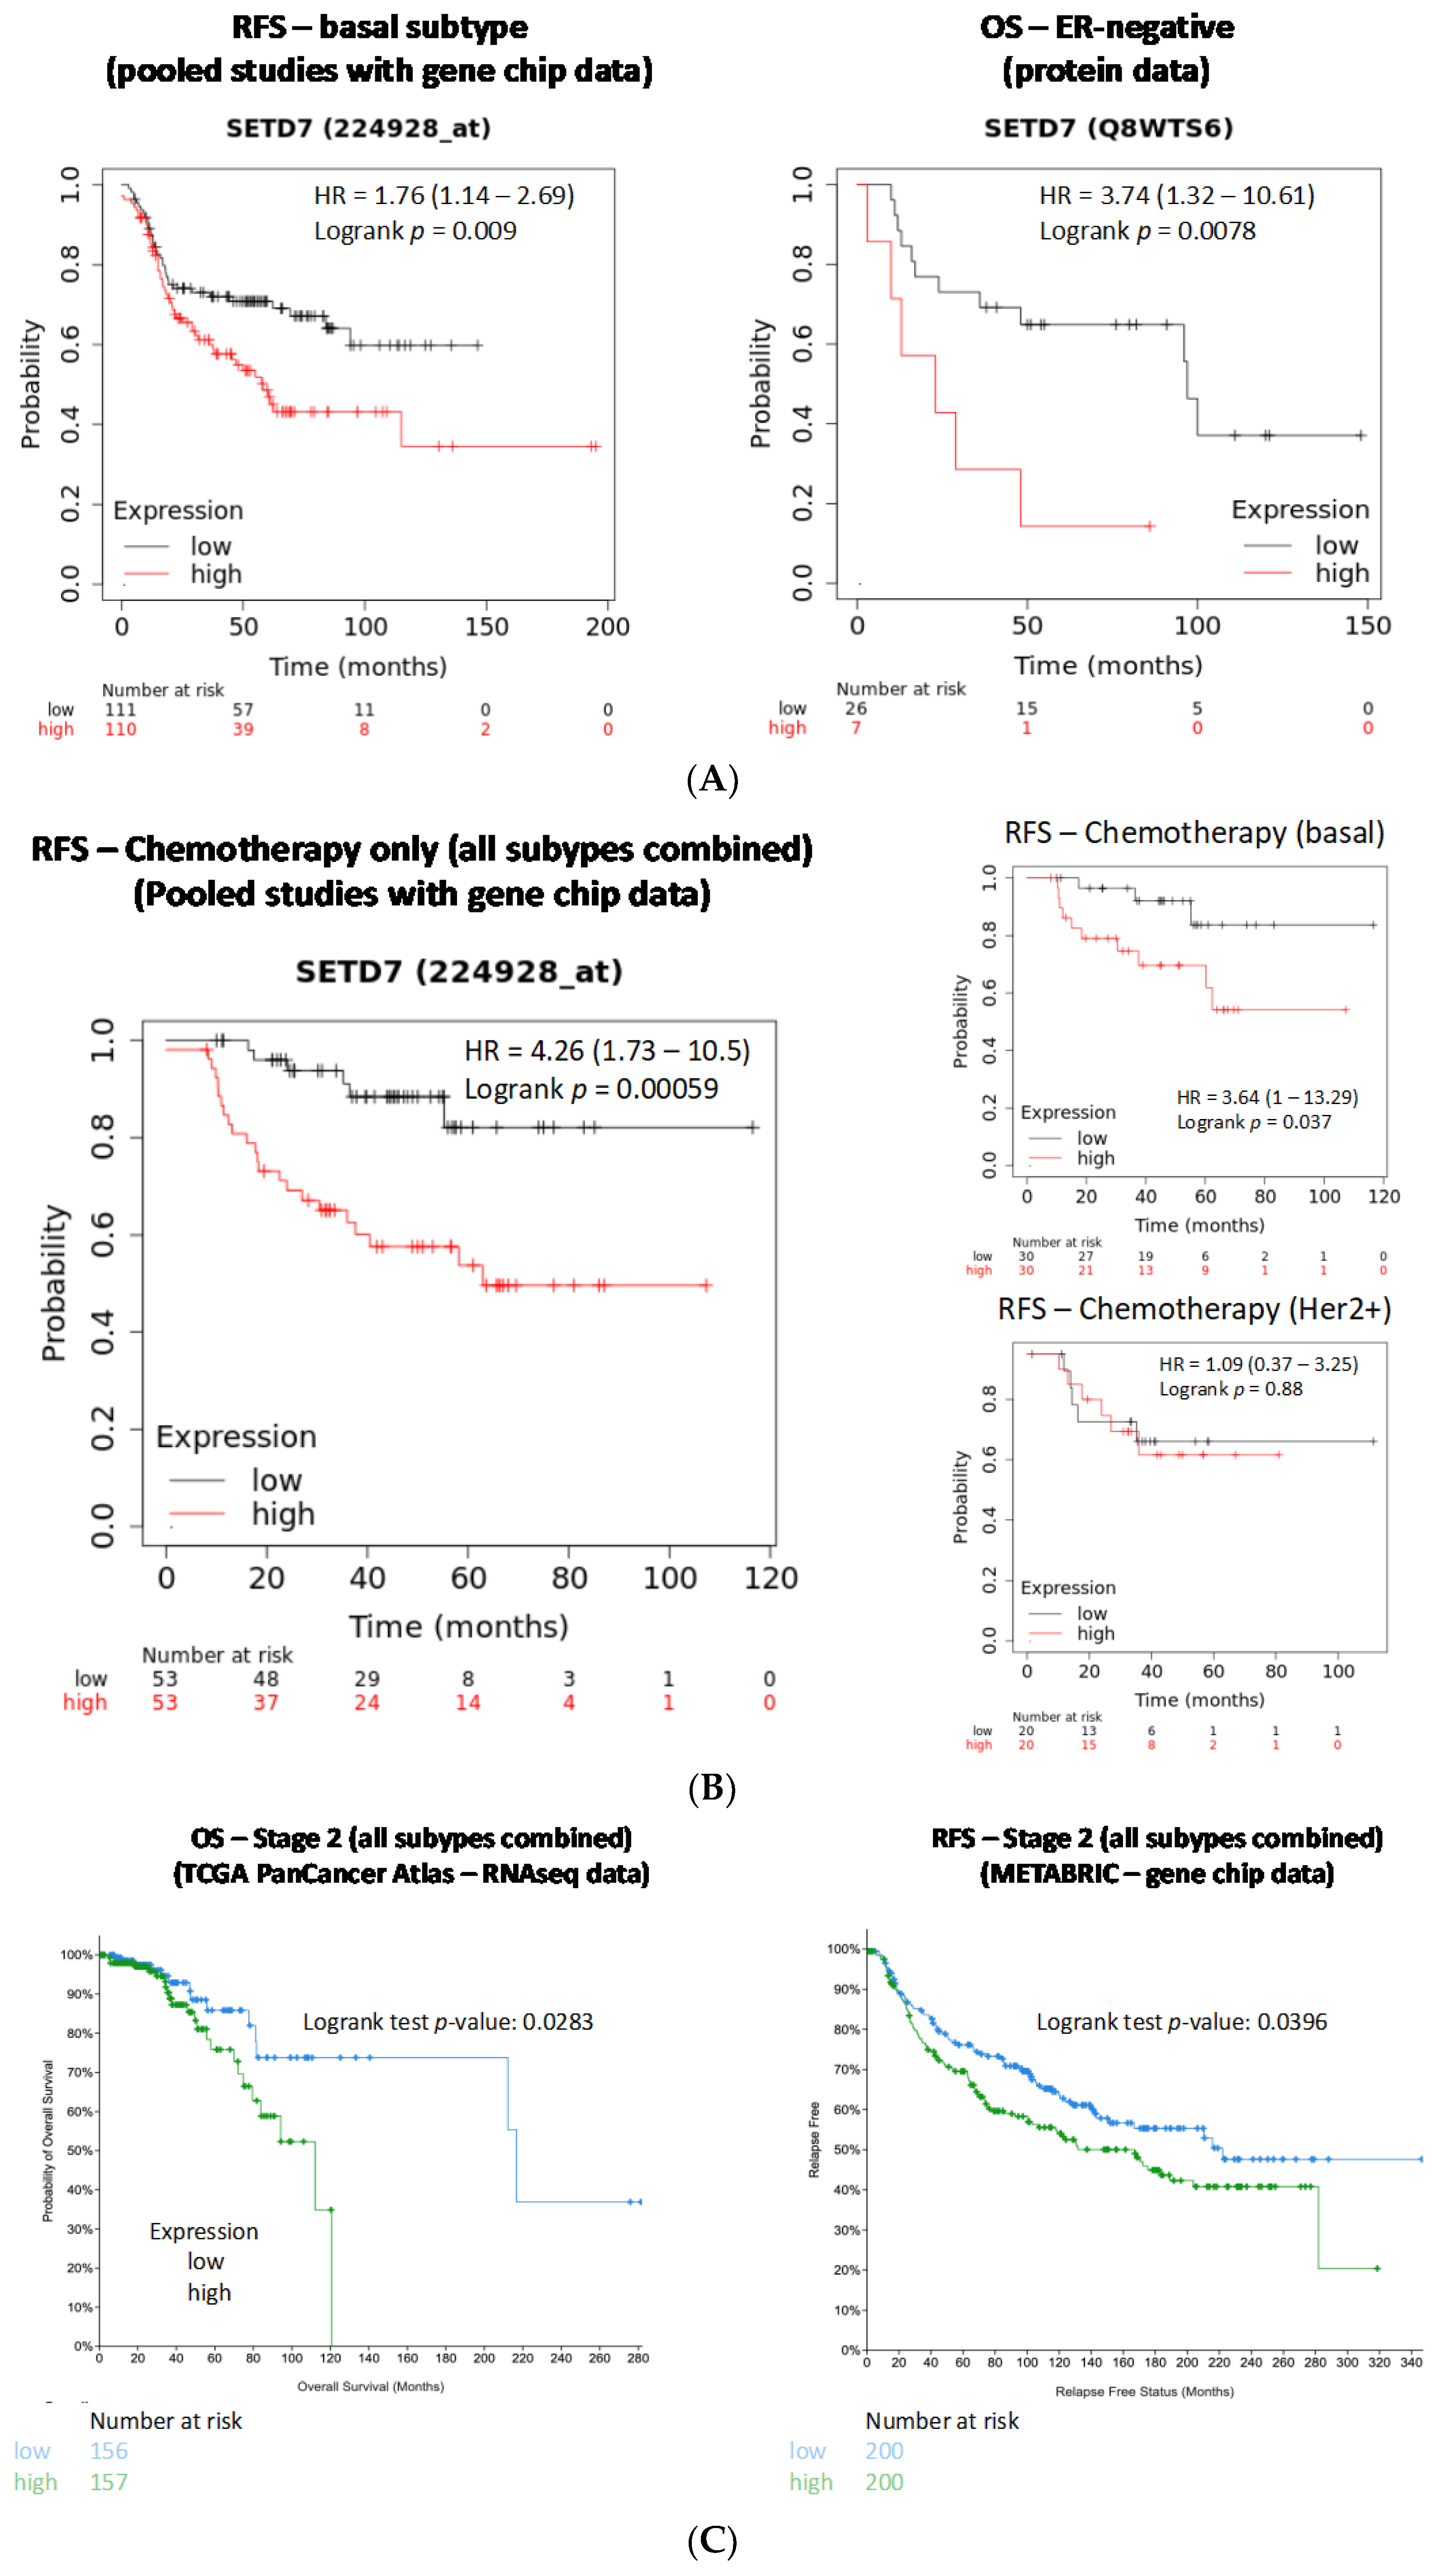
3.5. Association of SETD7 Expression Levels with Breast Cancer Survival Outcomes
3.5.1. Influence of Histological and Molecular Subtype on Outcomes Associated with SETD7 Expression
3.5.2. Influence of SETD7 Expression on Therapy Outcomes
3.5.3. Influence of Tumour Stage on Outcomes Associated with SETD7 Expression
3.5.4. Influence of Tumour Grade, Lymph Node Status, and Metastasis on Survival Outcomes Associated with SETD7 Expression
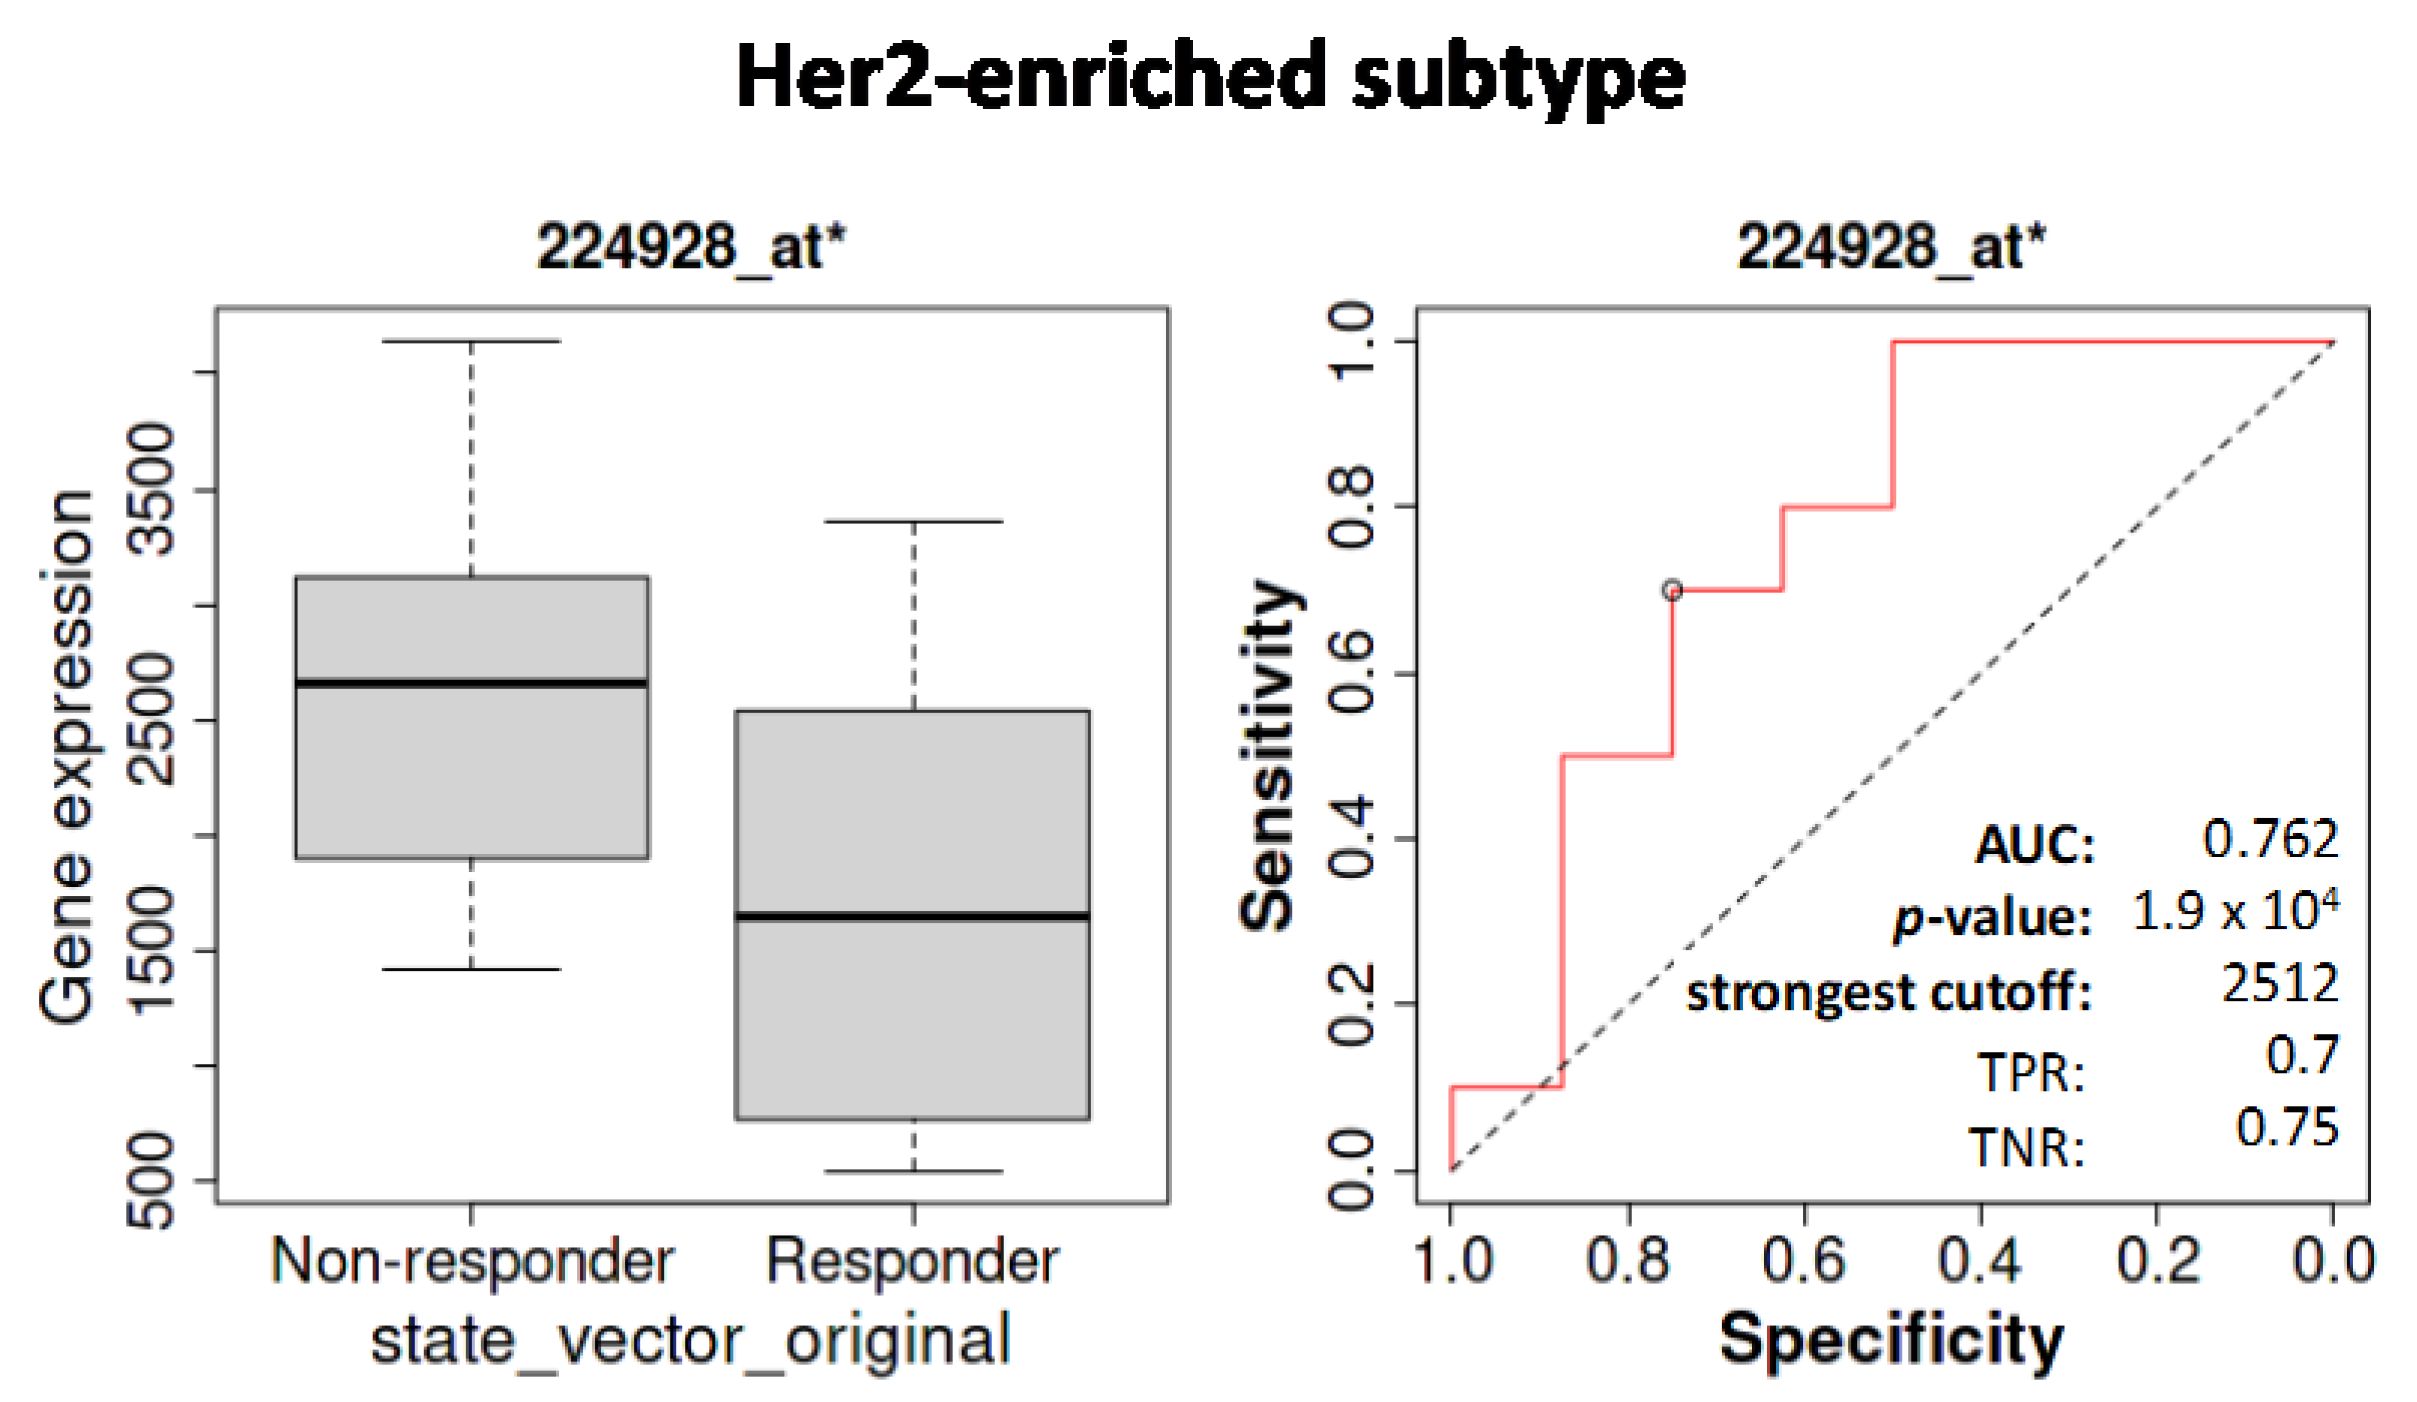
3.5.5. Predictive Power of SETD7
4. Discussion
5. Conclusions
Supplementary Materials
Author Contributions
Funding
Institutional Review Board Statement
Informed Consent Statement
Data Availability Statement
Acknowledgments
Conflicts of Interest
References
- Batista, I.D.A.A.; Helguero, L.A. Biological Processes and Signal Transduction Pathways Regulated by the Protein Methyltransferase SETD7 and Their Significance in Cancer. Signal Transduct. Target. Ther. 2018, 3, 19. [Google Scholar] [CrossRef] [PubMed] [Green Version]
- Subramanian, K.; Jia, D.; Kapoor-Vazirani, P.; Powell, D.R.; Collins, R.E.; Sharma, D.; Peng, J.; Cheng, X.; Vertino, P.M. Regulation of Estrogen Receptor Alpha by the SET7 Lysine Methyltransferase. Mol. Cell 2008, 30, 336–347. [Google Scholar] [CrossRef] [PubMed] [Green Version]
- Huang, R.; Li, X.; Yu, Y.; Ma, L.; Liu, S.; Zong, X.; Zheng, Q. SETD7 Is a Prognosis Predicting Factor of Breast Cancer and Regulates Redox Homeostasis. Oncotarget 2017, 8, 94080–94090. [Google Scholar] [CrossRef] [Green Version]
- Monteiro, F.L.; Williams, C.; Helguero, L.A. A Systematic Review to Define the Multi-Faceted Role of Lysine Methyltransferase SETD7 in Cancer. Cancers 2022, 14, 1414. [Google Scholar] [CrossRef] [PubMed]
- Gu, Y.; Wang, X.; Liu, H.; Li, G.; Yu, W.; Ma, Q. SET7/9 Promotes Hepatocellular Carcinoma Progression through Regulation of E2F1. Oncol. Rep. 2018, 40, 1863–1874. [Google Scholar] [CrossRef] [PubMed]
- Song, Y.; Zhang, J.; Tian, T.; Fu, X.; Wang, W.; Li, S.; Shi, T.; Suo, A.; Ruan, Z.; Guo, H.; et al. SET7/9 Inhibits Oncogenic Activities through Regulation of Gli-1 Expression in Breast Cancer. Tumor Biol. 2016, 37, 9311–9322. [Google Scholar] [CrossRef]
- Zhang, Y.; Liu, J.; Lin, J.; Zhou, L.; Song, Y.; Wei, B.; Luo, X.; Chen, Z.; Chen, Y.; Xiong, J.; et al. The Transcription Factor GATA1 and the Histone Methyltransferase SET7 Interact to Promote VEGF-Mediated Angiogenesis and Tumor Growth and Predict Clinical Outcome of Breast Cancer. Oncotarget 2016, 7, 9859–9875. [Google Scholar] [CrossRef] [PubMed] [Green Version]
- Si, W.; Zhou, J.; Zhao, Y.; Zheng, J.; Cui, L. SET7/9 Promotes Multiple Malignant Processes in Breast Cancer Development via RUNX2 Activation and Is Negatively Regulated by TRIM21. Cell Death Dis. 2020, 11, 151. [Google Scholar] [CrossRef] [Green Version]
- Duan, B.; Bai, J.; Qiu, J.; Wang, J.; Tong, C.; Wang, X.; Miao, J.; Li, Z.; Li, W.; Yang, J.; et al. Histone-Lysine N-Methyltransferase SETD7 Is a Potential Serum Biomarker for Colorectal Cancer Patients. EBioMedicine 2018, 37, 134–143. [Google Scholar] [CrossRef] [Green Version]
- Lezina, L.; Aksenova, V.; Fedorova, O.; Malikova, D.; Shuvalov, O.; Antonov, A.V.; Tentler, D.; Garabadgiu, A.V.; Melino, G.; Barlev, N.A. KMT Set7/9 Affects Genotoxic Stress Response via the Mdm2 Axis. Oncotarget 2015, 6, 25843–25855. [Google Scholar] [CrossRef]
- Montenegro, M.F.; Sánchez-Del-Campo, L.; González-Guerrero, R.; Martínez-Barba, E.; Piñero-Madrona, A.; Cabezas-Herrera, J.; Rodríguez-López, J.N. Tumor Suppressor SET9 Guides the Epigenetic Plasticity of Breast Cancer Cells and Serves as an Early-Stage Biomarker for Predicting Metastasis. Oncogene 2016, 35, 6143–6152. [Google Scholar] [CrossRef] [PubMed]
- Gao, J.; Aksoy, B.A.; Dogrusoz, U.; Dresdner, G.; Gross, B.; Sumer, S.O.; Sun, Y.; Jacobsen, A.; Sinha, R.; Larsson, E.; et al. Integrative Analysis of Complex Cancer Genomics and Clinical Profiles Using the CBioPortal. Sci. Signal. 2013, 6, pl1. [Google Scholar] [CrossRef] [PubMed] [Green Version]
- Cerami, E.; Gao, J.; Dogrusoz, U.; Gross, B.E.; Sumer, S.O.; Aksoy, B.A.; Jacobsen, A.; Byrne, C.J.; Heuer, M.L.; Larsson, E.; et al. The CBio Cancer Genomics Portal: An Open Platform for Exploring Multidimensional Cancer Genomics Data. Cancer Discov. 2012, 2, 401–404. [Google Scholar] [CrossRef] [PubMed] [Green Version]
- Krug, K.; Jaehnig, E.J.; Satpathy, S.; Blumenberg, L.; Karpova, A.; Anurag, M.; Miles, G.; Mertins, P.; Geffen, Y.; Tang, L.C.; et al. Proteogenomic Landscape of Breast Cancer Tumorigenesis and Targeted Therapy. Cell 2020, 183, 1436–1456.e31. [Google Scholar] [CrossRef] [PubMed]
- Curtis, C.; Shah, S.P.; Chin, S.F.; Turashvili, G.; Rueda, O.M.; Dunning, M.J.; Speed, D.; Lynch, A.G.; Samarajiwa, S.; Yuan, Y.; et al. The Genomic and Transcriptomic Architecture of 2,000 Breast Tumours Reveals Novel Subgroups. Nature 2012, 486, 346–352. [Google Scholar] [CrossRef] [PubMed]
- Liu, J.; Lichtenberg, T.; Hoadley, K.A.; Poisson, L.M.; Lazar, A.J.; Cherniack, A.D.; Kovatich, A.J.; Benz, C.C.; Levine, D.A.; Lee, A.V.; et al. An Integrated TCGA Pan-Cancer Clinical Data Resource to Drive High-Quality Survival Outcome Analytics. Cell 2018, 173, 400–416.e11. [Google Scholar] [CrossRef] [Green Version]
- Lefebvre, C.; Bachelot, T.; Filleron, T.; Pedrero, M.; Campone, M.; Soria, J.C.; Massard, C.; Lévy, C.; Arnedos, M.; Lacroix-Triki, M.; et al. Mutational Profile of Metastatic Breast Cancers: A Retrospective Analysis. PLoS Med. 2016, 13, e1002201. [Google Scholar] [CrossRef] [Green Version]
- Razavi, P.; Chang, M.T.; Xu, G.; Bandlamudi, C.; Ross, D.S.; Vasan, N.; Cai, Y.; Bielski, C.M.; Donoghue, M.T.A.; Jonsson, P.; et al. The Genomic Landscape of Endocrine-Resistant Advanced Breast Cancers. Cancer Cell 2018, 34, 427–438.e6. [Google Scholar] [CrossRef] [Green Version]
- Razavi, P.; Dickler, M.N.; Shah, P.D.; Toy, W.; Brown, D.N.; Won, H.H.; Li, B.T.; Shen, R.; Vasan, N.; Modi, S.; et al. Alterations in PTEN and ESR1 Promote Clinical Resistance to Alpelisib plus Aromatase Inhibitors. Nat. Cancer 2020, 1, 382. [Google Scholar] [CrossRef]
- Nixon, M.J.; Formisano, L.; Mayer, I.A.; Estrada, M.V.; González-Ericsson, P.I.; Isakoff, S.J.; Forero-Torres, A.; Won, H.; Sanders, M.E.; Solit, D.B.; et al. PIK3CA and MAP3K1 Alterations Imply Luminal A Status and Are Associated with Clinical Benefit from Pan-PI3K Inhibitor Buparlisib and Letrozole in ER+ Metastatic Breast Cancer. NPJ Breast Cancer 2019, 5, 31. [Google Scholar] [CrossRef]
- Pareja, F.; Brown, D.N.; Lee, J.Y.; Paula, A.D.C.; Selenica, P.; Bi, R.; Geyer, F.C.; Gazzo, A.; da Silva, E.M.; Vahdatinia, M.; et al. Whole-Exome Sequencing Analysis of the Progression from Non–Low-Grade Ductal Carcinoma in Situ to Invasive Ductal Carcinoma. Clin. Cancer Res. 2020, 26, 3682–3693. [Google Scholar] [CrossRef] [PubMed] [Green Version]
- Kan, Z.; Ding, Y.; Kim, J.; Jung, H.H.; Chung, W.; Lal, S.; Cho, S.; Fernandez-Banet, J.; Lee, S.K.; Kim, S.W.; et al. Multi-Omics Profiling of Younger Asian Breast Cancers Reveals Distinctive Molecular Signatures. Nat. Commun. 2018, 9, 1725. [Google Scholar] [CrossRef] [Green Version]
- Shah, S.P.; Roth, A.; Goya, R.; Oloumi, A.; Ha, G.; Zhao, Y.; Turashvili, G.; Ding, J.; Tse, K.; Haffari, G.; et al. The Clonal and Mutational Evolution Spectrum of Primary Triple Negative Breast Cancers. Nature 2012, 486, 395–399. [Google Scholar] [CrossRef] [PubMed] [Green Version]
- Banerji, S.; Cibulskis, K.; Rangel-Escareno, C.; Brown, K.K.; Carter, S.L.; Frederick, A.M.; Lawrence, M.S.; Sivachenko, A.Y.; Sougnez, C.; Zou, L.; et al. Sequence Analysis of Mutations and Translocations across Breast Cancer Subtypes. Nature 2012, 486, 405–409. [Google Scholar] [CrossRef] [PubMed] [Green Version]
- Stephens, P.J.; Tarpey, P.S.; Davies, H.; Van Loo, P.; Greenman, C.; Wedge, D.C.; Nik-Zainal, S.; Martin, S.; Varela, I.; Bignell, G.R.; et al. The Landscape of Cancer Genes and Mutational Processes in Breast Cancer. Nature 2012, 486, 400. [Google Scholar] [CrossRef] [PubMed] [Green Version]
- Li, Q.; Jiang, B.; Guo, J.; Shao, H.; Del Priore, I.S.; Chang, Q.; Kudo, R.; Li, Z.; Razavi, P.; Liu, B.; et al. INK4 Tumor Suppressor Proteins Mediate Resistance to CDK4/6 Kinase Inhibitors. Cancer Discov. 2022, 12, 356–371. [Google Scholar] [CrossRef]
- Bartha, Á.; Győrffy, B. TNMplot.Com: A Web Tool for the Comparison of Gene Expression in Normal, Tumor and Metastatic Tissues. Int. J. Mol. Sci. 2021, 22, 2622. [Google Scholar] [CrossRef]
- Thul, P.J.; Lindskog, C. The Human Protein Atlas: A Spatial Map of the Human Proteome. Protein Sci. 2018, 27, 233–244. [Google Scholar] [CrossRef] [Green Version]
- Fekete, J.T.; Győrffy, B. ROCplot.Org: Validating Predictive Biomarkers of Chemotherapy/Hormonal Therapy/Anti-HER2 Therapy Using Transcriptomic Data of 3,104 Breast Cancer Patients. Int. J. Cancer 2019, 145, 3140–3151. [Google Scholar] [CrossRef] [Green Version]
- Li, Q.; Birkbak, N.J.; Gyorffy, B.; Szallasi, Z.; Eklund, A.C. Jetset: Selecting the Optimal Microarray Probe Set to Represent a Gene. BMC Bioinform. 2011, 12, 474. [Google Scholar] [CrossRef]
- Mounir, M.; Lucchetta, M.; Silva, T.C.; Olsen, C.; Bontempi, G.; Chen, X.; Noushmehr, H.; Colaprico, A.; Papaleo, E. New Functionalities in the TCGAbiolinks Package for the Study and Integration of Cancer Data from GDC and GTEx. PLoS Comput. Biol. 2019, 15, e1006701. [Google Scholar] [CrossRef] [PubMed] [Green Version]
- Colaprico, A.; Silva, T.C.; Olsen, C.; Garofano, L.; Cava, C.; Garolini, D.; Sabedot, T.S.; Malta, T.M.; Pagnotta, S.M.; Castiglioni, I.; et al. TCGAbiolinks: An R/Bioconductor Package for Integrative Analysis of TCGA Data. Nucleic Acids Res. 2016, 44, e71. [Google Scholar] [CrossRef] [PubMed]
- Silva, T.C.; Colaprico, A.; Olsen, C.; D’Angelo, F.; Bontempi, G.; Ceccarelli, M.; Noushmehr, H. TCGA Workflow: Analyze Cancer Genomics and Epigenomics Data Using Bioconductor Packages. F1000Research 2016, 5, 1542. [Google Scholar] [CrossRef] [PubMed]
- Robinson, M.D.; McCarthy, D.J.; Smyth, G.K. EdgeR: A Bioconductor Package for Differential Expression Analysis of Digital Gene Expression Data. Bioinformatics 2010, 26, 139–140. [Google Scholar] [CrossRef] [PubMed] [Green Version]
- McCarthy, D.J.; Chen, Y.; Smyth, G.K. Differential Expression Analysis of Multifactor RNA-Seq Experiments with Respect to Biological Variation. Nucleic Acids Res. 2012, 40, 4288–4297. [Google Scholar] [CrossRef] [Green Version]
- Chen, Y.; Lun, A.T.L.; Smyth, G.K.; Burden, C.J.; Ryan, D.P.; Khang, T.F.; Lianoglou, S. From Reads to Genes to Pathways: Differential Expression Analysis of RNA-Seq Experiments Using Rsubread and the EdgeR Quasi-Likelihood Pipeline. F1000Research 2016, 5, 1438. [Google Scholar]
- Love, M.I.; Huber, W.; Anders, S. Moderated Estimation of Fold Change and Dispersion for RNA-Seq Data with DESeq2. Genome Biol. 2014, 15, 550. [Google Scholar] [CrossRef] [PubMed] [Green Version]
- Sturm, G.; Finotello, F.; Petitprez, F.; Zhang, J.D.; Baumbach, J.; Fridman, W.H.; List, M.; Aneichyk, T. Comprehensive Evaluation of Transcriptome-Based Cell-Type Quantification Methods for Immuno-Oncology. Bioinformatics 2019, 35, i436–i445. [Google Scholar] [CrossRef]
- Oliveros, J.C. VENNY. An Interactive Tool for Comparing Lists with Venn’s Diagrams. Available online: https://bioinfogp.cnb.csic.es/tools/venny/ (accessed on 24 March 2022).
- Huang, D.W.; Sherman, B.T.; Lempicki, R.A. Systematic and Integrative Analysis of Large Gene Lists Using DAVID Bioinformatics Resources. Nat. Protoc. 2008, 4, 44–57. [Google Scholar] [CrossRef]
- Huang, D.W.; Sherman, B.T.; Lempicki, R.A. Bioinformatics Enrichment Tools: Paths toward the Comprehensive Functional Analysis of Large Gene Lists. Nucleic Acids Res. 2009, 37, 1–13. [Google Scholar] [CrossRef] [Green Version]
- Wickham, H. Ggplot2: Elegant Graphics for Data Analysis; Springer: New York, NY, USA, 2016. [Google Scholar]
- Walter, W.; Sánchez-Cabo, F.; Ricote, M. GOplot: An R Package for Visually Combining Expression Data with Functional Analysis. Bioinformatics 2015, 31, 2912–2914. [Google Scholar] [CrossRef] [Green Version]
- Winter, S.C.; Buffa, F.M.; Silva, P.; Miller, C.; Valentine, H.R.; Turley, H.; Shah, K.A.; Cox, G.J.; Corbridge, R.J.; Homer, J.J.; et al. Relation of a Hypoxia Metagene Derived from Head and Neck Cancer to Prognosis of Multiple Cancers. Cancer Res. 2007, 67, 3441–3449. [Google Scholar] [CrossRef] [Green Version]
- Buffa, F.M.; Harris, A.L.; West, C.M.; Miller, C.J. Large Meta-Analysis of Multiple Cancers Reveals a Common, Compact and Highly Prognostic Hypoxia Metagene. Br. J. Cancer 2010, 102, 428. [Google Scholar] [CrossRef]
- Yoshihara, K.; Shahmoradgoli, M.; Martínez, E.; Vegesna, R.; Kim, H.; Torres-Garcia, W.; Treviño, V.; Shen, H.; Laird, P.W.; Levine, D.A.; et al. Inferring Tumour Purity and Stromal and Immune Cell Admixture from Expression Data. Nat. Commun. 2013, 4, 2612. [Google Scholar] [CrossRef] [PubMed] [Green Version]
- Aran, D.; Hu, Z.; Butte, A.J. XCell: Digitally Portraying the Tissue Cellular Heterogeneity Landscape. Genome Biol. 2017, 18, 220. [Google Scholar] [CrossRef] [PubMed] [Green Version]
- Becht, E.; Giraldo, N.A.; Lacroix, L.; Buttard, B.; Elarouci, N.; Petitprez, F.; Selves, J.; Laurent-Puig, P.; Sautès-Fridman, C.; Fridman, W.H.; et al. Estimating the Population Abundance of Tissue-Infiltrating Immune and Stromal Cell Populations Using Gene Expression. Genome Biol. 2016, 17, 218. [Google Scholar] [CrossRef]
- Daks, A.; Vasileva, E.; Fedorova, O.; Shuvalov, O.; Barlev, N.A. The Role of Lysine Methyltransferase SET7/9 in Proliferation and Cell Stress Response. Life 2022, 12, 362. [Google Scholar] [CrossRef]
- Tang, W.; Zhou, M.; Dorsey, T.H.; Prieto, D.A.; Wang, X.W.; Ruppin, E.; Veenstra, T.D.; Ambs, S. Integrated Proteotranscriptomics of Breast Cancer Reveals Globally Increased Protein-MRNA Concordance Associated with Subtypes and Survival. Genome Med. 2018, 10, 94. [Google Scholar] [CrossRef] [PubMed] [Green Version]
- Gu, Y.; Zhang, X.; Yu, W.; Dong, W. Oncogene or Tumor Suppressor: The Coordinative Role of Lysine Methyltransferase SET7/9 in Cancer Development and the Related Mechanisms. J. Cancer 2022, 13, 623–640. [Google Scholar] [CrossRef] [PubMed]
- Wang, L.Q.; Yu, P.; Li, B.; Guo, Y.H.; Liang, Z.R.; Zheng, L.L.; Yang, J.H.; Xu, H.; Liu, S.; Zheng, L.S.; et al. MiR-372 and MiR-373 Enhance the Stemness of Colorectal Cancer Cells by Repressing Differentiation Signaling Pathways. Mol. Oncol. 2018, 12, 1949–1964. [Google Scholar] [CrossRef] [PubMed] [Green Version]
- Schmid, P.; Adams, S.; Rugo, H.S.; Schneeweiss, A.; Barrios, C.H.; Iwata, H.; Diéras, V.; Hegg, R.; Im, S.-A.; Shaw Wright, G.; et al. Atezolizumab and Nab-Paclitaxel in Advanced Triple-Negative Breast Cancer. N. Engl. J. Med. 2018, 379, 2108–2121. [Google Scholar] [CrossRef] [PubMed]
- Schmid, P.; Cortes, J.; Pusztai, L.; McArthur, H.; Kümmel, S.; Bergh, J.; Denkert, C.; Park, Y.H.; Hui, R.; Harbeck, N.; et al. Pembrolizumab for Early Triple-Negative Breast Cancer. N. Engl. J. Med. 2020, 382, 810–821. [Google Scholar] [CrossRef] [PubMed]
- Pellegrino, B.; Hlavata, Z.; Migali, C.; De Silva, P.; Aiello, M.; Willard-Gallo, K.; Musolino, A.; Solinas, C. Luminal Breast Cancer: Risk of Recurrence and Tumor-Associated Immune Suppression. Mol. Diagnosis Ther. 2021, 25, 409–424. [Google Scholar] [CrossRef] [PubMed]
- Goldberg, J.; Pastorello, R.G.; Vallius, T.; Davis, J.; Cui, Y.X.; Agudo, J.; Waks, A.G.; Keenan, T.; McAllister, S.S.; Tolaney, S.M.; et al. The Immunology of Hormone Receptor Positive Breast Cancer. Front. Immunol. 2021, 12, 1515. [Google Scholar] [CrossRef] [PubMed]
- Frigo, D.E.; Bondesson, M.; Williams, C. Nuclear Receptors: From Molecular Mechanisms to Therapeutics. Essays Biochem. 2021, 65, 847. [Google Scholar] [CrossRef] [PubMed]
- Wysokinski, D.; Blasiak, J.; Pawlowska, E. Role of RUNX2 in Breast Carcinogenesis. Int. J. Mol. Sci. 2015, 16, 20969–20993. [Google Scholar] [CrossRef] [PubMed] [Green Version]
- Pepermans, R.A.; Prossnitz, E.R. ERα-Targeted Endocrine Therapy, Resistance and the Role of GPER. Steroids 2019, 152, 108493. [Google Scholar] [CrossRef]
- Direito, I.; Fardilha, M.; Helguero, L.A. Contribution of the Unfolded Protein Response to Breast and Prostate Tissue Homeostasis and Its Significance to Cancer Endocrine Response. Carcinogenesis 2018, 40, 203–215. [Google Scholar] [CrossRef]
- Direito, I.; Monteiro, L.; Melo, T.; Figueira, D.; Lobo, J.; Enes, V.; Moura, G.; Henrique, R.; Santos, M.A.S.; Jerónimo, C.; et al. Protein Aggregation Patterns Inform about Breast Cancer Response to Antiestrogens and Reveal the RNA Ligase RTCB as Mediator of Acquired Tamoxifen Resistance. Cancers 2021, 13, 3195. [Google Scholar] [CrossRef]
- La Belle Flynn, A.; Schiemann, W.P. Autophagy in Breast Cancer Metastatic Dormancy: Tumor Suppressing or Tumor Promoting Functions? J. Cancer Metastasis Treat. 2019, 2019, 43. [Google Scholar] [CrossRef] [PubMed]
- Vera-Ramirez, L.; Vodnala, S.K.; Nini, R.; Hunter, K.W.; Green, J.E. Autophagy Promotes the Survival of Dormant Breast Cancer Cells and Metastatic Tumour Recurrence. Nat. Commun. 2018, 9, 1944. [Google Scholar] [CrossRef]
- Cook, K.L.; Shajahan, A.N.; Clarke, R. Autophagy and Endocrine Resistance in Breast Cancer. Expert Rev. Anticancer Ther. 2011, 11, 1283. [Google Scholar] [CrossRef] [PubMed] [Green Version]
- Mishra, A.; Hourigan, D.; Lindsay, A.J. Inhibition of the Endosomal Recycling Pathway Downregulates HER2 Activation and Overcomes Resistance to Tyrosine Kinase Inhibitors in HER2-Positive Breast Cancer. Cancer Lett. 2022, 529, 153–167. [Google Scholar] [CrossRef]
- Hunter, F.W.; Barker, H.R.; Lipert, B.; Rothé, F.; Gebhart, G.; Piccart-Gebhart, M.J.; Sotiriou, C.; Jamieson, S.M.F. Mechanisms of Resistance to Trastuzumab Emtansine (T-DM1) in HER2-Positive Breast Cancer. Br. J. Cancer 2019, 122, 603–612. [Google Scholar] [CrossRef] [PubMed] [Green Version]
- Pietilä, M.; Sahgal, P.; Peuhu, E.; Jäntti, N.Z.; Paatero, I.; Närvä, E.; Al-Akhrass, H.; Lilja, J.; Georgiadou, M.; Andersen, O.M.; et al. SORLA Regulates Endosomal Trafficking and Oncogenic Fitness of HER2. Nat. Commun. 2019, 10, 2340. [Google Scholar] [CrossRef] [PubMed] [Green Version]
- Kontaki, H.; Talianidis, I. Lysine Methylation Regulates E2F1-Induced Cell Death. Mol. Cell 2010, 39, 152–160. [Google Scholar] [CrossRef] [PubMed]
- Lezina, L.; Aksenova, V.; Ivanova, T.; Purmessur, N.; Antonov, A.V.; Tentler, D.; Fedorova, O.; Garabadgiu, A.V.; Talianidis, I.; Melino, G.; et al. KMTase Set7/9 Is a Critical Regulator of E2F1 Activity upon Genotoxic Stress. Cell Death Differ. 2014, 21, 1889–1899. [Google Scholar] [CrossRef]
- Daks, A.; Mamontova, V.; Fedorova, O.; Petukhov, A.; Shuvalov, O.; Parfenyev, S.; Netsvetay, S.; Venina, A.; Kizenko, A.; Imyanitov, E.; et al. Set7/9 Controls Proliferation and Genotoxic Drug Resistance of NSCLC Cells. Biochem. Biophys. Res. Commun. 2021, 572, 41–48. [Google Scholar] [CrossRef] [PubMed]
- Chuikov, S.; Kurash, J.K.; Wilson, J.R.; Xiao, B.; Justin, N.; Ivanov, G.S.; McKinney, K.; Tempst, P.; Prives, C.; Gamblin, S.J.; et al. Regulation of P53 Activity through Lysine Methylation. Nature 2004, 432, 353–360. [Google Scholar] [CrossRef]
- Wang, C.; Shu, L.; Zhang, C.; Li, W.; Wu, R.; Guo, Y.; Yang, Y.; Kong, A.N. Histone Methyltransferase Setd7 Regulates Nrf2 Signaling Pathway by Phenethyl Isothiocyanate and Ursolic Acid in Human Prostate Cancer Cells. Mol. Nutr. Food Res. 2018, 62, e1700840. [Google Scholar] [CrossRef]
- Dhayalan, A.; Kudithipudi, S.; Rathert, P.; Jeltsch, A. Specificity Analysis-Based Identification of New Methylation Targets of the SET7/9 Protein Lysine Methyltransferase. Chem. Biol. 2011, 18, 111–120. [Google Scholar] [CrossRef]
- Ko, S.; Ahn, J.; Song, C.S.; Kim, S.; Knapczyk-Stwora, K.; Chatterjee, B. Lysine Methylation and Functional Modulation of Androgen Receptor by Set9 Methyltransferase. Mol. Endocrinol. 2011, 25, 433–444. [Google Scholar] [CrossRef] [PubMed] [Green Version]
- Gaughan, L.; Stockley, J.; Wang, N.; McCracken, S.R.; Treumann, A.; Armstrong, K.; Shaheen, F.; Watt, K.; McEwan, I.J.; Wang, C.; et al. Regulation of the androgen receptor by SET9-mediated methylation. Nucleic Acids Res. 2010, 39, 1266–1279. [Google Scholar] [CrossRef] [PubMed] [Green Version]
- Shen, C.; Wang, D.; Liu, X.; Gu, B.; Du, Y.; Wei, F.; Cao, L.; Song, B.; Lu, X.; Yang, Q.; et al. SET7/9 regulates cancer cell proliferation by influencing β-catenin stability. FASEB J. 2015, 29, 4313–4323. [Google Scholar] [CrossRef] [PubMed]
- Estève, P.-O.; Chin, H.G.; Benner, J.; Feehery, G.R.; Samaranayake, M.; Horwitz, G.A.; Jacobsen, S.E.; Pradhan, S. Regulation of DNMT1 stability through SET7-mediated lysine methylation in mammalian cells. Proc. Natl. Acad. Sci. USA 2009, 106, 5076–5081. [Google Scholar] [CrossRef] [PubMed] [Green Version]
- Xie, Q.; Bai, Y.; Wu, J.; Sun, Y.; Wang, Y.; Zhang, Y.; Mei, P.; Yuan, Z. Methylation-mediated regulation of E2F1 in DNA damage-induced cell death. J. Recept. Signal Transduct. 2011, 31, 139–146. [Google Scholar] [CrossRef]
- Calnan, D.R.; Webb, A.E.; White, J.L.; Stowe, T.R.; Goswami, T.; Shi, X.; Espejo, A.; Bedford, M.T.; Gozani, O.; Gygi, S.P.; et al. Methylation by Set9 modulates FoxO3 stability and transcriptional activity. Aging 2012, 4, 462–479. [Google Scholar] [CrossRef] [Green Version]
- Xie, Q.; Hao, Y.; Tao, L.; Peng, S.; Rao, C.; Chen, H.; You, H.; Dong, M.; Yuan, Z. Lysine methylation of FOXO3 regulates oxidative stress-induced neuronal cell death. EMBO Rep. 2012, 13, 371–377. [Google Scholar] [CrossRef] [PubMed] [Green Version]
- Fu, L.; Wu, H.; Cheng, S.Y.; Gao, D.; Zhang, L.; Zhao, Y. Set7 mediated Gli3 methylation plays a positive role in the activation of Sonic Hedgehog pathway in mammals. eLife 2016, 5, e15690. [Google Scholar] [CrossRef]
- Kim, Y.; Nam, H.J.; Lee, J.; Park, D.Y.; Kim, C.; Yu, Y.S.; Kim, D.; Park, S.W.; Bhin, J.; Hwang, D.; et al. Methylation-dependent regulation of HIF-1α stability restricts retinal and tumour angiogenesis. Nat. Commun. 2016, 7, 10347. [Google Scholar] [CrossRef] [Green Version]
- Pagans, S.; Kauder, S.E.; Kaehlcke, K.; Sakane, N.; Schroeder, S.; Dormeyer, W.; Trievel, R.C.; Verdin, E.; Schnolzer, M.; Ott, M. The Cellular Lysine Methyltransferase Set7/9-KMT7 Binds HIV-1 TAR RNA, Monomethylates the Viral Transactivator Tat, and Enhances HIV Transcription. Cell Host Microbe 2010, 7, 234–244. [Google Scholar] [CrossRef] [PubMed]
- Ali, I.; Ramage, H.; Boehm, D.; Dirk, L.M.; Sakane, N.; Hanada, K.; Pagans, S.; Kaehlcke, K.; Aull, K.; Weinberger, L.; et al. The HIV-1 Tat Protein Is Monomethylated at Lysine 71 by the Lysine Methyltransferase KMT7. J. Biol. Chem. 2016, 291, 16240–16248. [Google Scholar] [CrossRef] [PubMed] [Green Version]
- Masatsugu, T.; Yamamoto, K. Multiple lysine methylation of PCAF by Set9 methyltransferase. Biochem. Biophys. Res. Commun. 2009, 381, 22–26. [Google Scholar] [CrossRef] [PubMed]
- Vasileva, E.; Shuvalov, O.; Petukhov, A.; Fedorova, O.; Daks, A.; Nader, R.; Barlev, N. KMT Set7/9 is a new regulator of Sam68 STAR-protein. Biochem. Biophys. Res. Commun. 2020, 525, 1018–1024. [Google Scholar] [CrossRef] [PubMed]
- Kim, S.-K.; Lee, H.; Han, K.; Kim, S.C.; Choi, Y.; Park, S.-W.; Bak, G.; Lee, Y.; Choi, J.K.; Kim, T.-K.; et al. SET7/9 Methylation of the Pluripotency Factor LIN28A Is a Nucleolar Localization Mechanism that Blocks let-7 Biogenesis in Human ESCs. Cell Stem Cell 2014, 15, 735–749. [Google Scholar] [CrossRef] [PubMed] [Green Version]
- Balasubramaniyan, N.; Ananthanarayanan, M.; Suchy, F.J. Direct methylation of FXR by Set7/9, a lysine methyltransferase, regulates the expression of FXR target genes. Am. J. Physiol. Liver Physiol. 2012, 302, G937–G947. [Google Scholar] [CrossRef] [PubMed] [Green Version]
- Kassner, I.; Andersson, A.; Fey, M.; Tomas, M.; Ferrando-May, E.; Hottiger, M.O. SET7/9-dependent methylation of ARTD1 at K508 stimulates poly-ADP-ribose formation after oxidative stress. Open Biol. 2013, 3, 120173. [Google Scholar] [CrossRef] [Green Version]
- Maganti, A.V.; Maier, B.; Tersey, S.A.; Sampley, M.L.; Mosley, A.L.; Özcan, S.; Pachaiyappan, B.; Woster, P.M.; Hunter, C.S.; Stein, R.; et al. Transcriptional Activity of the Islet β Cell Factor Pdx1 Is Augmented by Lysine Methylation Catalyzed by the Methyltransferase Set7/9. J. Biol. Chem. 2015, 290, 9812–9822. [Google Scholar] [CrossRef] [Green Version]
- Aguilo, F.; Li, S.; Balasubramaniyan, N.; Sancho, A.; Benko, S.; Zhang, F.; Vashisht, A.; Rengasamy, M.; Andino, B.; Chen, C.-H.; et al. Deposition of 5-Methylcytosine on Enhancer RNAs Enables the Coactivator Function of PGC-1α. Cell Rep. 2016, 14, 479–492. [Google Scholar] [CrossRef] [PubMed] [Green Version]
- Cho, H.-S.; Suzuki, T.; Dohmae, N.; Hayami, S.; Unoki, M.; Yoshimatsu, M.; Toyokawa, G.; Takawa, M.; Chen, T.; Kurash, J.K.; et al. Demethylation of RB Regulator MYPT1 by Histone Demethylase LSD1 Promotes Cell Cycle Progression in Cancer Cells. Cancer Res 2011, 71, 655–660. [Google Scholar] [CrossRef] [Green Version]
- Carr, S.M.; Munro, S.; Kessler, B.; Oppermann, U.; La Thangue, N.B. Interplay between lysine methylation and Cdk phosphorylation in growth control by the retinoblastoma protein. EMBO J. 2010, 30, 317–327. [Google Scholar] [CrossRef] [PubMed]
- Munro, S.; Khaire, N.; Inche, A.; Carr, S.; La Thangue, N.B. Lysine methylation regulates the pRb tumour suppressor protein. Oncogene 2010, 29, 2357–2367. [Google Scholar] [CrossRef] [PubMed] [Green Version]
- Ea, C.-K.; Baltimore, D. Regulation of NF-κB activity through lysine monomethylation of p65. Proc. Natl. Acad. Sci. USA 2009, 106, 18972–18977. [Google Scholar] [CrossRef] [PubMed] [Green Version]
- Yang, X.-D.; Huang, B.; Li, M.; Lamb, A.; Kelleher, N.L.; Chen, L.-F. Negative regulation of NF-κB action by Set9-mediated lysine methylation of the RelA subunit. EMBO J. 2009, 28, 1055–1066. [Google Scholar] [CrossRef] [PubMed] [Green Version]
- Hong, X.; Huang, H.; Qiu, X.; Ding, Z.; Feng, X.; Zhu, Y.; Zhuo, H.; Hou, J.; Zhao, J.; Cai, W.; et al. Targeting posttranslational modifications of RIOK1 inhibits the progression of colorectal and gastric cancers. eLife 2018, 7, e29511. [Google Scholar] [CrossRef]
- Song, H.; Chu, J.W.; Park, S.C.; Im, H.; Park, I.-G.; Kim, H.; Lee, J.M. Isoform-Specific Lysine Methylation of RORα2 by SETD7 Is Required for Association of the TIP60 Coactivator Complex in Prostate Cancer Progression. Int. J. Mol. Sci. 2020, 21, 1622. [Google Scholar] [CrossRef] [PubMed] [Green Version]
- Hamidi, T.; Singh, A.K.; Veland, N.; Vemulapalli, V.; Chen, J.; Hardikar, S.; Bao, J.; Fry, C.J.; Yang, V.; Lee, K.A.; et al. Identification of Rpl29 as a major substrate of the lysine methyltransferase Set7/9. J. Biol. Chem. 2018, 293, 12770–12780. [Google Scholar] [CrossRef] [Green Version]
- Liu, X.; Wang, D.; Zhao, Y.; Tu, B.; Zheng, Z.; Wang, L.; Wang, H.; Gu, W.; Roeder, R.G.; Zhu, W.-G. Methyltransferase Set7/9 regulates p53 activity by interacting with Sirtuin 1 (SIRT1). Proc. Natl. Acad. Sci. USA 2011, 108, 1925–1930. [Google Scholar] [CrossRef] [PubMed] [Green Version]
- Elkouris, M.; Kontaki, H.; Stavropoulos, A.; Antonoglou, A.; Nikolaou, K.C.; Samiotaki, M.; Szantai, E.; Saviolaki, D.; Brown, P.J.; Sideras, P.; et al. SET9-Mediated Regulation of TGF-β Signaling Links Protein Methylation to Pulmonary Fibrosis. Cell Rep. 2016, 15, 2733–2744. [Google Scholar] [CrossRef] [Green Version]
- Fang, L.; Zhang, L.; Wei, W.; Jin, X.; Wang, P.; Tong, Y.; Li, J.; Du, J.X.; Wong, J. A Methylation-Phosphorylation Switch Determines Sox2 Stability and Function in ESC Maintenance or Differentiation. Mol. Cell 2014, 55, 537–551. [Google Scholar] [CrossRef] [Green Version]
- Stark, G.R.; Wang, Y.; Lu, T. Lysine methylation of promoter-bound transcription factors and relevance to cancer. Cell Res. 2010, 21, 375–380. [Google Scholar] [CrossRef] [PubMed]
- Wang, D.; Zhou, J.; Liu, X.; Lu, D.; Shen, C.; Du, Y.; Wei, F.-Z.; Song, B.; Lu, X.; Yu, Y.; et al. Methylation of SUV39H1 by SET7/9 results in heterochromatin relaxation and genome instability. Proc. Natl. Acad. Sci. USA 2013, 110, 5516–5521. [Google Scholar] [CrossRef] [PubMed] [Green Version]
- Couture, J.-F.; Collazo, E.; Hauk, G.; Trievel, R.C. Structural basis for the methylation site specificity of SET7/9. Nat. Struct. Mol. Biol. 2006, 13, 140–146. [Google Scholar] [CrossRef]
- Kouskouti, A.; Scheer, E.; Staub, A.; Tora, L.; Talianidis, I. Gene-Specific Modulation of TAF10 Function by SET9-Mediated Methylation. Mol. Cell 2004, 14, 175–182. [Google Scholar] [CrossRef] [PubMed] [Green Version]
- Ivanov, G.S.; Ivanova, T.; Kurash, J.; Ivanov, A.; Chuikov, S.; Gizatullin, F.; Herrera-Medina, E.M.; Rauscher, F.; Reinberg, D.; Barlev, N.A. Methylation-Acetylation Interplay Activates p53 in Response to DNA Damage. Mol. Cell. Biol. 2007, 27, 6756–6769. [Google Scholar] [CrossRef] [PubMed] [Green Version]
- Oudhoff, M.; Freeman, S.A.; Couzens, A.L.; Antignano, F.; Kuznetsova, E.; Min, P.H.; Northrop, J.P.; Lehnertz, B.; Barsyte-Lovejoy, D.; Vedadi, M.; et al. Control of the Hippo Pathway by Set7-Dependent Methylation of Yap. Dev. Cell 2013, 26, 188–194. [Google Scholar] [CrossRef] [Green Version]
- Zhang, W.J.; Wu, X.N.; Shi, T.T.; Xu, H.T.; Yi, J.; Shen, H.F.; Huang, M.F.; Shu, X.Y.; Wang, F.F.; Peng, B.L.; et al. Regulation of Transcription Factor Yin Yang 1 by SET7/9-Mediated Lysine Methylation. Sci. Rep. 2016, 6, 21718. [Google Scholar] [CrossRef] [Green Version]
- Wu, X.-N.; Shi, T.-T.; He, Y.; Wang, F.-F.; Sang, R.; Ding, J.-C.; Zhang, W.; Shu, X.-Y.; Shen, H.-F.; Yi, J.; et al. Methylation of transcription factor YY2 regulates its transcriptional activity and cell proliferation. Cell Discov. 2017, 3, 17035. [Google Scholar] [CrossRef] [PubMed]


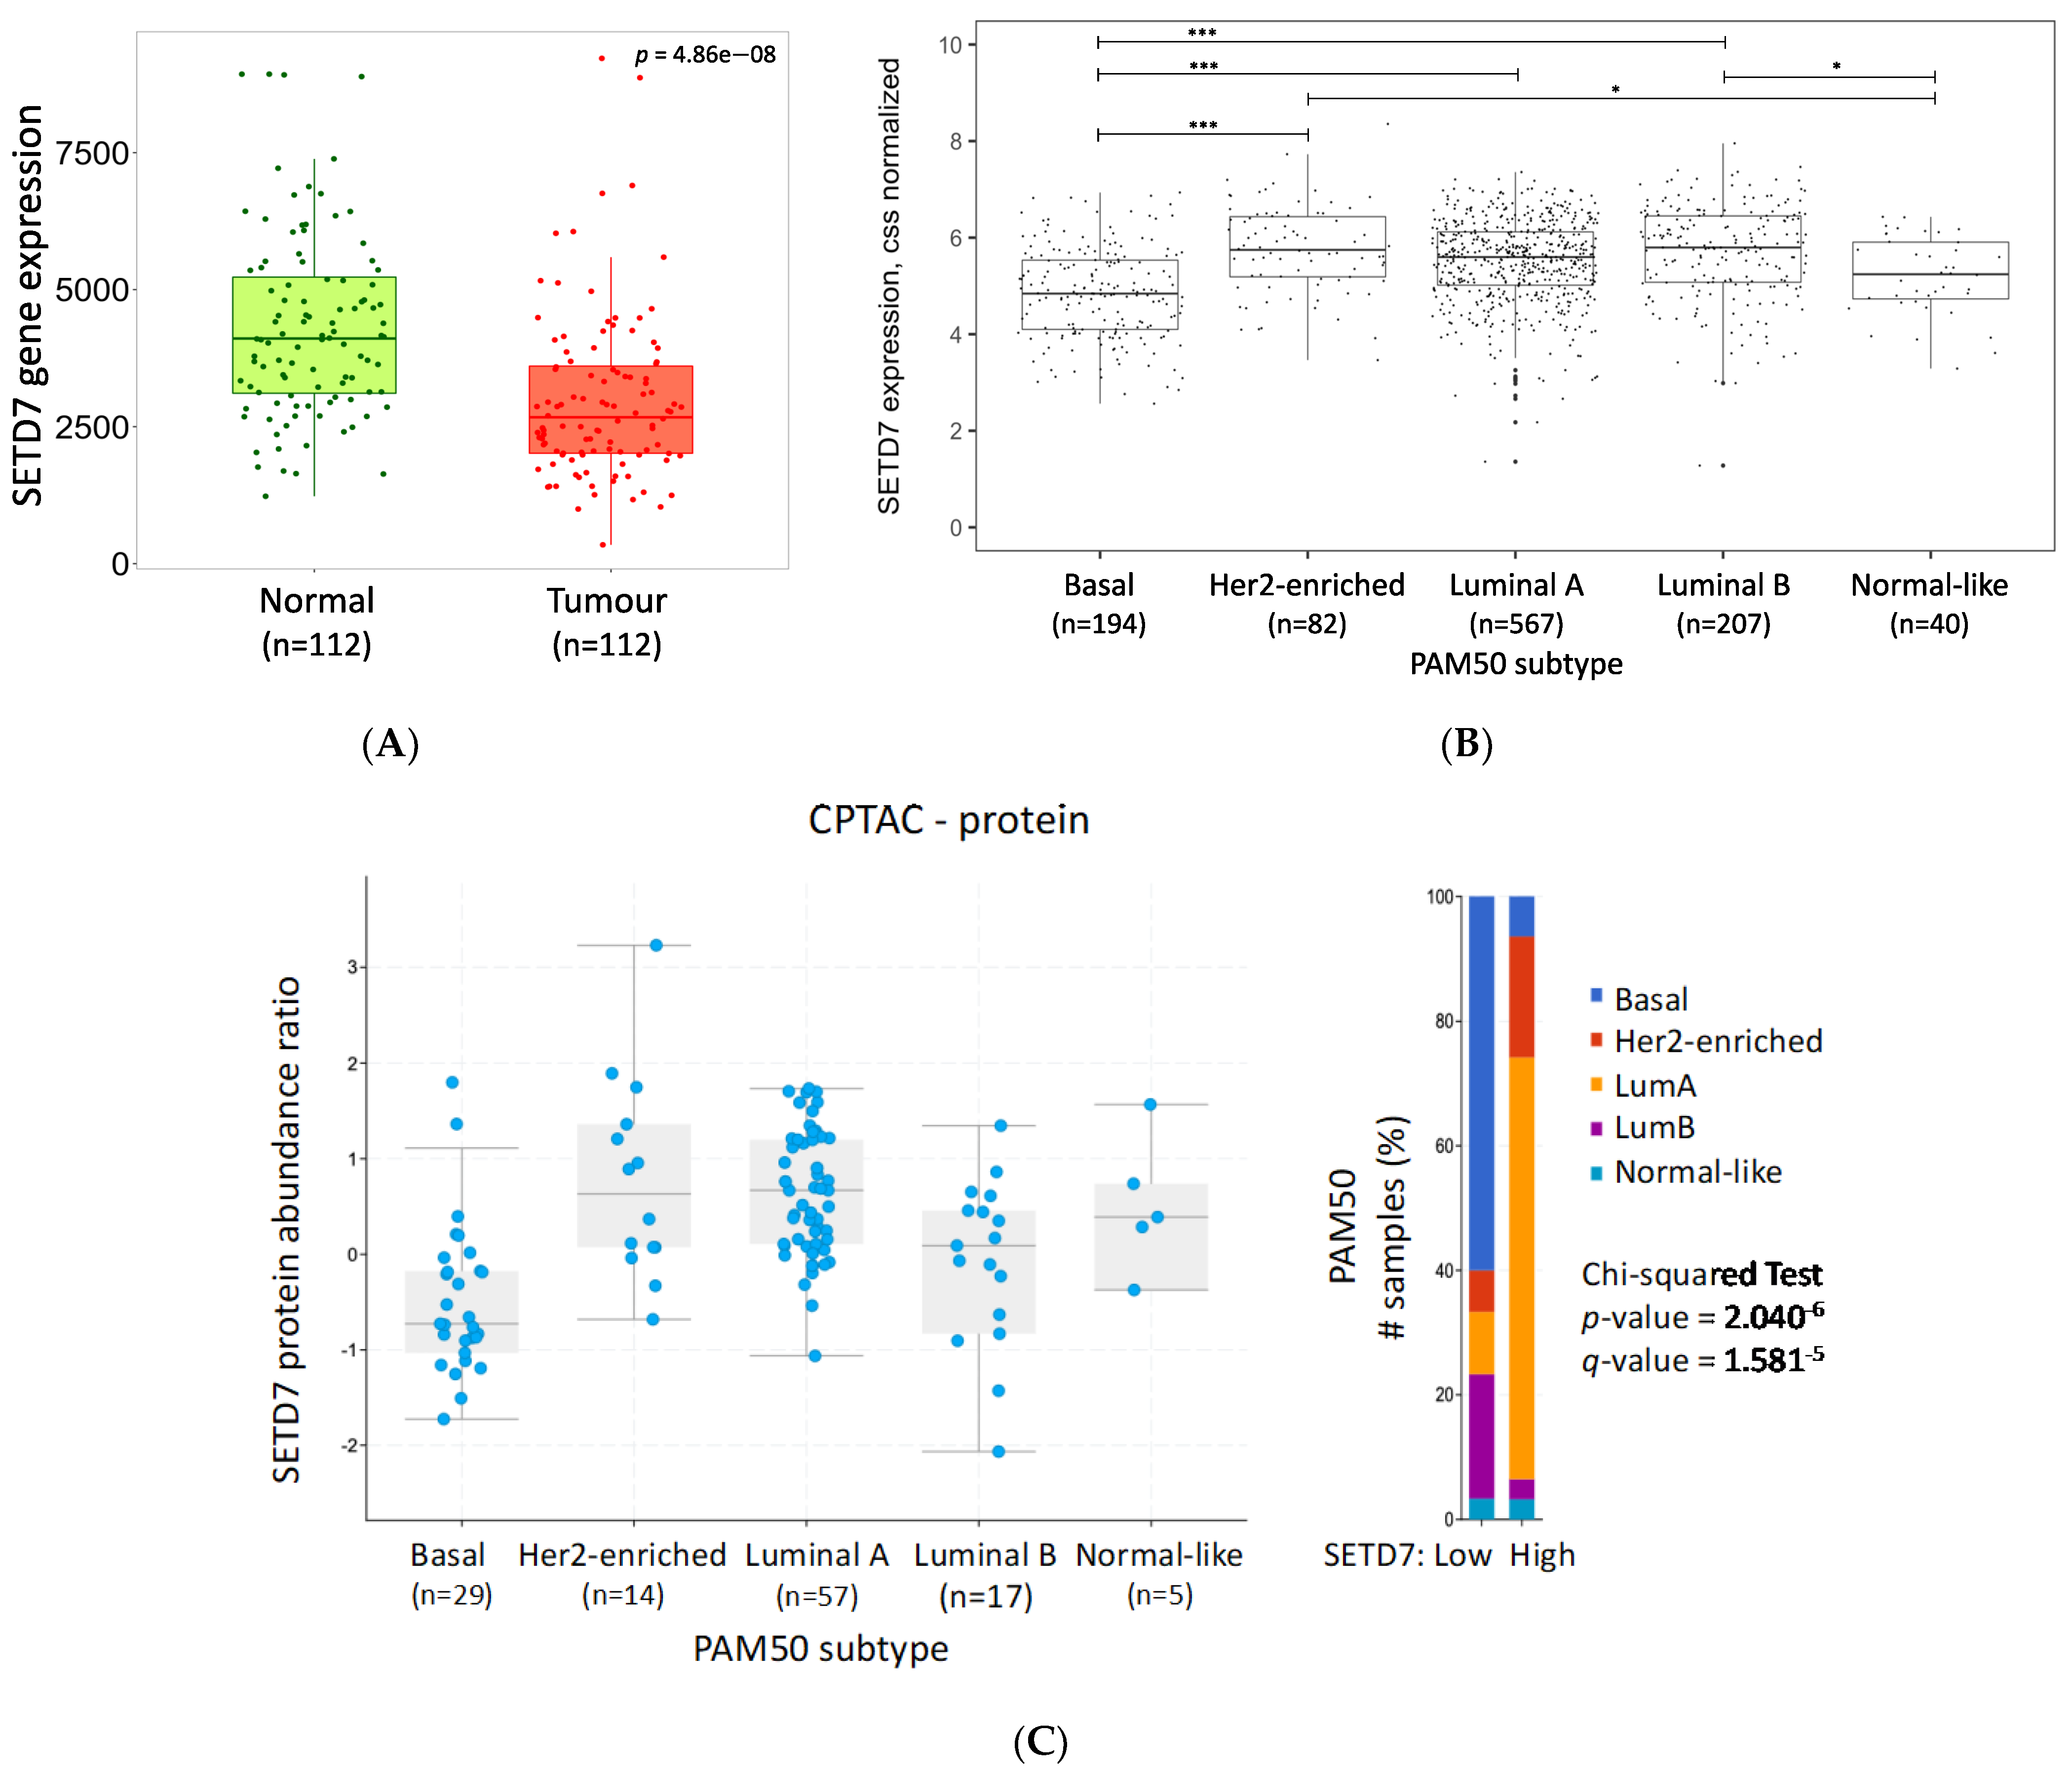
| cBioPortal (nSETD7 DE/n Total Samples) | PAM50 | Luminal A | Luminal B | Her2-Enriched | Basal | Normal-Like |
|---|---|---|---|---|---|---|
| CPTAC-RNA (61/122) | p = 1.59−5 q = 9.85−5 | High | Low | High | Low | High |
| CPTAC-protein (61/122) | p = 2.04−6 q = 1.58−5 | High | Low | High | Low | Unchanged |
| METABRIC (952/2976) | p = 4.23−3 q = 0.07 | High | Unchanged | High | Unchanged | Unchanged |
| SMC (84/187) | p = 1.45−7 q = 2.33−6 | High | High | High | Low | Unchanged |
| TCGA PanCancer Atlas (541/1084) | p < 10−10 q < 10−10 | High | High | High | Low | Unchanged |
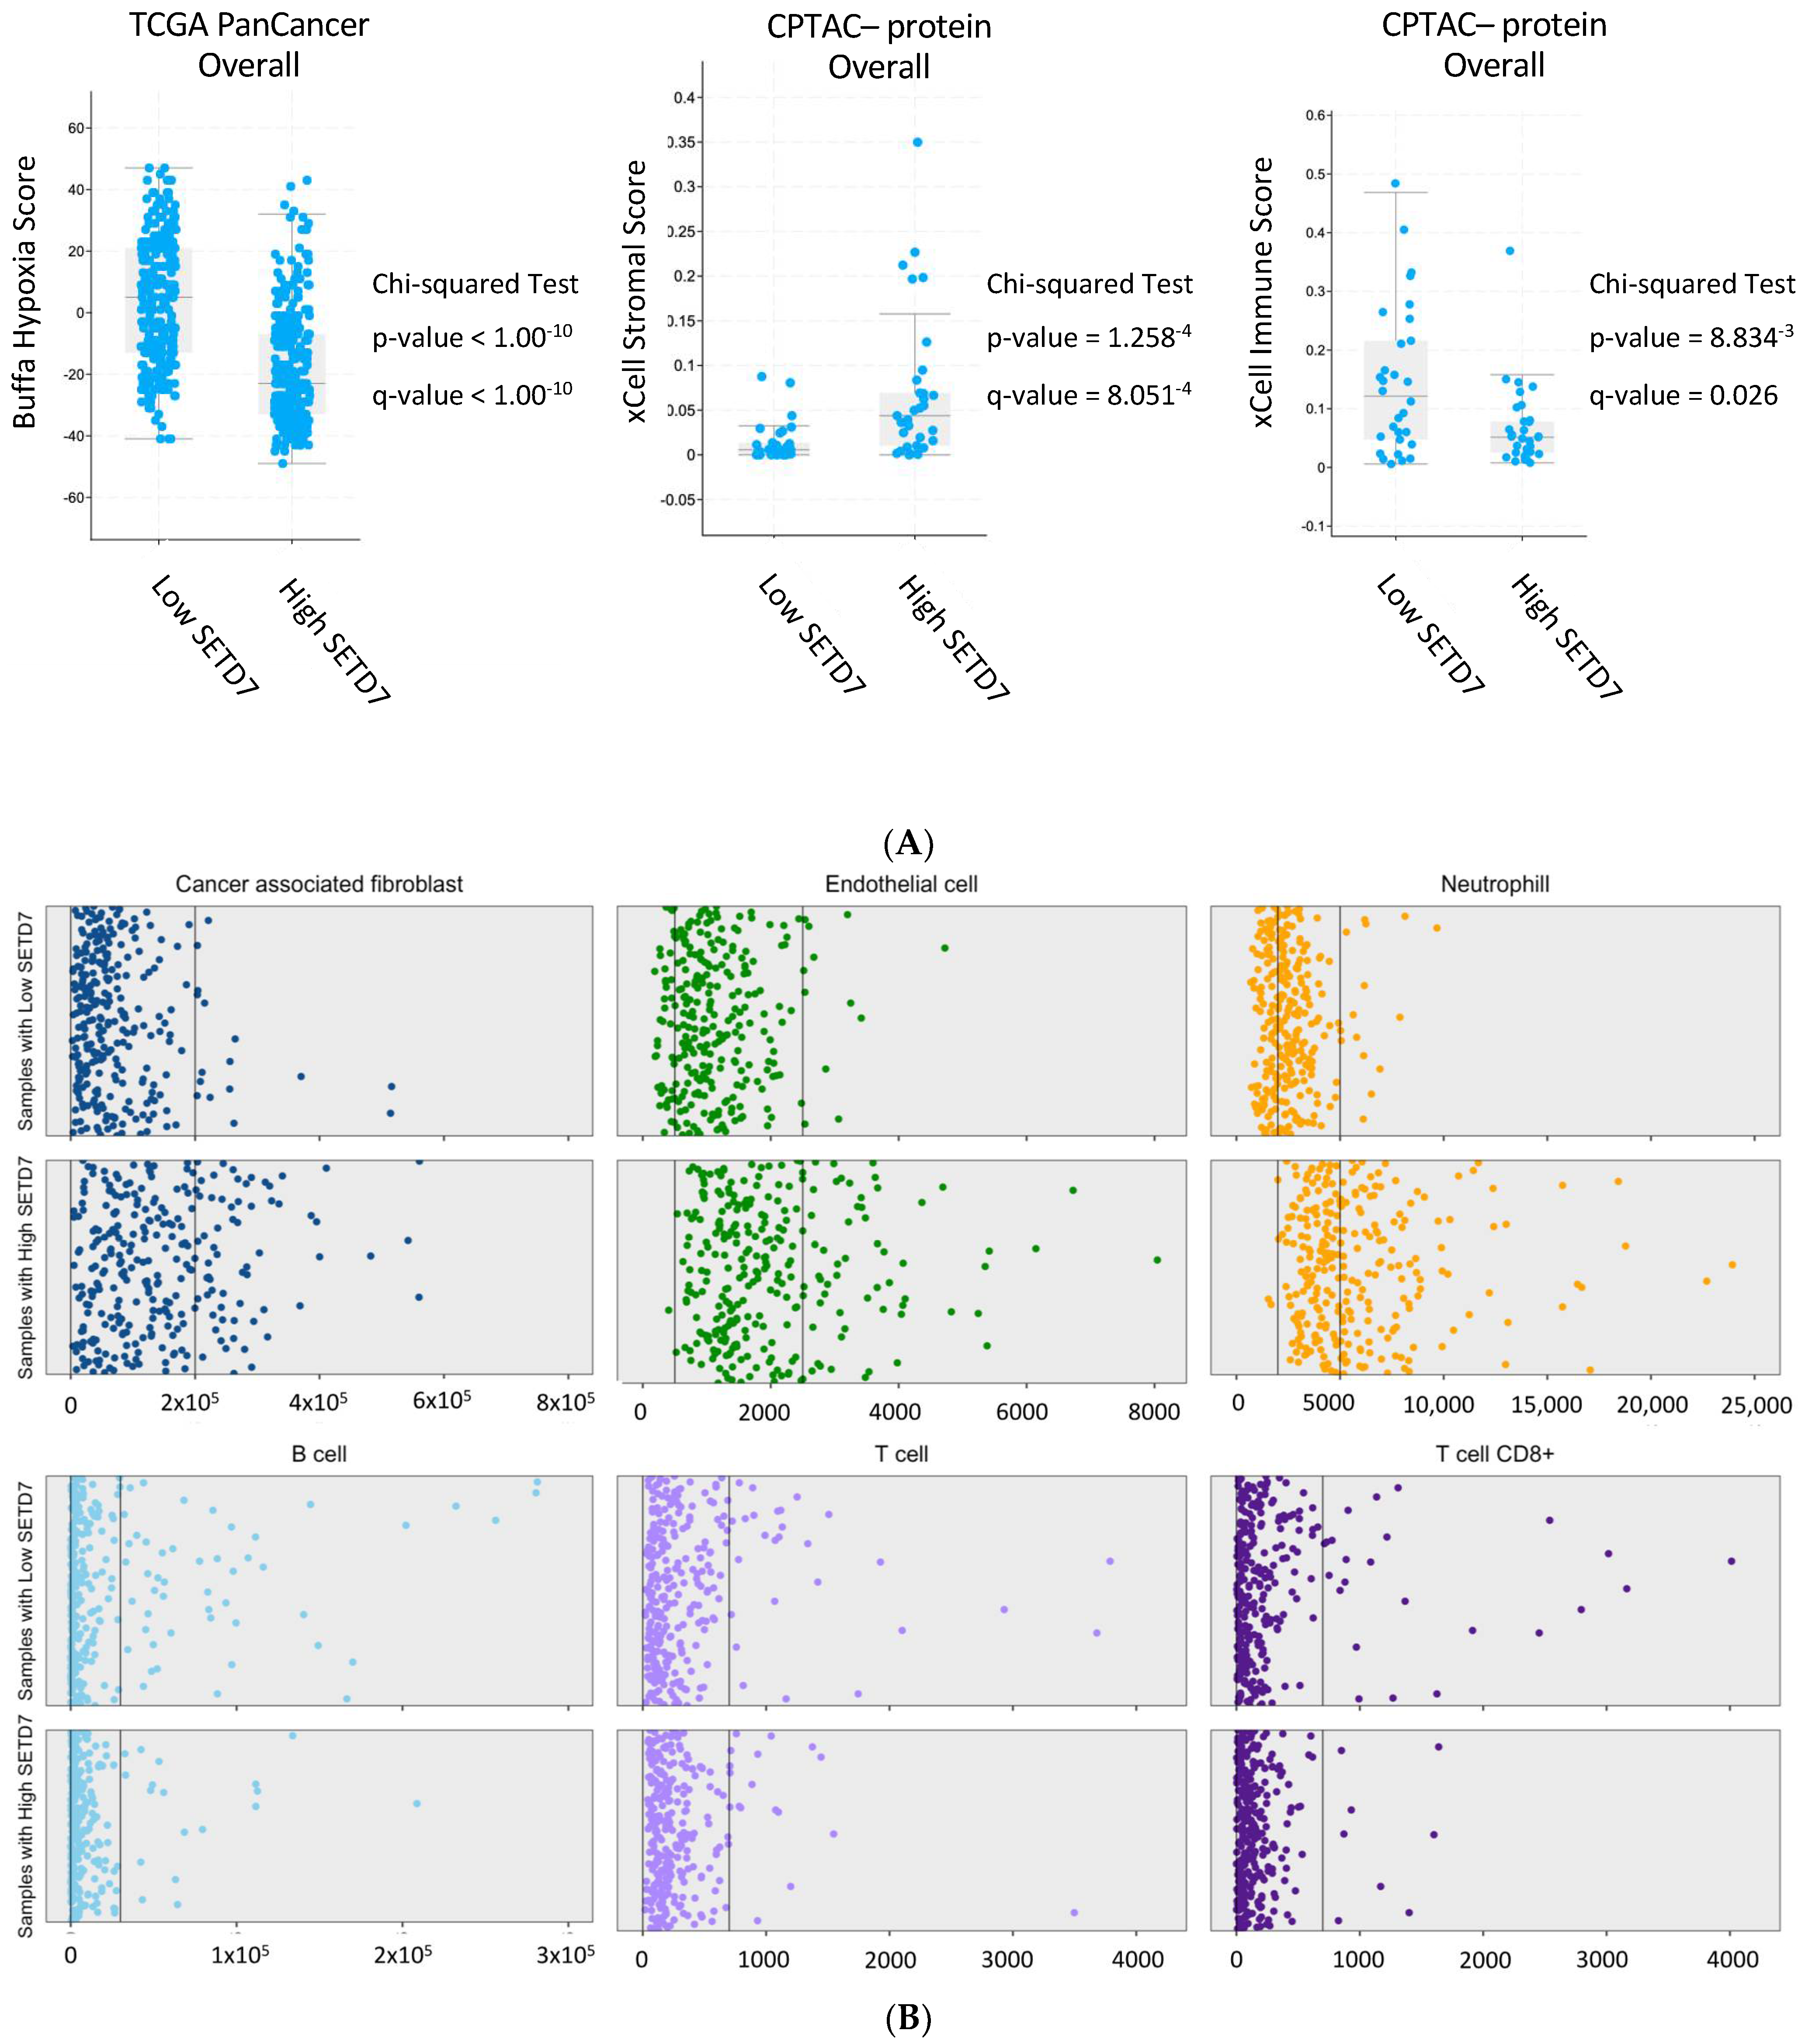
| Scores | CPTAC | TCGA PanCancer Atlas | High SETD7 Correlates with | ||||
|---|---|---|---|---|---|---|---|
| RNA | Protein | Overall | Luminal A | Luminal B | |||
| Overall | Luminal A | ||||||
| xCell Strommal | p = 4.06−4 q = 2.17−3 | p = 1.26−4 q = 8.05−4 | p = 2.09−3 q = 0.01 | NA | NA | NA | High |
| ESTIMATE Strommal | p = 1.83−3 q = 7.33−3 | p = 5.96−4 q = 2.38 −3 | p = 2.25−3 q = 0.01 | NA | NA | NA | High |
| xCell Immune | p = 0.01 q = 0.03 | p = 8.83−3 q = 0.03 | p = 0.68 q = 0.81 | NA | NA | NA | Low |
| Stemness | p = 0.01 q = 0.03 | p = 2.33−4 q = 5.96−4 | p = 0.06 q = 0.20 | NA | NA | NA | Low |
| Buffa Hypoxia | NA | NA | NA | p < 1.00−10 q < 1.00−10 | p < 1.00−10 q < 1.00−10 | p = 5.82−4 q = 0.01 | Low |
| Winter Hypoxia | NA | NA | NA | p < 1.00−10 q < 1.00−10 | p = 1.11−8 q = 2.51−7 | p = 6.36−4 q = 0.01 | Low |
Publisher’s Note: MDPI stays neutral with regard to jurisdictional claims in published maps and institutional affiliations. |
© 2022 by the authors. Licensee MDPI, Basel, Switzerland. This article is an open access article distributed under the terms and conditions of the Creative Commons Attribution (CC BY) license (https://creativecommons.org/licenses/by/4.0/).
Share and Cite
Monteiro, F.L.; Stepanauskaite, L.; Williams, C.; Helguero, L.A. SETD7 Expression Is Associated with Breast Cancer Survival Outcomes for Specific Molecular Subtypes: A Systematic Analysis of Publicly Available Datasets. Cancers 2022, 14, 6029. https://doi.org/10.3390/cancers14246029
Monteiro FL, Stepanauskaite L, Williams C, Helguero LA. SETD7 Expression Is Associated with Breast Cancer Survival Outcomes for Specific Molecular Subtypes: A Systematic Analysis of Publicly Available Datasets. Cancers. 2022; 14(24):6029. https://doi.org/10.3390/cancers14246029
Chicago/Turabian StyleMonteiro, Fátima Liliana, Lina Stepanauskaite, Cecilia Williams, and Luisa A. Helguero. 2022. "SETD7 Expression Is Associated with Breast Cancer Survival Outcomes for Specific Molecular Subtypes: A Systematic Analysis of Publicly Available Datasets" Cancers 14, no. 24: 6029. https://doi.org/10.3390/cancers14246029