Article

Manta Ray Foraging Optimization Transfer Learning-Based Gastric Cancer Diagnosis and Classification on Endoscopic Images

by
Fadwa Alrowais
1,
Saud S. Alotaibi
2,
Radwa Marzouk
3,
Ahmed S. Salama
4,
Mohammed Rizwanullah
5,*,
Abu Sarwar Zamani
5,
Amgad Atta Abdelmageed
5 and
Mohamed I. Eldesouki
6
1
Department of Computer Sciences, College of Computer and Information Sciences, Princess Nourah bint Abdulrahman University, P.O. Box 84428, Riyadh 11671, Saudi Arabia
2
Department of Information Systems, College of Computing and Information System, Umm Al-Qura University, Saudi Arabia
3
Department of Information Systems, College of Computer and Information Sciences, Princess Nourah bint Abdulrahman University, P.O. Box 84428, Riyadh 11671, Saudi Arabia
4
Department of Electrical Engineering, Faculty of Engineering & Technology, Future University in Egypt, New Cairo 11845, Egypt
5
Department of Computer and Self Development, Preparatory Year Deanship, Prince Sattam bin Abdulaziz University, AlKharj, Saudi Arabia
6
Department of Information System, College of Computer Engineering and Sciences, Prince Sattam bin Abdulaziz University, AlKharj, Saudi Arabia
*
Author to whom correspondence should be addressed.
Cancers 2022, 14(22), 5661; https://doi.org/10.3390/cancers14225661
Submission received: 11 October 2022 / Revised: 10 November 2022 / Accepted: 14 November 2022 / Published: 17 November 2022
(This article belongs to the Collection Artificial Intelligence and Machine Learning in Cancer Research)

Abstract

:

Simple Summary

This paper aims to develops a new Manta Ray Foraging Optimization Transfer Learning technique that is based on Gastric Cancer Diagnosis and Classification (MRFOTL-GCDC) using endoscopic images.

Abstract

Gastric cancer (GC) diagnoses using endoscopic images have gained significant attention in the healthcare sector. The recent advancements of computer vision (CV) and deep learning (DL) technologies pave the way for the design of automated GC diagnosis models. Therefore, this study develops a new Manta Ray Foraging Optimization Transfer Learning technique that is based on Gastric Cancer Diagnosis and Classification (MRFOTL-GCDC) using endoscopic images. For enhancing the quality of the endoscopic images, the presented MRFOTL-GCDC technique executes the Wiener filter (WF) to perform a noise removal process. In the presented MRFOTL-GCDC technique, MRFO with SqueezeNet model is used to derive the feature vectors. Since the trial-and-error hyperparameter tuning is a tedious process, the MRFO algorithm-based hyperparameter tuning results in enhanced classification results. Finally, the Elman Neural Network (ENN) model is utilized for the GC classification. To depict the enhanced performance of the presented MRFOTL-GCDC technique, a widespread simulation analysis is executed. The comparison study reported the improvement of the MRFOTL-GCDC technique for endoscopic image classification purposes with an improved accuracy of 99.25%.

1. Introduction

Gastric cancer (GC) is the fifth most common cancer across the globe and the third leading factor of tumor death [1]. There is an extensive geographic variance in its prevalence, with the maximum occurrence rate being in East Asian countries. In China, almost 498,000 new cases of GC have been identified in 2015, and here, it is the 2nd leading factor of cancer-related deaths. As surgical intervention, prior detection, and precise analysis are the decisive elements to reduce the GC death rates, robust and reliably actual pathology services are necessary [2]. However, there is a lack of anatomical diagnosticians globally and nationally, which has formed over-loaded workers, therefore affecting their diagnostic precision. A rising number of pathology labs have implemented digital slides in the form of whole slide images (WSI) in regular diagnostics [3]. The alteration of the practices from microscopes to WSIs has laid the foundation for utilizing artificial intelligence (AI)-guided mechanisms in pathology treatments to address the human limits and minimize the diagnostic faults [4]. This has permitted the growth of new techniques, such as AI through deep learning. The research has concentrated on formulating techniques that could flag suspicious zones, urging pathologists to scrutinize the tissue completely at high magnifications or by using immunohistochemical (IHC) test if they are needed to accomplish a precise analysis [5].
Radiotherapists have started to utilize this technology for reading medical images for several ailments with the growth of AI [6]. AI has a set of inter-related practical methods which overlap the fields of statistics and mathematics, and mathematical functions are considered to be appropriate for radiology due to the pixel values of an MRI image which are computable. Artificial neural networks (ANNs), for example, are one of the methods that is utilized in the sub-discipline of classifier mechanisms [7]. The ideology of deep learning (DL) has garnered substantial interest in ANNs. Several sorts of sub-techniques considering the advancements in memory enhancement, fast processing, and novel model features and models have been constantly upgraded and developed [8]. The common ANN that is utilized by DL is the convolutional neural network (CNNs), which is the most suitable neural network (NNs) for radiology when the images are the main units of evaluation [9]. A CNN can be biologically inspired networks which mimic the brain cortex behavior, which has a complicated structure of cells that are sensitive to smaller areas of the visual domain [10]. The CNN does not just contain a sequence of layers which would map image inputs into desirable end points, it also studies high-level imaging features.
This study focuses on the development of the new Manta Ray Foraging Optimization Transfer learning-based Gastric Cancer Diagnosis and Classification (MRFOTL-GCDC) method using endoscopic images. The presented MRFOTL-GCDC technique executes the Wiener filter (WF) to achieve a noise removal process. Moreover, the MRFOTL-GCDC technique makes use of the SqueezeNet model to derive the feature vectors, and the MRFO algorithm is exploited as a hyperparameter optimizer. Furthermore, the Elman Neural Network (ENN) method was utilized for the GC classification. For ensuring the improvised performance of the presented MRFOTL-GCDC method, a widespread simulation analysis has been carried out.

2. Related Works

In [11], a noble openly accessible Gastric Histopathology Sub-size Image Database (GasHisSDB) was established for identifying the classifier outcomes. For proving that the techniques of distinct periods during the domain of image classifiers were discrepant when they were using GasHisSDB, the authors chose a variety of classifications for the calculation. Seven typical ML techniques, three CNN techniques, and a new transformer-based classification were selected to test on image classifier task. Sharanyaa et al. [12] concentrated on developing a robust predictive system which utilizes an image processing approach for detecting the initial stage of cancer with lightweight approaches. The testing images in the pathology dataset termed the BioGPS were pre-processed primarily to remove the noisy part of the pixels. This was realized in deep Color-Net (Deep CNET) technique which relates the trained vector with a testing vector to determine a maximal correlation. With a superior match score, the classifier outcomes defines the occurrence of GC and emphasizes the spread region in the provided test pathology data.
Qiu et al. [13] intended to improve the performance of GC analysis, thus, the DL techniques were tentatively utilized for supporting doctors in the analysis of GC. The lesion instances in the images were each noticeable by several endoscopists who had several years of medical experience. Afterward, the gained trained set was used as an input for the CNN to train on, and at last, they obtained the technique DLU-Net. In [14], a fully automated system was executed to distinguish between the differentiated or undistinguished and non-mucinous or mucinous cancer varieties from a GC tissue whole-slide image in the Cancer Genome Atlas (TCGA) stomach adenocarcinoma database (TCGA-STAD). Valieris et al. [15] examined an effectual ML technique that could forecast DRD in a histopathological image (HSI). The efficacy of our technique is demonstrated by assuming the recognition of MMRD and HRD in breast and GC tissues, correspondingly.
Meier et al. [16] examined the novel approaches for predicting the risk for cancer-specified death in the digital image of immunohistochemically (IHC) stained tissue microarrays (TMAs). Especially, the authors estimated a cohort of 248 GC patients utilizing CNNs in an end-to-end weakly supervised system which was self-determined by a particular pathologist. For the account of the time-to-event features of the output data, the authors established novel survival techniques for guiding the trained network. An et al. [17] intended to validate and train real-time FCNs to allocate a resection margin of early GC (EGC) in indigo carmine chromoendoscopy (CE) or white light endoscopy (WLE), and they estimated their efficiency and that of the magnifying endoscopy with narrow-band imaging (ME-NBI). The authors gathered the CE and WLE images of the EGC lesions to train the FCN technique in ENDOANGEL. From the literature, it is apparent that the existing approaches do not concentrate on the hyperparameter selection process which primarily affect the performance of the classification models. Specifically, the hyperparameters such as the epoch count, batch size, and learning rate selection become important when one is trying to accomplish an improved performance. As the manual trial-and-error technique for hyperparameter tuning is a tiresome and erroneous process, metaheuristic algorithms can be applied. Therefore, in this work, we employ an MRFO algorithm for the parameter selection of the SqueezeNet model.

3. The Proposed Model

In this study, an automated GC classification using an MRFOTL-GCDC technique has been developed for endoscopic images. The presented MRFOTL-GCDC technique exploited the endoscopic images for GC classifications to be made. To accomplish this, the MRFOTL-GCDC technique encompasses the image pre-processing, the SqueezeNet feature extraction, the MRFO hyperparameter tuning, and the ENN classification. Figure 1 defines the block diagram of the MRFOTL-GCDC system.

3.1. Stage I: Pre-Processing

In the beginning, the presented MRFOTL-GCDC technique exploited the WF technique to perform a noise eradication process. Noise elimination can be referred as an image pre-processing method which intends to improvise the attributes of the image which has been corrupted through noise [18]. The specific case will be an adaptive filter where the denoising process was reliant on the noise content in the image, locally. Assuming that the images which are corrupted were denoted as I ^ x , y , the noise variance over whole has been represented as σ y 2 , the local mean can be represented as μ L ^ regarding the pixel window, and the local variance from the window was rendered by σ ^ y 2 . Then, the probable method of denoising an image is exhibited below:
I ^ ^ = I ^ x , y σ y 2 σ ^ y 2 I ^ x , y μ L ^  
At this point, if the noise variance across the image was equivalent to 0, σ y 2 = 0 = > I ^ ^ = I ^ x , y . If the global noise variance was less than this, and local variance was more than the global variance, the ratio was nearly equivalent to 1. If σ ^ y 2 σ y 2 , then I ^ ^ = I ^ x , y . It was assumed that a higher local variance exemplifies the presence of the edge from the image window. During this case, if the global and local variances were matching, then the formula formulates I ^ ^ = μ L ^   a s   σ ^ y 2 σ y 2 .

3.2. Stage II: Feature Extraction

At this stage, the MRFOTL-GCDC technique has utilized the SqueezeNet model for the feature extraction. Squeezenet is a type of DNN that has eighteen layers and can be mainly used in computer vision (CV) and image processing programs [19]. The main aims and the purposes of the authors, in the progression of SqueezeNet, were to frame the small NN that has some variables and to perform an easy transmission over the computer network (necessitating minimal bandwidth). Additionally, it must also fit into computer memory, effortlessly (necessitating minimum memory). The primary edition of this structure has been accomplished on top of a DL method that is named Caffe. After a while, the researchers started to use this structure in several publicly available DL structures. Initially, SqueezeNet was labelled, where it is compared with AlexNet. Both SqueezeNet and AlexNet were two distinct DNN structures until now, and they have one common feature, which is termed precision, whenever they are predicting the ImageNet image dataset. The main goal of SqueezeNet was to reach a higher accuracy level while utilizing fewer variables. To achieve this, three processes were employed. Mainly, a filter of size 3 × 3 was replaced by a filter of size 1 × 1 with fewer variables. Then, the number of input channels was minimized to 3 × 3 filters. Lastly, the subsampled function was executed at the final stages to obtain a convolution layer which had a large activation function. SqueezeNet can depend on the idea of an Inception component module for devising a Fire component that has expansion and squeeze layers. Figure 2 establishes the architecture of SqueezeNet method.
In this study, the MRFOTL-GCDC technique designed the MRFO algorithm for the parameter tuning. Zhao et al. [20] proposed an MRFO that was inspired by the foraging approach of a giant marine creature named a Manta ray which are shaped like a bird. This initializes a population of candidate solutions, similar to how Manta rays individually search for better locations. The plankton is focused on; the best solution attained at any point represents the plankton. The search process comprises three stages: somersault foraging, cyclone foraging and chain foraging.

3.2.1. Chain Foraging Phase

In the chain foraging process, each fish in the Manta rays’ school follow the front individual by moving in foraging chain and a better solution has not been found until now. The mathematical formula for chain foraging can be given below:
x i t + 1 = x i t + r x b x i t + a x b x i t i = 1 x i t + r x i 1 t x i t + a x b x i t i = 2 ,   ,   N  
a = 2 r   log   r
where x i t indicates the i - t h individual location at the iteration t ,   r denotes the random vector belongs to zero and one, and x b signifies the better location that has been attained so far. The upgraded location x i t + 1 can be implemented using the existing location x i t and the preceding location x i 1 t and the better location.

3.2.2. Cyclone Foraging

The Manta ray individual creates a foraging chain and makes a spiral movement when it searches for food sources. In this step, flocked Manta rays pursue the Manta ray that faces the chain and chase the spiral pattern to approach the prey. This spiral motion of the Manta ray in terms of its behavior in the n dimension search space can be mathematically devised below:
x i t + 1 = x b + r x b x i t + B x b x i t i = 1 x b + r x i 1 t x i t + B x b x i t i = 2 ,     ,   N
B = 2   exp   r 1 T t + 1 T ·   sin   2 π r 1 ,  
where B indicates the weight coefficient, T denotes the overall iteration count, and r ,   r 1 0 ,   1 characterize a random number. Cyclone foraging allows for the individual Manta rays to use the potential area and obtain a better solution [21]. Furthermore, for better exploration, every individual was forced to discover a novel location that was located farther from its existing location by allocating a reference location that was randomly determined as follows:
x i t + 1 = x r a n d + r x r a n d x i t + B x r a n d x i t i = 1 x r a n d + r x i 1 t x i t + B x r a n d x i t i = 2 , , N  
x r a n d = l j + r u j l j ,  
From the expression, x r a n d denotes a random location that was indiscriminately located constrained using the lower and upper limits u i and l i , correspondingly.

3.2.3. Somersault Foraging

Each Manta ray individually swims backward and forward to pivot to upgrade its position by somersaulting around the better location that was attained in the following:
x i t + 1 = x i t + ψ r 2 x b r 3 x i t i = 1 , , N ,  
where ψ , which is named as the somersault component, defines the range of the somersault where the Manta ray can swim ψ = 2 ,   r 2 and r 3 represent the random values that lie in between zero and one. Thus, the behaviors of somersault foraging allow for the Manta ray to freely move in a novel domain amongst the position and symmetrical position that is based on the better location. As well, the somersault range was proportionate to the iteration since it decreases as the iteration rises.

3.3. Stage III: GC Classification

Finally, the MRFOTL-GCDC technique has utilized the ENN model for classification purposes. The ENN technique includes hidden, input, context, and output layers [22]. The major configuration of the ENN method can be comparable to the FFNN, wherein the connection except context layer is same as the MLP. The context layer obtains inputs from the outputs of the hidden unit to store the earlier value of the hidden unit. The output weight, the external input, and the context weight matrixes were denoted as W h i ,   W h c and W h 0 , correspondingly. The output and input dimension layers are characterized by n , i.e., the dimension of the context layer was m   and   x 1 t = [ x 1 1 t , x 2 1 t , . , x n 1 t ] T , y t = [ y 1 t ,   y 2 t ,   ,   y n t ] T .
The input unit of the ENN can be defined using the subsequent formula:
u i l = e i l ,   i = 1 , 2 ,   ,   n  
Now, l defines the input and output units at l round. Next, k - t h hidden unit in the network is shown below:
v k l = j = 1 N ω k j 1 l x j c l + i = 1 n ω k i 2 l u i l k = 1 , 2 ,   ,   N    
Here, x j c l defines the signal viz., which are distributed from the k - t h context nodes, ω k j 1 l describes i - t h and j - t h weights of the hidden state directed from o - t h node. Lastly, the outcome of hidden unit is fed into the context layer that is given below:
W k l = f 0 v ¯ k l  
Now,
v ¯ k l = v k l max v k l
The abovementioned formula denotes the normalized value of the hidden unit. The succeeding layer represents the context layer as follows:
C k l = β C , l 1 + W k l 1 ,   k = 1 , 2 ,   ,   N
From the expression, W k denotes the gain of the self-connected feedback [0, 1]. Lastly, the output unit in the network was denoted by:
y 0 l = k = 1 N ω o k 3 l W k , l ,   0 = 1 , 2 ,   ,   n  
From the expression, ω o k 3 defines the weight connected from k - t h into o - t h layers.

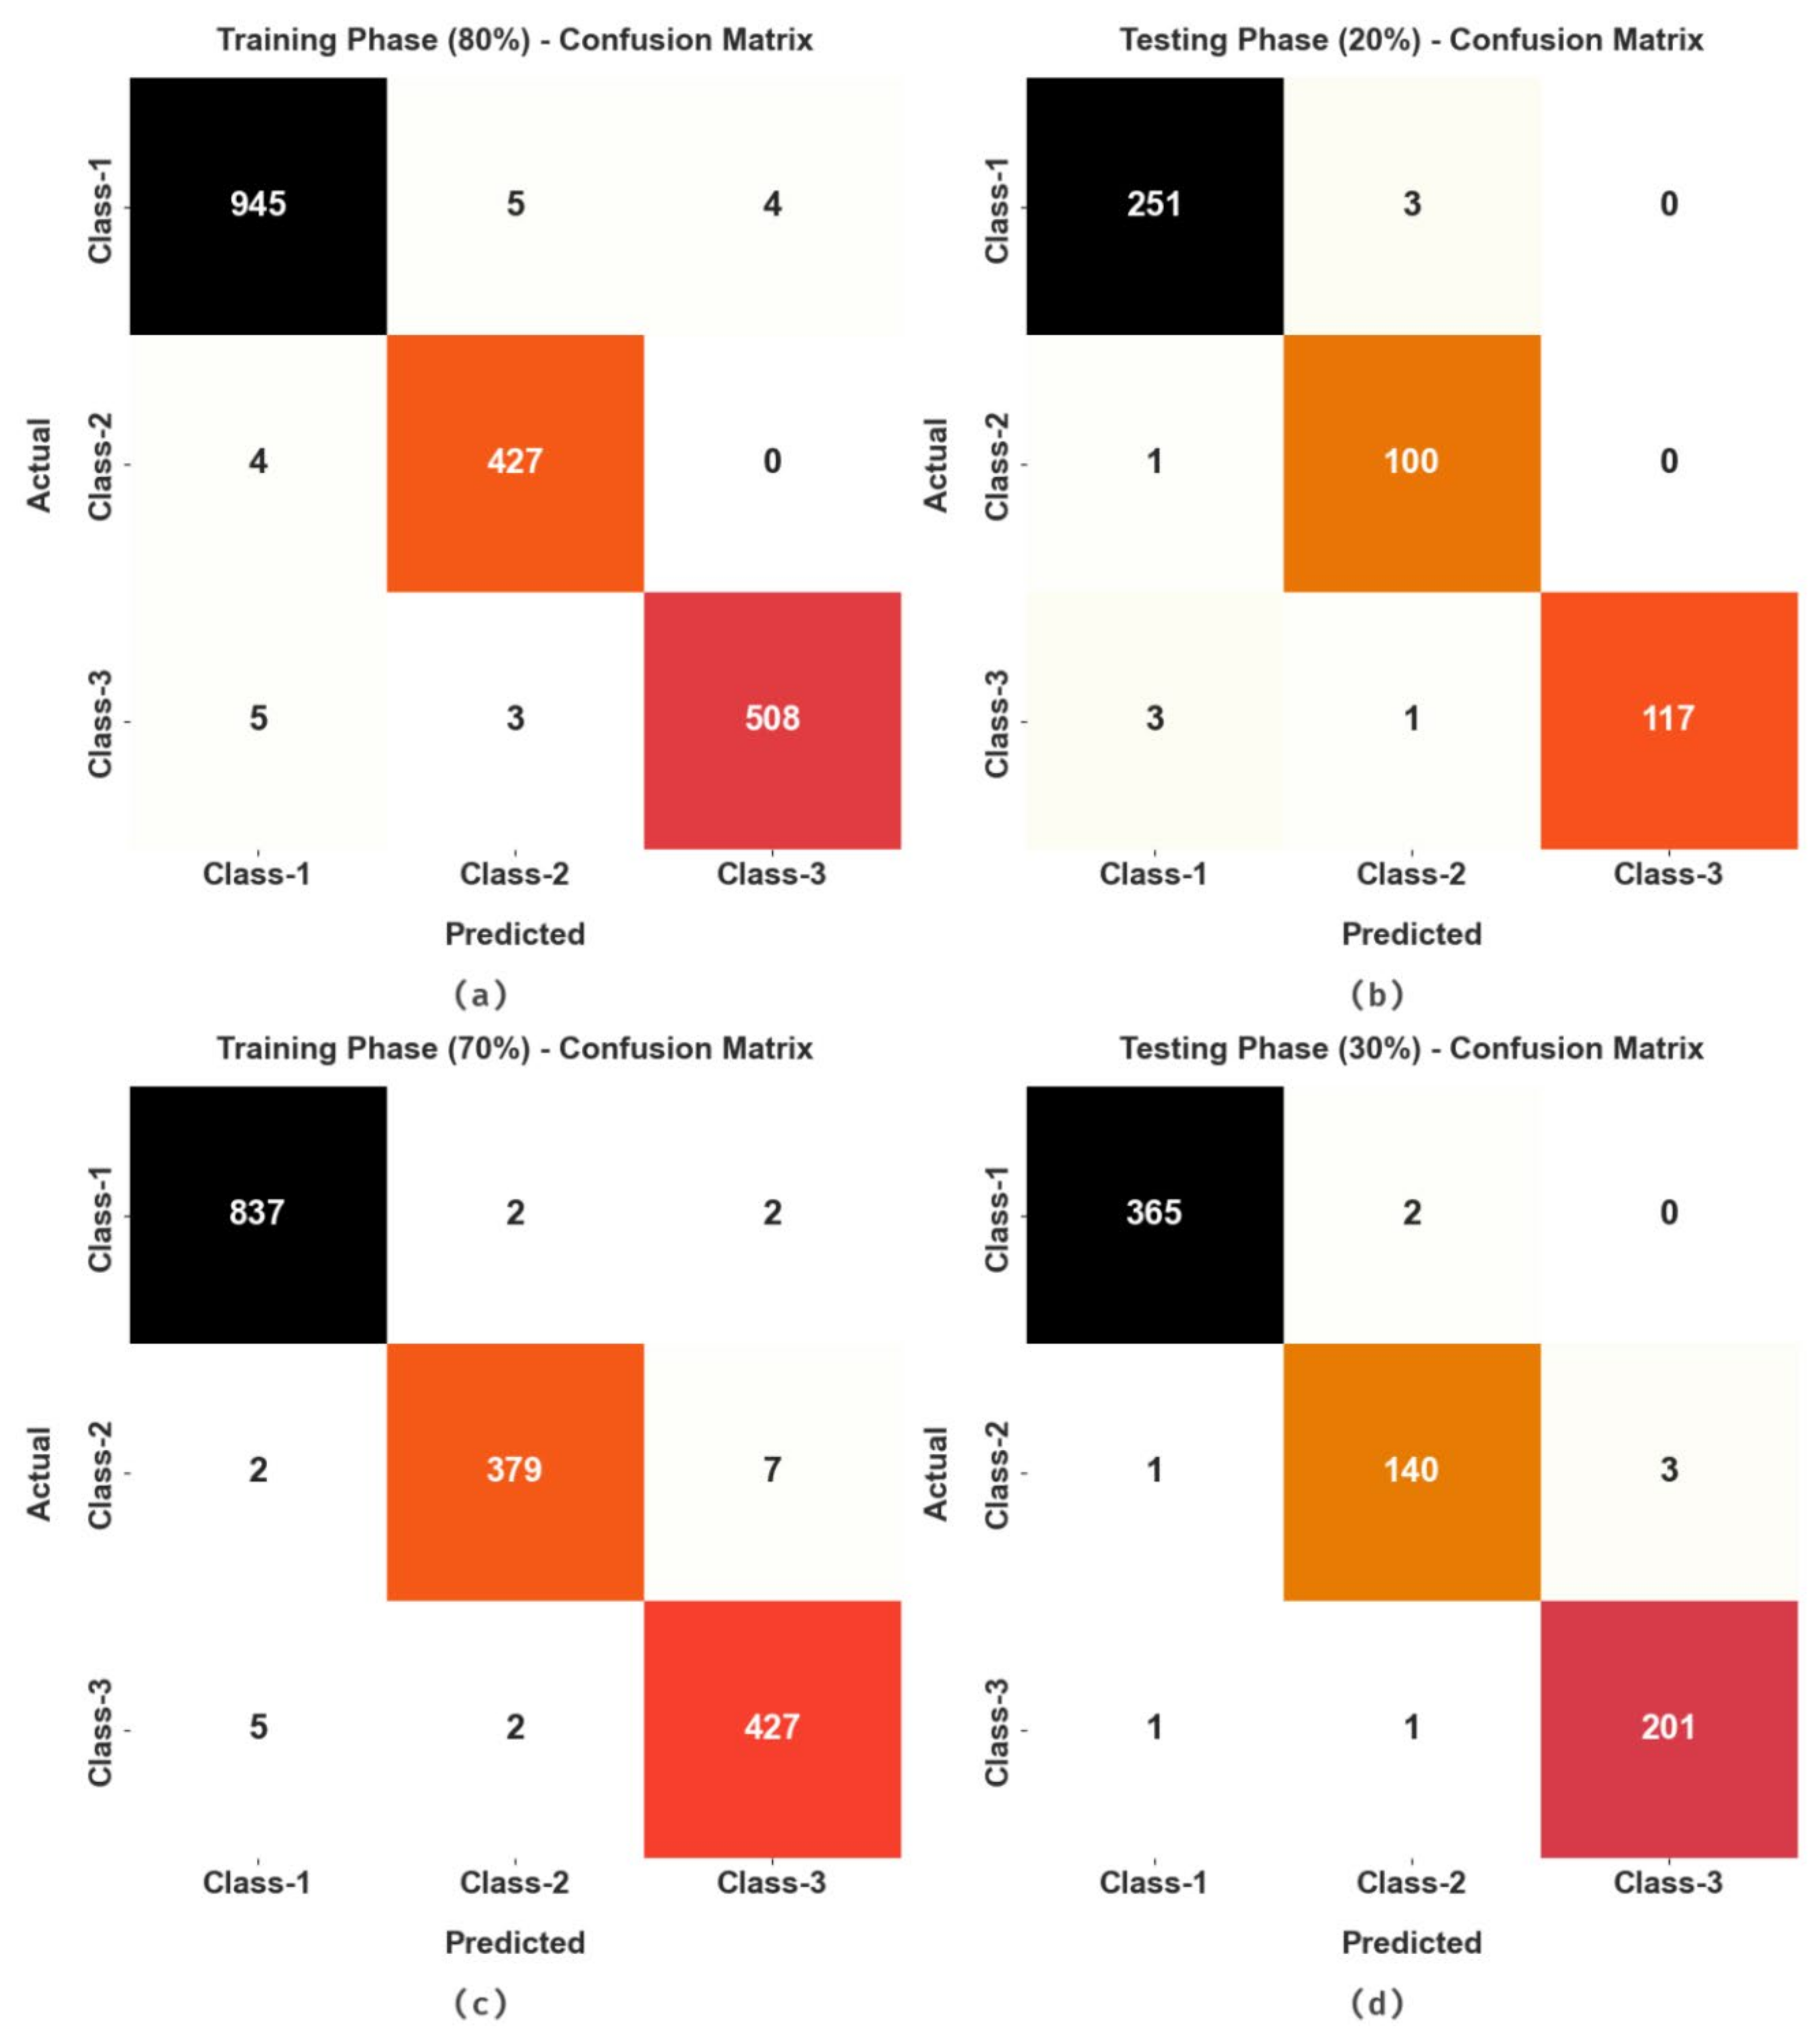
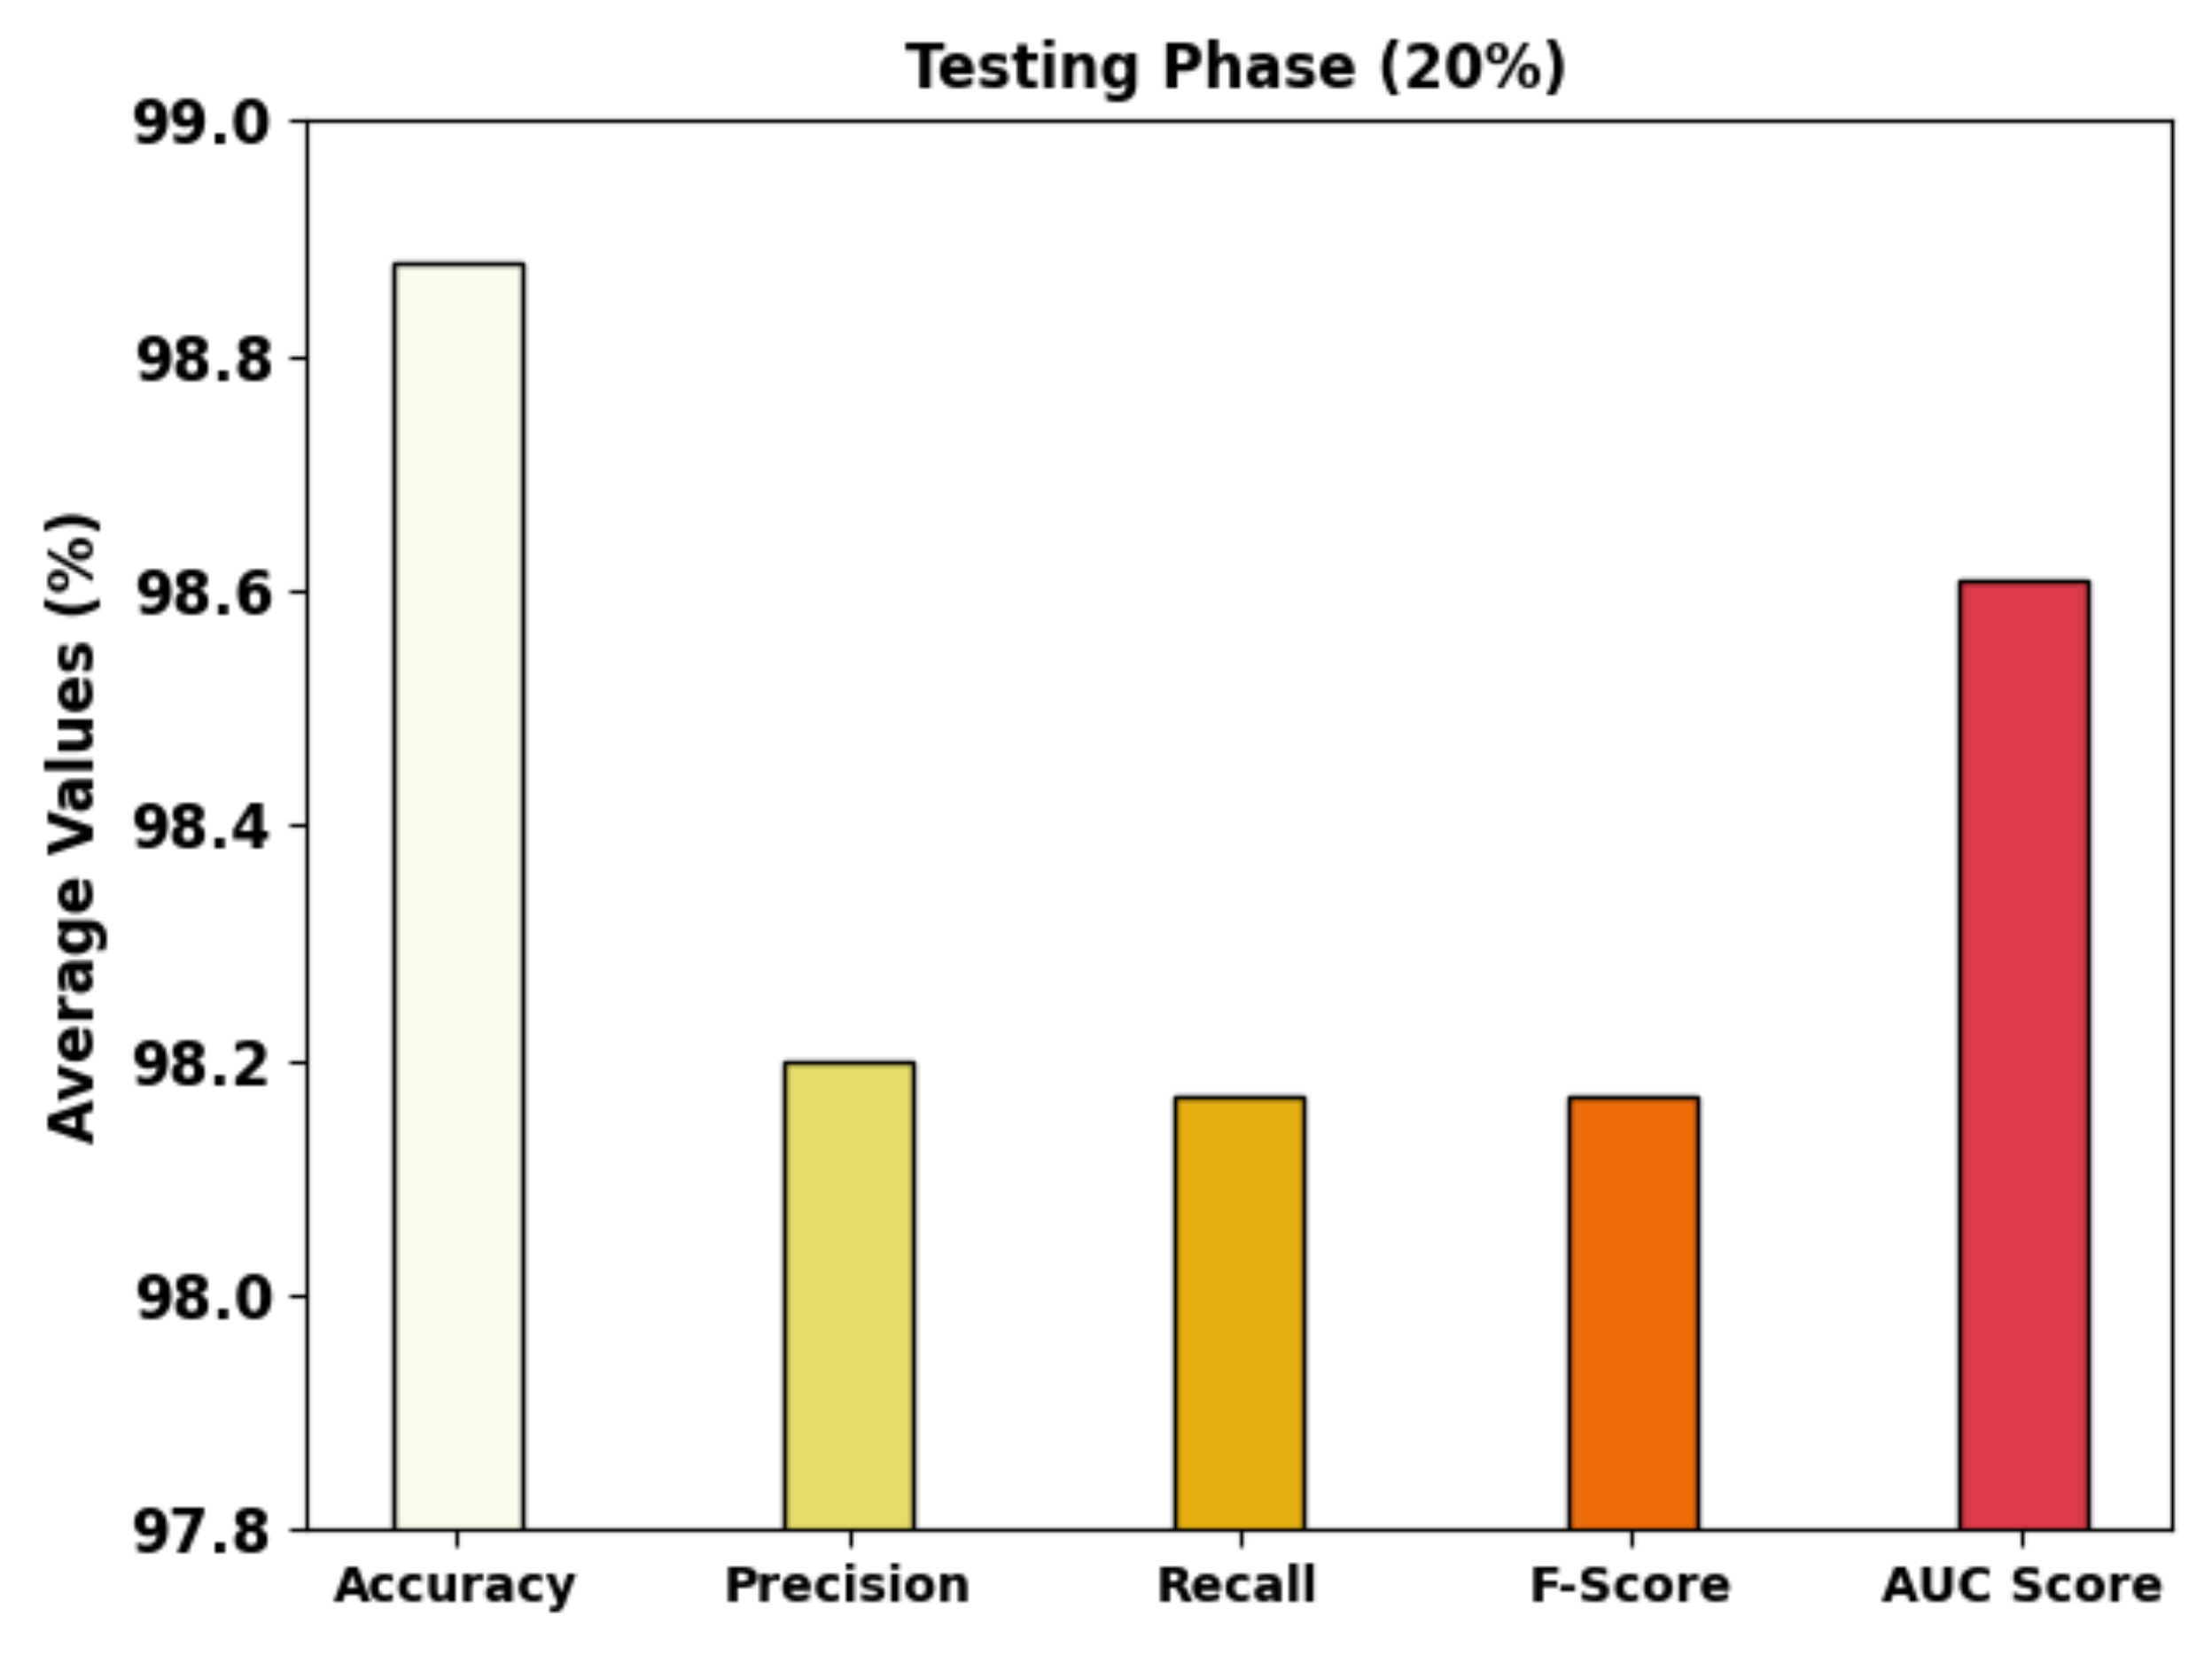
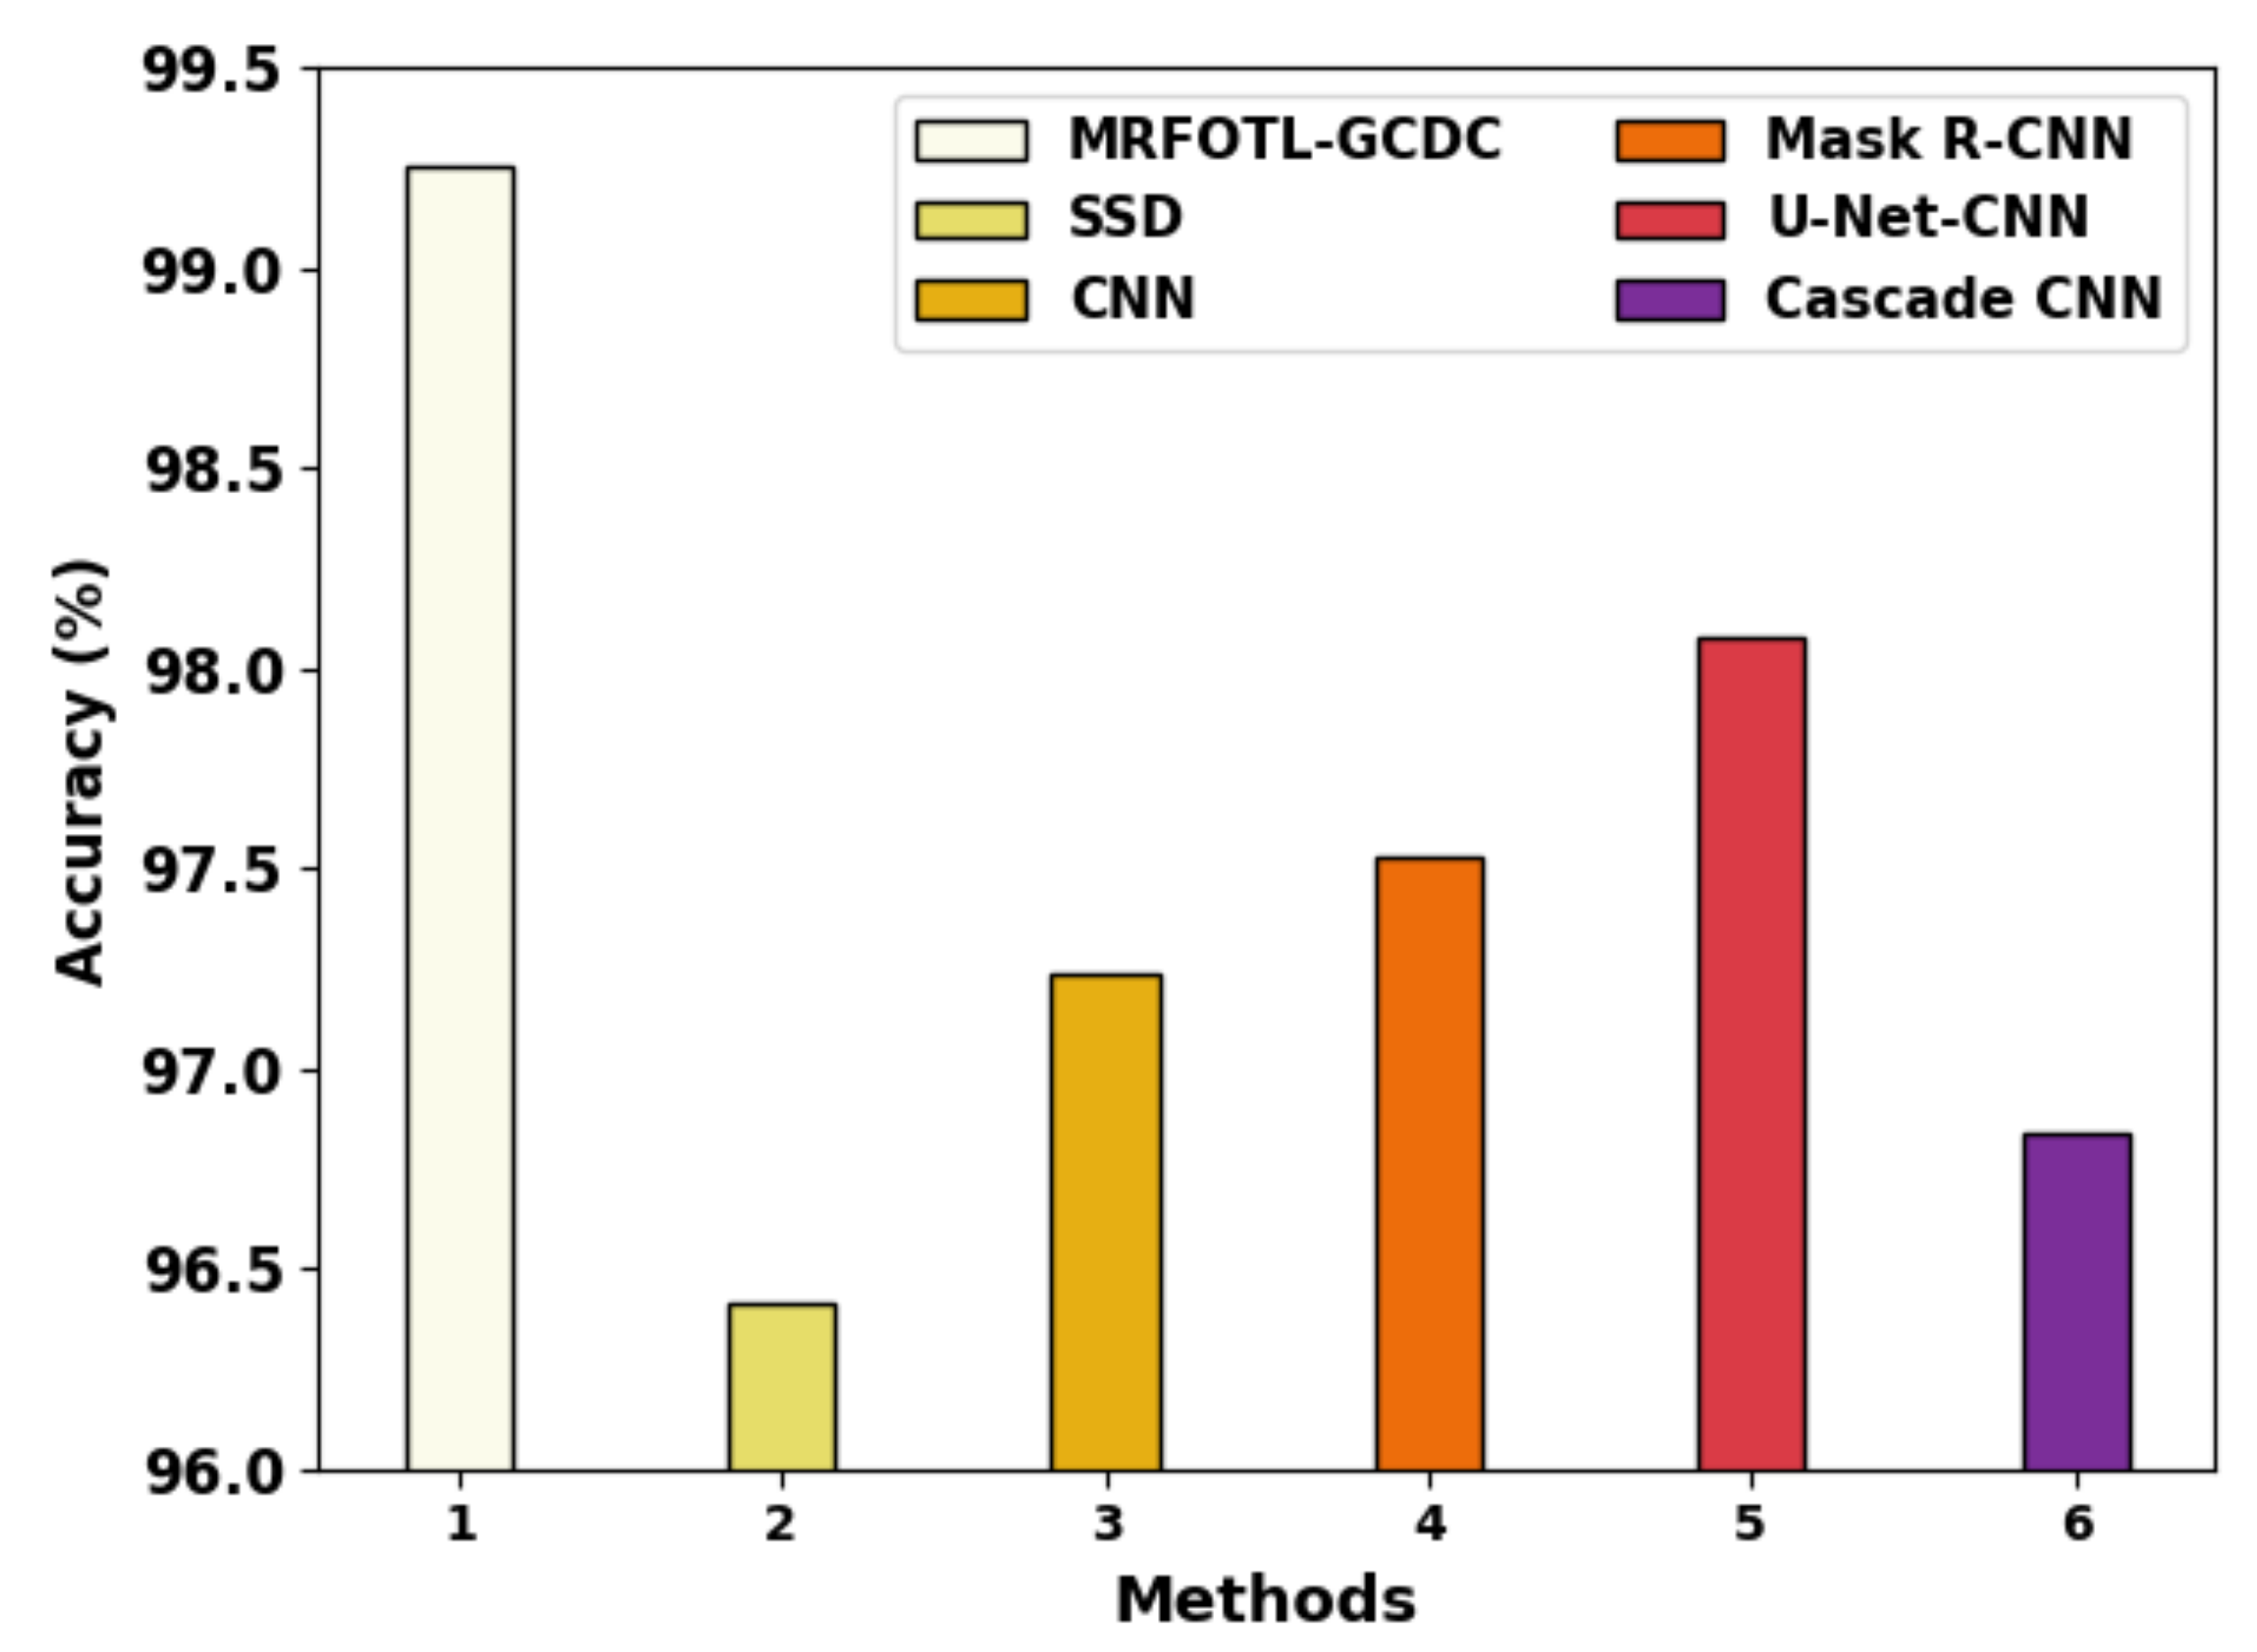
4. Results and Discussion

In this section, the GC classification results of the MRFOTL-GCDC method were tested using a dataset that was comprised of a set of endoscopic images. The dataset holds 2377 endoscopy images with three classes, as represented in Table 1. Figure 3 depicts some of the sample images.
The confusion matrices which were obtained by the MRFOTL-GCDC method using the GC classification process are shown in Figure 4. The results highlighted that the MRFOTL-GCDC method has properly differentiated the presence of GC.
Table 2 portrays an overall GC classification outcomes of the MRFOTL-GCDC method using 80% of the TR databases and 20% of the TS databases.
Figure 5 exhibits the brief GC classifier outcomes of the MRFOTL-GCDC method using 80% of the TR database. The results exhibit that the MRFOTL-GCDC method has properly differentiated the images into three classes. The MRFOTL-GCDC model has attained an average a c c u y of 99.26%, a p r e c n of 98.81%, a r e c a l of 98.86%, an F s c o r e of 98.83%, and an A U C s c o r e of 99.13%.
Figure 6 portrays the detailed GC classifier outcomes of the MRFOTL-GCDC method using 20% of the TS database. The results that were produced by the MRFOTL-GCDC approach has properly distinguished the images into three classes. The MRFOTL-GCDC method has obtained an average a c c u y of 98.88%, a p r e c n of 98.20%, a r e c a l of 98.17%, an F s c o r e of 98.17%, and an A U C s c o r e of 98.61%.
Table 3 depicts the overall GC classification outcomes of the MRFOTL-GCDC approach using 70% of the TR databases and 30% of the TS databases. Figure 7 exhibitions the brief GC classifier outcomes of the MRFOTL-GCDC method using 70% of the TR database. The results produced by the MRFOTL-GCDC method have properly distinguished the images into three classes. The MRFOTL-GCDC technique has achieved an average a c c u y of 99.20%, a p r e c n of 98.69%, a r e c a l of 98.53%, an F s c o r e of 98.61%, and an A U C s c o r e of 98.95%.
Figure 8 displays the complete GC classifier results of the MRFOTL-GCDC approach using 30% of the TS database. The results that were produced by the MRFOTL-GCDC approach have properly distinguished the images into three classes. The MRFOTL-GCDC method has achieved an average a c c u y of 99.25%, a p r e c n of 98.63%, a r e c a l of 98.56%, an F s c o r e of 98.60%, and an A U C s c o r e of 99%.
The training accuracy ( T R a c c ) and validation accuracy ( V L a c c ) that were acquired by the MRFOTL-GCDC approach in the test dataset are shown in Figure 9. The simulation values that were produced by the MRFOTL-GCDC method have reached higher values of T R a c c and V L a c c . Mainly, the V L a c c is greater than the T R a c c is.
The training loss ( T R l o s s ) and validation loss ( V L l o s s ) that were attained by the MRFOTL-GCDC technique in the test dataset are established in Figure 10. The simulation values denoted that the MRFOTL-GCDC approach has exhibited minimal values of T R l o s s and V L l o s s . Mostly, the V L l o s s is lower than the T R l o s s is.
A clear precision-recall review of the MRFOTL-GCDC method using the test database is shown in Figure 11. The figure shows that the MRFOTL-GCDC approach has resulted in enhanced values for the precision-recall values in every class.
Table 4 provides detailed GC classification results of the MRFOTL-GCDC model with recent models. Figure 12 reports comparative results of the MRFOTL-GCDC method in terms of the a c c u y . Based on the a c c u y , the MRFOTL-GCDC model has shown increased the a c c u y to 99.25%, whereas the SSD, CNN, Mask R-CNN, U-Net-CNN, and cascade CNN models have reported reduced a c c u y values of 96.41%, 97.24%, 97.53%, 98.08%, and 96.84% correspondingly.
Figure 13 exhibits the comparative results of the MRFOTL-GCDC technique in terms of the p r e c n , r e c a l , and F s c o r e . Based on the p r e c n , the MRFOTL-GCDC approach has displayed an increased p r e c n at 98.63%, whereas the SSD, CNN, Mask R-CNN, U-Net-CNN, and cascade CNN techniques have reported reduced p r e c n values of 96.16%, 95.38%, 96.58%, 97.54%, and 95.95% correspondingly. Additionally, based on the r e c a l , the MRFOTL-GCDC model has shown increased r e c a l at, 98.56% whereas the SSD, CNN, Mask R-CNN, U-Net-CNN, and cascade CNN models have reported reduced r e c a l values of 95.61%, 98%, 98.25%, 96.99%, and 98% correspondingly.
Finally, based on the F s c o r e , the MRFOTL-GCDC approach has shown an increased F s c o r e of 98.60%, whereas the SSD, CNN, Mask R-CNN, U-Net-CNN, and cascade CNN models have reported reduced F s c o r e values of 96.26%, 97.91%, 97.67%, 95%, and 97.58% correspondingly. These results reported the improvement of the MRFOTL-GCDC model.

5. Conclusions

In this study, an automated GC classification using the MRFOTL-GCDC technique has been developed for endoscopic images. The presented MRFOTL-GCDC technique examined the endoscopic images for the identification of GC using DL and metaheuristic algorithms. The presented MRFOTL-GCDC technique encompasses WF based preprocessing, SqueezeNet feature extraction, MRFO hyperparameter tuning, and ENN classification techniques. The experimental result analysis of the MRFOTL-GCDC technique demonstrates the promising endoscopic image classification performance with a maximum accuracy of 99.25%. In future, the detection rate of the MRFOTL-GCDC technique can be boosted by deep instance segmentation and deep ensemble fusion models.

Author Contributions

Conceptualization, F.A. and R.M.; methodology, S.S.A.; software, A.S.Z.; validation, F.A., M.R. and A.S.S.; investigation, S.S.A.; resources, A.S.S.; data curation, A.A.A.; writing—original draft preparation, F.A., S.S.A. and M.R.; writing—review and editing, R.M., M.I.E. and A.A.A.; visualization, A.S.S.; supervision, F.A.; project administration, M.R.; funding acquisition, F.A. and S.S.A. All authors have read and agreed to the published version of the manuscript.

Funding

Princess Nourah bint Abdulrahman University Researchers Supporting Project number (PNURSP2022R77), Princess Nourah bint Abdulrahman University, Riyadh, Saudi Arabia. The authors would like to thank the Deanship of Scientific Research at Umm Al-Qura University for supporting this work by Grant Code: (22UQU4210118DSR38).

Institutional Review Board Statement

Not applicable.

Informed Consent Statement

Not applicable.

Data Availability Statement

Not applicable.

Conflicts of Interest

The authors declare that they have no conflict of interest.

References

  1. Hu, H.; Gong, L.; Dong, D.; Zhu, L.; Wang, M.; He, J.; Shu, L.; Cai, Y.; Cai, S.; Su, W.; et al. Identifying early gastric cancer under magnifying narrow-band images with deep learning: A multicenter study. Gastrointest. Endosc. 2021, 93, 1333–1341. [Google Scholar] [CrossRef] [PubMed]
  2. Li, C.; Qin, Y.; Zhang, W.H.; Jiang, H.; Song, B.; Bashir, M.R.; Xu, H.; Duan, T.; Fang, M.; Zhong, L.; et al. Deep learning-based AI model for signet-ring cell carcinoma diagnosis and chemotherapy response prediction in gastric cancer. Med. Phys. 2022, 49, 1535–1546. [Google Scholar] [CrossRef]
  3. Li, Y.; Li, X.; Xie, X.; Shen, L. Deep Learning Based Gastric Cancer Identification. In Proceedings of the 2018 IEEE 15th International Symposium on Biomedical Imaging (ISBI 2018), Washington, DC, USA, 4–7 April 2018; pp. 182–185. [Google Scholar]
  4. Wu, L.; Wang, J.; He, X.; Zhu, Y.; Jiang, X.; Chen, Y.; Wang, Y.; Huang, L.; Shang, R.; Dong, Z.; et al. Deep learning system compared with expert endoscopists in predicting early gastric cancer and its invasion depth and differentiation status (with videos). Gastrointest. Endosc. 2022, 95, 92–104. [Google Scholar] [CrossRef]
  5. Song, Z.; Zou, S.; Zhou, W.; Huang, Y.; Shao, L.; Yuan, J.; Gou, X.; Jin, W.; Wang, Z.; Chen, X.; et al. Clinically applicable histopathological diagnosis system for gastric cancer detection using deep learning. Nat. Commun. 2020, 11, 4294. [Google Scholar] [CrossRef]
  6. Ba, W.; Wang, S.; Shang, M.; Zhang, Z.; Wu, H.; Yu, C.; Xing, R.; Wang, W.; Wang, L.; Liu, C.; et al. Assessment of deep learning assistance for the pathological diagnosis of gastric cancer. Mod. Pathol. 2022, 35, 1262–1268. [Google Scholar] [CrossRef]
  7. Wu, L.; Zhou, W.; Wan, X.; Zhang, J.; Shen, L.; Hu, S.; Ding, Q.; Mu, G.; Yin, A.; Huang, X.; et al. A deep neural network improves endoscopic detection of early gastric cancer without blind spots. Endoscopy 2019, 51, 522–531. [Google Scholar] [CrossRef] [Green Version]
  8. Yoon, H.J.; Kim, J.H. Lesion-based convolutional neural network in diagnosis of early gastric cancer. Clin. Endosc. 2020, 53, 127–131. [Google Scholar] [CrossRef] [Green Version]
  9. Raihan, M.; Sarker, M.; Islam, M.M.; Fairoz, F.; Shams, A.B. Identification of the Resting Position Based on EGG, ECG, Respiration Rate and SPO2 Using Stacked Ensemble Learning. In Proceedings of the International Conference on Big Data, IoT, and Machine Learning; Springer: Singapore, 2022; pp. 789–798. [Google Scholar]
  10. Amri, M.F.; Yuliani, A.R.; Simbolon, A.I.; Ristiana, R.; Kusumandari, D.E. Toward Early Abnormalities Detection on Digestive System: Multi-Features Electrogastrogram (EGG) Signal Classification Based on Machine Learning. In Proceedings of the 2021 International Conference on Radar, Antenna, Microwave, Electronics, and Telecommunications (ICRAMET), Bandung, Indonesia, 23–24 November 2021; pp. 185–190. [Google Scholar]
  11. Hu, W.; Li, C.; Li, X.; Rahaman, M.M.; Ma, J.; Zhang, Y.; Chen, H.; Liu, W.; Sun, C.; Yao, Y.; et al. GasHisSDB: A new gastric histopathology image dataset for computer aided diagnosis of gastric cancer. Comput. Biol. Med. 2022, 142, 105207. [Google Scholar] [CrossRef] [PubMed]
  12. Sharanyaa, S.; Vijayalakshmi, S.; Therasa, M.; Kumaran, U.; Deepika, R. DCNET: A Novel Implementation of Gastric Cancer Detection System through Deep Learning Convolution Networks. In Proceedings of the 2022 International Conference on Advanced Computing Technologies and Applications (ICACTA), Virtual, 4–5 March 2022; pp. 1–5. [Google Scholar]
  13. Qiu, W.; Xie, J.; Shen, Y.; Xu, J.; Liang, J. Endoscopic image recognition method of gastric cancer based on deep learning model. Expert Syst. 2022, 39, e12758. [Google Scholar] [CrossRef]
  14. Jang, H.J.; Song, I.H.; Lee, S.H. Deep Learning for Automatic Subclassification of Gastric Carcinoma Using Whole-Slide Histopathology Images. Cancers 2021, 13, 3811. [Google Scholar] [CrossRef] [PubMed]
  15. Valieris, R.; Amaro, L.; Osório, C.A.B.D.T.; Bueno, A.P.; Rosales Mitrowsky, R.A.; Carraro, D.M.; Nunes, D.N.; Dias-Neto, E.; Silva, I.T.D. Deep learning predicts underlying features on pathology images with therapeutic relevance for breast and gastric cancer. Cancers 2020, 12, 3687. [Google Scholar] [CrossRef] [PubMed]
  16. Meier, A.; Nekolla, K.; Hewitt, L.C.; Earle, S.; Yoshikawa, T.; Oshima, T.; Miyagi, Y.; Huss, R.; Schmidt, G.; Grabsch, H.I. Hypothesis-free deep survival learning applied to the tumour microenvironment in gastric cancer. J. Pathol. Clin. Res. 2020, 6, 273–282. [Google Scholar] [CrossRef] [PubMed]
  17. An, P.; Yang, D.; Wang, J.; Wu, L.; Zhou, J.; Zeng, Z.; Huang, X.; Xiao, Y.; Hu, S.; Chen, Y.; et al. A deep learning method for delineating early gastric cancer resection margin under chromoendoscopy and white light endoscopy. Gastric Cancer 2020, 23, 884–892. [Google Scholar] [CrossRef] [PubMed]
  18. Alwazzan, M.J.; Ismael, M.A.; Ahmed, A.N. A hybrid algorithm to enhance colour retinal fundus images using a Wiener filter and CLAHE. J. Digit. Imaging 2021, 34, 750–759. [Google Scholar] [CrossRef] [PubMed]
  19. Ragab, M.; Albukhari, A.; Alyami, J.; Mansour, R.F. Ensemble deep-learning-enabled clinical decision support system for breast cancer diagnosis and classification on ultrasound images. Biology 2022, 11, 439. [Google Scholar] [CrossRef] [PubMed]
  20. Zhao, W.; Zhang, Z.; Wang, L. Manta ray foraging optimization: An effective bio-inspired optimizer for engineering applications. Eng. Appl. Artif. Intell. 2020, 87, 103300. [Google Scholar] [CrossRef]
  21. Rizk-Allah, R.M.; Zineldin, M.I.; Mousa, A.A.A.; Abdel-Khalek, S.; Mohamed, M.S.; Snášel, V. On a Novel Hybrid Manta Ray Foraging Optimizer and Its Application on Parameters Estimation of Lithium-Ion Battery. Int. J. Comput. Intell. Syst. 2022, 15, 62. [Google Scholar] [CrossRef]
  22. Fan, Q.; Zhang, Z.; Huang, X. Parameter conjugate gradient with secant equation based Elman neural network and its convergence analysis. Adv. Theory Simul. 2022, 5, 2200047. [Google Scholar] [CrossRef]
Figure 1. Block diagram of MRFOTL-GCDC system.
Cancers 14 05661 g001
Figure 2. Structure of SqueezeNet model.
Cancers 14 05661 g002
Figure 3. Sample images.
Cancers 14 05661 g003
Figure 4. Confusion matrices of MRFOTL-GCDC system (a,b) TR and TS database of 80:20 and (c,d) TR and TS database of 70:30.
Cancers 14 05661 g004
Figure 5. Average analysis of MRFOTL-GCDC system in 80% of the TR database.
Cancers 14 05661 g005
Figure 6. Average analysis of MRFOTL-GCDC system using 20% of the TS database.
Cancers 14 05661 g006
Figure 7. Average analysis of MRFOTL-GCDC system using 70% of the TR database.
Cancers 14 05661 g007
Figure 8. Average analysis of MRFOTL-GCDC system using 30% of the TS database.
Cancers 14 05661 g008
Figure 9. T R a c c and V L a c c analysis of MRFOTL-GCDC system.
Cancers 14 05661 g009
Figure 10. T R l o s s and V L l o s s analysis of MRFOTL-GCDC system.
Cancers 14 05661 g010
Figure 11. Precision recall analysis of MRFOTL-GCDC system.
Cancers 14 05661 g011
Figure 12. A c c u y analysis of MRFOTL-GCDC system with other existing approaches.
Cancers 14 05661 g012
Figure 13. Comparative analysis of MRFOTL-GCDC system with other existing approaches.
Cancers 14 05661 g013
Table 1. Dataset details.
LabelClassCount of Images
Class1Healthy1208
Class2Early gastric cancer532
Class3Advanced gastric cancer637
Total No. of Images2377
Table 2. Result analysis of MRFOTL-GCDC system at an 80:20 ratio of the TR/TS database.
Labels A c c u y P r e c n r e c a l F s c o r e AUC Score
Training Phase (80%)
Class-199.0599.0699.0699.0699.05
Class-299.3798.1699.0798.6199.26
Class-399.3799.2298.4598.8399.08
Average99.2698.8198.8698.8399.13
Testing Phase (20%)
Class-198.5398.4398.8298.6298.51
Class-298.9596.1599.0197.5698.97
Class-399.16100.0096.6998.3298.35
Average98.8898.2098.1798.1798.61
Table 3. Result analysis of MRFOTL-GCDC system at a 70:30 ratio of TR/TS database.
Labels A c c u y P r e c n r e c a l F s c o r e AUC Score
Training Phase (70%)
Class-199.3499.1799.5299.3599.34
Class-299.2298.9697.6898.3198.68
Class-399.0497.9498.3998.1698.83
Average99.2098.6998.5398.6198.95
Testing Phase (30%)
Class-199.4499.4699.4699.4699.44
Class-299.0297.9097.2297.5698.35
Class-399.3098.5399.0198.7799.21
Average99.2598.6398.5698.6099.00
Table 4. Comparative analysis of MRFOTL-GCDC system with other existing techniques.
Methods A c c u y P r e c n r e c a l F s c o r e
MRFOTL-GCDC99.2598.6398.5698.60
SSD96.4196.1695.6196.26
CNN97.2495.3898.0097.91
Mask R-CNN97.5396.5898.2597.67
U-Net-CNN98.0897.5496.9995.00
Cascade CNN96.8495.9598.0097.58
Publisher’s Note: MDPI stays neutral with regard to jurisdictional claims in published maps and institutional affiliations.

