Article

Gene Regulatory Network Characterization of Gastric Cancer’s Histological Subtypes: Distinctive Biological and Clinically Relevant Master Regulators

1
IRCCS-CROB Centro di Riferimento Oncologico della Basilica, 85028 Rionero in Vulture, Italy
2
Unit of General Surgery and Surgical Oncology, Department of Medicine, Surgery and Neurosciences, University of Siena, 53100 Siena, Italy
3
Biogem, Istituto di Biologia e Genetica Molecolare, Via Camporeale, 83031 Ariano Irpino, Italy
4
Department of Biology, University of Naples ‘Federico II’, 80126 Naples, Italy
5
Department of Molecular Medicine and Health Biotechnolgy, Università di Napoli Federico II, 80131 Naples, Italy
*
Authors to whom correspondence should be addressed.
Cancers 2022, 14(19), 4961; https://doi.org/10.3390/cancers14194961
Submission received: 1 September 2022 / Revised: 27 September 2022 / Accepted: 4 October 2022 / Published: 10 October 2022

Abstract

:

Simple Summary

The prognosis of advanced gastric cancer patients remains unfavorable. Molecular heterogeneity has proven to be a major determinant of clinical outcomes. We characterized the transcriptome of the two major subgroups by highlighting the different biological and molecular pathways. We explored their association with clinicopathological features and survival. This comparative study aimed to define a reproducible in silico analysis so that the molecular mechanisms underlying carcinogenesis, disease natural history and the identification of new therapeutic targets can be traced.

Abstract

Gastric cancer (GC) molecular heterogeneity represents a major determinant for clinical outcomes, and although new molecular classifications have been introduced, they are not easy to translate from bench to bedside. We explored the data from GC public databases by performing differential gene expression analysis (DEGs) and gene network reconstruction to identify master regulators (MRs), as well as a gene set analysis (GSA) to reveal their biological features. Moreover, we evaluated the association of MRs with clinicopathological parameters. According to the GSA, the Diffuse group was characterized by an epithelial-mesenchymal transition (EMT) and inflammatory response, while the Intestinal group was associated with a cell cycle and drug resistance pathways. In particular, the regulons of Diffuse MRs, such as Vgll3 and Ciita, overlapped with the EMT and interferon-gamma response, while the regulons Top2a and Foxm1 were shared with the cell cycle pathways in the Intestinal group. We also found a strict association between MR activity and several clinicopathological features, such as survival. Our approach led to the identification of genes and pathways differentially regulated in the Intestinal and Diffuse GC histotypes, highlighting biologically interesting MRs and subnetworks associated with clinical features and prognosis, suggesting putative actionable candidates.

1. Introduction

Gastric cancer (GC) was responsible for 769,000 deaths in 2020, ranked sixth for incidence and third for mortality [1]. Although treatment approaches have improved, the prognosis of advanced GC patients remains unfavorable, with a 5-year survival rate of less than 5% [2]. GC is characterized by both intra- and inter-tumoral heterogeneity [3]; thus, several classification systems have aimed to categorize different subtypes from a morphological point of view. Among them, the Lauren classification is the most widely used, and it separates GCs into Intestinal, Diffuse and mixed subtypes [4]. Additionally, a classification from the World Health Organization (WHO) [5] has been recently updated with a more systematic approach to stratifying GC into five main histological subtypes: the Intestinal subtypes from the Lauren classification (tubular, papillary and mucinous) and Lauren’s Diffuse types (poorly cohesive, signet ring cells and mucinous). WHO classification also includes mixed carcinoma and other less frequent gastric tumors. Nonetheless, categorization into a few macro-groups is burdened by excessive internal heterogeneity, resulting in conflicting evidence based on histopathological phenotypes for predicting patient prognosis or response to therapy. Additionally, the GC diversity also hinders the identification of prognostic markers from a molecular point of view (e.g., p53 or E-cadherin). Next-generation sequencing contributes to the establishment of new molecular classifications of gastric cancer, focusing on biological characteristics. The Cancer Genome Atlas (TCGA) identified four genomic gastric cancer subtypes: Epstein-Barr virus-associated (EBV), microsatellite instable (MSI), genomically stable (GS) and chromosomal instability (CIN) groups [6]. On the other hand, the Asian Cancer Research Group (ACRG) focused on gene expression profiles and classified gastric cancer into four subtypes with distinct clinical outcomes: microsatellite stable (MSS), epithelial-mesenchymal transition (EMT), MSI, MSS/p53 active and MSS/p53 inactive. This approach opens new possibilities to treat the disease in a tailored way [7]. Although, in recent years, many research efforts have proven that distinct molecular groups showed peculiar clinicopathological as well as prognostic characteristics [8,9,10,11,12,13,14,15], the integrative analysis of multiple genomic and proteomic datasets still remains expensive and quite complicated to translate into the clinical setting [16,17]. In this view, since histological assessment remains a cheap and widespread method, it would be of immense interest to thoroughly research the molecular differences between the Intestinal and Diffuse subtypes and the underlying gene networks responsible for the different biological behaviors. To the best of our knowledge, few studies have focused on the characterization of molecular differences within Lauren’s classification [18,19], and a reconstruction of the signaling networks differentially active between subtypes is lacking. Therefore, we more deeply investigated the associations of Lauren’s histotypes with clinicopathological features, searching for differentially expressed gene lists accordingly weighted. Additionally, we traced the transcriptional subnetworks characterizing the Intestinal and Diffuse subtypes and explored their associations with clinicopathological features and survival. This comparative study aimed to define a reproducible analysis so that the molecular mechanisms underlying carcinogenesis, disease behavior and the identification of new therapeutic targets can be traced.

2. Materials and Methods

2.1. Data Collection

TGCA (https://www.cancer.gov/tcga (accessed on 15 June 2021)) and the Genotype-Tissue Expression (GTEx) project (https://www.gtexportal.org/home/ (accessed on 15 June 2021)) are repositories, collected with high throughput, of clinical data of many tumors and normal tissues from many organs. Although unifying cancer and normal RNA sequencing data from diverse sources represents a bioinformatics challenge, TCGA and GTEx RNA-seq data were successfully merged by Wang et al. enabling cross-study analysis of RNA-sequencing data [20]. From the UCSC Xena browser (https://xenabrowser.net/datapages/ (accessed on 15 June 2021)), we retrieved the dataset (TCGA TARGET GTEx transcript expression by RSEM using UCSC TOIL RNA-seq recompute), clinical data and gene annotations. After crossing the RNA-seq dataset and clinical data, we obtained the data of 380 gastric cancer RNA-seqs, 32 adjacent normal (non-diseased) tissues and 112 normal samples. All the information about TCGA samples’ clinical data, pathology reports and tissues were easily retrievable by the cBioPortal (https://www.cbioportal.org/ (accessed on 15 June 2021)) website, while the “GTEx Tissue Harvesting Work Instruction” provided all the available information about the GTEx tissues. From the GEO repository [21], we retrieved the ACRG (GSE62254) [7] and GSE15459 [22] datasets containing 300 and 200 GCs, respectively.

2.2. Patient Selection and Study Design

This study included GC patients who underwent upfront gastrectomy for a malignant disease nbetweem January 2014 and March 2019 and were collected in the TGCA dataset. The GSE62254 dataset included n = 300 primary independent GC specimens at the time of the total or subtotal gastrectomy at Samsung Medical Centre, Seoul, South Korea, from 2004–2007 (all the tissue specimens were in a chemo-naïve state during the primary resection of gastric cancer). Case selection criteria were histologically confirmed adenocarcinoma of the stomach, surgical resectioning of primary GC, age ≥18 years and complete pathological, surgical, treatment and follow-up data. Patients in the GSE15459 dataset from the National Cancer Centre in Singapore had a median follow-up period of 13.47 months, and 91 patients died by the end of the study period. Histopathological data are provided in Ooi CH et al. [22].

2.3. Data Processing

RNA-seq and clinical data of the GTEx and TCGA databases were used to investigate transcriptomic profiles of the GC and normal gastric tissue, as performed by Russi et al. [23]. The previous histological categorizations were:
  • Signet-Ring Cells (SRC),
  • Diffuse (poorly cohesive, not SRC)
  • Intestinal mucinous,
  • Intestinal papillary,
  • Intestinal tubular,
  • Intestinal not otherwise specified (iNOS),
  • Stomach not otherwise specified (sNOS).
Initially, the sNOS and SRC samples were filtered out due to the missing histology and unclear different behaviors [24], respectively. From now on, we refer to the poorly cohesive without SRCs as “Diffuse” (n = 62). On the other hand, Intestinal samples behave in a heterogeneous way, considering the association with clinical features and the survival results. We filtered out the papillary samples due to their scarcity (n = 7). Moreover, by performing a differential expression analysis (p-value < 0.05 and |FC > 1.5|), we included, in the “Intestinal” category, the tubular samples, representing most of the Intestinal adenocarcinomas [25], together with the iNOS or mucinous samples. Interestingly, compared with the tubular samples, mucinous samples showed 2828 DEGs while iNOS showed only 511. This result, together with the differences in survival and clinicopathological features (Supplementary Materials Figures S1–S6), suggested the exclusion of the mucinous samples from the Intestinal subgroup and further investigation of the possibility of retaining the iNOS. In this way, after differential gene expression analysis (adjusted p-value < 0.05 and |FC| > 1.5) between the Diffuse and the union of the Intestinal (tubular and iNOS) samples, we created a Venn diagram (in Supplementary Materials Figure S7). The 6827 DEGs, resulting from the comparison between the Diffuse vs. Intestinal (merged), showed great overlap with the Diffuse vs. tubular (88%) and the Diffuse vs. iNOS genes (80%). From now on, we refer to the tubular and iNOS as “Intestinal” (n = 140). Our final categorization, based on molecularly homogeneous histological types, was:
  • Diffuse (poorly cohesive, not SRC),
  • Intestinal (tubular and iNOS).
The rationale of the study is summarized through a schematic workflow in Supplementary Materials Figure S8.

2.4. Statistical Analysis

2.4.1. Association with Clinical Features and Survival Analyses

We evaluated, with chi-square test, the association of the selected clinical variables and the histological type. We depicted the significant association with correlation plots. Moreover, by multivariate Cox proportional hazards analysis, we calculated the overall survival (OS), the disease-specific survival (DSS), the disease-free survival (DFS) and the progression-free interval (PFI) associated with the above clinical features. We applied the Akaike information criterion (AIC) based on a stepwise procedure to obtain the best candidate for the final Cox proportional hazards models, which were depicted as forest plots.

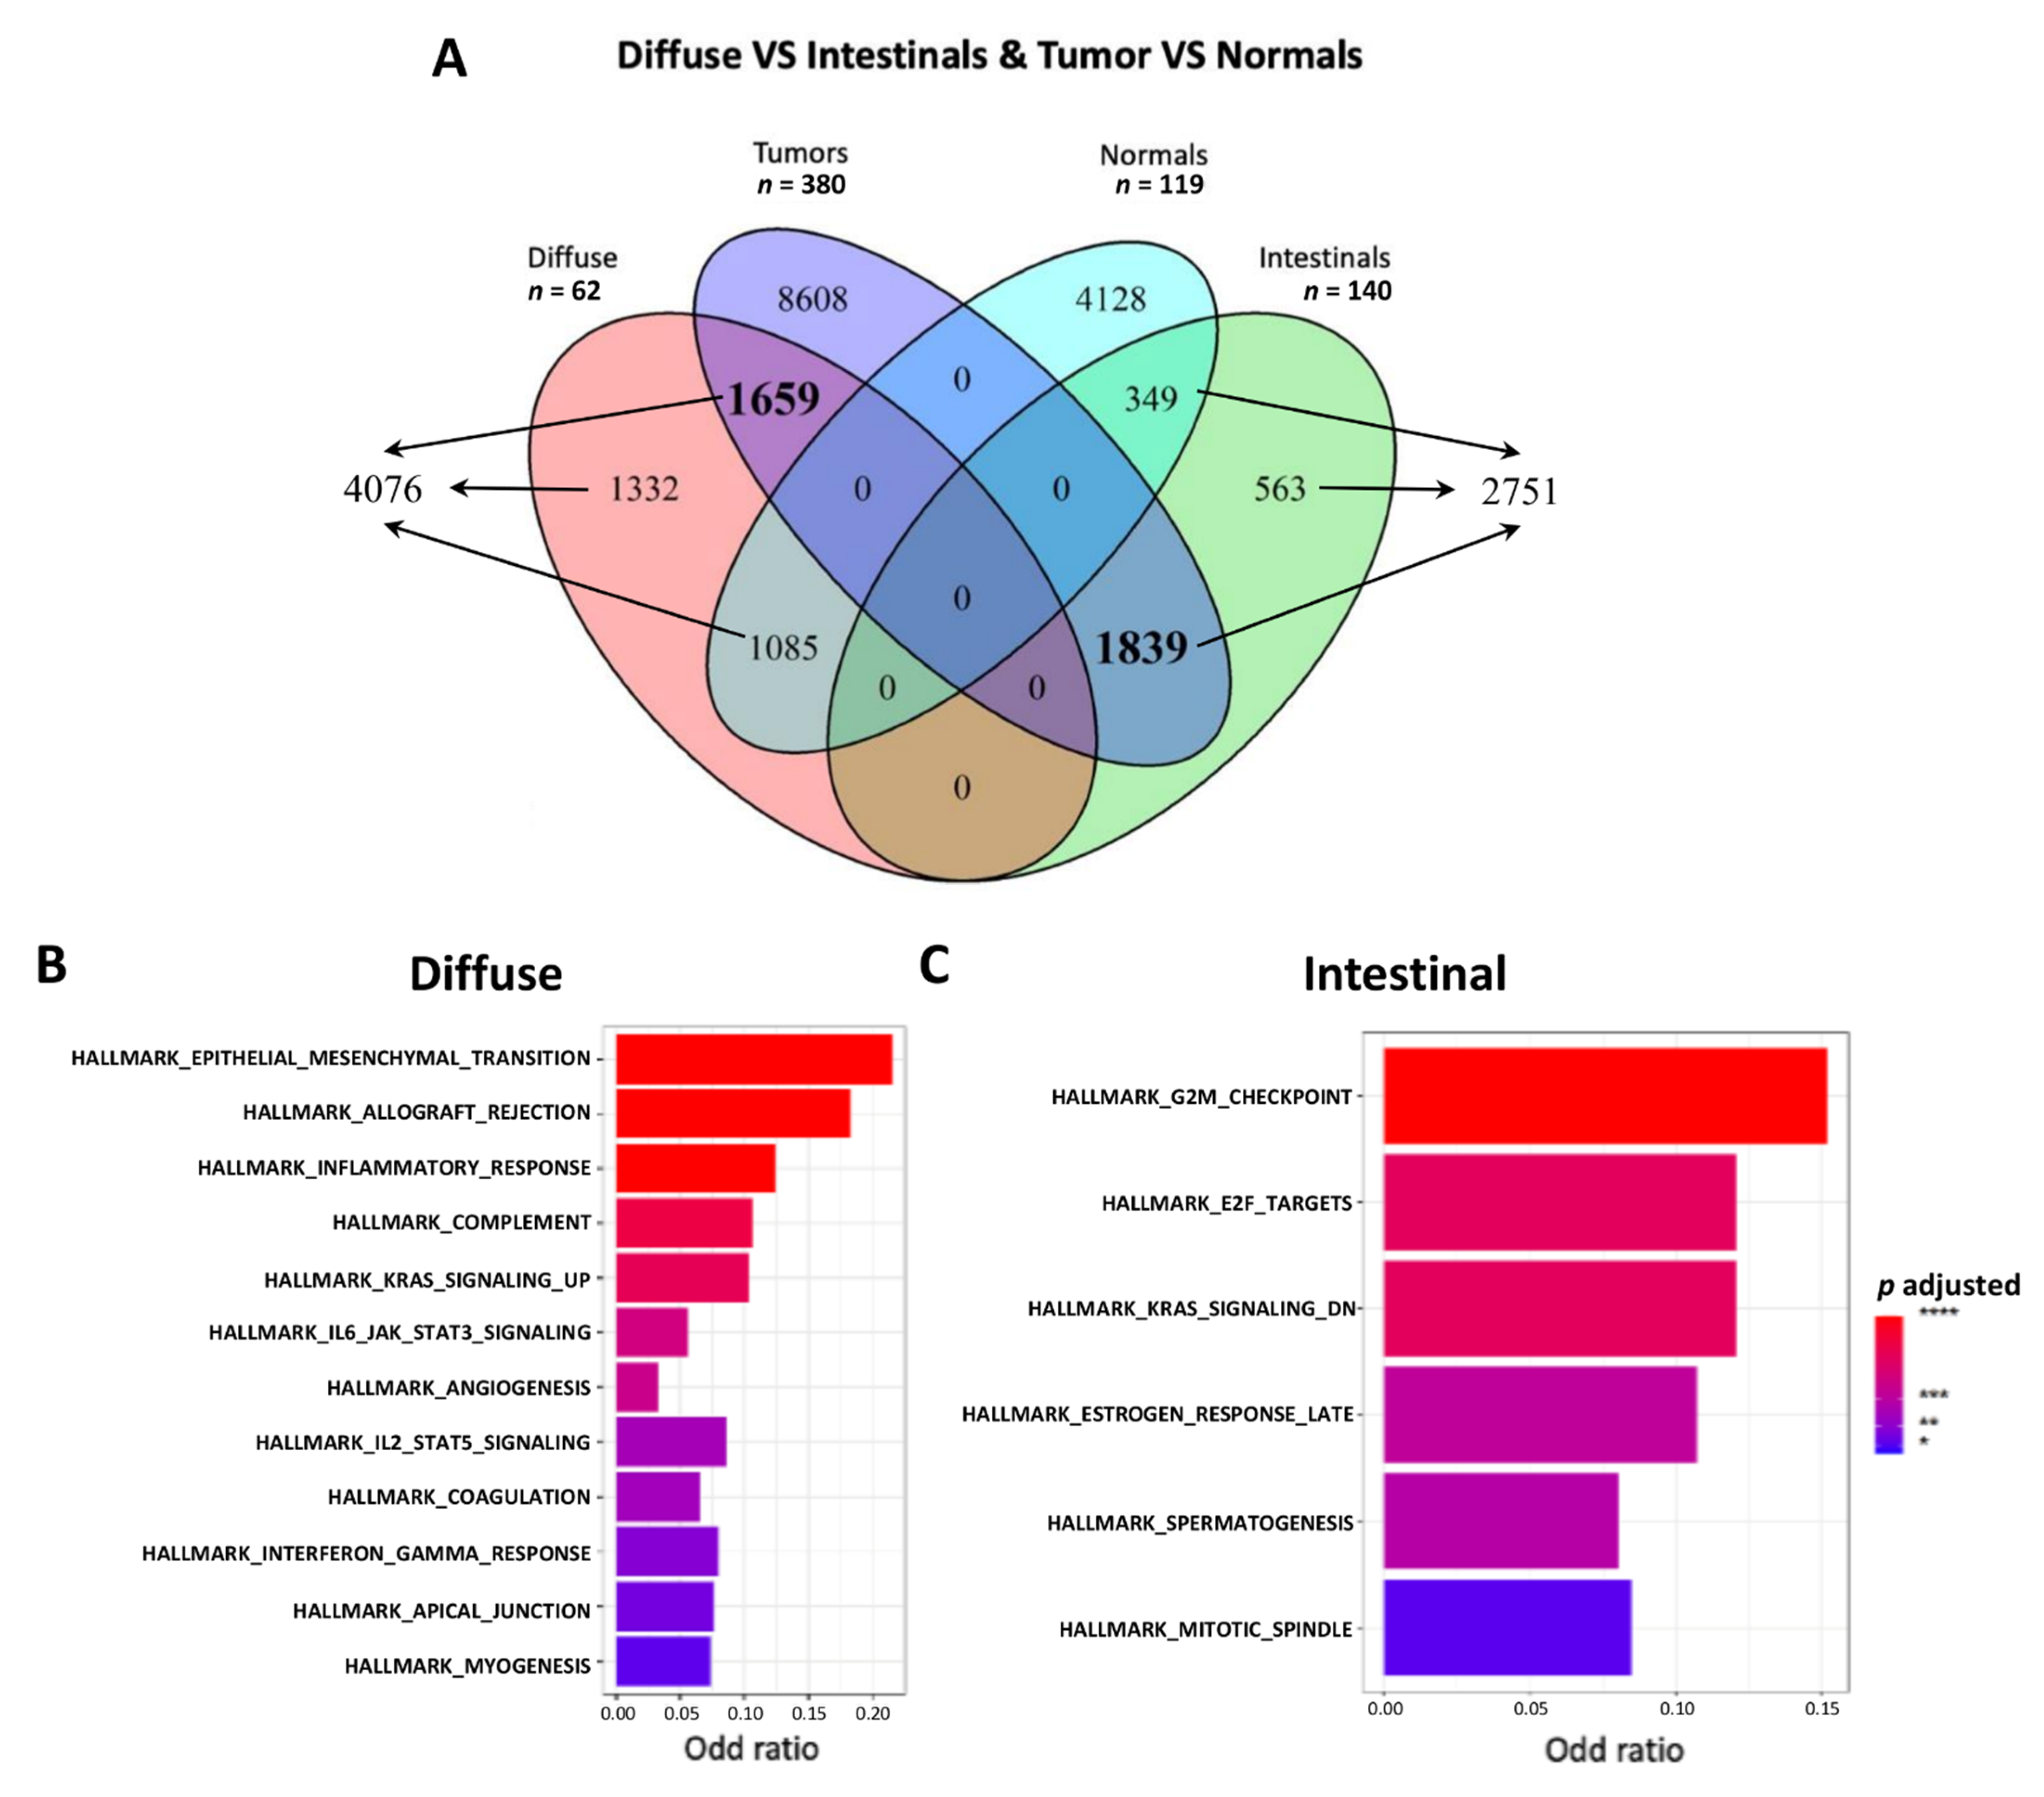
2.4.2. Differential Expression Analysis and Venn

The regression-like model implemented by the edgeR [26] was used to perform differential expression analysis on RNA-seq data, while the limma implementation was used for the microarray data. According to the clinical data, we selected 62, 135 and 75 Diffuse samples and 140, 146 and 99 Intestinal samples from the TCGA, ACRG and GSE15459 datasets to perform a differential expression analysis. According to the explorative analysis, the pathologic stage and N feature of the TNM staging system were used as blocking factors in the TCGA data generalized linear modeling. A gene was considered as differentially expressed (DEG) if (1) corrected (FDR) p-value < 0.05 and (2) expression change > |1.5|-fold (log2FC > |0.58|).

2.4.3. Gene-Set Enrichment Analyses and Master Regulator Analyses (MRA)

The overrepresentation of the Molecular Signatures Database’s (MSigDB) [27] hallmark (HM), gene ontology (GO), KEGG pathways, motifs, miRNA targets, chromosome position and immune system gene sets for each DEG list was obtained by applying the ClusterProfiler [28]. We considered statistically significant the gene sets resulting from the analysis of the TCGA data with an FDR adjusted p-value < 0.05. We retrieved, from the aracne.networks [29], the AP-ARACNE [30] inferred networks for the TCGA-STAD database. There are 6054 inferred subnetworks called regulons, which have HUB transcription regulators (TFs, co-TFs, etc.) called master regulators (MRs). Exploiting the mra function implemented in the corto [31], we scored the enrichment of each candidate MR in subgroups and samples according to the logcpm (logarithmic counts per million) of the genes in the dataset. The enrichment score (ES) reflected the degree to which a regulon was overrepresented at the top or bottom of a ranked list of genes. The higher the ES, the more active the subnetwork associated with the candidate MR. Moreover, to highlight the biological function of the MR’s regulon, we evaluated its overlap with the enriched gene sets. A hypergeometric test was performed to identify the significant overlaps. Statistical analysis was performed using the computing environment R (R Core Team, Vienna, Austria) [32].

2.4.4. Single Sample Gene Set Enrichment Analysis (ssGSEA) and Single Sample Master Regulator Analysis (ssMRA)

To better describe the heterogeneity of the two groups, we performed both ssGSEA and ssMRA to obtain the activation or deactivation normalized enriched score (NES) for each gene set or each MR’s inferred small subnetwork (regulon) in each sample.

2.4.5. Association of MRs with Clinical and Survival Features

We evaluated, by linear modeling, the association of the selected clinical variables and each MR’s profile obtained by ssMRA. We depicted selected interesting associations with a ggplot2 [33]. Moreover, we described by univariate Cox analysis the overall, disease-specific, disease-free and progression-free survival associated with the MRs’ NES. Selected results are depicted as forest plots.

3. Results

3.1. In Silico-Refined Histological Subtypes Have Similar Clinicopathological Characteristics

A multivariate analysis was performed to evaluate the association of several clinicopathological features with the two histological subgroups. A total of 380 GC patients were eligible for our study: 62 were categorized as Diffuse, 12 as signet, 139 as stomach NOS, 17 as Intestinal mucinous, 7 as Intestinal papillary, 71 as Intestinal tubular, 69 as Intestinal NOS and 3 with no clinicopathological annotation. The patient characteristics and clinicopathological data are in Supplementary Materials Table S1. The man-to-woman ratio was 2/1. Around 60% were proximal while 40% were distal; 43% of tumors were the Intestinal type, and >50% were pathological stage ≥III. An association of the histological groups described above resulted in the pathologic stage, lymph nodes ratio (Figure S1), and with a primary therapy outcome (χ2 p-value < 0.01). Via multivariate Cox proportional hazards analysis, we investigated the association of clinical features with the overall survival (OS), disease-specific survival (DSS), disease-free survival (DFS) and progression-free interval (PFI). The best-fit model according to Akaike Information Criterion (AIC) for the overall survival comprises the histology and pathologic stage (global p-value = 1.3 × 10−06), while histology, pathologic stage and microsatellite status best model the DSS (global p-value = 1.4 × 10−06). Forest plots of the stepwise selected models are depicted in Supplementary Materials Figures S2–S5. According to the data processing paragraph, a total of 202 patients were clearly identified: 62 were categorized as Diffuse and 140 as Intestinal (including 71 tubular histotypes). The association profiles of the new Intestinal (Figure S6) and old Intestinal tubular and iNOS (Supplementary Materials Figure S1) with lymph nodes ratio and pathologic stage were clearly overlapping; thus, supporting our choice of merging the latter. The patients’ characteristics and clinical data for each new histological group are represented in Table 1.
Almost 70% of tumors were the Intestinal type. The man-to-woman ratio was 2:1 in the Intestinal and about 1:1 in the Diffuse GC. About 60% of the Intestinal GC were proximal, whereas GC localization was quite similar between the two sites in the Diffuse GC. Pathological stage ≥ III represented over 60% for both histological types.
Overall, there was no significant association between the histological (Diffuse and Intestinal) types and clinical data according to the χ2 test as well as with survival. Therefore, no other variables influenced the downstream analyses which focused on the molecular and functional characterization of GC subtypes.

3.2. Functional Enrichment Highlighted a Different Biological Behavior for the Two Histological Subtypes

We performed several hierarchical steps of differential gene expression and functional enrichment analyses to evaluate the biological differences between the two GC histological subgroups and pinpoint respective candidate biomarkers. We first defined the differentially expressed genes between the GC (both Diffuse and Intestinal samples) and the normal mucosa samples (adjusted p-value <0.05 and |FC| > 1.5) by obtaining 12,106 upregulated and 5562 downregulated genes. We subsequently defined 4076 upregulated genes in the Diffuse vs. Intestinal samples and 2751 upregulated genes in the Intestinal vs. Diffuse samples. Finally, after the intersection between the GC upregulated and Diffuse or Intestinal upregulated genes, according to the Venn diagram in Figure 1A, we defined 1659 upregulated genes in both GC vs. normal mucosa and Diffuse vs. Intestinal samples as a Diffuse signature.
Similarly, we defined as an Intestinal signature 1839 upregulated genes in both GC vs. healthy mucosa and in the Intestinal vs. Diffuse samples (Supplementary Materials File S1). Among the upregulated genes in GC vs. healthy mucosa (normal), around 25% are subtype-specific, defining two refined lists of GC histology-related candidate biomarkers. Interestingly, as suggested by the literature, ERBB2 results were strongly upregulated in Intestinal GC and CDH1 downregulated in the Diffuse type. To capture the relationships among the DEGs and gain biological insight into the global gene expression patterns that differentiate the Diffuse from Intestinal GC specimens, we performed a gene set analysis (GSA) using the mSigDB gene sets comprising, among others, hallmark and GO gene sets. The GSA results (adjusted p-value < 0.05) are reported in Table 2.
Diffuse tumors appeared to enrich a higher number of gene sets for all categories except for the positional one. Hallmark categories related to the epithelia-mesenchymal transition (EMT) and cellular cycle defined a clear biological difference between the two GC subtypes (Figure 1B,C). On the other hand, in the Intestinal tumors, we found enriched gene sets associated with cell cycle regulation, division and proliferation. Indeed, as recently reviewed, E2F’s transcription factor is a critical regulator of genes essential for cell cycle progression and control of cell proliferation [34]. Overall, evaluating the hallmarks and other ontologies, the Diffuse subtype seemed to be mainly characterized by an invasive phenotype, whereas the Intestinal subtype showed a proliferative one [35]. Moreover, the other gene sets (GO and pathways) depicted some remarkable differences between Diffuse and Intestinal GC, falling into the same biological features of the enriched hallmarks (Supplementary Materials Files S2 and S3). Among the top enriched pathways in the Diffuse type of GC, we found a signature related to multi-cancer invasiveness and extracellular matrix organization. Finally, we found some active pathways involved in immune system cell regulation as well as GOs relative to immune cell regulation and extracellular matrix organization (Supplementary Materials File S2). The pathways characterizing the Intestinal GC, in addition to other cancer-related pathways, were involved in cell cycle regulation and response to growth factors and hormones (EGFR, estradiol, progesterone). Indeed, the high endogenous estrogen exposure in women was indicated to be a protective factor, which explains the higher incidence of Intestinal GC in men [36]. Regarding GOs, peculiar for the Intestinal type of GC were those involved in cell division, chromosome segregation and embryo development, delineating a different biology for this GC histological type (Supplementary Materials File S3). Overall, based on DEGs and functional enrichment through GSA, we highlighted two distinct biological phenotypes. An invasive behavior is characterized by the upregulation of EMT-related genes in the Diffuse type, and a proliferative behavior is characterized by the upregulation of cell cycle-related genes in the Intestinal type.

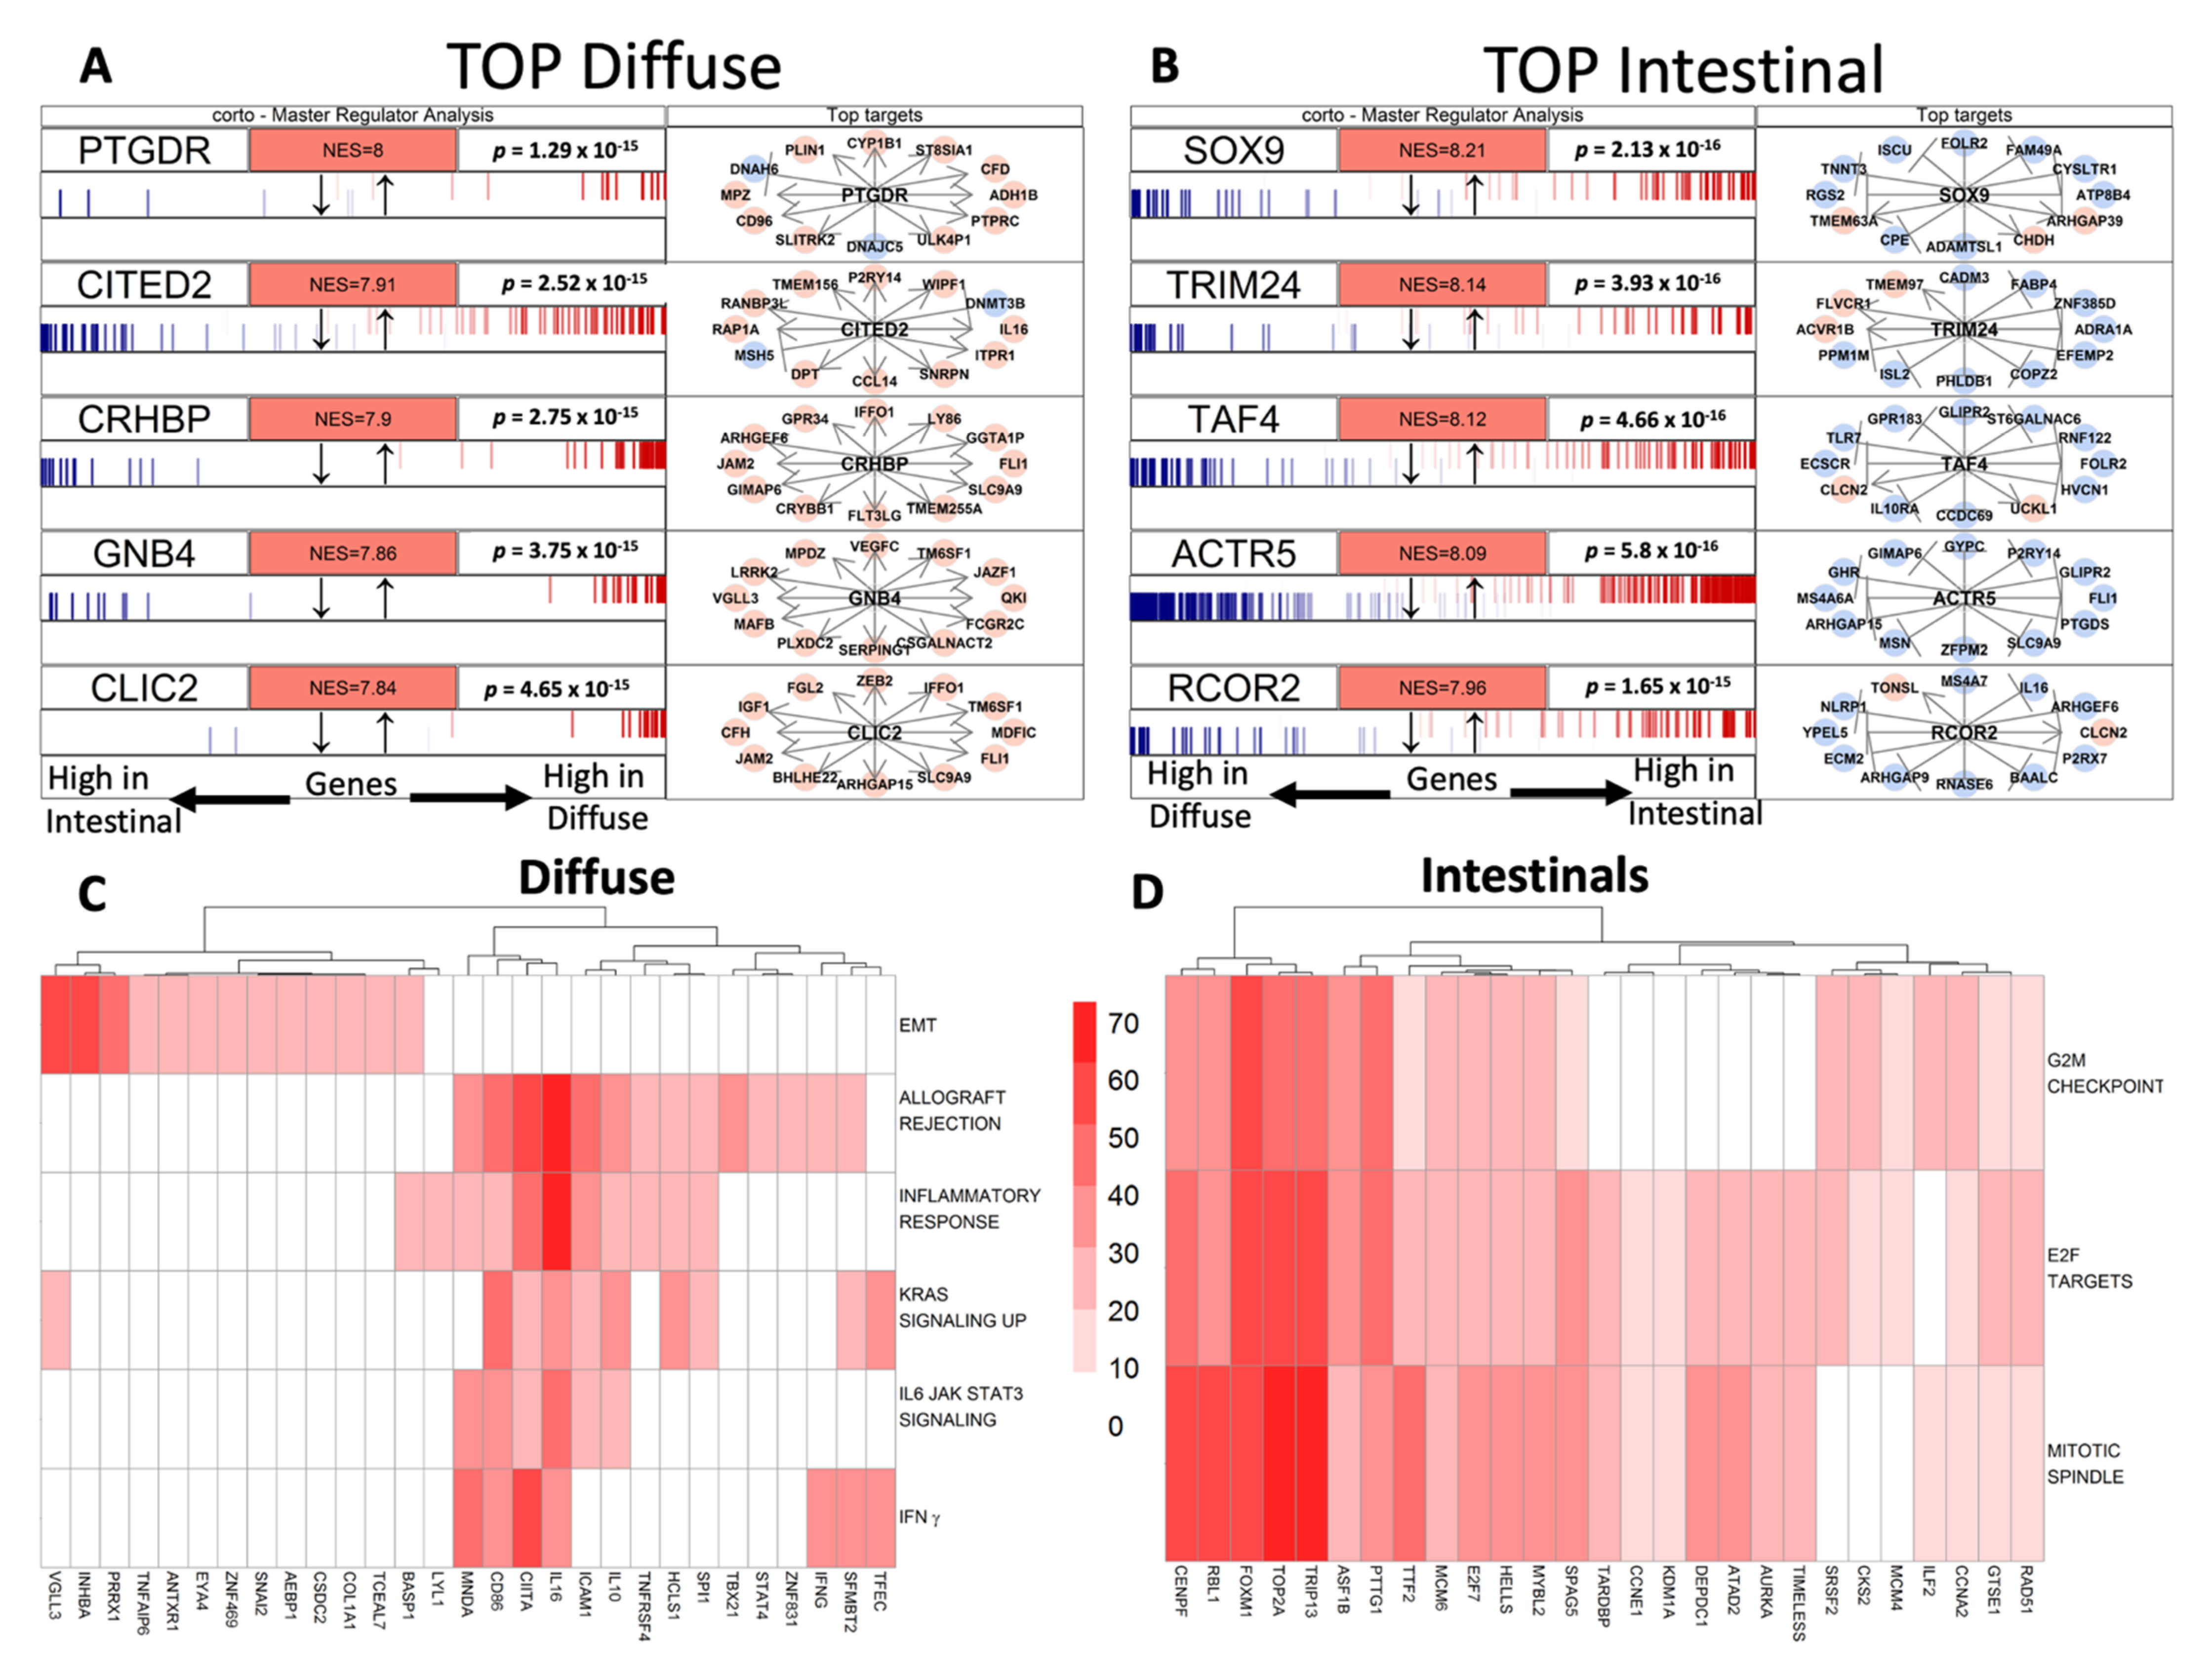
3.3. Gene Regulatory Networks Highlights Different Putative Hub Genes

We aimed to focus on MRs eligible for pathway-targeting therapy. First, we pictured the gene interdependence and exploited the inferred GC gene regulatory network. According to Carro M.S. and Chen J.C. [37,38], we obtained a set of putative MRs, each activating or repressing its inferred small subnetwork known as a regulon. In Figure 2A,B, as an example, we reported the top five MRs in Diffuse and Intestinal GCs. A complete MR list is reported in Supplementary Materials File S4.
Out of the 3608 significant MRs (p-value <0.01), 2058 were active in Diffuse GC while 1550 were active in Intestinal GC. Beyond the statistical significance of MRs, we focused our study on those that were likely relevant to cancer biology features by overlapping each MR’s regulon with significantly enriched gene sets from the GSA analysis. In this way, we aimed to give a biological characterization of the data-driven regulons which were significantly overrepresented by MR analysis. Hallmark gene sets, more than the others, immediately summarized and suggested specific well-defined biological states; thus, we focused on MRs overlapping with them (Figure 2C,D). Overlaps with the other gene set collections are reported in Supplementary Materials Figures S9–S18. Among those with the highest enrichment score, the regulon VGLL3, an unfavorable prognostic marker in GC [39], resulted in the highest association with EMT (Figure 2C) in Diffuse GCs as well as with the invasiveness signature resulting from the interactions between cancer cells and the microenvironment (Supplementary Materials Figure S10). We also found a significant overlap between the HLF’s targets and the VGLL3 regulon (Supplementary Materials Figure S11). In line with the hallmarks, VGLL3, INHBA and PRRX1, Diffuse GC regulons intersected with GOs relative to collagen synthesis and extracellular matrix organization. This biological phenotype seemed to be also regulated by miRNAs. Indeed, among the significantly enriched motifs overlapping with VGLL3, INHBA and PRRX1 regulons, we found MIR5682, MIR29A_3P and MIR29B_3P/MIR29C_3P ones (Supplementary Materials Figure S11). These miRNAs shared 174 target genes, which were mainly involved in extracellular matrix organization. Three MRs, namely CD86, CIITA and IL-16, seemed to characterize an immune signature of the Diffuse GC subtype considering the overlap with IFN-γ, KRAS, inflammatory response and allograft rejection (Figure 2C). Moreover, the invasive biology of the Diffuse type of GC could also be explained by the association of CD86, CIITA and IL-16 MR activity with the enrichment of IL6, JAK and STAT3 signaling. The overlap between the three MRs and the chr1q23 and chr7q34 cytogenetic bands (Supplementary Materials Figure S9), where localized genes are involved in lymphocyte activation and antigen presentation to T cells (CD84, CD48, CD1C) and gene coding for several T cell receptor variable regions, seemed to define an activation of the T cell-mediated response. In addition, CD86, IL16 and CIITA regulons intersected with several GO gene sets (Supplementary Materials Figure S12) confirming their role in T cell activity regulation and IFN-γ production. Finally, the CIITA regulon was significantly associated with MAML1 and ETS target genes (Supplementary Materials Figure S11), which were involved in the regulation of differentiation, survival and proliferation of lymphoid cells, even with the expression of cytokines and chemokines. On the contrary, in Intestinal GC, the regulons of the active MRs, FOXM1 and TOP2A, resulted in strongly associated hallmark and GO, relative to the mitotic spindle assembly, G2/M checkpoint and E2F gene sets (Figure 2D) together with Kang doxorubicin resistance and the Farmer breast cancer cluster 2 (proliferation and 8q amplicon genes) gene set, respectively (Supplementary Materials Figure S15). The HNF1 transcription factor gene set appeared enriched in Intestinal GC (Supplementary Materials Figure S16) while, beyond the 8q24 band (as expected from enriched the Farmer breast cancer cluster 2), the chrXq28 band resulted in significant association between the regulons of the SSX1, SSX4 and SOLHLH1 MRs, which are involved in stem cell maintenance and are indicated as cancer and testis antigens (Supplementary Materials Figure S14). By highlighting the biologically relevant gene networks active in the two histological types of GC, a distinct cancer cell phenotype was confirmed for Diffuse and Intestinal GCs. Moreover, several putative target genes that may modify the aberrant cell phenotype clearly emerged.

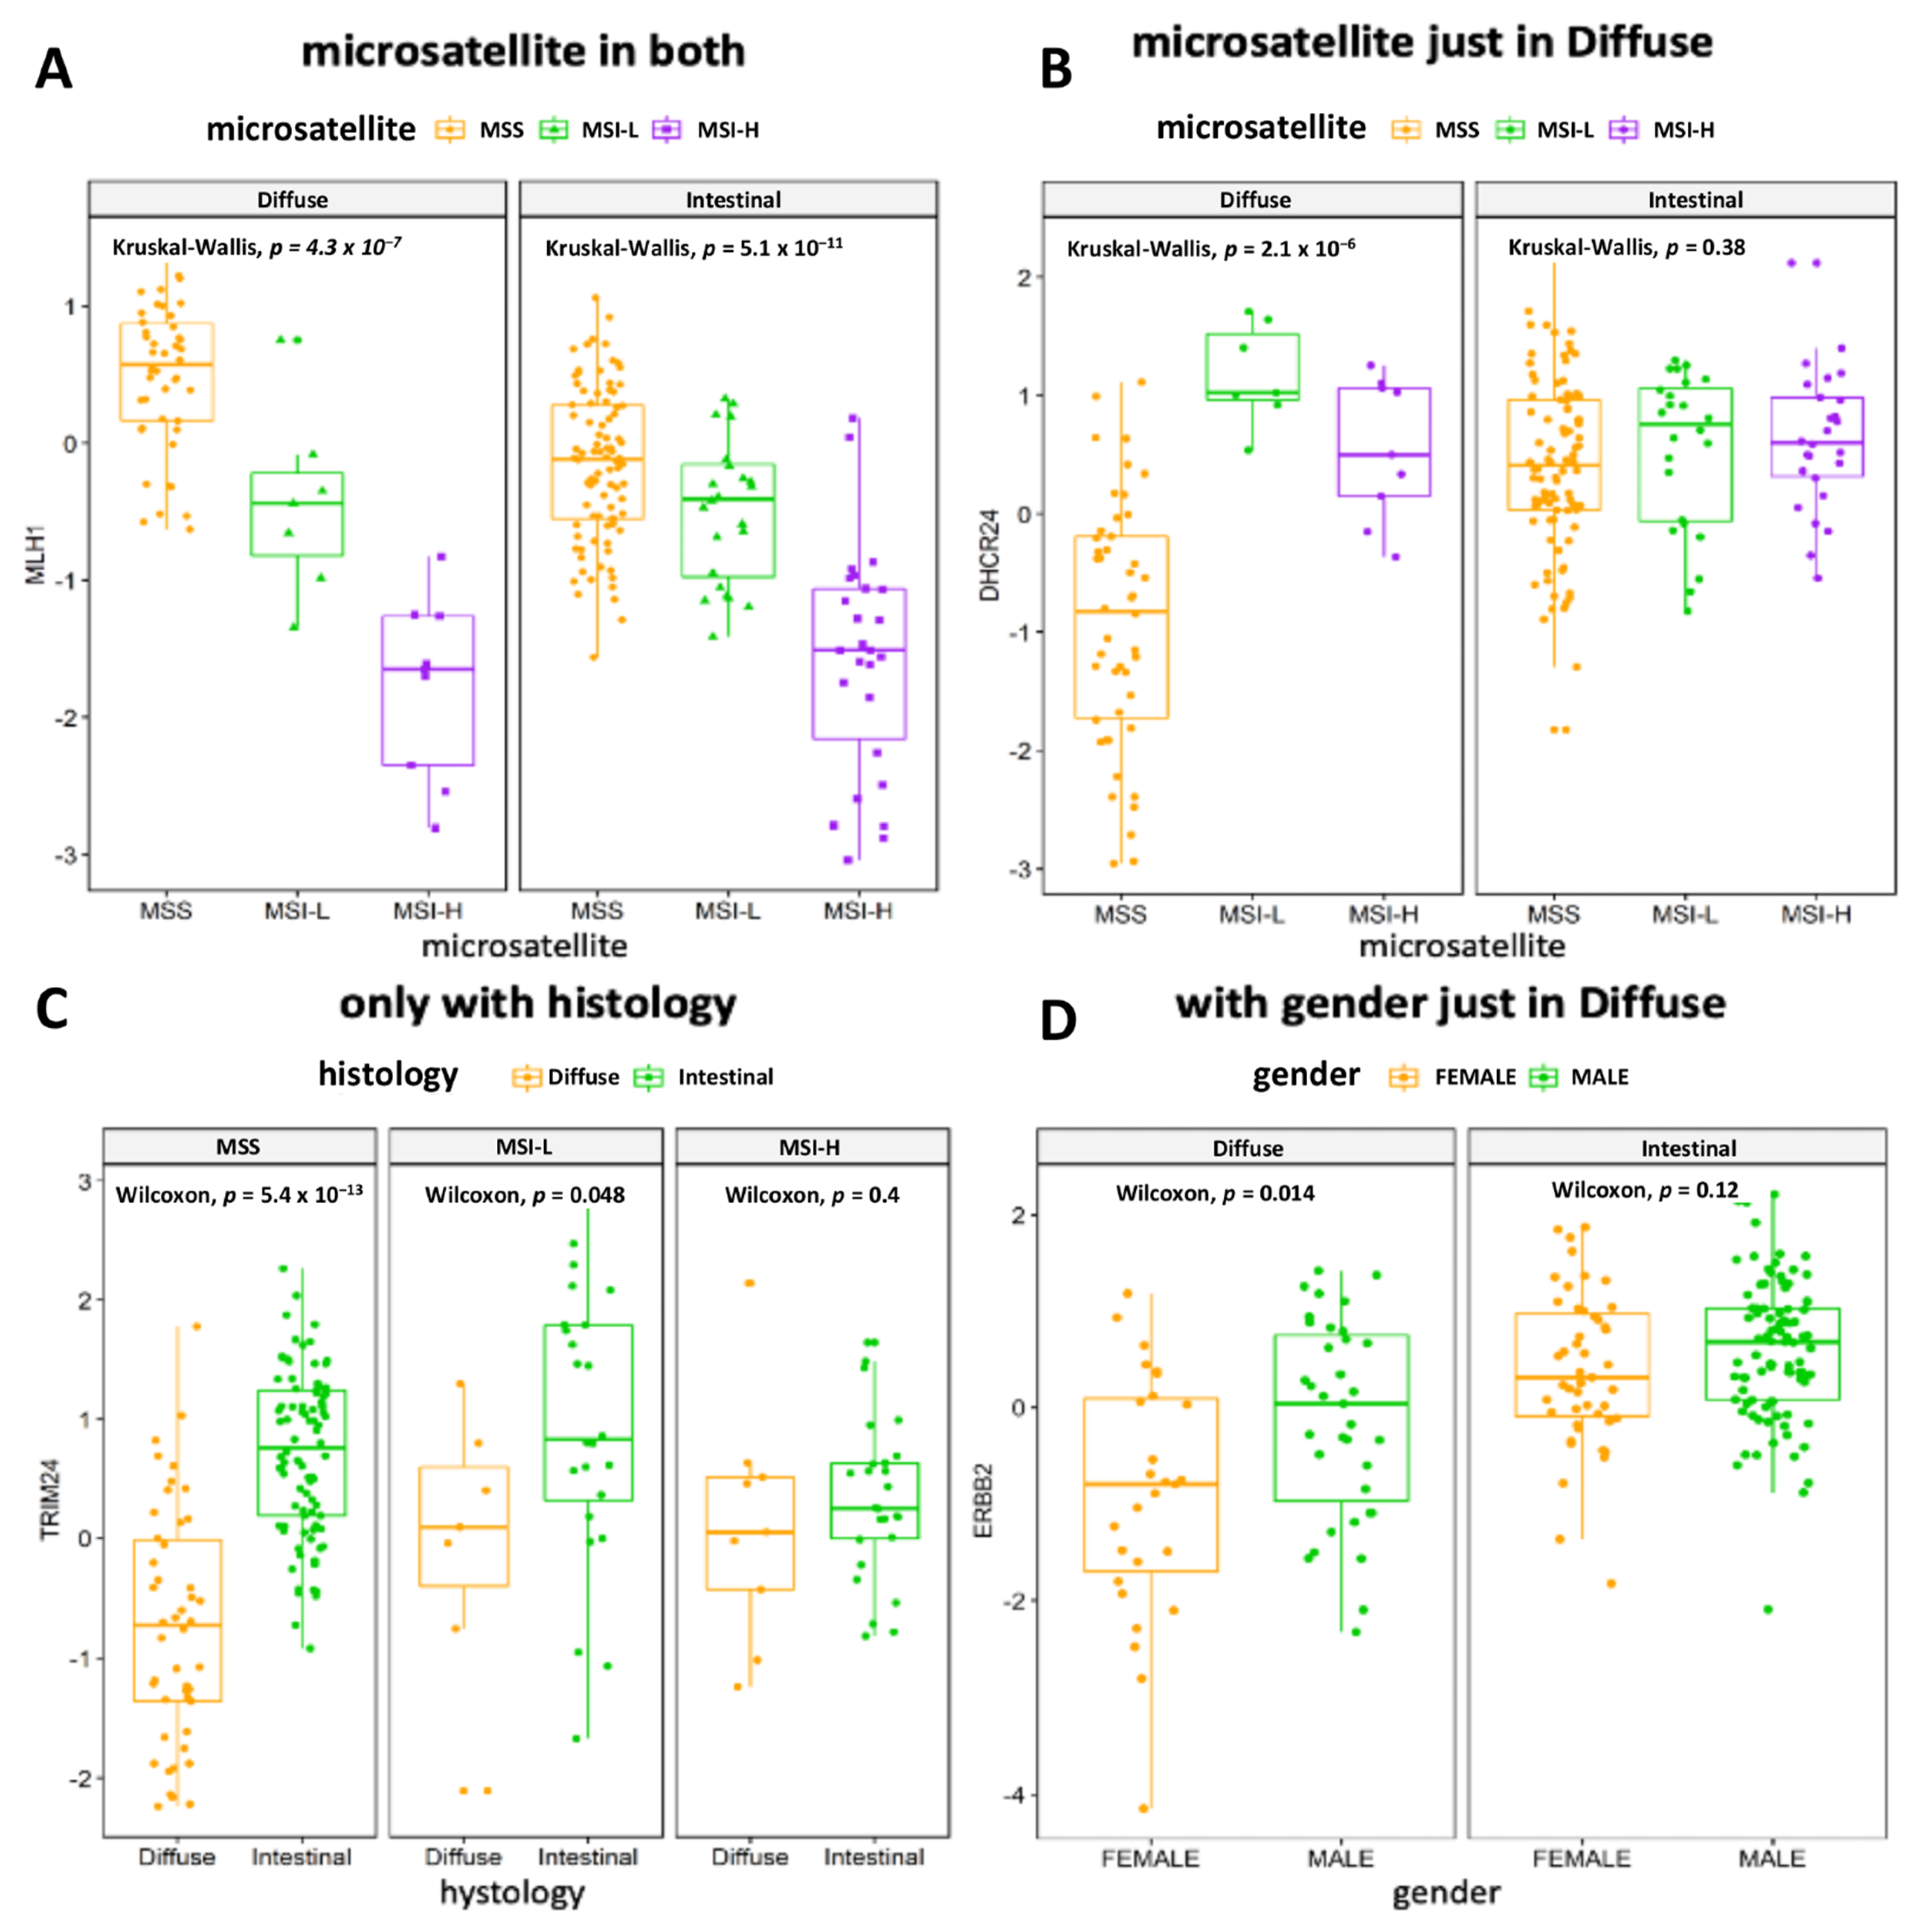
3.4. The Association of MRs Activity with Clinical Variables or Prognosis Confirms the Relevance of Underlying Molecular Profile

Although the two histological subgroups investigated here are widely recognized in clinical practice, their consistency is weakened by molecular and clinical heterogeneity. We aimed to highlight the more homogeneous subnetworks for each subtype and pinpoint subnetworks related to patient outcomes and tumor features, even if not related to the histological division. Accordingly, we highlighted some interesting MR examples. We performed an ssGSEA and obtained the grade of activation or deactivation (NES) for each gene set in each sample by identifying those MRs capable of influencing patient outcomes and GC natural history. The heatmap in Supplementary Materials Figure S19 depicts the profile of the top five MRs in Diffuse and Intestinal GCs for each sample. Thanks to this analysis, we can pinpoint the MRs that more homogeneously associate with the Diffuse or Intestinal groups or molecularly identify different samples, which may be candidates for a different classification or treatment strategy. To characterize the activity of each MR, we investigated, with a linear model, the association between histological and molecular characteristics. Meaningful results (F-test p-value < 0.05) are reported in Supplementary Materials File S5. As proof of concept, we explored some interesting results given to the community in a useful dataset to generate hypotheses. The MLH1 NES strongly associated with the microsatellite status in both Diffuse and Intestinal GC samples as depicted in Figure 3A, being a factor independent from histology.
Differences between the two subgroups can also be appreciated, as is the case of MR DHCR24 in Figure 3B, which was significantly associated with microsatellite status in the Diffuse but not Intestinal samples. Moreover, in Figure 3C, we can appreciate the case of the MR TRIM24 as very differently active in Intestinal vs. Diffuse GC only in the MSS samples. These examples showed the possibility of exploring the association of an MR with any clinical feature when its behavior is homogeneous or different between subgroups or is different among feature levels. Lastly, in Figure 3D, the MR ERBB2 results were significantly associated with gender in the Diffuse but not Intestinal samples, suggesting a putative gender- and histology-driven rethink of treatment strategies. Using the Cox proportional-hazards model, we described the change in OS, DSS, DFS or PFI if the NES of the MRs rose by one unit. In Supplementary Materials File S6, we report all the significant results (p-value < 0.05). Interestingly, the MR CGB5, having the higher hazard ratio (HR) considering OS, DSS and PFI results, was associated with a worse prognosis while the MR ARHGAP33 results, having the lower HR considering DSS and PFI and the second lowest by OS, were associated with a better prognosis. For each patient and for every additional NES unit of the MR CGB5, the risk of death, disease-specific death and disease progression increased by 79% (HR 1.79), 152% (HR 2.52) and 112% (HR 2.12), respectively. On the contrary, for each patient and every additional NES unit of the MR ARHGAP33, the risk of death, death by disease and disease progression fell by 30% (HR 0.70), 44% (HR 0.56) and 48% (HR 0.52), respectively. When we looked at the Cox proportional-hazards model results, focusing on the MRs previously highlighted, it was very easy to pinpoint the HR of the VGLL3, INHBA and PRRX1 regulons, 27% (HR 1.27), 44% (HR 1.44) and 46% (HR 1.46). The worst prognosis, related to a higher activity of regulons, was associated (p-value << 0.001) with Diffuse tumors and a greater tumor mass (TNM:T). In addition, among the worst prognosis of MRs associated with EMT, there was SNAI2 (OS HR: 1.51 and DSS HR: 1.52). ILF3 regulon was associated with a better prognosis (DFI HR 0.53 and PFI HR 0.75) and with high activity in Intestinal tumors (p-value << 0.001). Moreover, the ACIN1 (an apoptosis-related gene) regulon (see Supplementary Materials Figure S20) was associated with a better prognosis (OS HR 0.73 and DSS HR 0.68 and PFI HR 0.67) and with high activity in Intestinal tumors (p-value < 0.001). According to Townson SM et al. [40], the SAFB gene acts as a negative regulator of cell proliferation. This evidence corroborated our result showing that the high activity of the SAFB regulon (see Supplementary Materials Figure S21) in Intestinal tumors was strongly associated (p-value << 0.001) with a better prognosis (OS HR 0.78, DSS HR 0.73 and PFI HR 0.78). Finally, our results were validated in the ACRG and GSE15459 cohort, by performing differential gene expression analyses on GSA and MRA in Diffuse and Intestinal GCs. We reported, as Venn diagrams, the overlaps among the DEGs (Figure 4A,B) and MRs (Figure 4C,D).
In Table 3, we report the amount of overlapping enrichments between TCGA-STAD and each validation dataset.
Moreover, 59 MRs associated with the OS by Cox analysis in the TCGA dataset were confirmed in both ARCG and GSE15459 (Supplementary Materials File S7). Among them, there are some of the biologically characterized Diffuse MRs like SNAI2, ANTXR1, PRRX1, EYA4, VGLL3, AEBP1, PDGFRB, THY1, LZTS1 and FSTL1. Using this approach, we identified a set of clinically relevant MRs that more homogeneously associated with the Diffuse or Intestinal type of GC or associated with a known clinical feature. These data may be useful to characterize patients, addressing them to a different classification or treatment strategy.

4. Discussion

Despite its decreasing incidence, GC remains one of the most common causes of death for neoplasm worldwide. Recent epidemiological trends indicate a relative increase in the rate of the Diffuse histotype, especially in western countries [41,42,43,44,45]. The biological bases of the Diffuse type of GC behavior are still poorly characterized and, in particular, a precise signaling network reconstruction is lacking. In this work, we aimed to highlight the molecular determinants that characterize the two main histological GC subtypes by generating a biological network-based model. We first investigated the relations among the histological groups and the other clinicopathological data, finding a relevant association with the pathologic stage, the TNM:N and therapy outcomes. Moreover, by multivariate Cox proportional hazards analysis, we found that histology and pathologic stages were independent factors influencing overall survival. Since several histological groups were numerically too small for suitable analyses, we divided the samples into two transcriptionally homogeneous groups: Diffuse (poorly cohesive, not SRC) and Intestinal (tubular and iNOS). We highlighted that there was no significant association between these groups and clinicopathological data as well as survival. According to this, the clinical and survival differences reported above could be imputed to the SRC and non-tubular Intestinal groups. Subsequently, we deployed a computational pipeline aimed to highlight the key genes, networks and pathways characterizing the two groups. Differential expression analysis produced two refined lists of GC histology-related candidate biomarkers. Enrichment analyses, as well as master regulator analyses, highlighted a greater number of activated gene sets and regulons in Diffuse than in Intestinal GC. The MRs, by their nature, represented a robust way to describe key genes and network features of a characterized group. The regulons, being data-inferred subnetworks, might have a cryptical biological meaning so the overlap with significantly enriched gene sets strongly hints about their function as a biological labeler. This step allowed us to select activated subnetworks showing literature-derived, biologically interesting features but retained possibly related non-literature-derived gene connections. The ssMRA allowed us to investigate the homogeneity of the subgroups’ MRs, pinpointing which MR might be a better candidate for this classification and which one could lead to a different classification or treatment strategy. As matter of fact, the activity of many MRs showed an association with survival while there was no difference between the Diffuse and Intestinal subgroups, hinting at a possible different classification. Interestingly, two independent datasets validated many of the results confirming the goodness of the computational pipeline and showing the robustness of the MR analysis across different datasets. It is important to remember that the MR represents an entire network (the regulon), suggesting the underlying molecular explanation of the observed biological behavior. For example, the Cox proportional-hazards model associates the MR VGLL3 with a worse prognosis and the Fisher test associates VGLL3 with Diffuse tumors and a greater tumor mass (TNM:T), according to a previous report [39]. In this way, we pinpointed the field of investigation for possible subsequent studies because we suggested a wide, biologically coherent network, rather than a single gene associated with survival. Indeed, we speculated that the negative impact of VGLL3 activity on a patient’s prognosis could be related to its role in modulating EMT, collagen synthesis and extracellular matrix organization as highlighted by the intersection of the gene network and several gene sets. Its biological activity has also been demonstrated in vitro by Hori N et al., who described the promotion of an EMT-like phenotype and an increased motility in VGLL3-expressing lung cancer cells [46]. SNAI2 is another enriched MR. It is a prototypical epithelial-to-mesenchymal transition transcriptional factor, which promotes the loss of cell adhesion and polarity, conferring a migratory and invasive phenotype. SNAI2 is also indicated as a molecular determinant of cancer stem cell behavior and therapy resistance [47].
Our study showed that the Diffuse type of GC was also characterized by the dysregulation of immune signaling that, according to Hill et al., created a favorable microenvironment promoting tumor progression, invasiveness, angiogenesis and metastasis [48]. The role of MRs involved in this crosstalk between cancer and immune cells can be dual either modulating or stimulating the immune system. Indeed, CD86 is known to bind CTLA-4 to inhibit antigen presenting cells and the activation of T cells [49]. CIITA and IL16 promote immune cell activation and a pro-inflammatory microenvironment that can compromise the integrity of the gastric epithelium. It has been demonstrated that CIITA promotes the expression of MHC class II, which favor CD8+ T cell activation, and that its expression is induced by IFN-γ [9,50,51], a significantly enriched hallmark that we found in the Diffuse type of GC. Interestingly, IFN-γ seemed to also be a driver of disease progression during chronic gastritis to metaplasia by direct killing gastric parietal cells [52]. Similarly, IL-16 activity was found to be associated with disease progression in many cancer types, including those of the gastrointestinal tract [53]. A pro-inflammatory microenvironment can also be explained by the enrichment of the KRAS signaling hallmark, since it includes several genes that code for chemokines and cytokines (LIF, CXCL10, etc.), which overlap with those in the other immune hallmarks. The heatmaps evidencing the association of MRs with GOs, pathways and other gene sets enriched in Diffuse or Intestinal GC subtypes remark the biological features outlined by hallmarks. The overlap between the three MRs highly enriched in Diffuse GC and positional gene sets seemed to define an activation of the T cell-mediated response. Indeed, in the chr1q23 cytogenetic band localized genes were involved in lymphocyte activation and antigen presentation to T cells (CD84, CD48, CD1C). On the other hand, Intestinal GC was characterized by MRs (such as FOXM1, TOP2A and CENPF) involved in mitotic spindle assembly, G2/M checkpoint regulation and expression of E2F target genes, suggesting a proliferative phenotype. The association between a proliferative GC subtype and Intestinal histology was previously reported to be characterized by the upregulation of the centromeric family of proteins (CENPs), among them CENPF [54]. Authors demonstrated that CENPs, in particular CENP-I, promoted cell proliferation and migration, apoptosis inhibition and EMT and is associated with the TP53 mutation. Interestingly, ATM and p53 regulated FOXM1 expression via E2F in Epirubicin resistant breast cancer [55], highlighting a possible connection between CENPF, FOXM1 and E2F regulons. The FOXM1 regulon also showed great overlap with Kang doxorubicin resistance gene set. Recently, Qi W. et al. demonstrated that the regulation of the level of ERBB2 in the gastric cancer cell lines, accordingly produced a change in the expression of FOXM1, indicating that the expression level of FOXM1 was at least partially regulated by ERBB2 [56]. Interestingly, Qi W. et al. also revealed that FOXM1 and ERBB2 expression was associated with poor survival. Similarly, the E2F family of transcription factors (E2Fs) regulated many cellular processes, canonically cell cycles but also angiogenesis, DNA damage response, apoptosis and drug resistance both in cancer and cancer stem cells [34]. According to these findings, in Intestinal GC, the chrXq28 band resulted in significantly associated activity between SSX1, SSX4 and SOLHLH1 MRs, which are involved in stem cell maintenance and are indicated as cancer and testis antigens [57]. The enriched positional gene set included genes that seemed to play a role in embryonic development [58], GC transformation and progression (the MAGEA gene family) [59] and telomere maintenance (DKC1) [60]. Interestingly, this cytogenetic band included genes of the PRAME regulon that is known to confer a growth advantage to cancer cells [61,62]. In addition, Intestinal GC enrichment of HNF1 transcription factor target motifs suggested a marked transcriptional activity and modulation of cholesterol and sterol homeostasis, essential for cell division [63]. HNF1 proteins also regulate the embryonic development of gastrointestinal tract organs [64].

5. Conclusions

Our results showed that distinct biological features characterize Diffuse and Intestinal gastric cancers, suggesting molecular bases for clinicopathological differences between the two histotypes. In particular, Diffuse GC is characterized by the alteration of pathways involved in immune cell regulation and extracellular matrix organization, while the Intestinal type is associated with impairments to the cell cycle regulation pathways and alteration of response to growth factors and hormones. Overall, the histological differences between Diffuse and Intestinal GC are based on genetic and epigenetic factors and neither of these two ways can be ignored. Many studies have shown that unveiling the molecular complexity of cancer can help predict specific cancer biomarkers (diagnostic, prognostic and drug-susceptibility) and design biological network-based anti-cancer therapies [7,22,23] by shifting from a single-gene to a gene-network personalized therapy approach. The characterization of these signaling networks could also lead to the identification of targets aimed to improve anti-tumor immunity and overcome the immune escape mechanisms of cancer cells. This is because gene regulatory networks can help to resolve key issues in cancer research by reflecting information from multiple regulatory levels.

Supplementary Materials

The following supporting information can be downloaded at: https://www.mdpi.com/article/10.3390/cancers14194961/s1. Figure S1: Plot of the significant association between the histological subgroups and, stage and TNM:N categories in TCGA STAD. Figures S2–S5: Forest plot of the stepwise selected clinical features associated with the survival by multivariate Cox analysis. Figure S6: Plot of the significant association between the revised histological subgroups, stage and TNM:N categories in TCGA STAD. Figure S7: Venn diagram of the upregulated genes in Diffuse vs. all the Intestinal samples and the two most abundant Intestinal (tubular and NOS) subgroups in the TCGA STAD dataset. Figure S8: Workflow. Figures S9–S18: HMs of the overlaps between regulons and ontologies. Figure S19: Heatmap of the top five Diffuse and Intestinal MRs. Figure S20: Heatmap of ACIN1 regulon associated with a better prognosis and high activity in Intestinal tumors. Figure S21: Heatmap of SAFB regulon associated with a better prognosis and high activity in Intestinal tumors. Table S1: Summary of the GC clinical data. File S1: Differentially expressed genes. File S2: Ontologies enriched in Diffuse tumor. File S3: Ontologies enriched in Intestinal tumor. File S4: Master regulators differentially active between Diffuse vs. Intestinal. File S5: Histological and molecular characteristics associated with master regulators. File S6: Survival associated with MR’s NES. File S7: Survival associated with MR’s NES in validation dataset.

Author Contributions

Conceptualization, P.Z., G.F. and S.R.; methodology, P.Z. and G.C.; validation, P.Z., S.R. and G.C.; resources, L.M., L.C., D.S. and G.M.; data curation, L.M., L.C., S.L. and P.M.; writing—original draft preparation, S.R. and P.Z.; writing—review and editing, G.F., F.R., A.S., G.N. and S.L.; supervision, P.Z. and G.F. All authors have read and agreed to the published version of the manuscript.

Funding

The study was supported by: Finanziamento Ricerca Corrente 2022, Italian Ministry of Health; 5 × 1000 funds from Italian Ministry of Health. The funders had no role in study design, data collection and analysis, decision to publish or preparation of the manuscript.

Institutional Review Board Statement

Not applicable.

Informed Consent Statement

Not applicable.

Data Availability Statement

Data was obtained from the TGCA, GTEx and GEO repositories [third party] and are available at https://xenabrowser.net/datapages/ (accessed on 15 June 2021) and at https://www.ncbi.nlm.nih.gov/geo/ (accessed on 15 June 2021).

Conflicts of Interest

The authors declare no conflict of interest.

References

  1. Sung, H.; Ferlay, J.; Siegel, R.L.; Laversanne, M.; Soerjomataram, I.; Jemal, A.; Bray, F. Global cancer statistics 2020: GLOBOCAN estimates of incidence and mortality worldwide for 36 cancers in 185 countries. CA Cancer J. Clin. 2021, 71, 209–249. [Google Scholar] [CrossRef] [PubMed]
  2. Knight, W.R.; Allum, W.H. Gastric tumours. Medicine 2019, 47, 309–313. [Google Scholar] [CrossRef]
  3. Cisło, M.; Filip, A.A.; Arnold Offerhaus, G.J.; Ciseł, B.; Rawicz-Pruszyński, K.; Skierucha, M.; Polkowski, W.P. Distinct molecular subtypes of gastric cancer: From Laurén to molecular pathology. Oncotarget 2018, 9, 19427–19442. [Google Scholar] [CrossRef] [PubMed] [Green Version]
  4. Lauren, P. The two histological main types of gastric carcinoma: Diffuse and so-called intestinal-type carcinoma. An attempt at a histo-clinical classification. Acta Pathol. Microbiol. Scand. 1965, 64, 31–49. [Google Scholar] [CrossRef]
  5. Fléjou, J.-F. [WHO Classification of digestive tumors: The fourth edition]. Ann. Pathol. 2011, 31, S27–S31. [Google Scholar] [CrossRef]
  6. Cancer Genome Atlas Research Network. Comprehensive molecular characterization of gastric adenocarcinoma. Nature 2014, 513, 202–209. [Google Scholar] [CrossRef] [Green Version]
  7. Cristescu, R.; Lee, J.; Nebozhyn, M.; Kim, K.-M.; Ting, J.C.; Wong, S.S.; Liu, J.; Yue, Y.G.; Wang, J.; Yu, K.; et al. Molecular analysis of gastric cancer identifies subtypes associated with distinct clinical outcomes. Nat. Med. 2015, 21, 449–456. [Google Scholar] [CrossRef]
  8. Böger, C.; Krüger, S.; Behrens, H.M.; Bock, S.; Haag, J.; Kalthoff, H.; Röcken, C. Epstein-Barr virus-associated gastric cancer reveals intratumoral heterogeneity of PIK3CA mutations. Ann. Oncol. 2017, 28, 1005–1014. [Google Scholar] [CrossRef]
  9. Lee, H.H.; Kim, S.Y.; Jung, E.S.; Yoo, J.; Kim, T.-M. Mutation heterogeneity between primary gastric cancers and their matched lymph node metastases. Gastric Cancer 2019, 22, 323–334. [Google Scholar] [CrossRef] [Green Version]
  10. Mathiak, M.; Warneke, V.S.; Behrens, H.-M.; Haag, J.; Böger, C.; Krüger, S.; Röcken, C. Clinicopathologic characteristics of microsatellite instable gastric carcinomas revisited: Urgent need for standardization. Appl. Immunohistochem. Mol. Morphol. 2017, 25, 12–24. [Google Scholar] [CrossRef]
  11. Pectasides, E.; Stachler, M.D.; Derks, S.; Liu, Y.; Maron, S.; Islam, M.; Alpert, L.; Kwak, H.; Kindler, H.; Polite, B.; et al. Genomic heterogeneity as a barrier to precision medicine in gastroesophageal adenocarcinoma. Cancer Discov. 2018, 8, 37–48. [Google Scholar] [CrossRef] [PubMed] [Green Version]
  12. Polom, K.; Böger, C.; Smyth, E.; Marrelli, D.; Behrens, H.-M.; Marano, L.; Becker, T.; Lordick, F.; Röcken, C.; Roviello, F. Synchronous metastatic gastric cancer-molecular background and clinical implications with special attention to mismatch repair deficiency. Eur. J. Surg. Oncol. 2018, 44, 626–631. [Google Scholar] [CrossRef] [PubMed]
  13. Marrelli, D.; Polom, K.; Pascale, V.; Vindigni, C.; Piagnerelli, R.; De Franco, L.; Ferrara, F.; Roviello, G.; Garosi, L.; Petrioli, R.; et al. Strong Prognostic Value of Microsatellite Instability in Intestinal Type Non-cardia Gastric Cancer. Ann. Surg. Oncol. 2016, 23, 943–950. [Google Scholar] [CrossRef]
  14. Marrelli, D.; Polom, K.; Neri, A.; Roviello, F. Clinical impact of molecular classifications in gastric cancer. Updates Surg. 2018, 70, 225–232. [Google Scholar] [CrossRef]
  15. Polom, K.; Marano, L.; Marrelli, D.; De Luca, R.; Roviello, G.; Savelli, V.; Tan, P.; Roviello, F. Meta-analysis of microsatellite instability in relation to clinicopathological characteristics and overall survival in gastric cancer. Br. J. Surg. 2018, 105, 159–167. [Google Scholar] [CrossRef] [PubMed]
  16. Sohn, B.H.; Hwang, J.-E.; Jang, H.-J.; Lee, H.-S.; Oh, S.C.; Shim, J.-J.; Lee, K.-W.; Kim, E.H.; Yim, S.Y.; Lee, S.H.; et al. Clinical significance of four molecular subtypes of gastric cancer identified by the cancer genome atlas project. Clin. Cancer Res. 2017, 23, 4441–4449. [Google Scholar] [CrossRef] [PubMed] [Green Version]
  17. Wang, Q.; Xie, Q.; Liu, Y.; Guo, H.; Ren, Y.; Li, J.; Zhao, Q. Clinical characteristics and prognostic significance of TCGA and ACRG classification in gastric cancer among the Chinese population. Mol. Med. Rep. 2020, 22, 828–840. [Google Scholar] [CrossRef]
  18. Zhang, M.; Hu, S.; Min, M.; Ni, Y.; Lu, Z.; Sun, X.; Wu, J.; Liu, B.; Ying, X.; Liu, Y. Dissecting transcriptional heterogeneity in primary gastric adenocarcinoma by single cell RNA sequencing. Gut 2021, 70, 464–475. [Google Scholar] [CrossRef]
  19. Min, L.; Zhao, Y.; Zhu, S.; Qiu, X.; Cheng, R.; Xing, J.; Shao, L.; Guo, S.; Zhang, S. Integrated analysis identifies molecular signatures and specific prognostic factors for different gastric cancer subtypes. Transl. Oncol. 2017, 10, 99–107. [Google Scholar] [CrossRef]
  20. Wang, Q.; Armenia, J.; Zhang, C.; Penson, A.V.; Reznik, E.; Zhang, L.; Minet, T.; Ochoa, A.; Gross, B.E.; Iacobuzio-Donahue, C.A.; et al. Unifying cancer and normal RNA sequencing data from different sources. Sci. Data 2018, 5, 180061. [Google Scholar] [CrossRef]
  21. Barrett, T.; Wilhite, S.E.; Ledoux, P.; Evangelista, C.; Kim, I.F.; Tomashevsky, M.; Marshall, K.A.; Phillippe, K.H.; Sherman, P.M.; Holko, M.; et al. NCBI GEO: Archive for functional genomics data sets--update. Nucleic Acids Res. 2013, 41, D991–D995. [Google Scholar] [CrossRef] [PubMed] [Green Version]
  22. Ooi, C.H.; Ivanova, T.; Wu, J.; Lee, M.; Tan, I.B.; Tao, J.; Ward, L.; Koo, J.H.; Gopalakrishnan, V.; Zhu, Y.; et al. Oncogenic pathway combinations predict clinical prognosis in gastric cancer. PLoS Genet. 2009, 5, e1000676. [Google Scholar] [CrossRef] [PubMed] [Green Version]
  23. Russi, S.; Calice, G.; Ruggieri, V.; Laurino, S.; La Rocca, F.; Amendola, E.; Lapadula, C.; Compare, D.; Nardone, G.; Musto, P.; et al. Gastric normal adjacent mucosa versus healthy and cancer tissues: Distinctive transcriptomic profiles and biological features. Cancers 2019, 11, 1248. [Google Scholar] [CrossRef] [PubMed] [Green Version]
  24. Mariette, C.; Carneiro, F.; Grabsch, H.I.; van der Post, R.S.; Allum, W.; de Manzoni, G. European Chapter of International Gastric Cancer Association Consensus on the pathological definition and classification of poorly cohesive gastric carcinoma. Gastric Cancer 2019, 22, 1–9. [Google Scholar] [CrossRef] [Green Version]
  25. Hu, B.; El Hajj, N.; Sittler, S.; Lammert, N.; Barnes, R.; Meloni-Ehrig, A. Gastric cancer: Classification, histology and application of molecular pathology. J. Gastrointest. Oncol. 2012, 3, 251–261. [Google Scholar] [CrossRef] [PubMed]
  26. McCarthy, D.J.; Chen, Y.; Smyth, G.K. Differential expression analysis of multifactor RNA-Seq experiments with respect to biological variation. Nucleic Acids Res. 2012, 40, 4288–4297. [Google Scholar] [CrossRef] [Green Version]
  27. Liberzon, A.; Birger, C.; Thorvaldsdóttir, H.; Ghandi, M.; Mesirov, J.P.; Tamayo, P. The Molecular Signatures Database (MSigDB) hallmark gene set collection. Cell Syst. 2015, 1, 417–425. [Google Scholar] [CrossRef] [Green Version]
  28. Yu, G.; Wang, L.-G.; Han, Y.; He, Q.-Y. clusterProfiler: An R package for comparing biological themes among gene clusters. OMICS 2012, 16, 284–287. [Google Scholar] [CrossRef]
  29. Mercatelli, D.; Ray, F.; Giorgi, F.M. Pan-Cancer and Single-Cell Modeling of Genomic Alterations Through Gene Expression. Front Genet. 2019, 10, 671. [Google Scholar] [CrossRef] [Green Version]
  30. Giorgi, F.M.; Lachmann, A.; Lopez, G.; Califano, A. ARACNe-AP: Gene network reverse engineering through adaptive partitioning inference of mutual information. Bioinformatics 2016, 32, 2233–2235. [Google Scholar] [CrossRef]
  31. Mercatelli, D.; Lopez-Garcia, G.; Giorgi, F.M. corto: A lightweight R package for gene network inference and master regulator analysis. Bioinformatics 2020, 36, 3916–3917. [Google Scholar] [CrossRef] [PubMed]
  32. R Core Team. R: A Language and Environment for Statistical Computing; R Foundation for Statistical Computing: Vienna, Austria, 2019. [Google Scholar]
  33. Wickham, H. Ggplot2: Elegant Graphics for Data Analysis, 2nd ed.; Springer International Publishing: Cham, Switzerland, 2016; p. 276. ISBN 978-3-319-24277-4. [Google Scholar]
  34. Xie, D.; Pei, Q.; Li, J.; Wan, X.; Ye, T. Emerging role of E2F family in cancer stem cells. Front. Oncol. 2021, 11, 723137. [Google Scholar] [CrossRef] [PubMed]
  35. Huang, L.; Wu, R.-L.; Xu, A.-M. Epithelial-mesenchymal transition in gastric cancer. Am. J. Transl. Res. 2015, 7, 2141–2158. [Google Scholar]
  36. Chandanos, E.; Rubio, C.A.; Lindblad, M.; Jia, C.; Tsolakis, A.V.; Warner, M.; Gustafsson, J.-A.; Lagergren, J. Endogenous estrogen exposure in relation to distribution of histological type and estrogen receptors in gastric adenocarcinoma. Gastric Cancer 2008, 11, 168–174. [Google Scholar] [CrossRef] [Green Version]
  37. Carro, M.S.; Lim, W.K.; Alvarez, M.J.; Bollo, R.J.; Zhao, X.; Snyder, E.Y.; Sulman, E.P.; Anne, S.L.; Doetsch, F.; Colman, H.; et al. The transcriptional network for mesenchymal transformation of brain tumours. Nature 2010, 463, 318–325. [Google Scholar] [CrossRef] [PubMed] [Green Version]
  38. Chen, J.C.; Alvarez, M.J.; Talos, F.; Dhruv, H.; Rieckhof, G.E.; Iyer, A.; Diefes, K.L.; Aldape, K.; Berens, M.; Shen, M.M.; et al. Identification of causal genetic drivers of human disease through systems-level analysis of regulatory networks. Cell 2014, 159, 402–414. [Google Scholar] [CrossRef] [Green Version]
  39. Zhang, L.; Li, L.; Mao, Y.; Hua, D. VGLL3 is a prognostic biomarker and correlated with clinical pathologic features and immune infiltrates in stomach adenocarcinoma. Sci. Rep. 2020, 10, 1355. [Google Scholar] [CrossRef] [Green Version]
  40. Townson, S.M.; Dobrzycka, K.M.; Lee, A.V.; Air, M.; Deng, W.; Kang, K.; Jiang, S.; Kioka, N.; Michaelis, K.; Oesterreich, S. SAFB2, a new scaffold attachment factor homolog and estrogen receptor corepressor. J. Biol. Chem. 2003, 278, 20059–20068. [Google Scholar] [CrossRef] [Green Version]
  41. Roviello, F.; Marano, L.; Ambrosio, M.R.; Resca, L.; D’Ignazio, A.; Petrelli, F.; Petrioli, R.; Costantini, M.; Polom, K.; Macchiarelli, R.; et al. Signet ring cell percentage in poorly cohesive gastric cancer patients: A potential novel predictor of survival. Eur. J. Surg. Oncol. 2022, 48, 561–569. [Google Scholar] [CrossRef]
  42. Marrelli, D.; Pedrazzani, C.; Morgagni, P.; de Manzoni, G.; Pacelli, F.; Coniglio, A.; Marchet, A.; Saragoni, L.; Giacopuzzi, S.; Roviello, F.; et al. Changing clinical and pathological features of gastric cancer over time. Br. J. Surg. 2011, 98, 1273–1283. [Google Scholar] [CrossRef]
  43. Henson, D.E.; Dittus, C.; Younes, M.; Nguyen, H.; Albores-Saavedra, J. Differential trends in the intestinal and diffuse types of gastric carcinoma in the United States, 1973-2000: Increase in the signet ring cell type. Arch. Pathol. Lab. Med. 2004, 128, 765–770. [Google Scholar] [CrossRef] [PubMed]
  44. Amorosi, A.; Palli, D. Epidemiology of intestinal and difuse types of gastric carcinoma: A time-trend study in Finland with comparison between studies from high- and low-risk areas. Cancer 1994, 73, 1533. [Google Scholar] [CrossRef]
  45. Marrelli, D.; Polom, K.; de Manzoni, G.; Morgagni, P.; Baiocchi, G.L.; Roviello, F. Multimodal treatment of gastric cancer in the west: Where are we going? World J. Gastroenterol. 2015, 21, 7954–7969. [Google Scholar] [CrossRef] [PubMed]
  46. Hori, N.; Takakura, Y.; Sugino, A.; Iwasawa, S.; Nomizo, K.; Yamaguchi, N.; Takano, H.; Yamaguchi, N. Vestigial-like family member 3 stimulates cell motility by inducing high-mobility group AT-hook 2 expression in cancer cells. J. Cell. Mol. Med. 2022, 26, 2686–2697. [Google Scholar] [CrossRef]
  47. Zhou, W.; Gross, K.M.; Kuperwasser, C. Molecular regulation of Snai2 in development and disease. J. Cell Sci. 2019, 132, jcs235127. [Google Scholar] [CrossRef]
  48. Hill, D.G.; Yu, L.; Gao, H.; Balic, J.J.; West, A.; Oshima, H.; McLeod, L.; Oshima, M.; Gallimore, A.; D’Costa, K.; et al. Hyperactive gp130/STAT3-driven gastric tumourigenesis promotes submucosal tertiary lymphoid structure development. Int. J. Cancer 2018, 143, 167–178. [Google Scholar] [CrossRef] [Green Version]
  49. Sobhani, N.; Tardiel-Cyril, D.R.; Davtyan, A.; Generali, D.; Roudi, R.; Li, Y. CTLA-4 in Regulatory T Cells for Cancer Immunotherapy. Cancers 2021, 13, 1440. [Google Scholar] [CrossRef]
  50. Hippo, Y.; Yashiro, M.; Ishii, M.; Taniguchi, H.; Tsutsumi, S.; Hirakawa, K.; Kodama, T.; Aburatani, H. Differential gene expression profiles of scirrhous gastric cancer cells with high metastatic potential to peritoneum or lymph nodes. Cancer Res. 2001, 61, 889–895. [Google Scholar]
  51. Satoh, A.; Toyota, M.; Ikeda, H.; Morimoto, Y.; Akino, K.; Mita, H.; Suzuki, H.; Sasaki, Y.; Kanaseki, T.; Takamura, Y.; et al. Epigenetic inactivation of class II transactivator (CIITA) is associated with the absence of interferon-gamma-induced HLA-DR expression in colorectal and gastric cancer cells. Oncogene 2004, 23, 8876–8886. [Google Scholar] [CrossRef] [Green Version]
  52. Osaki, L.H.; Bockerstett, K.A.; Wong, C.F.; Ford, E.L.; Madison, B.B.; DiPaolo, R.J.; Mills, J.C. Interferon-γ directly induces gastric epithelial cell death and is required for progression to metaplasia. J. Pathol. 2019, 247, 513–523. [Google Scholar] [CrossRef]
  53. Richmond, J.; Tuzova, M.; Cruikshank, W.; Center, D. Regulation of cellular processes by interleukin-16 in homeostasis and cancer. J. Cell. Physiol. 2014, 229, 139–147. [Google Scholar] [CrossRef] [PubMed]
  54. Wang, J.; Liu, X.; Chu, H.-J.; Li, N.; Huang, L.-Y.; Chen, J. Centromere Protein I (CENP-I) Is Upregulated in Gastric Cancer, Predicts Poor Prognosis, and Promotes Tumor Cell Proliferation and Migration. Technol. Cancer Res. Treat. 2021, 20, 15330338211045510. [Google Scholar] [CrossRef]
  55. Millour, J.; de Olano, N.; Horimoto, Y.; Monteiro, L.J.; Langer, J.K.; Aligue, R.; Hajji, N.; Lam, E.W.F. ATM and p53 regulate FOXM1 expression via E2F in breast cancer epirubicin treatment and resistance. Mol. Cancer Ther. 2011, 10, 1046–1058. [Google Scholar] [CrossRef] [PubMed] [Green Version]
  56. Qi, W.; Li, X.; Zhang, Y.; Yao, R.; Qiu, W.; Tang, D.; Liang, J. Overexpression of Her-2 upregulates FoxM1 in gastric cancer. Int. J. Mol. Med. 2014, 33, 1531–1538. [Google Scholar] [CrossRef] [PubMed] [Green Version]
  57. Tio, D.; Kasiem, F.R.; Willemsen, M.; van Doorn, R.; van der Werf, N.; Hoekzema, R.; Luiten, R.M.; Bekkenk, M.W. Expression of cancer/testis antigens in cutaneous melanoma: A systematic review. Melanoma Res. 2019, 29, 349–357. [Google Scholar] [CrossRef] [PubMed]
  58. Lee, Y.-M.; Chang, W.-C.; Ma, W.-L. Hypothesis: Solid tumours behave as systemic metabolic dictators. J. Cell. Mol. Med. 2016, 20, 1076–1085. [Google Scholar] [CrossRef] [PubMed] [Green Version]
  59. Lian, Y.; Sang, M.; Gu, L.; Liu, F.; Yin, D.; Liu, S.; Huang, W.; Wu, Y.; Shan, B. MAGE-A family is involved in gastric cancer progression and indicates poor prognosis of gastric cancer patients. Pathol. Res. Pract. 2017, 213, 943–948. [Google Scholar] [CrossRef]
  60. Garus, A.; Autexier, C. Dyskerin: An essential pseudouridine synthase with multifaceted roles in ribosome biogenesis, splicing, and telomere maintenance. RNA 2021, 27, 1441–1458. [Google Scholar] [CrossRef]
  61. Hermes, N.; Kewitz, S.; Staege, M.S. Preferentially Expressed Antigen in Melanoma (PRAME) and the PRAME Family of Leucine-Rich Repeat Proteins. Curr. Cancer Drug Targets 2016, 16, 400–414. [Google Scholar] [CrossRef]
  62. Napolitano, G.; Tagliaferri, D.; Fusco, S.; Cirillo, C.; De Martino, I.; Addeo, M.; Mazzone, P.; Russo, N.A.; Natale, F.; Cardoso, M.C.; et al. A novel member of Prame family, Gm12794c, counteracts retinoic acid differentiation through the methyltransferase activity of PRC2. Cell Death Differ. 2020, 27, 345–362. [Google Scholar] [CrossRef] [Green Version]
  63. Fernández, C.; Lobo Md, M.D.V.T.; Gómez-Coronado, D.; Lasunción, M.A. Cholesterol is essential for mitosis progression and its deficiency induces polyploid cell formation. Exp. Cell Res. 2004, 300, 109–120. [Google Scholar] [CrossRef] [PubMed]
  64. Lau, H.H.; Ng, N.H.J.; Loo, L.S.W.; Jasmen, J.B.; Teo, A.K.K. The molecular functions of hepatocyte nuclear factors—In and beyond the liver. J. Hepatol. 2018, 68, 1033–1048. [Google Scholar] [CrossRef] [PubMed]
Figure 1. (A) Venn diagram showing the intersection among the genes differentially upregulated in Diffuse or Intestinal samples and in GC (tumor) samples from TGCA, STAD or normal ones from GTEx datasets, respectively. The number of genes in bold indicates distinctive Diffuse tumors and Intestinal tumors as compared with normal tissues. (B,C) Bar plot of hallmark categories enriched with upregulated genes in the Diffuse or Intestinal subtypes. N is the number of samples.
Cancers 14 04961 g001
Figure 2. (A,B) Intestinal and Diffuse top master regulators. Each network is indicated by its MR. The genes in each network are shown in a barcode-like diagram showing all transcriptome genes from most downregulated (left) to most upregulated (right). Positively (red) and negatively (blue) correlated targets are overlaid on the differential expression signature as bars of different colors. Normalized enrichment score (NESes) and p-values are also indicated. To the right, the twelve highest-likelihood network putative targets of each MR are shown in red if upregulated or in blue if downregulated and with a pointed arrow if predicted to be activated by the centroid protein or with a blunt arrow if predicted to be repressed. (C,D) Heatmaps of the biological characterization of the top MRs in Diffuse and Intestinal subgroups. The intensity of the red color is proportional to the overlap between the genes in the regulon of the MR and the ones in the hallmark gene set.
Cancers 14 04961 g002
Figure 3. Boxplots of selected significant associated ssMRs NES and clinical features. (AC) Relationships among microsatellite, histotype and different MRs. (D) Highlight of a gender-associated MR in the Diffuse subgroup. NES on the y-axis examples is how much regulon is active. Wilcoxon test informs the association of the clinical feature with MR.
Cancers 14 04961 g003
Figure 4. Venn diagrams showing the overlap between the TCGA and the validation dataset data. (A) The overlap of the DEGs between Diffuse vs. Intestinal subgroups in TCGA and ACRG dataset. (B) The overlap of the DEGs between Diffuse vs. Intestinal subgroups in TCGA and GSE15459 dataset. (C) The overlap of the MRs between Diffuse vs. Intestinal subgroups in TCGA and ACRG dataset. (D) The overlap of the MRs between Diffuse vs. Intestinal subgroups in TCGA and GSE15459 dataset. All overlaps in bold are statistically significant (p-vaule < 0.01).
Cancers 14 04961 g004
Table 1. Patient characteristics and clinicopathological data.
CharacteristicsHistological Type
Diffuse (n = 62)Intestinal (n = 140)
Age (years, median with range) 61.5 (53–70)67 (58–72)
GenderWoman27 (44%)47 (34%)
Man35 (56%)93 (66%)
AnatomicAntrum Distal31 (51%)50 (37%)
Cardia Proximal5 (8%)18 (13%)
Fundus Body22 (36%)55 (40%)
Gastroesophageal Junction3 (4.8%)13 (10%)
Missing14
Anatomic JGCA
(Japanese Gastric Cancer Association)
Distal31 (53%)50 (41%)
Proximal27 (47%)73 (59%)
Missing417
Pathologic stageI5 (8%)21 (15%)
II18 (31%)25 (18%)
III31 (53%)70 (52%)
IV5 (8%)21 (15%)
Missing33
Pathologic TT10 (0%)10 (7%)
T216 (26%)28 (20%)
T323 (37%)64 (46%)
T423 (37%)38 (27%)
Missing033
Pathologic NN013 (21%)33 (24%)
N118 (29%)34 (25%)
N215 (24%)42 (31%)
N316 (26%)27 (20%)
Missing04
Pathologic MM054 (90%)125 (91%)
M16 (10%)12 (9%)
Missing23
Microsatellite
status
MSS46 (74%)90 (64%)
MSI.L7 (11%)24 (17%)
MSI.H9 (15%)26 (19%)
Missing00
Primary therapy outcome successComplete
Response
31 (55%)74 (63%)
Partial Response1 (2%)3 (3%)
Stable Disease7 (12%)11 (9%)
Progression
Disease
17 (30%)29 (25%)
Missing623
NOS: not otherwise specified; JCGA: Japanese gastric cancer association; MSS: microsatellite stable; MSI.L: microsatellite instable low; MSI.H: microsatellite instable high; CR: complete response; PR: partial response; SD: stable disease; PD: progressive disease. Percentages, given as histology, are among each characteristic without the missing samples.
Table 2. Summary of the significantly enriched gene sets in Diffuse and Intestinal GC samples.
DiffuseIntestinal
N. Out of TOT%N. Out of TOT%
Hallmarks12/5024%6/5012%
GOs775/10,1927.6%184/10,1921.8%
Pathways926/552916.7%257/55294.6%
Chromosome positions6/2992%9/2993%
Motifs/miRNAs550/373514.7%6/37350.16%
Immunologic signature958/487219.6%79/48721.6%
Table 3. Summary of the differentially enriched categories between Diffuse and Intestinal GC in TCGA, ARCG and GSE15459 dataset. Statistically significant (p-value < 0.01) overlaps are in bold.
TCGAARCGGSE15459TCGA vs. ARCGTCGA vs. GSE15459
Enriched in Diffuse
hallmark12867 *5 *
Go926837675522 *301 *
Pathways775942925566 *452 *
Motif55010891762391*480 *
Chromosome positions64410
Enriched in Intestinal
hallmark6765 *4 *
GO18413331362 *82 *
Pathways257400912184 *209 *
Motif664402 *
Chromosome positions92311
* Statistically significant (p-value < 0.01) overlaps.
Publisher’s Note: MDPI stays neutral with regard to jurisdictional claims in published maps and institutional affiliations.

