
Targeting E2F Sensitizes Prostate Cancer Cells to Drug-Induced Replication Stress by Promoting Unscheduled CDK1 Activity
 , , , , , and
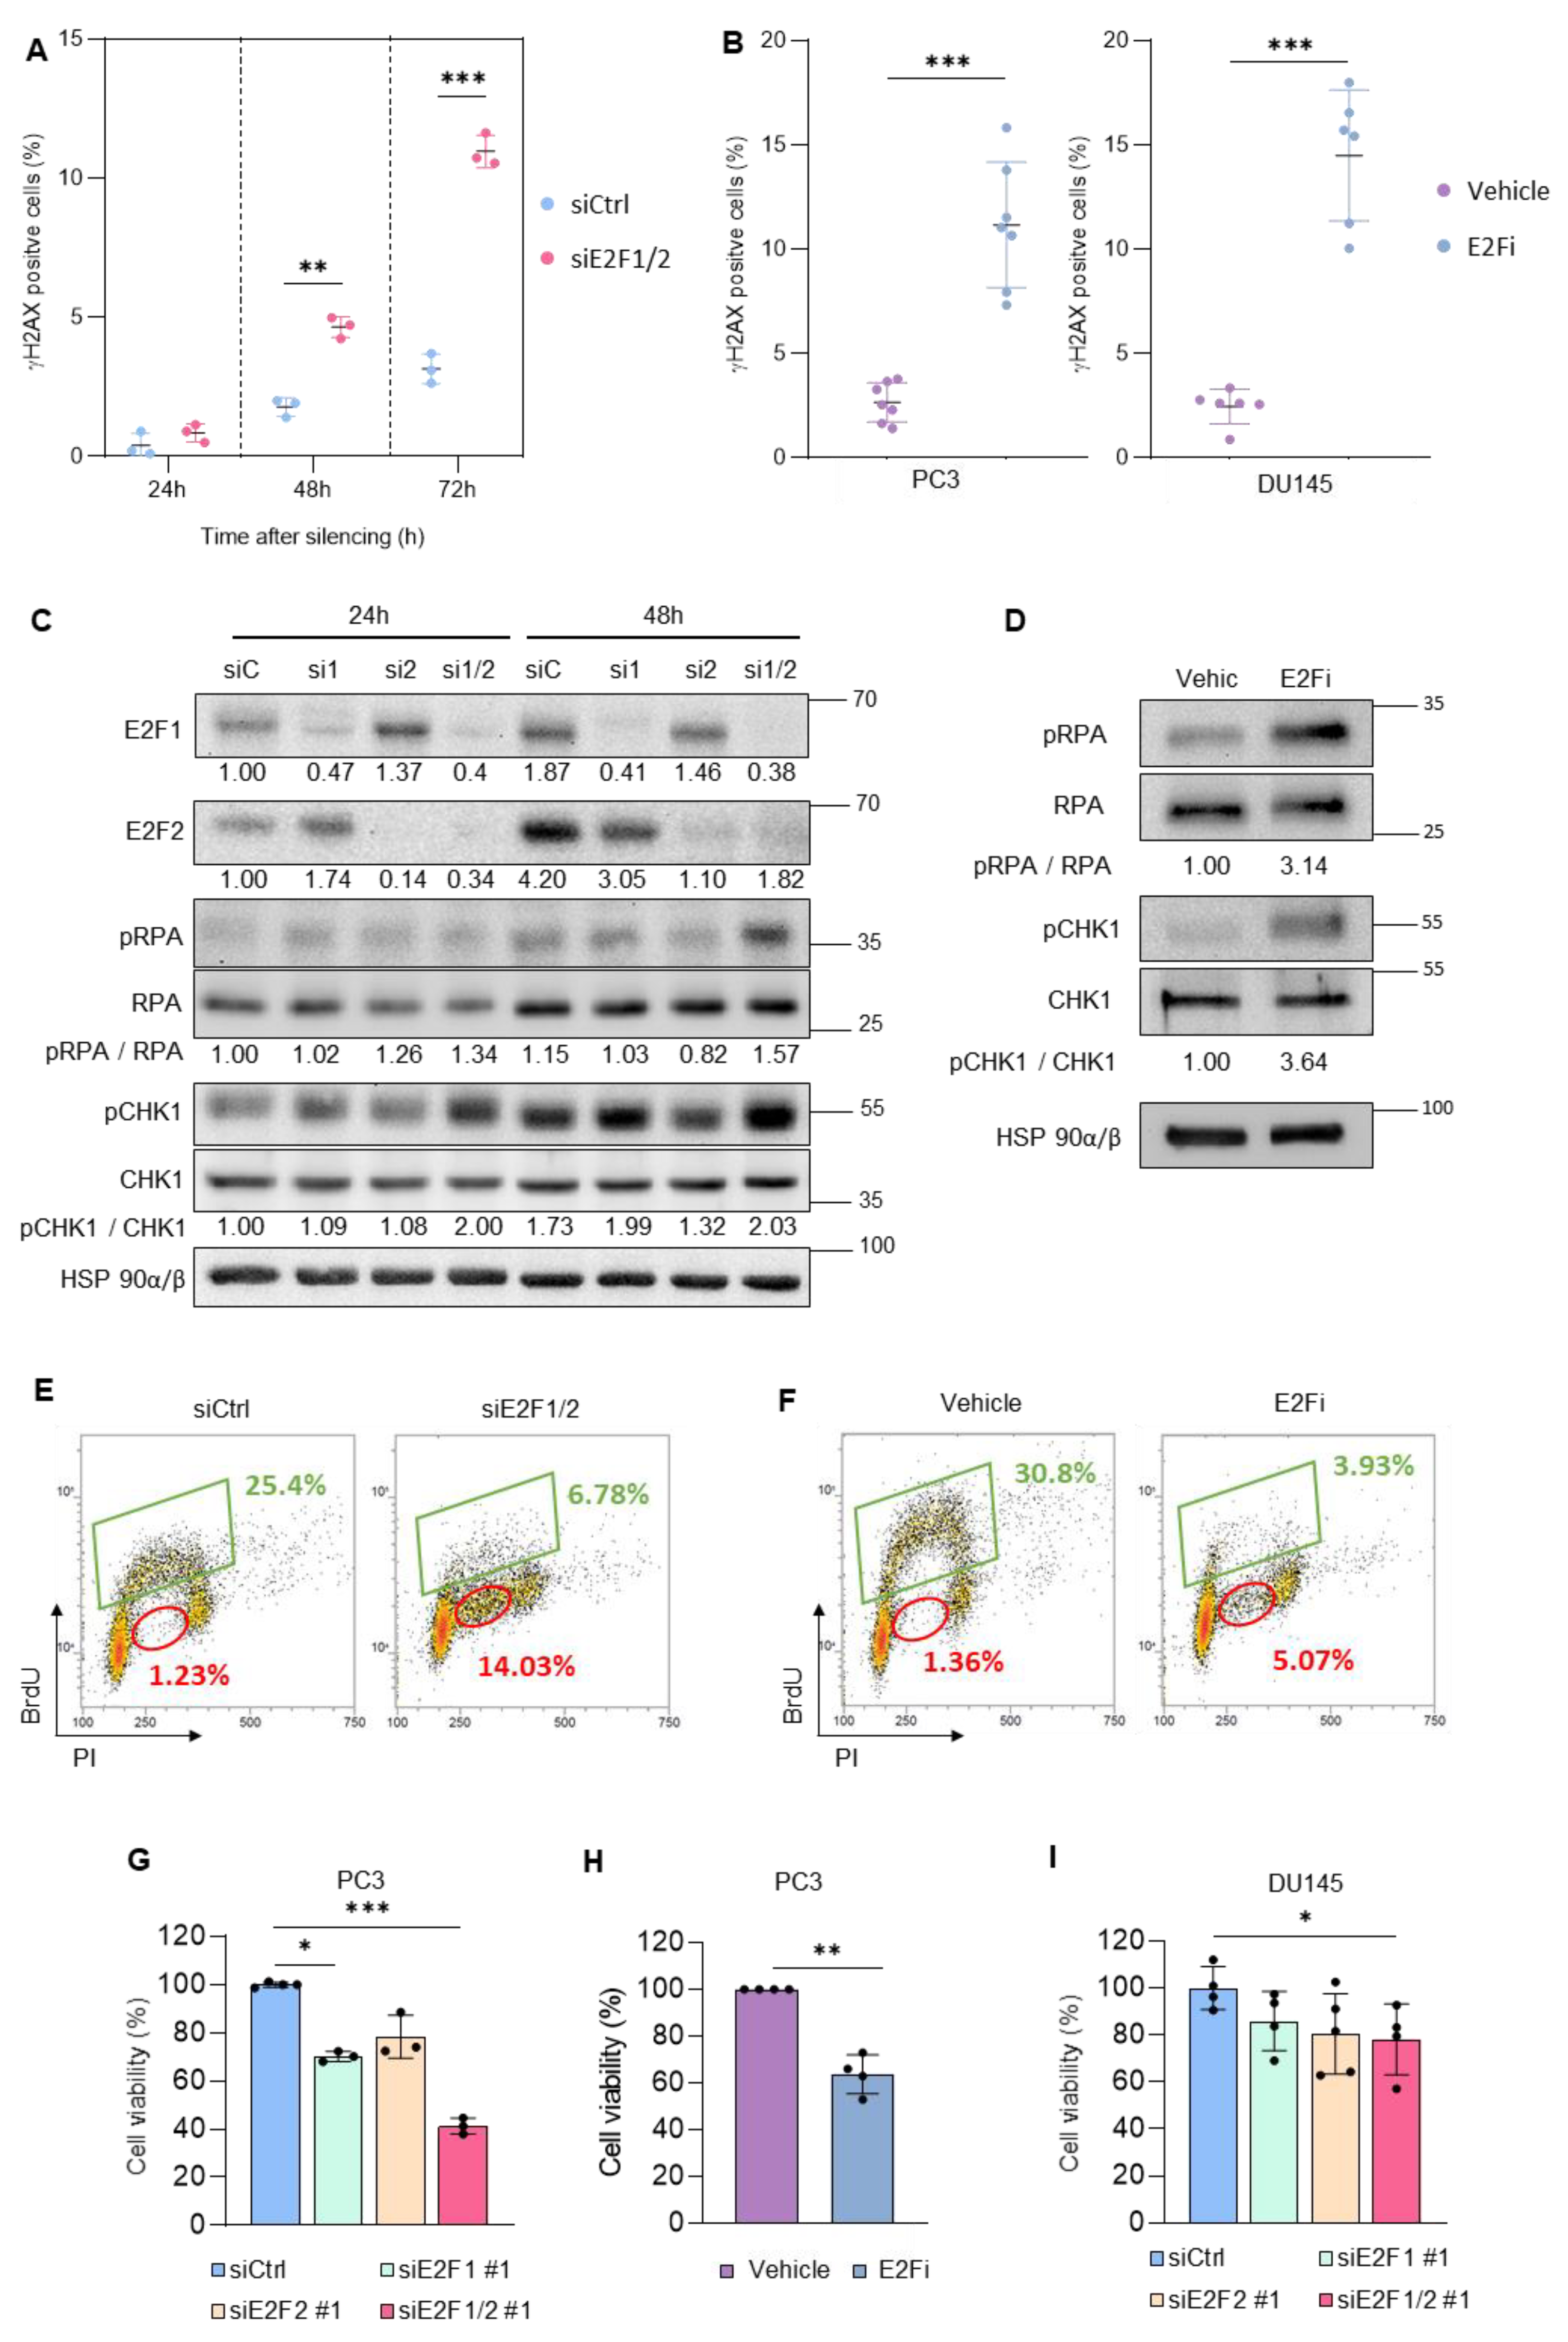
Abstract
:Simple Summary
Abstract
1. Introduction
2. Materials and Methods
2.1. Cell Lines, Drugs and Reagents
2.2. Transfections and siRNA-Mediated Knockdown
2.3. Analysis of Cell Cycle Distribution
2.4. Cytometric Analysis of γH2AX, Phospho-MPM2 and Phoshpo-H3
2.5. Crystal Violet Colony Formation Assay (CFA)
2.6. Mouse Xenograft Experiments
2.7. Quantitative RT-PCR Analysis
2.8. Protein Extraction and Western Blot Analysis
2.9. Bioinformatics Analysis
2.10. Statistical Analysis
3. Results
3.1. Targeting E2F1/2 in PCa Cells Induces Replication Stress and Compromises Cellular Survival
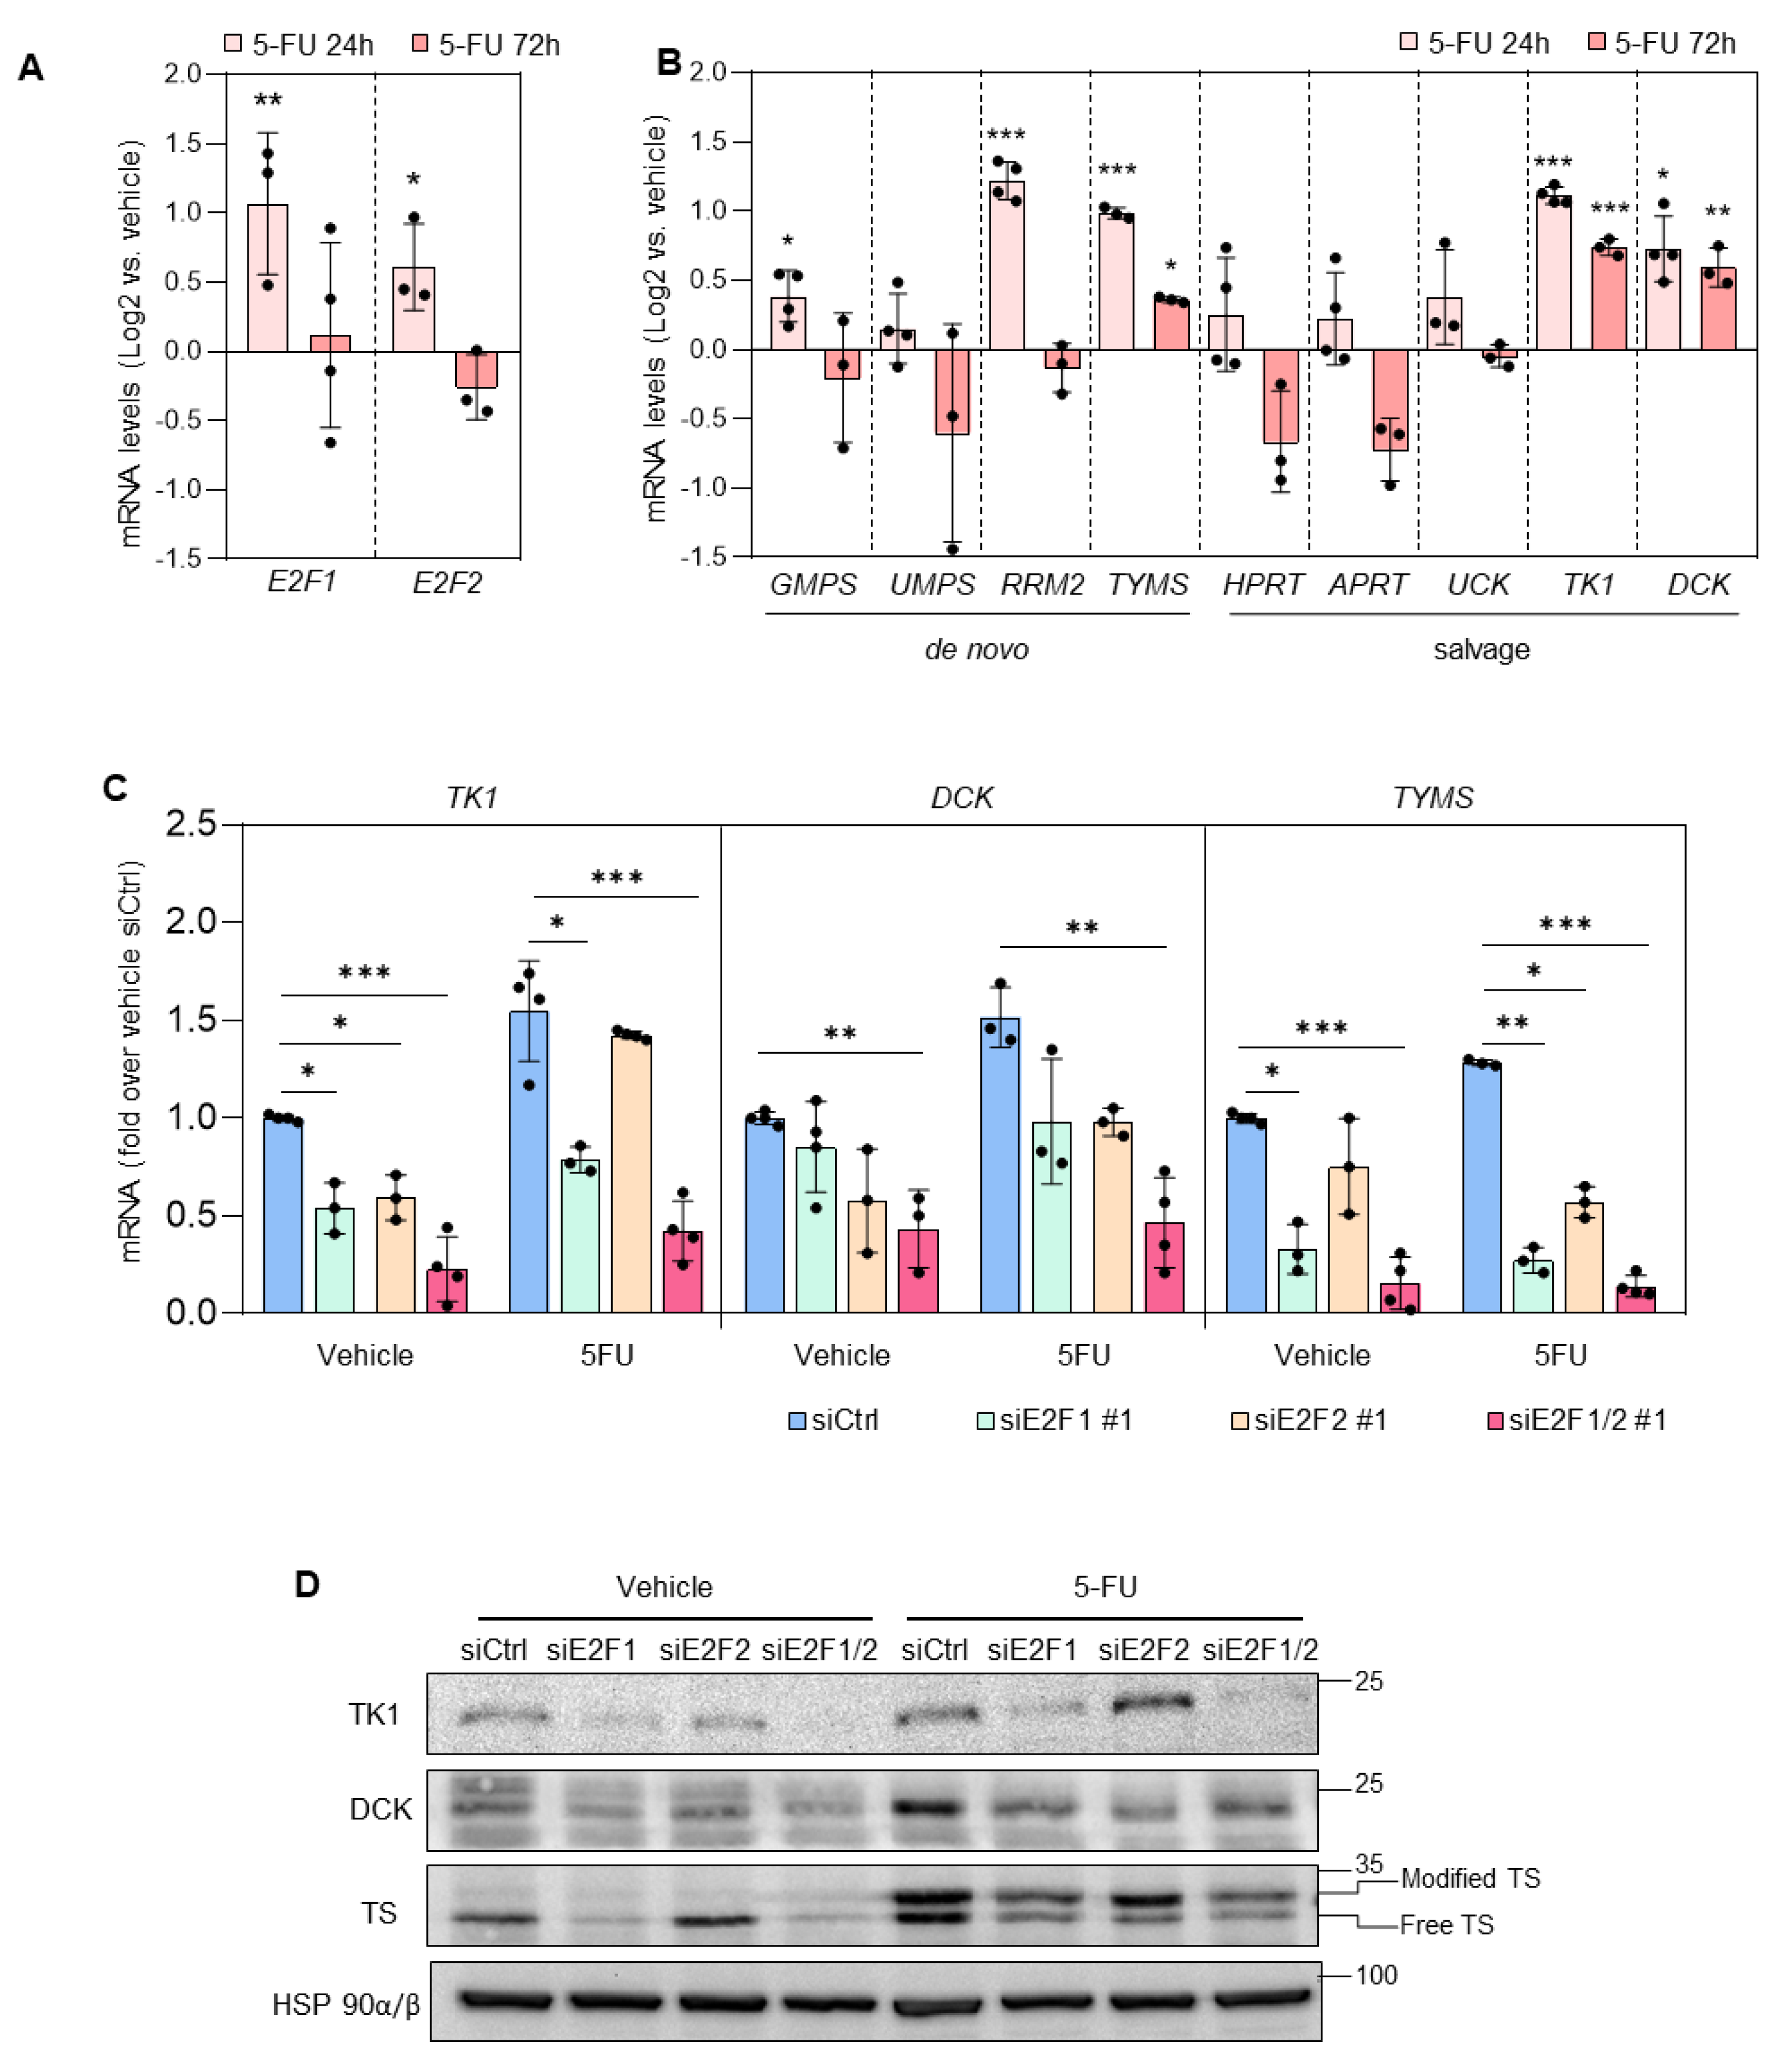
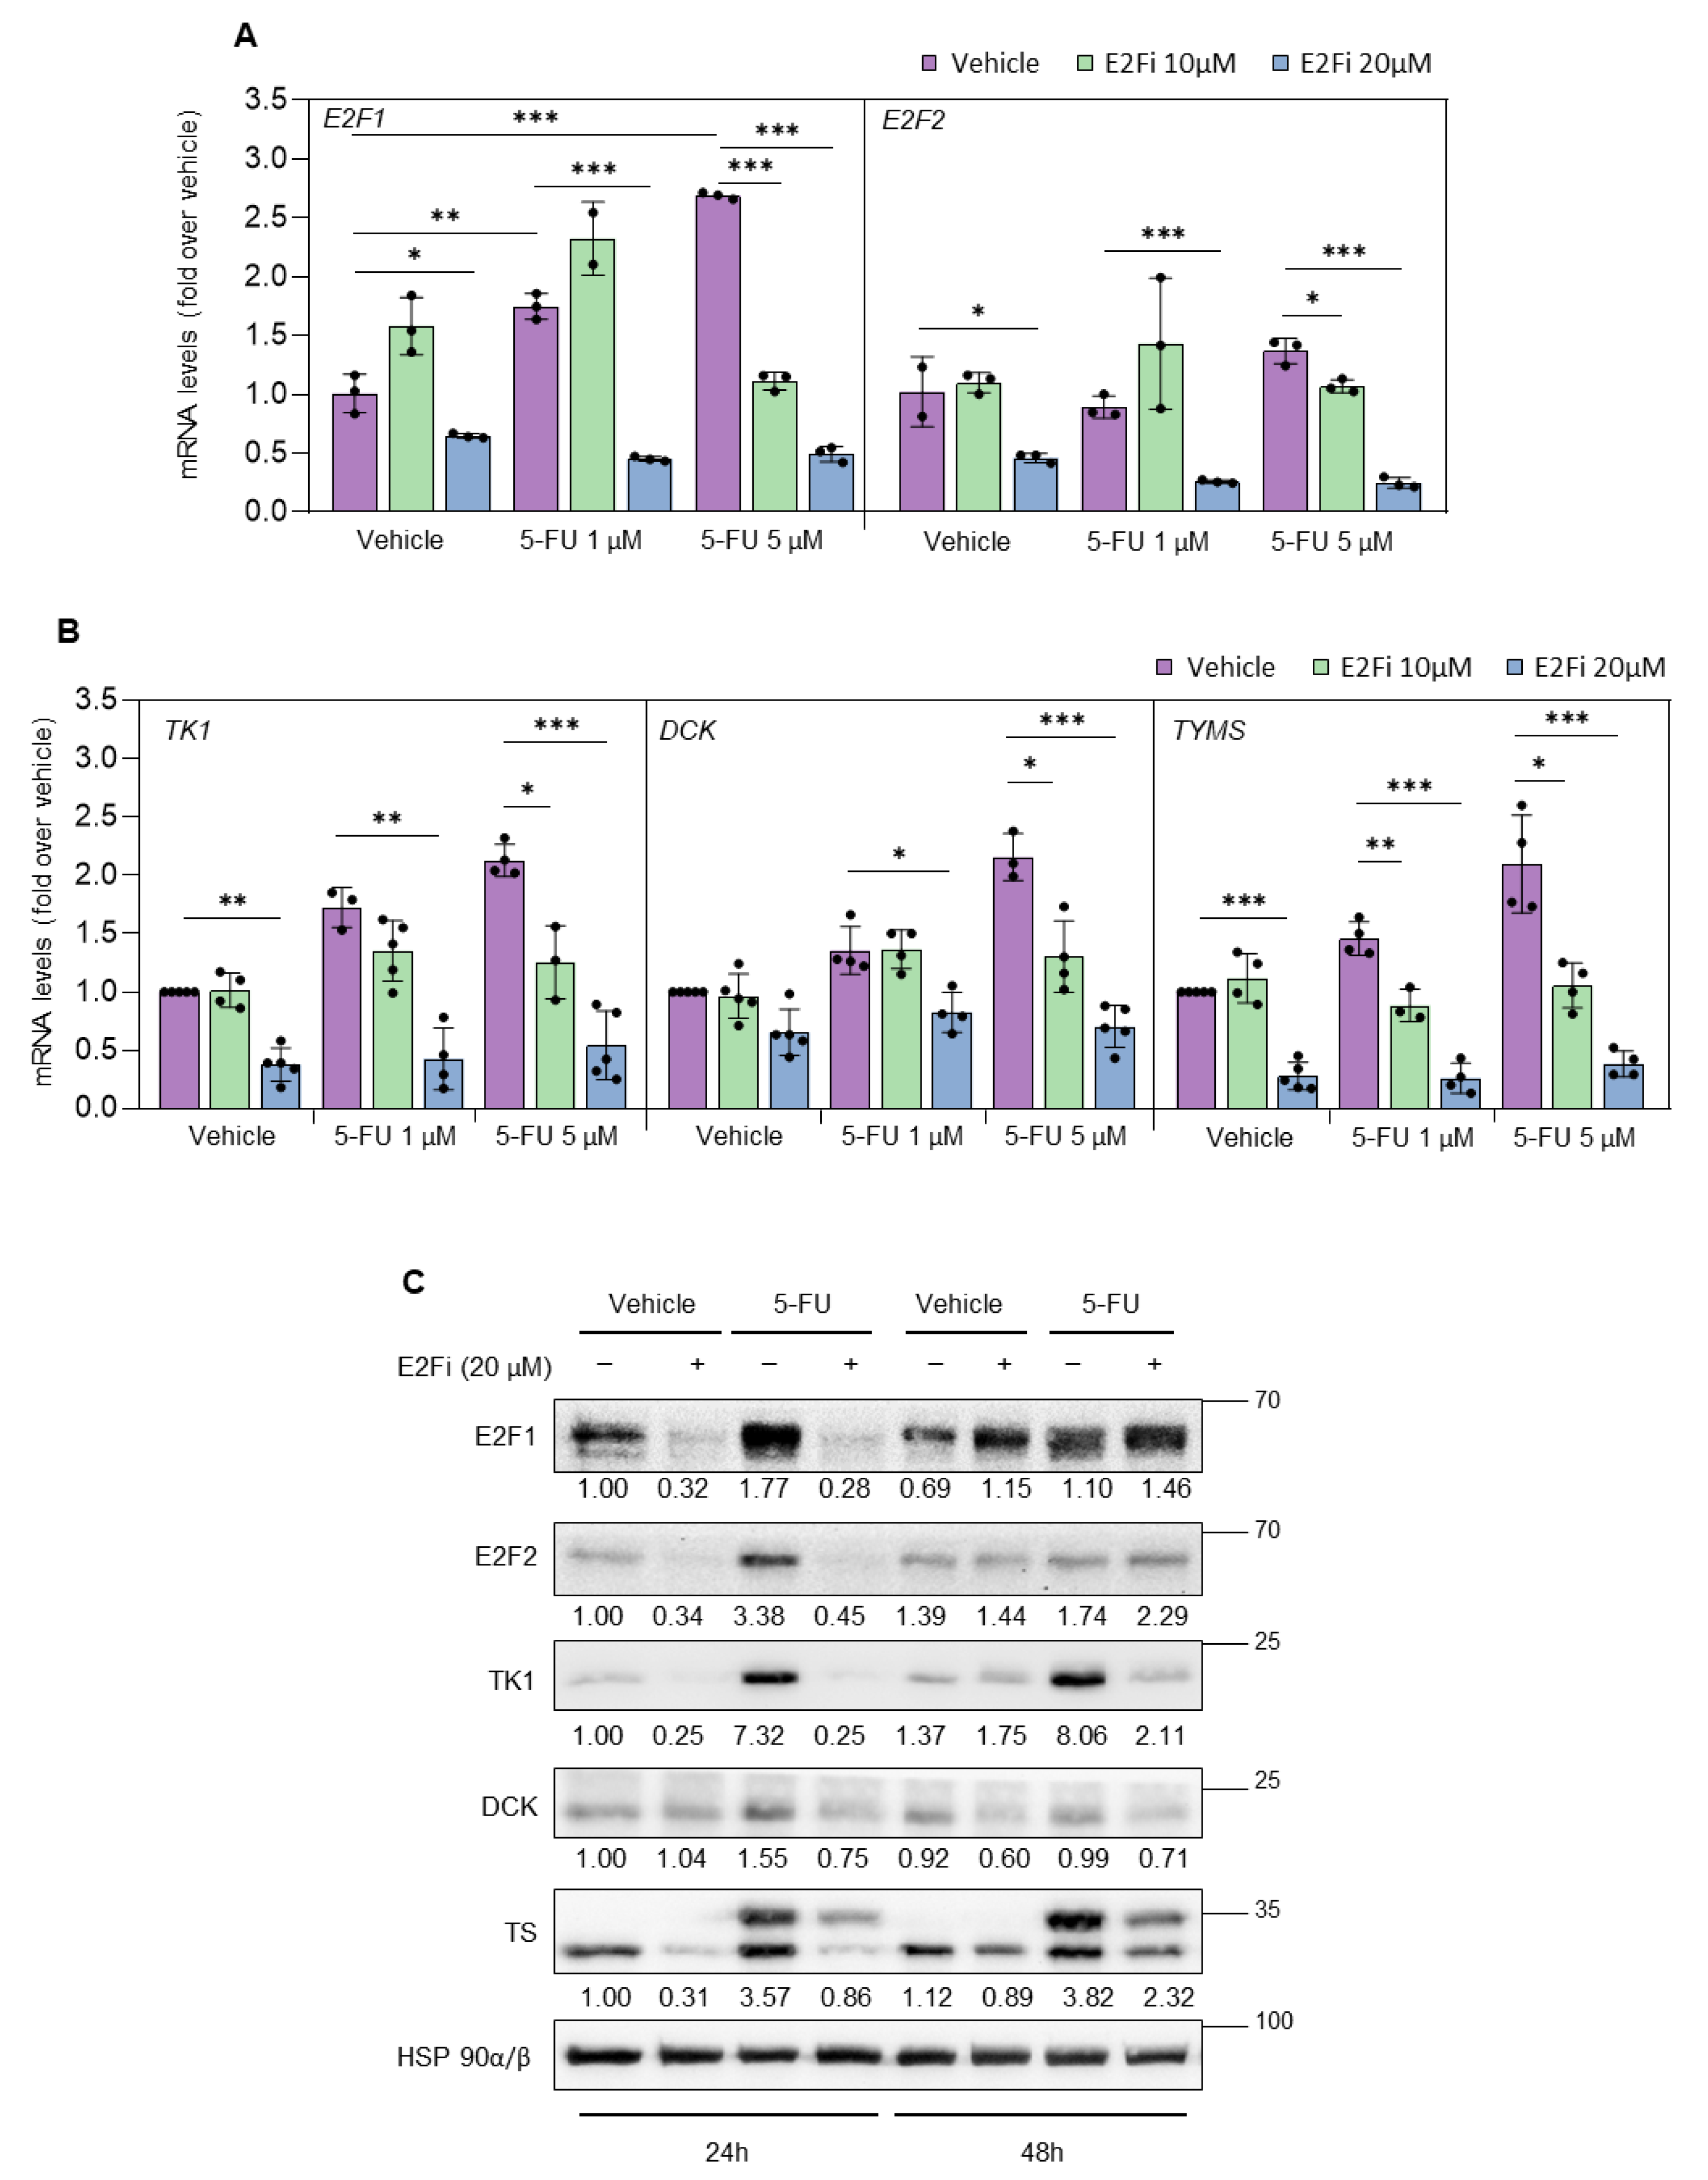
3.2. Depletion of E2F1/2 Potentiates 5-FU-elicited Cytotoxicity through Modulation of Target Genes Involved in Nucleotide Biosynthesis
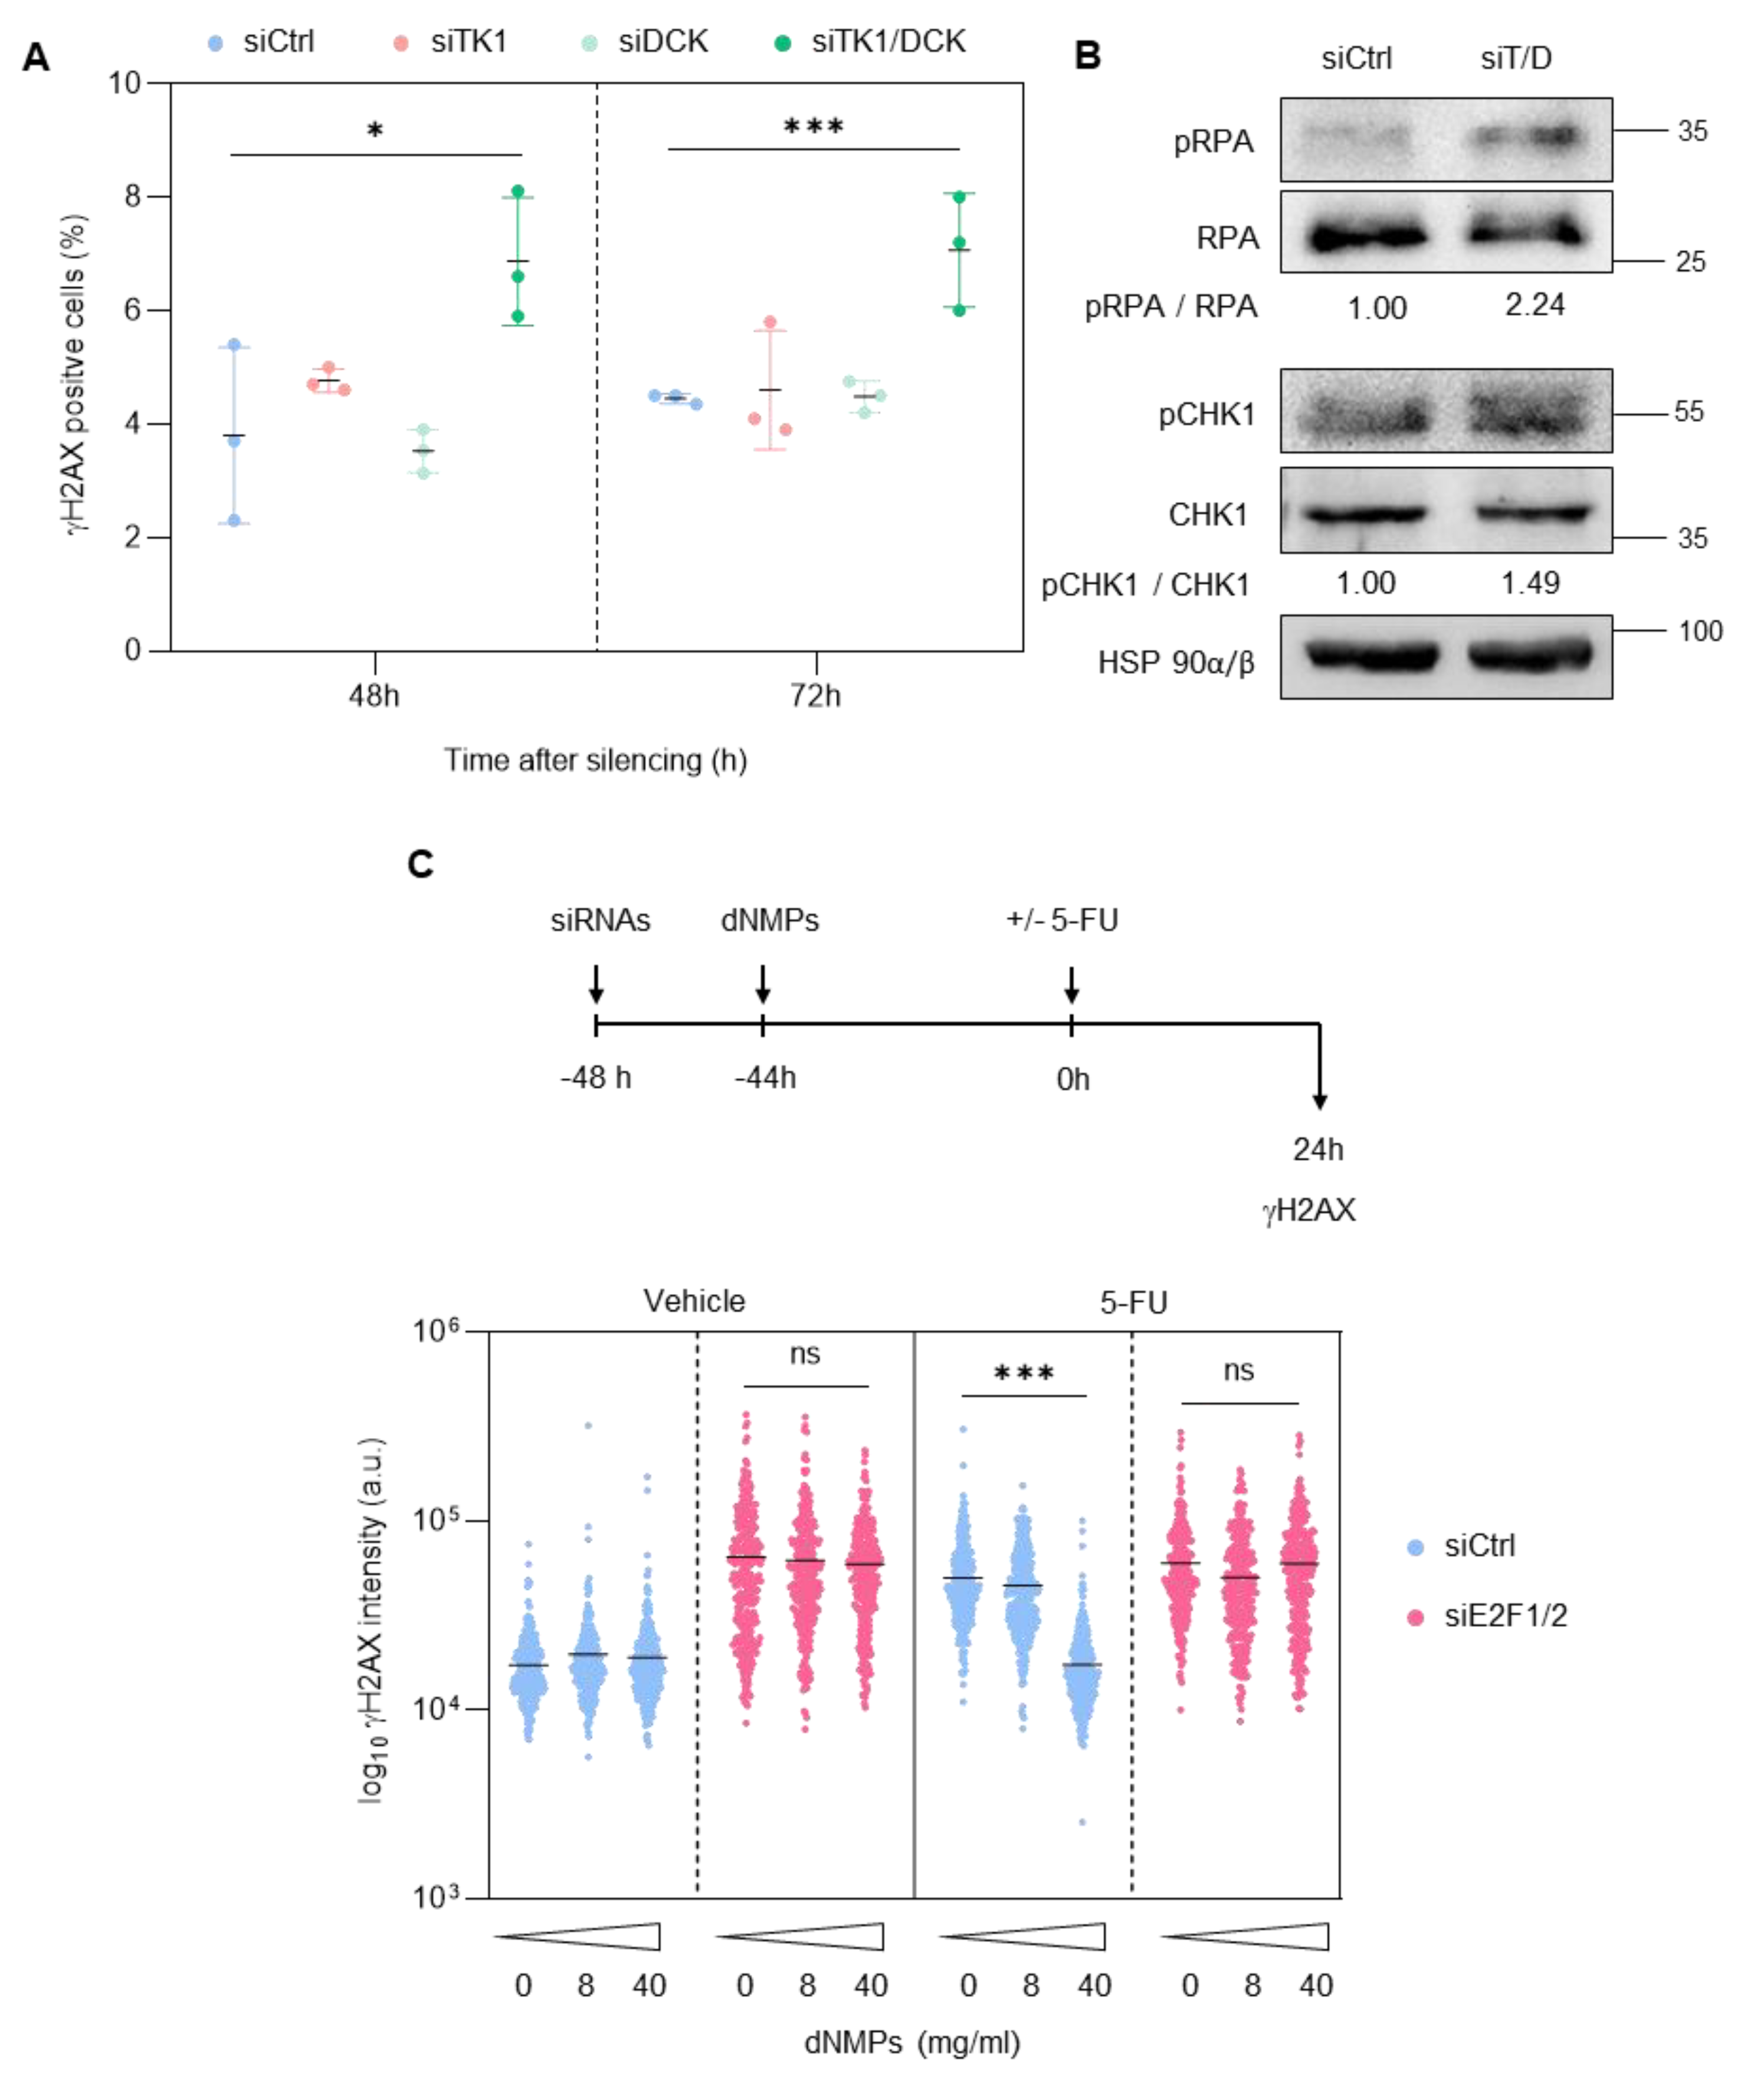
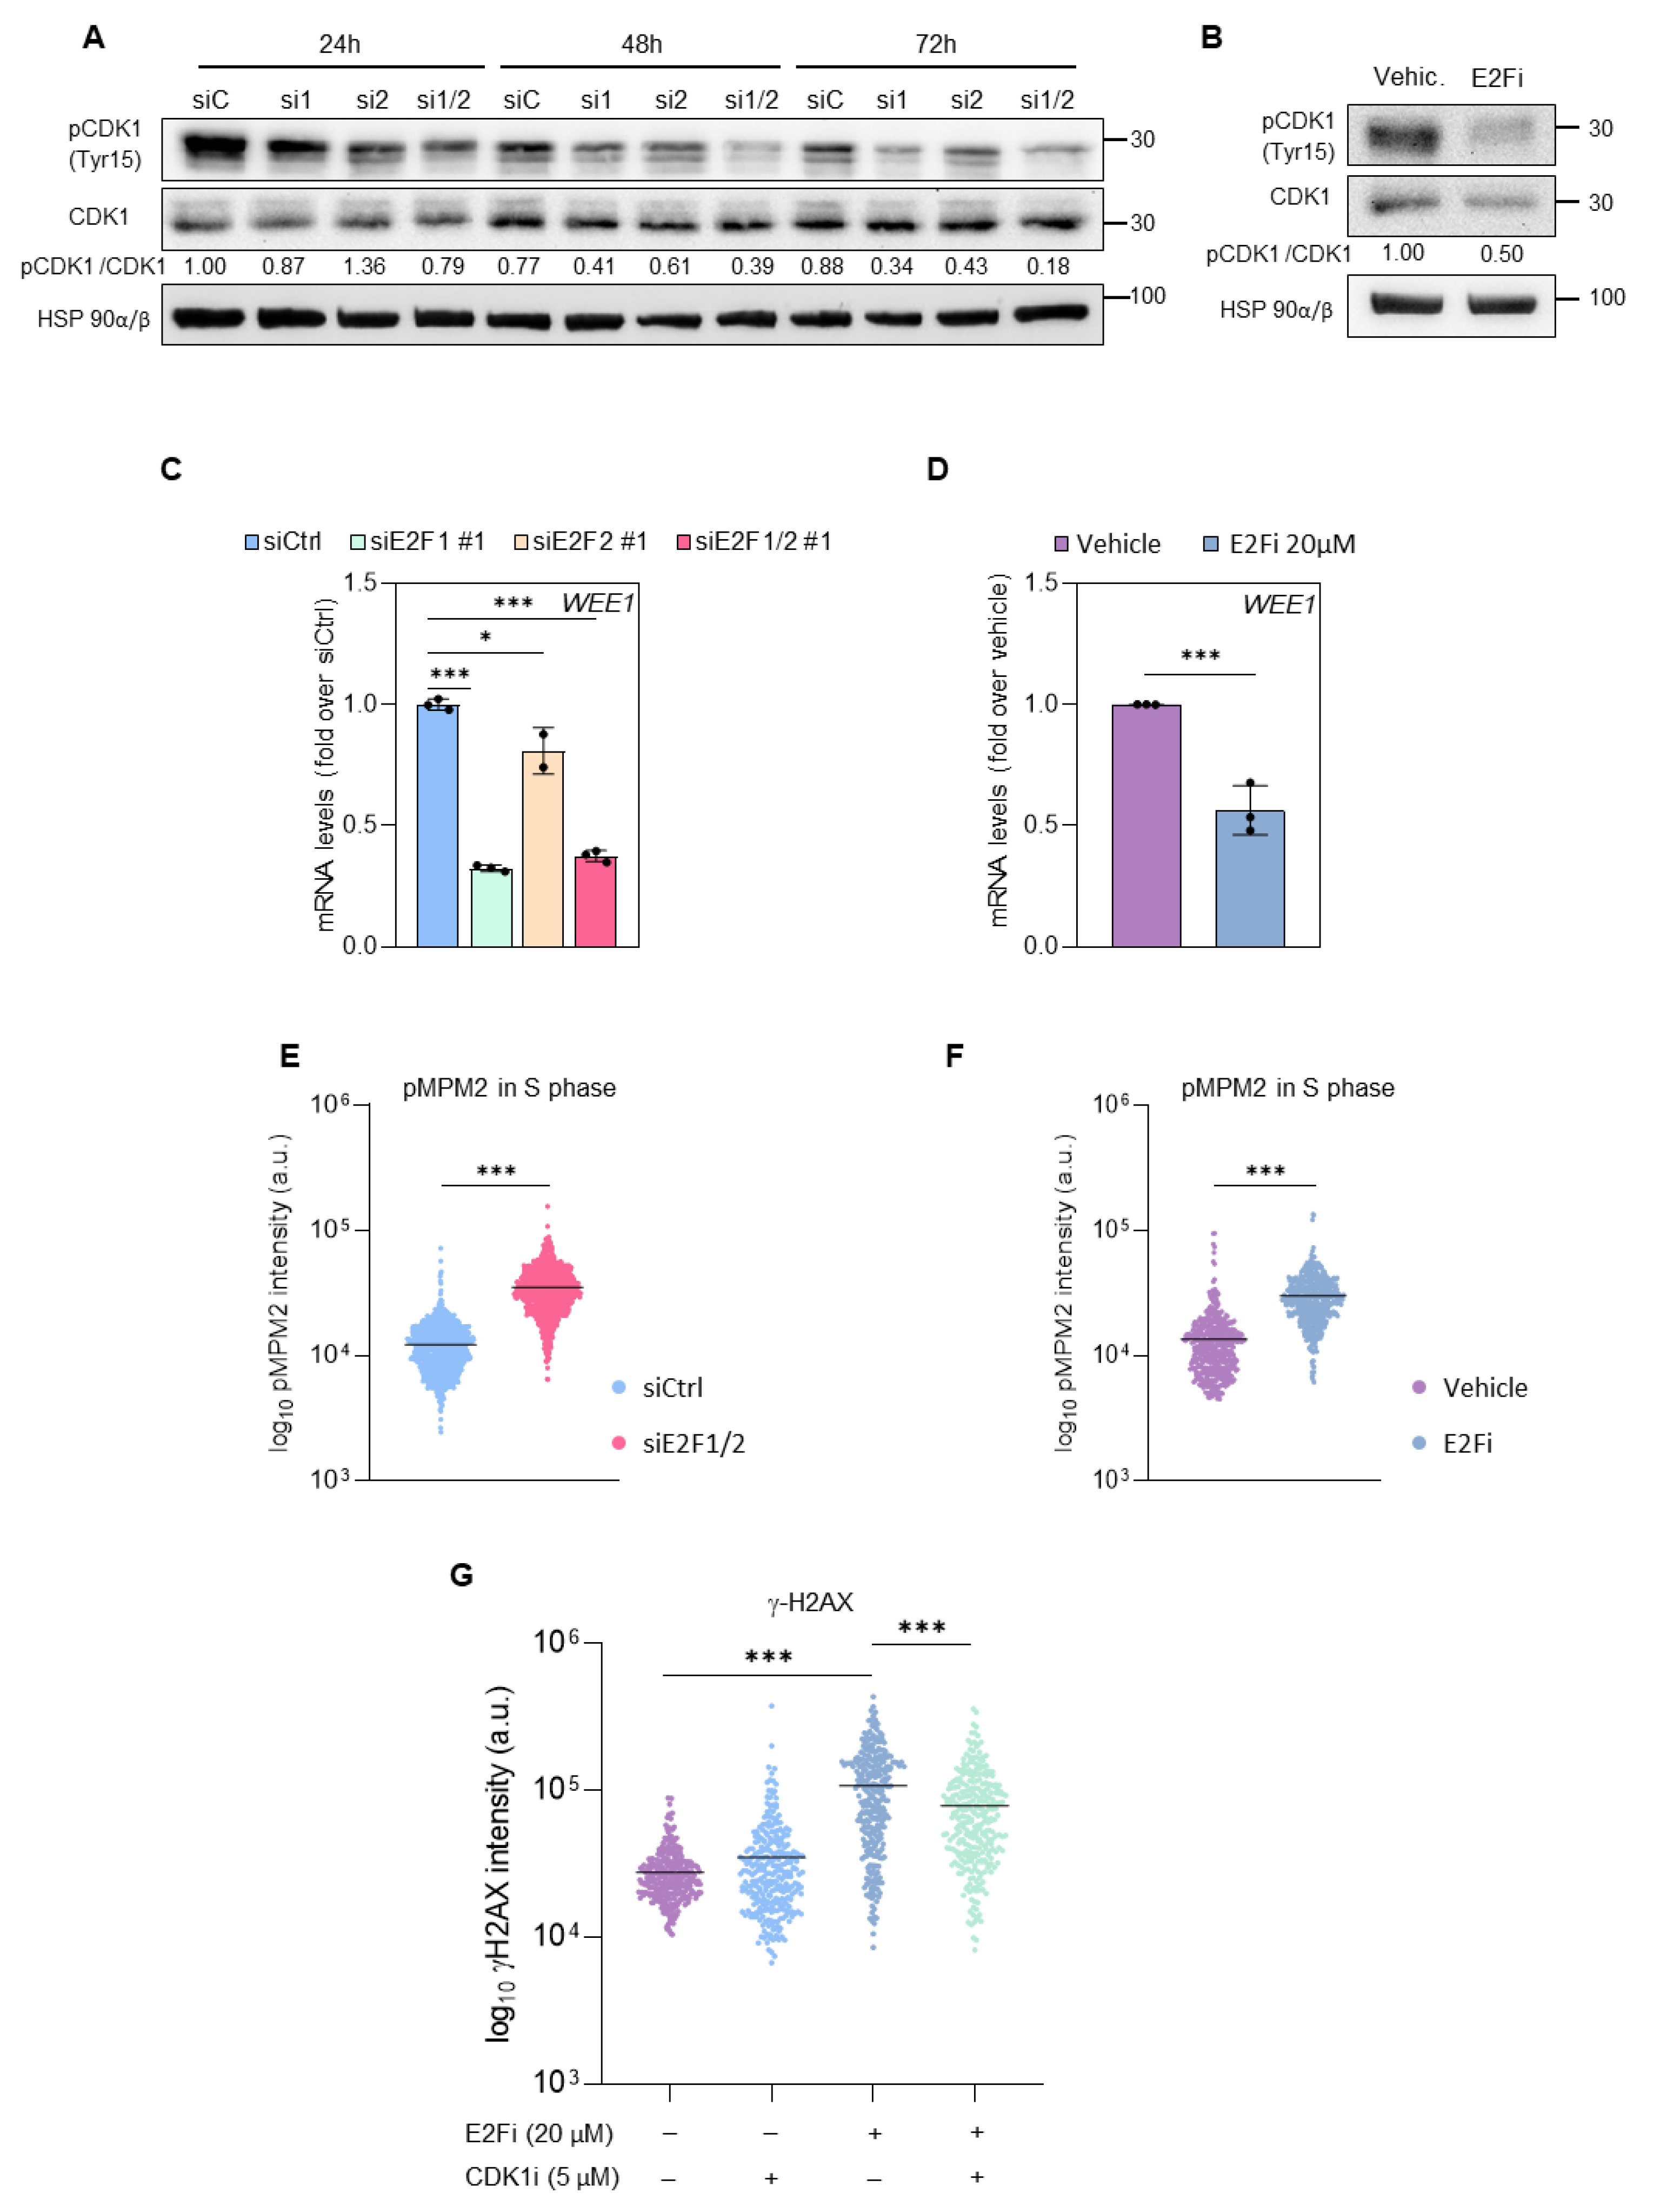
3.3. E2F1 and E2F2 Restrain CDK1 Activity during S Phase to Prevent DNA Damage
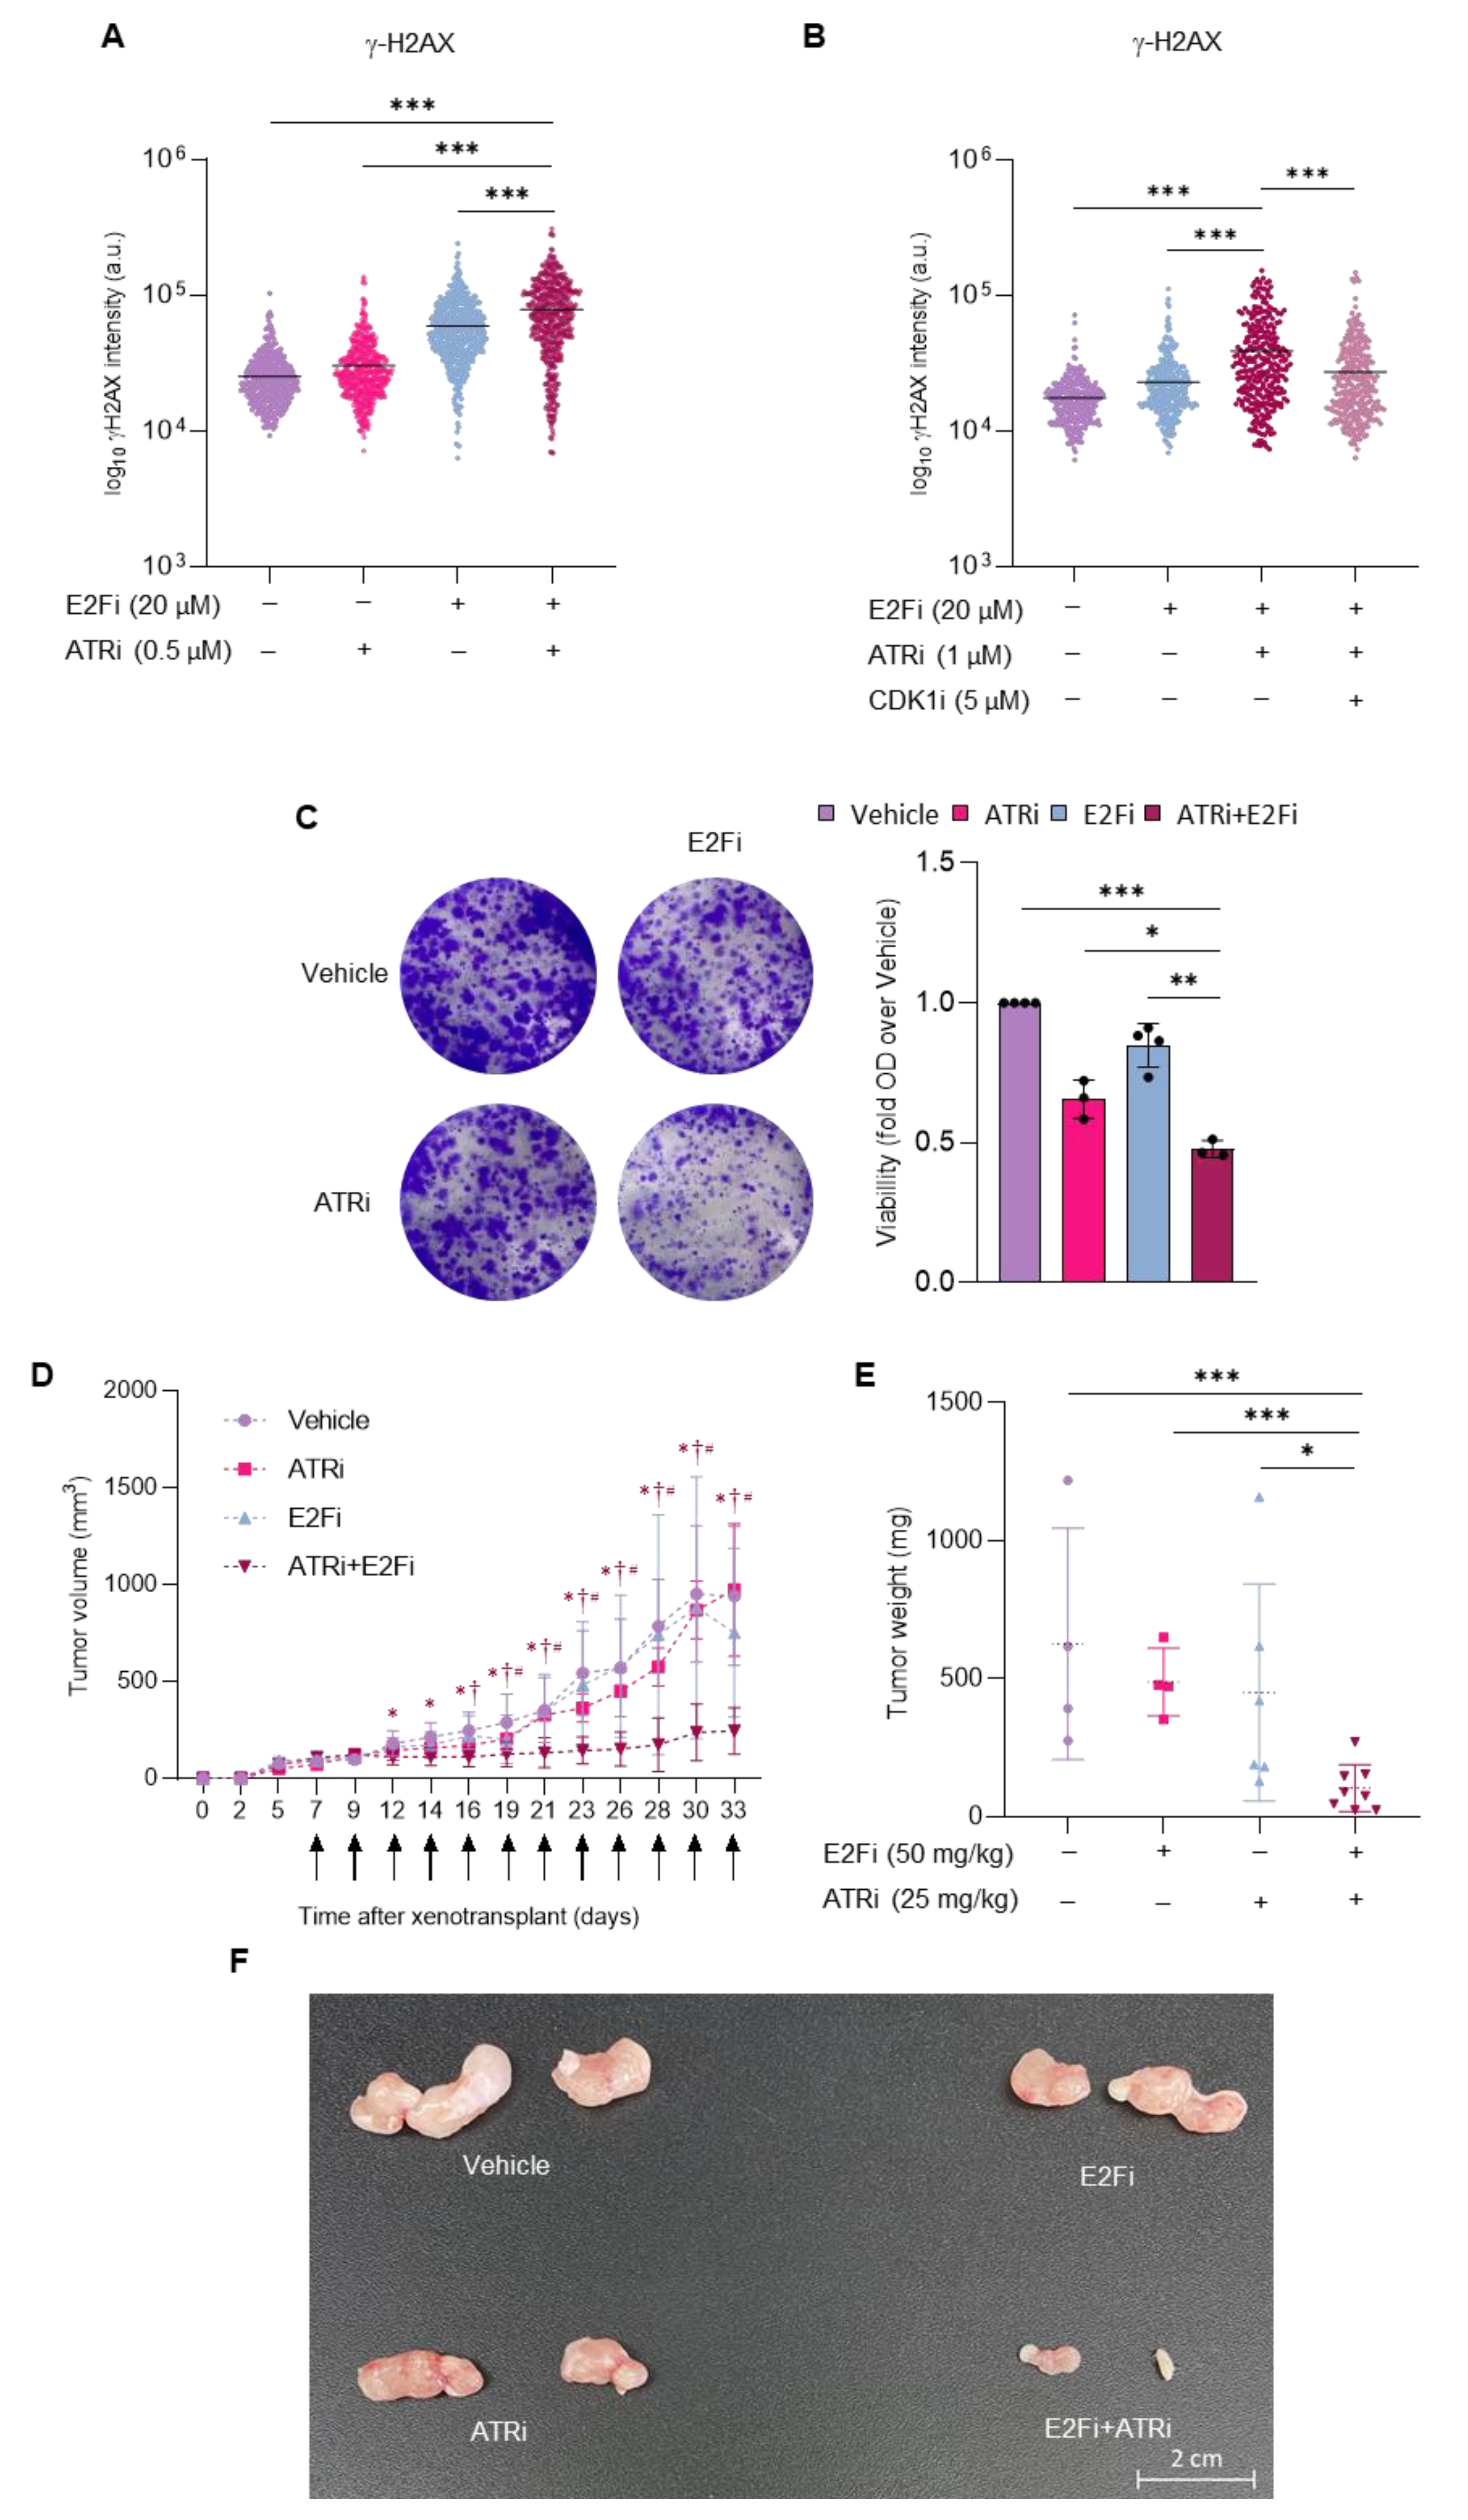
3.4. Combining E2F and ATR Inhibitors Boosts Replication Stress and Prevents Prostate Cancer Cell Growth in Mice
4. Discussion
5. Conclusions
Supplementary Materials
Author Contributions
Funding
Institutional Review Board Statement
Data Availability Statement
Acknowledgments
Conflicts of Interest
References
- Ren, B.; Cam, H.; Takahashi, Y.; Volkert, T.; Terragni, J.; Young, R.A.; Dynlacht, B.D. E2F integrates cell cycle progression with DNA repair, replication, and G2/M checkpoints. Genes Dev. 2002, 16, 245–256. [Google Scholar] [CrossRef] [PubMed] [Green Version]
- Bertoli, C.; Skotheim, J.M.; de Bruin, R.A.M. Control of cell cycle transcription during G1 and S phases. Nat. Rev. Mol. Cell Biol. 2013, 14, 518–528. [Google Scholar] [CrossRef] [Green Version]
- Rubin, S.M.; Sage, J.; Skotheim, J.M. Integrating Old and New Paradigms of G1/S Control. Mol. Cell 2020, 80, 183–192. [Google Scholar] [CrossRef]
- Chen, H.-Z.; Tsai, S.-Y.; Leone, G. Emerging roles of E2Fs in cancer: An exit from cell cycle control. Nat. Cancer 2009, 9, 785–797. [Google Scholar] [CrossRef] [Green Version]
- Iglesias-Ara, A.; Zenarruzabeitia, O.; Fernandez-Rueda, J.; Sánchez-Tilló, E.; Field, S.J.; Celada, A.; Zubiaga, A.M. Accelerated DNA replication in E2F1- and E2F2-deficient macrophages leads to induction of the DNA damage response and p21CIP1-dependent senescence. Oncogene 2010, 29, 5579–5590. [Google Scholar] [CrossRef] [PubMed] [Green Version]
- Iglesias-Ara, A.; Zenarruzabeitia, O.; Buelta, L.; Merino, J.; Zubiaga, A.M. E2F1 and E2F2 prevent replicative stress and subsequent p53-dependent organ involution. Cell Death Differ. 2015, 22, 1577–1589. [Google Scholar] [CrossRef] [PubMed] [Green Version]
- Kent, L.N.; Leone, G. The broken cycle: E2F dysfunction in cancer. Nat. Cancer 2019, 19, 326–338. [Google Scholar] [CrossRef]
- Ren, Z.; Kang, W.; Wang, L.; Sun, B.; Ma, J.; Zheng, C.; Sun, J.; Tian, Z.; Yang, X.; Xiao, W. E2F1 renders prostate cancer cell resistant to ICAM-1 mediated antitumor immunity by NF-κB modulation. Mol. Cancer 2014, 13, 84. [Google Scholar] [CrossRef] [Green Version]
- Wang, D.; Tang, W.; Zhang, P.; Liu, Z.; Lyu, F.; Xiao, Y.; Ni, D.; Zhang, P. Comprehensive analysis of the functional and prognostic value of E2F transcription factors in human prostate cancer through data mining and experimental validation. Transl. Cancer Res. 2021, 10, 5095–5109. [Google Scholar] [CrossRef] [PubMed]
- Xia, H.; Wang, M.; Su, X.; Lv, Z.; Yan, Q.; Guo, X.; Liu, M. A Novel Gene Signature Associated With “E2F Target” Pathway for Predicting the Prognosis of Prostate Cancer. Front. Mol. Biosci. 2022, 9, 838654. [Google Scholar] [CrossRef] [PubMed]
- Bertoli, C.; Herlihy, A.E.; Pennycook, B.R.; Kriston-Vizi, J.; De Bruin, R.A. Sustained E2F-Dependent Transcription Is a Key Mechanism to Prevent Replication-Stress-Induced DNA Damage. Cell Rep. 2016, 15, 1412–1422. [Google Scholar] [CrossRef] [PubMed] [Green Version]
- Segeren, H.A.; Westendorp, B. Mechanisms used by cancer cells to tolerate drug-induced replication stress. Cancer Lett. 2022, 544, 215804. [Google Scholar] [CrossRef] [PubMed]
- Fouad, S.; Hauton, D.; D’Angiolella, V. E2F1: Cause and Consequence of DNA Replication Stress. Front. Mol. Biosci. 2021, 7, 599332. [Google Scholar] [CrossRef] [PubMed]
- Dobbelstein, M.; Sørensen, C.S. Exploiting replicative stress to treat cancer. Nat. Rev. Drug Discov. 2015, 14, 405–423. [Google Scholar] [CrossRef] [PubMed]
- Smith, H.L.; Southgate, H.; Tweddle, D.A.; Curtin, N.J. DNA damage checkpoint kinases in cancer. Expert Rev. Mol. Med. 2020, 22, e2. [Google Scholar] [CrossRef] [PubMed]
- Schmidt, M.; Rohe, A.; Platzer, C.; Najjar, A.; Erdmann, F.; Sippl, W. Regulation of G2/M Transition by Inhibition of WEE1 and PKMYT1 Kinases. Molecules 2017, 22, 2045. [Google Scholar] [CrossRef] [PubMed] [Green Version]
- Elbæk, C.R.; Petrosius, V.; Sørensen, C.S. WEE1 kinase limits CDK activities to safeguard DNA replication and mitotic entry. Mutat. Res. Mol. Mech. Mutagen. 2020, 819–820, 111694. [Google Scholar] [CrossRef]
- Hastak, K.; Paul, R.K.; Agarwal, M.K.; Thakur, V.S.; Amin, A.R.M.R.; Agrawal, S.; Sramkoski, R.M.; Jacobberger, J.W.; Jackson, M.W.; Stark, G.R.; et al. DNA synthesis from unbalanced nucleotide pools causes limited DNA damage that triggers ATR-CHK1-dependent p53 activation. Proc. Natl. Acad. Sci. USA 2008, 105, 6314–6319. [Google Scholar] [CrossRef] [PubMed] [Green Version]
- Domínguez-Kelly, R.; Martín, Y.; Koundrioukoff, S.; Tanenbaum, M.E.; Smits, V.A.; Medema, R.; Debatisse, M.; Freire, R. Wee1 controls genomic stability during replication by regulating the Mus81-Eme1 endonuclease. J. Cell Biol. 2011, 194, 567–579. [Google Scholar] [CrossRef]
- Gorecki, L.; Andrs, M.; Korabecny, J. Clinical Candidates Targeting the ATR–CHK1–WEE1 Axis in Cancer. Cancers 2021, 13, 795. [Google Scholar] [CrossRef] [PubMed]
- Wang, W.; Cui, J.; Ma, H.; Lu, W.; Huang, J. Targeting Pyrimidine Metabolism in the Era of Precision Cancer Medicine. Front. Oncol. 2021, 11, 684961. [Google Scholar] [CrossRef] [PubMed]
- Longley, D.B.; Harkin, D.P.; Johnston, P.G. 5-Fluorouracil: Mechanisms of action and clinical strategies. Nat. Rev. Cancer 2003, 3, 330–338. [Google Scholar] [CrossRef] [PubMed]
- Blesa, J.M.G.; Marco, V.G.; Giner-Bosch, V.; Fuentes, P.C.; Candel, V.A. Phase II Trial of Oxaliplatin and Capecitabine after Progression to First-Line Chemotherapy in Androgen-Independent Prostate Cancer Patients. Am. J. Clin. Oncol. 2011, 34, 155–159. [Google Scholar] [CrossRef] [PubMed]
- Sethy, C.; Kundu, C.N. 5-Fluorouracil (5-FU) resistance and the new strategy to enhance the sensitivity against cancer: Implication of DNA repair inhibition. Biomed. Pharmacother. 2021, 137, 111285. [Google Scholar] [CrossRef]
- Walter, M.; Herr, P. Re-Discovery of Pyrimidine Salvage as Target in Cancer Therapy. Cells 2022, 11, 739. [Google Scholar] [CrossRef]
- Cortazar, A.R.; Torrano, V.; Martín-Martín, N.; Caro-Maldonado, A.; Camacho, L.; Hermanova, I.; Guruceaga, E.; Lorenzo-Martín, L.F.; Caloto, R.; Gomis, R.R.; et al. CANCERTOOL: A Visualization and Representation Interface to Exploit Cancer Datasets. Cancer Res. 2018, 78, 6320–6328. [Google Scholar] [CrossRef] [Green Version]
- Ma, Y.; Kurtyka, C.A.; Boyapalle, S.; Sung, S.-S.; Lawrence, H.; Guida, W.; Cress, W.D. A Small-Molecule E2F Inhibitor Blocks Growth in a Melanoma Culture Model. Cancer Res. 2008, 68, 6292–6299. [Google Scholar] [CrossRef] [Green Version]
- Matthews, H.K.; Bertoli, C.; de Bruin, R.A.M. Cell cycle control in cancer. Nat. Rev. Mol. Cell Biol. 2021, 23, 74–88. [Google Scholar] [CrossRef]
- Szmyd, R.; Niska-Blakie, J.; Diril, M.K.; Nunes, P.R.; Tzelepis, K.; Lacroix, A.; Van Hul, N.; Deng, L.-W.; Matos, J.; Dreesen, O.; et al. Premature activation of Cdk1 leads to mitotic events in S phase and embryonic lethality. Oncogene 2018, 38, 998–1018. [Google Scholar] [CrossRef]
- Elbæk, C.R.; Petrosius, V.; Benada, J.; Erichsen, L.; Damgaard, R.B.; Sørensen, C.S. WEE1 kinase protects the stability of stalled DNA replication forks by limiting CDK2 activity. Cell Rep. 2022, 38, 110261. [Google Scholar] [CrossRef]
- Davis, F.M.; Tsao, T.Y.; Fowler, S.K.; Rao, P.N. Monoclonal antibodies to mitotic cells. Proc. Natl. Acad. Sci. USA 1983, 80, 2926–2930. [Google Scholar] [CrossRef] [Green Version]
- Lau, H.W.; Ma, H.T.; Yeung, T.K.; Tam, M.Y.; Zheng, D.; Chu, S.K.; Poon, R.Y.C. Quantitative differences between cyclin-dependent kinases underlie the unique functions of CDK1 in human cells. Cell Rep. 2021, 37, 109808. [Google Scholar] [CrossRef]
- Vassilev, L.T.; Tovar, C.; Chen, S.; Knezevic, D.; Zhao, X.; Sun, H.; Heimbrook, D.C.; Chen, L. Selective small-molecule inhibitor reveals critical mitotic functions of human CDK1. Proc. Natl. Acad. Sci. USA 2006, 103, 10660–10665. [Google Scholar] [CrossRef] [PubMed] [Green Version]
- Flynn, R.L.; Zou, L. ATR: A master conductor of cellular responses to DNA replication stress. Trends Biochem. Sci. 2011, 36, 133–140. [Google Scholar] [CrossRef] [PubMed] [Green Version]
- Ubhi, T.; Brown, G.W. Exploiting DNA Replication Stress for Cancer Treatment. Cancer Res. 2019, 79, 1730–1739. [Google Scholar] [CrossRef] [PubMed] [Green Version]
- Lan, W.; Bian, B.; Xia, Y.; Dou, S.; Gayet, O.; Bigonnet, M.; Santofimia-Castaño, P.; Cong, M.; Peng, L.; Dusetti, N.; et al. E2F signature is predictive for the pancreatic adenocarcinoma clinical outcome and sensitivity to E2F inhibitors, but not for the response to cytotoxic-based treatments. Sci. Rep. 2018, 8, 8330. [Google Scholar] [CrossRef]
- Segeren, H.A.; van Rijnberk, L.M.; Moreno, E.; Riemers, F.M.; van Liere, E.A.; Yuan, R.; Wubbolts, R.; de Bruin, A.; Westendorp, B. Excessive E2F Transcription in Single Cancer Cells Precludes Transient Cell-Cycle Exit after DNA Damage. Cell Rep. 2020, 33, 108449. [Google Scholar] [CrossRef] [PubMed]
- Davis, J.N.; Wojno, K.J.; Daignault, S.; Hofer, M.D.; Kuefer, R.; Rubin, M.A.; Day, M.L. Elevated E2F1 Inhibits Transcription of the Androgen Receptor in Metastatic Hormone-Resistant Prostate Cancer. Cancer Res. 2006, 66, 11897–11906. [Google Scholar] [CrossRef] [PubMed] [Green Version]
- Libertini, S.J.; Tepper, C.G.; Guadalupe, M.; Lu, Y.; Asmuth, D.M.; Mudryj, M. E2F1 expression in LNCaP prostate cancer cells deregulates androgen dependent growth, suppresses differentiation, and enhances apoptosis. Prostate 2005, 66, 70–81. [Google Scholar] [CrossRef] [PubMed]
- Abt, E.R.; Le, T.M.; Dann, A.M.; Capri, J.R.; Poddar, S.; Lok, V.; Li, L.; Liang, K.; Creech, A.L.; Rashid, K.; et al. Reprogramming of nucleotide metabolism by interferon confers dependence on the replication stress response pathway in pancreatic cancer cells. Cell Rep. 2022, 38, 110236. [Google Scholar] [CrossRef]
- Ma, J.; Zhong, M.; Xiong, Y.; Gao, Z.; Wu, Z.; Liu, Y.; Hong, X. Emerging roles of nucleotide metabolism in cancer development: Progress and prospect. Aging 2021, 13, 13349–13358. [Google Scholar] [CrossRef]
- Ogrodzinski, M.P.; Teoh, S.T.; Lunt, S.Y. Targeting Subtype-Specific Metabolic Preferences in Nucleotide Biosynthesis Inhibits Tumor Growth in a Breast Cancer Model. Cancer Res. 2021, 81, 303–314. [Google Scholar] [CrossRef]
- Peters, G.; Backus, H.; Freemantle, S.; van Triest, B.; Codacci-Pisanelli, G.; van der Wilt, C.; Smid, K.; Lunec, J.; Calvert, A.; Marsh, S.; et al. Induction of thymidylate synthase as a 5-fluorouracil resistance mechanism. Biochim. et Biophys. Acta (BBA)-Mol. Basis Dis. 2002, 1587, 194–205. [Google Scholar] [CrossRef] [Green Version]
- Haritha, N.H.; Nawab, A.; Vijayakurup, V.; Anto, N.P.; Liju, V.B.; Alex, V.V.; Amrutha, A.N.; Aiswarya, S.U.; Swetha, M.; Vinod, B.S.; et al. Targeting Thymidylate Synthase Enhances the Chemosensitivity of Triple-Negative Breast Cancer towards 5-FU-Based Combinatorial Therapy. Front. Oncol. 2021, 11, 656804. [Google Scholar] [CrossRef]
- Park, S.R.; Namkoong, S.; Friesen, L.; Cho, C.-S.; Zhang, Z.Z.; Chen, Y.-C.; Yoon, E.; Kim, C.H.; Kwak, H.; Kang, H.M.; et al. Single-Cell Transcriptome Analysis of Colon Cancer Cell Response to 5-Fluorouracil-Induced DNA Damage. Cell Rep. 2020, 32, 108077. [Google Scholar] [CrossRef]
- Rather, G.; Anyanwu, M.; Minko, T.; Garbuzenko, O.; Szekely, Z.; Bertino, J. Anti-Tumor Effects of a Penetratin Peptide Targeting Transcription of E2F-1, 2 and 3a Is Enhanced When Used in Combination with Pemetrexed or Cisplatin. Cancers 2021, 13, 972. [Google Scholar] [CrossRef]
- Deng, L.; Wu, R.A.; Sonneville, R.; Kochenova, O.V.; Labib, K.; Pellman, D.; Walter, J.C. Mitotic CDK Promotes Replisome Disassembly, Fork Breakage, and Complex DNA Rearrangements. Mol. Cell 2019, 73, 915–929.e6. [Google Scholar] [CrossRef] [Green Version]
- Galarreta, A.; Valledor, P.; Ubieto-Capella, P.; Lafarga, V.; Zarzuela, E.; Muñoz, J.; Malumbres, M.; Lecona, E.; Fernandez-Capetillo, O. USP7 limits CDK1 activity throughout the cell cycle. EMBO J. 2021, 40, e99692. [Google Scholar] [CrossRef]
- Beck, H.; Nähse, V.; Larsen, M.S.Y.; Groth, P.; Clancy, T.; Lees, M.; Jørgensen, M.; Helleday, T.; Syljuåsen, R.G.; Sorensen, C. Regulators of cyclin-dependent kinases are crucial for maintaining genome integrity in S phase. J. Cell Biol. 2010, 188, 629–638. [Google Scholar] [CrossRef] [PubMed]
- Suski, J.M.; Ratnayeke, N.; Braun, M.; Zhang, T.; Strmiska, V.; Michowski, W.; Can, G.; Simoneau, A.; Snioch, K.; Cup, M.; et al. CDC7-independent G1/S transition revealed by targeted protein degradation. Nature 2022, 605, 357–365. [Google Scholar] [CrossRef] [PubMed]
- King, D.; Southgate, H.E.D.; Roetschke, S.; Gravells, P.; Fields, L.; Watson, J.B.; Chen, L.; Chapman, D.; Harrison, D.; Yeomanson, D.; et al. Increased Replication Stress Determines ATR Inhibitor Sensitivity in Neuroblastoma Cells. Cancers 2021, 13, 6215. [Google Scholar] [CrossRef] [PubMed]
- Gulliver, C.; Hoffmann, R.; Baillie, G.S. Ataxia-telangiectasia mutated and ataxia telangiectasia and Rad3-related kinases as therapeutic targets and stratification indicators for prostate cancer. Int. J. Biochem. Cell Biol. 2022, 147, 106230. [Google Scholar] [CrossRef]


Publisher’s Note: MDPI stays neutral with regard to jurisdictional claims in published maps and institutional affiliations. |
© 2022 by the authors. Licensee MDPI, Basel, Switzerland. This article is an open access article distributed under the terms and conditions of the Creative Commons Attribution (CC BY) license (https://creativecommons.org/licenses/by/4.0/).
Share and Cite
Hamidi, M.; Eriz, A.; Mitxelena, J.; Fernandez-Ares, L.; Aurrekoetxea, I.; Aspichueta, P.; Iglesias-Ara, A.; Zubiaga, A.M. Targeting E2F Sensitizes Prostate Cancer Cells to Drug-Induced Replication Stress by Promoting Unscheduled CDK1 Activity. Cancers 2022, 14, 4952. https://doi.org/10.3390/cancers14194952
Hamidi M, Eriz A, Mitxelena J, Fernandez-Ares L, Aurrekoetxea I, Aspichueta P, Iglesias-Ara A, Zubiaga AM. Targeting E2F Sensitizes Prostate Cancer Cells to Drug-Induced Replication Stress by Promoting Unscheduled CDK1 Activity. Cancers. 2022; 14(19):4952. https://doi.org/10.3390/cancers14194952
Chicago/Turabian StyleHamidi, Mohaddase, Ainhoa Eriz, Jone Mitxelena, Larraitz Fernandez-Ares, Igor Aurrekoetxea, Patricia Aspichueta, Ainhoa Iglesias-Ara, and Ana M. Zubiaga. 2022. "Targeting E2F Sensitizes Prostate Cancer Cells to Drug-Induced Replication Stress by Promoting Unscheduled CDK1 Activity" Cancers 14, no. 19: 4952. https://doi.org/10.3390/cancers14194952