

Nuclear Beclin 1 Destabilizes Retinoblastoma Protein to Promote Cell Cycle Progression and Colorectal Cancer Growth
 , , , , , , and
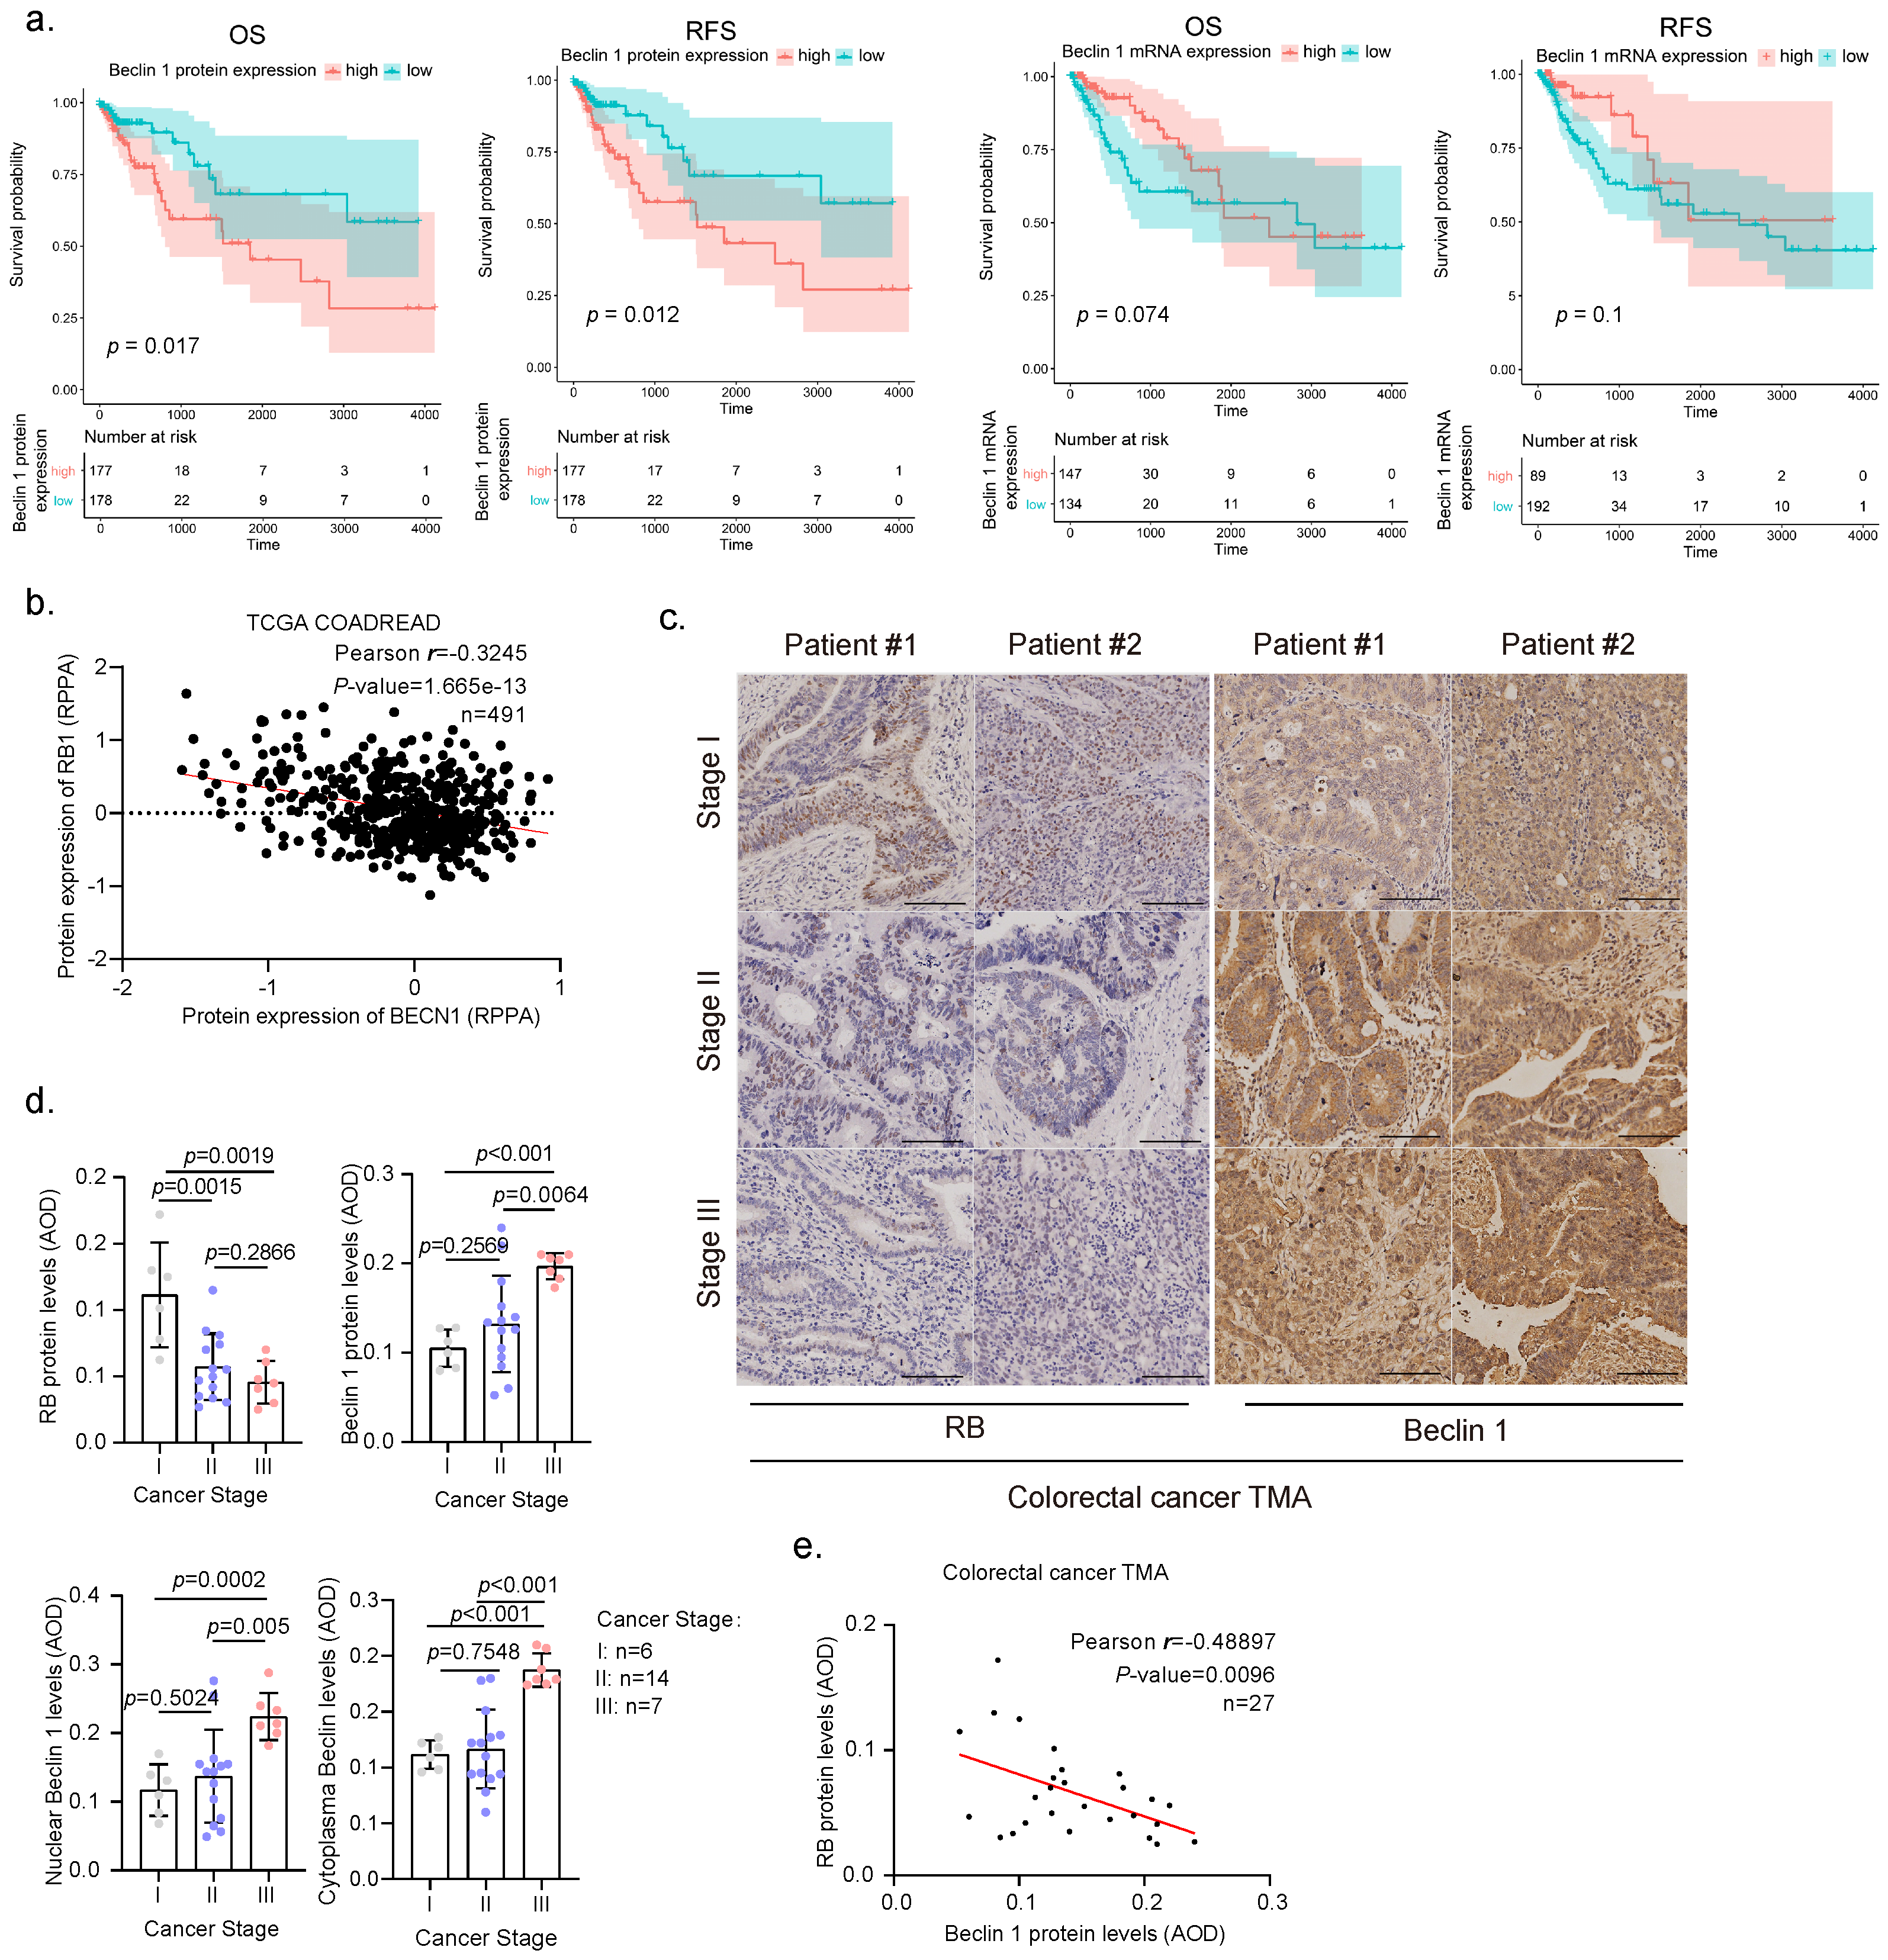
Abstract
:Simple Summary
Abstract
1. Introduction
2. Materials and Methods
2.1. Cell Culture and Reagents
2.2. Plasmids, Lentiviral Infection, and RNA Interference
2.3. Western Blot, Immunofluorescence (IF), and Immunohistochemistry (IHC) Analyses
2.4. Flow Cytometry Analysis
2.5. Quantitative PCR (qPCR) Analysis
2.6. Colony Formation Assay
2.7. Real-Time Cell Analysis (RTCA)
2.8. Mouse Xenograft Studies
2.9. Correlation and Survival Analyses Based on Data from Clinical Specimens
2.10. Statistical Analyses
3. Results
3.1. Elevated Expression and Nuclear Location of Beclin 1 Is Negatively Correlated with RB Expression in Malignant Human Colorectal Cancer Specimens
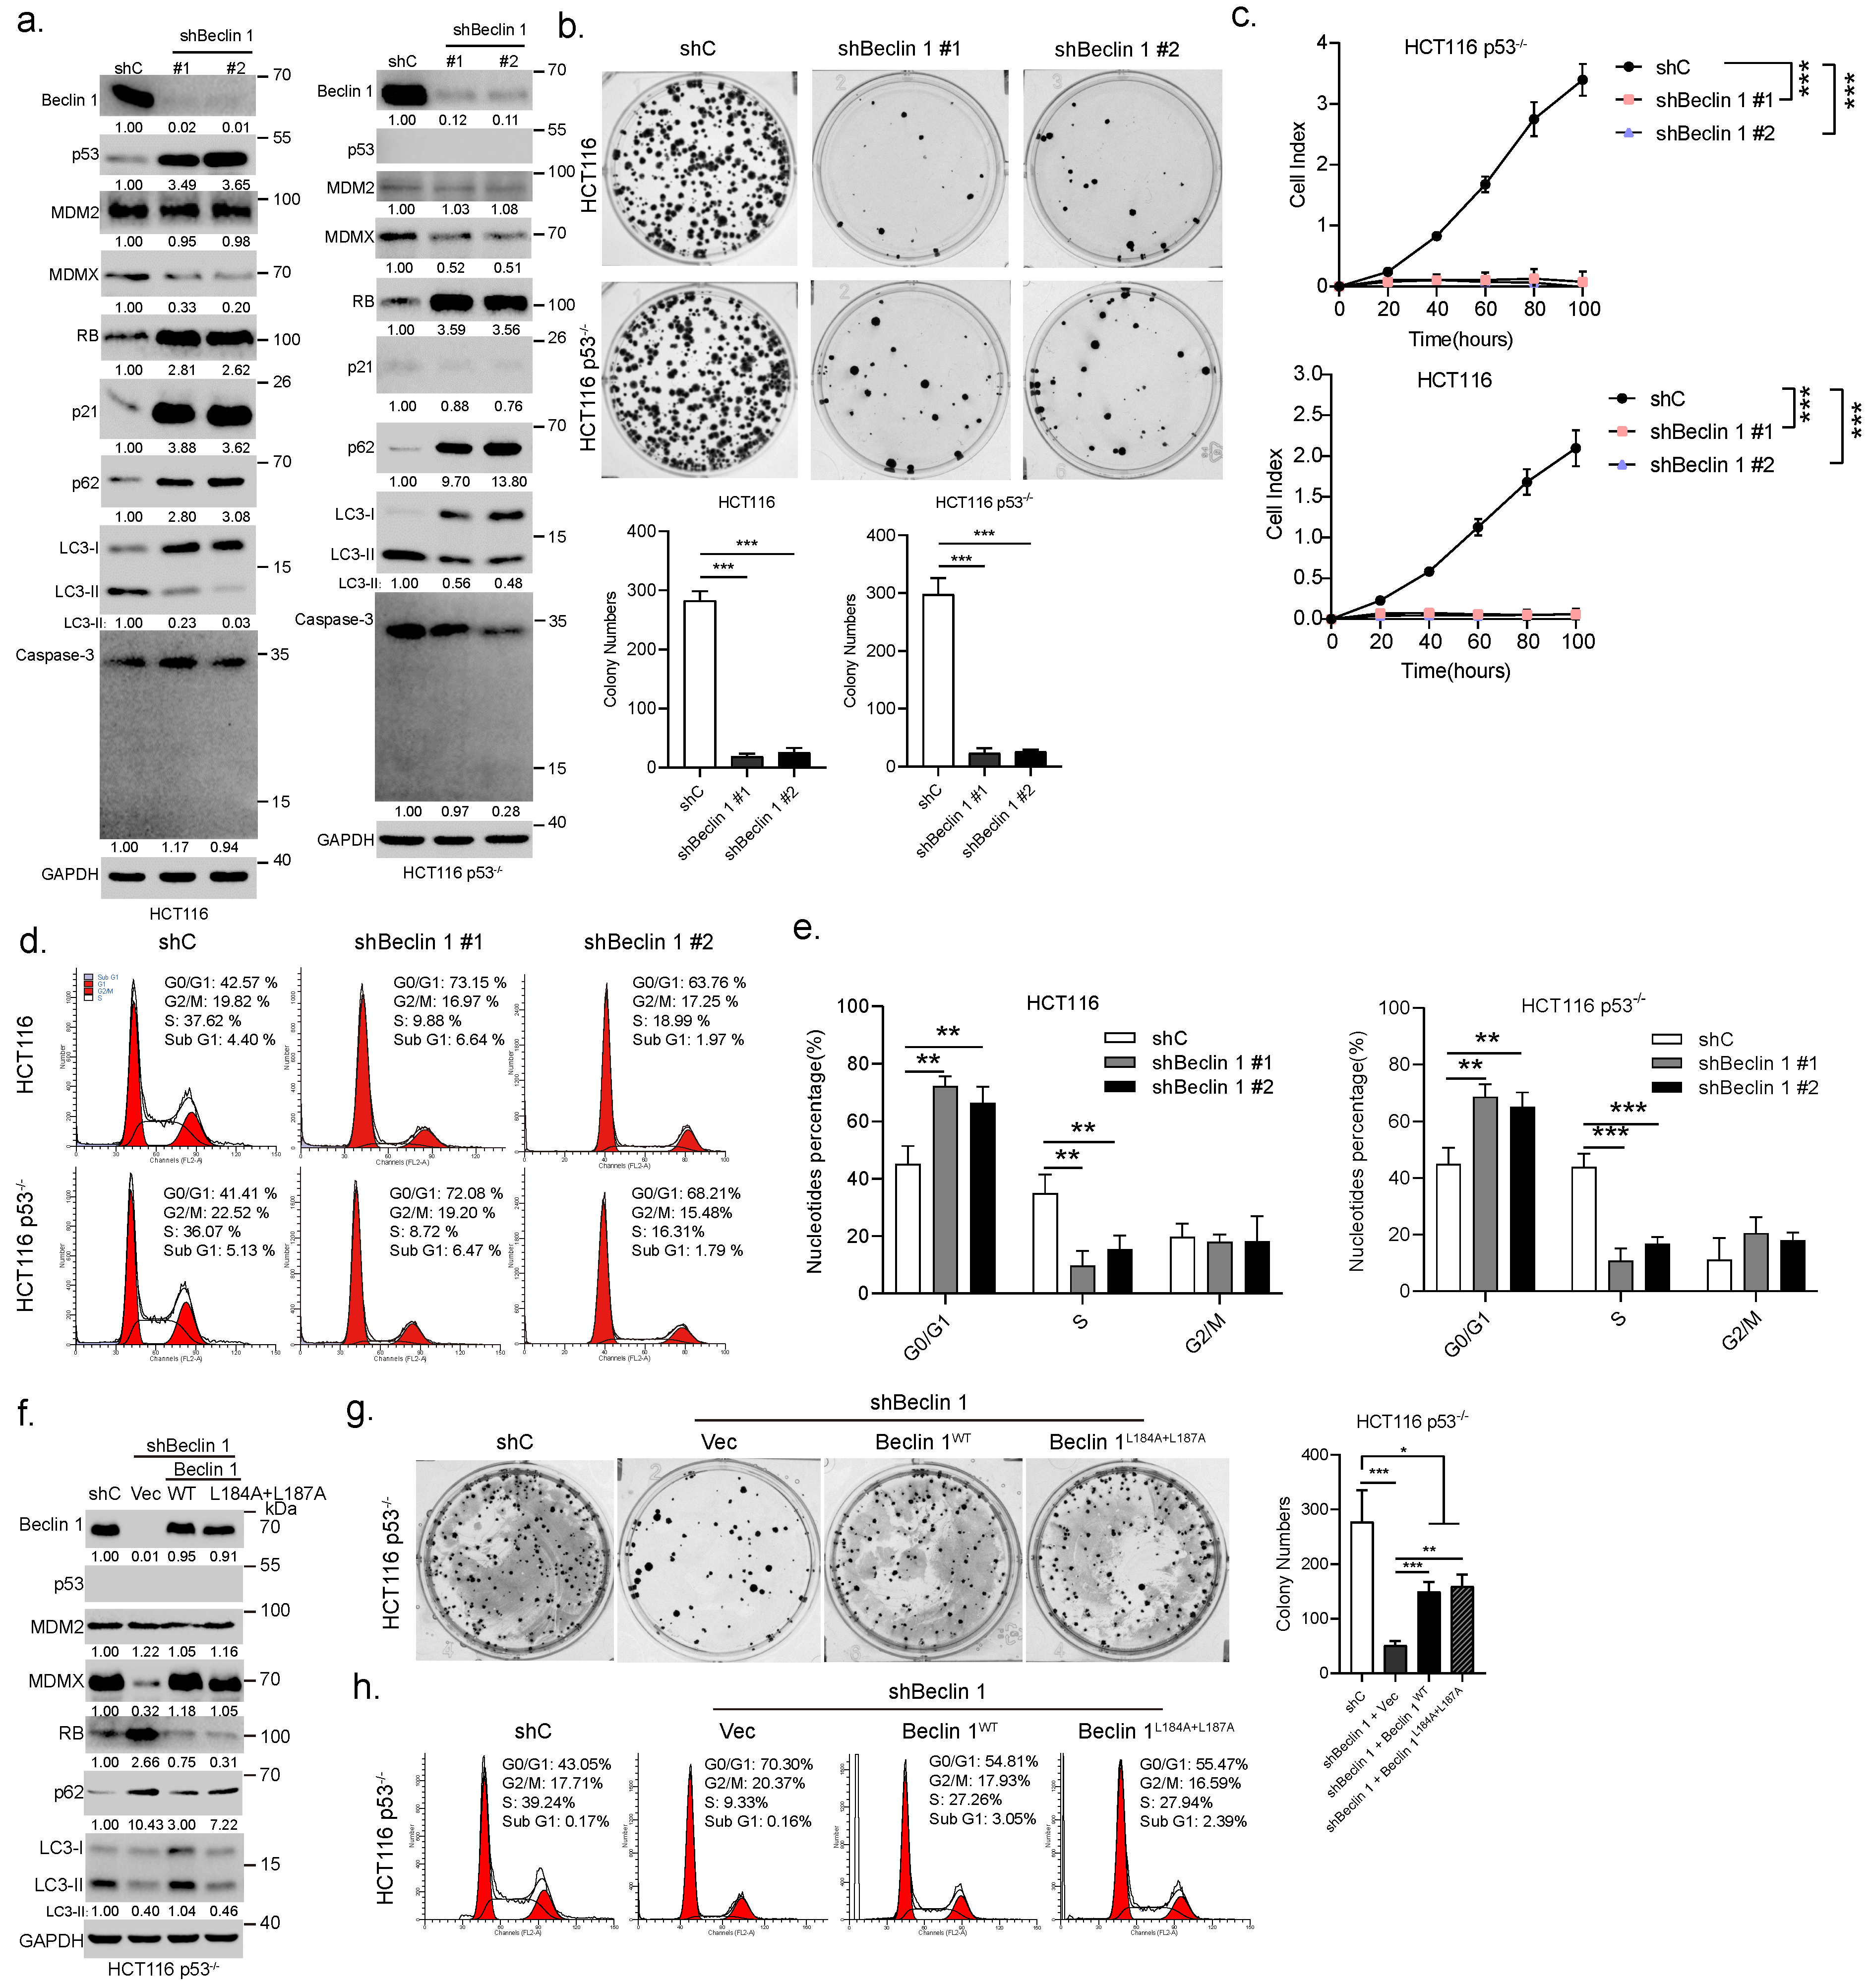
3.2. Ablation of BECN1 Leads to Cell Cycle G1 Arrest and Cell Growth Retardation Independent of p53
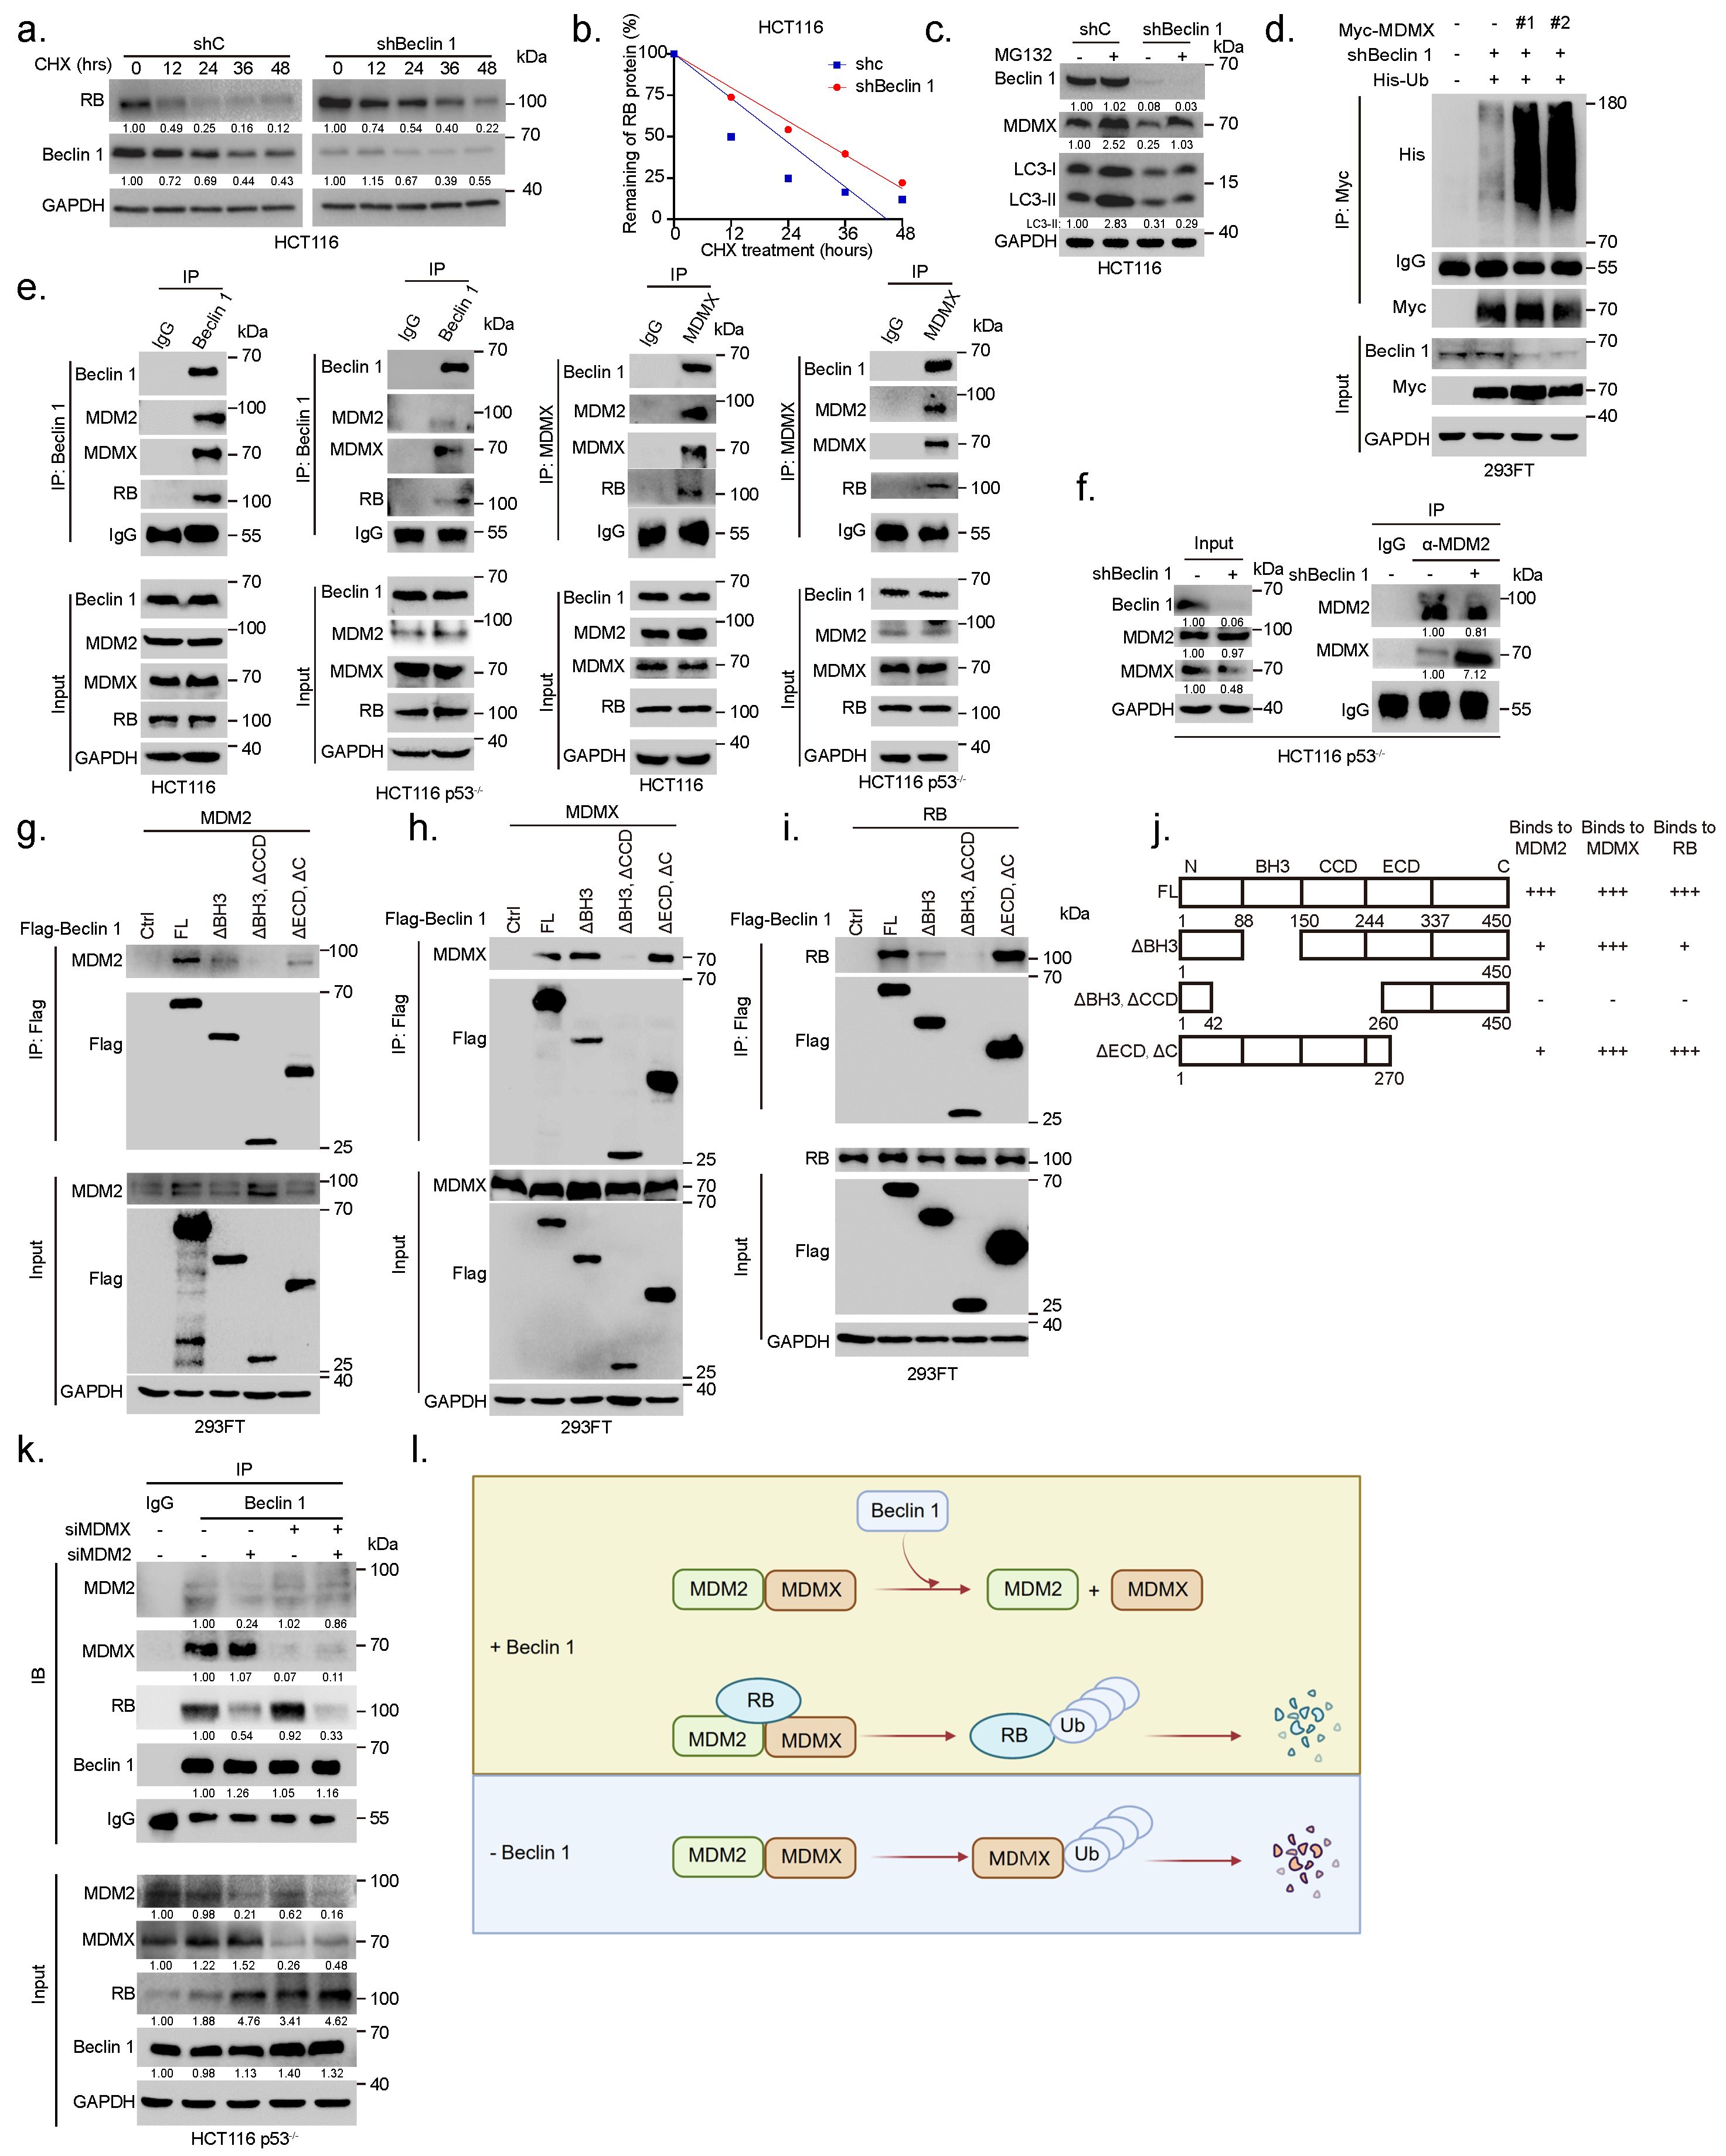
3.3. Ablation of BECN1 Downregulates MDMX Expression to Induce RB-Dependent Cell Cycle Arrest and Inhibition of Cell Growth
3.4. Ablation of BECN1 Facilitates MDM2–MDMX Interaction to Promote MDMX Degradation Leading to RB Protein Stabilization
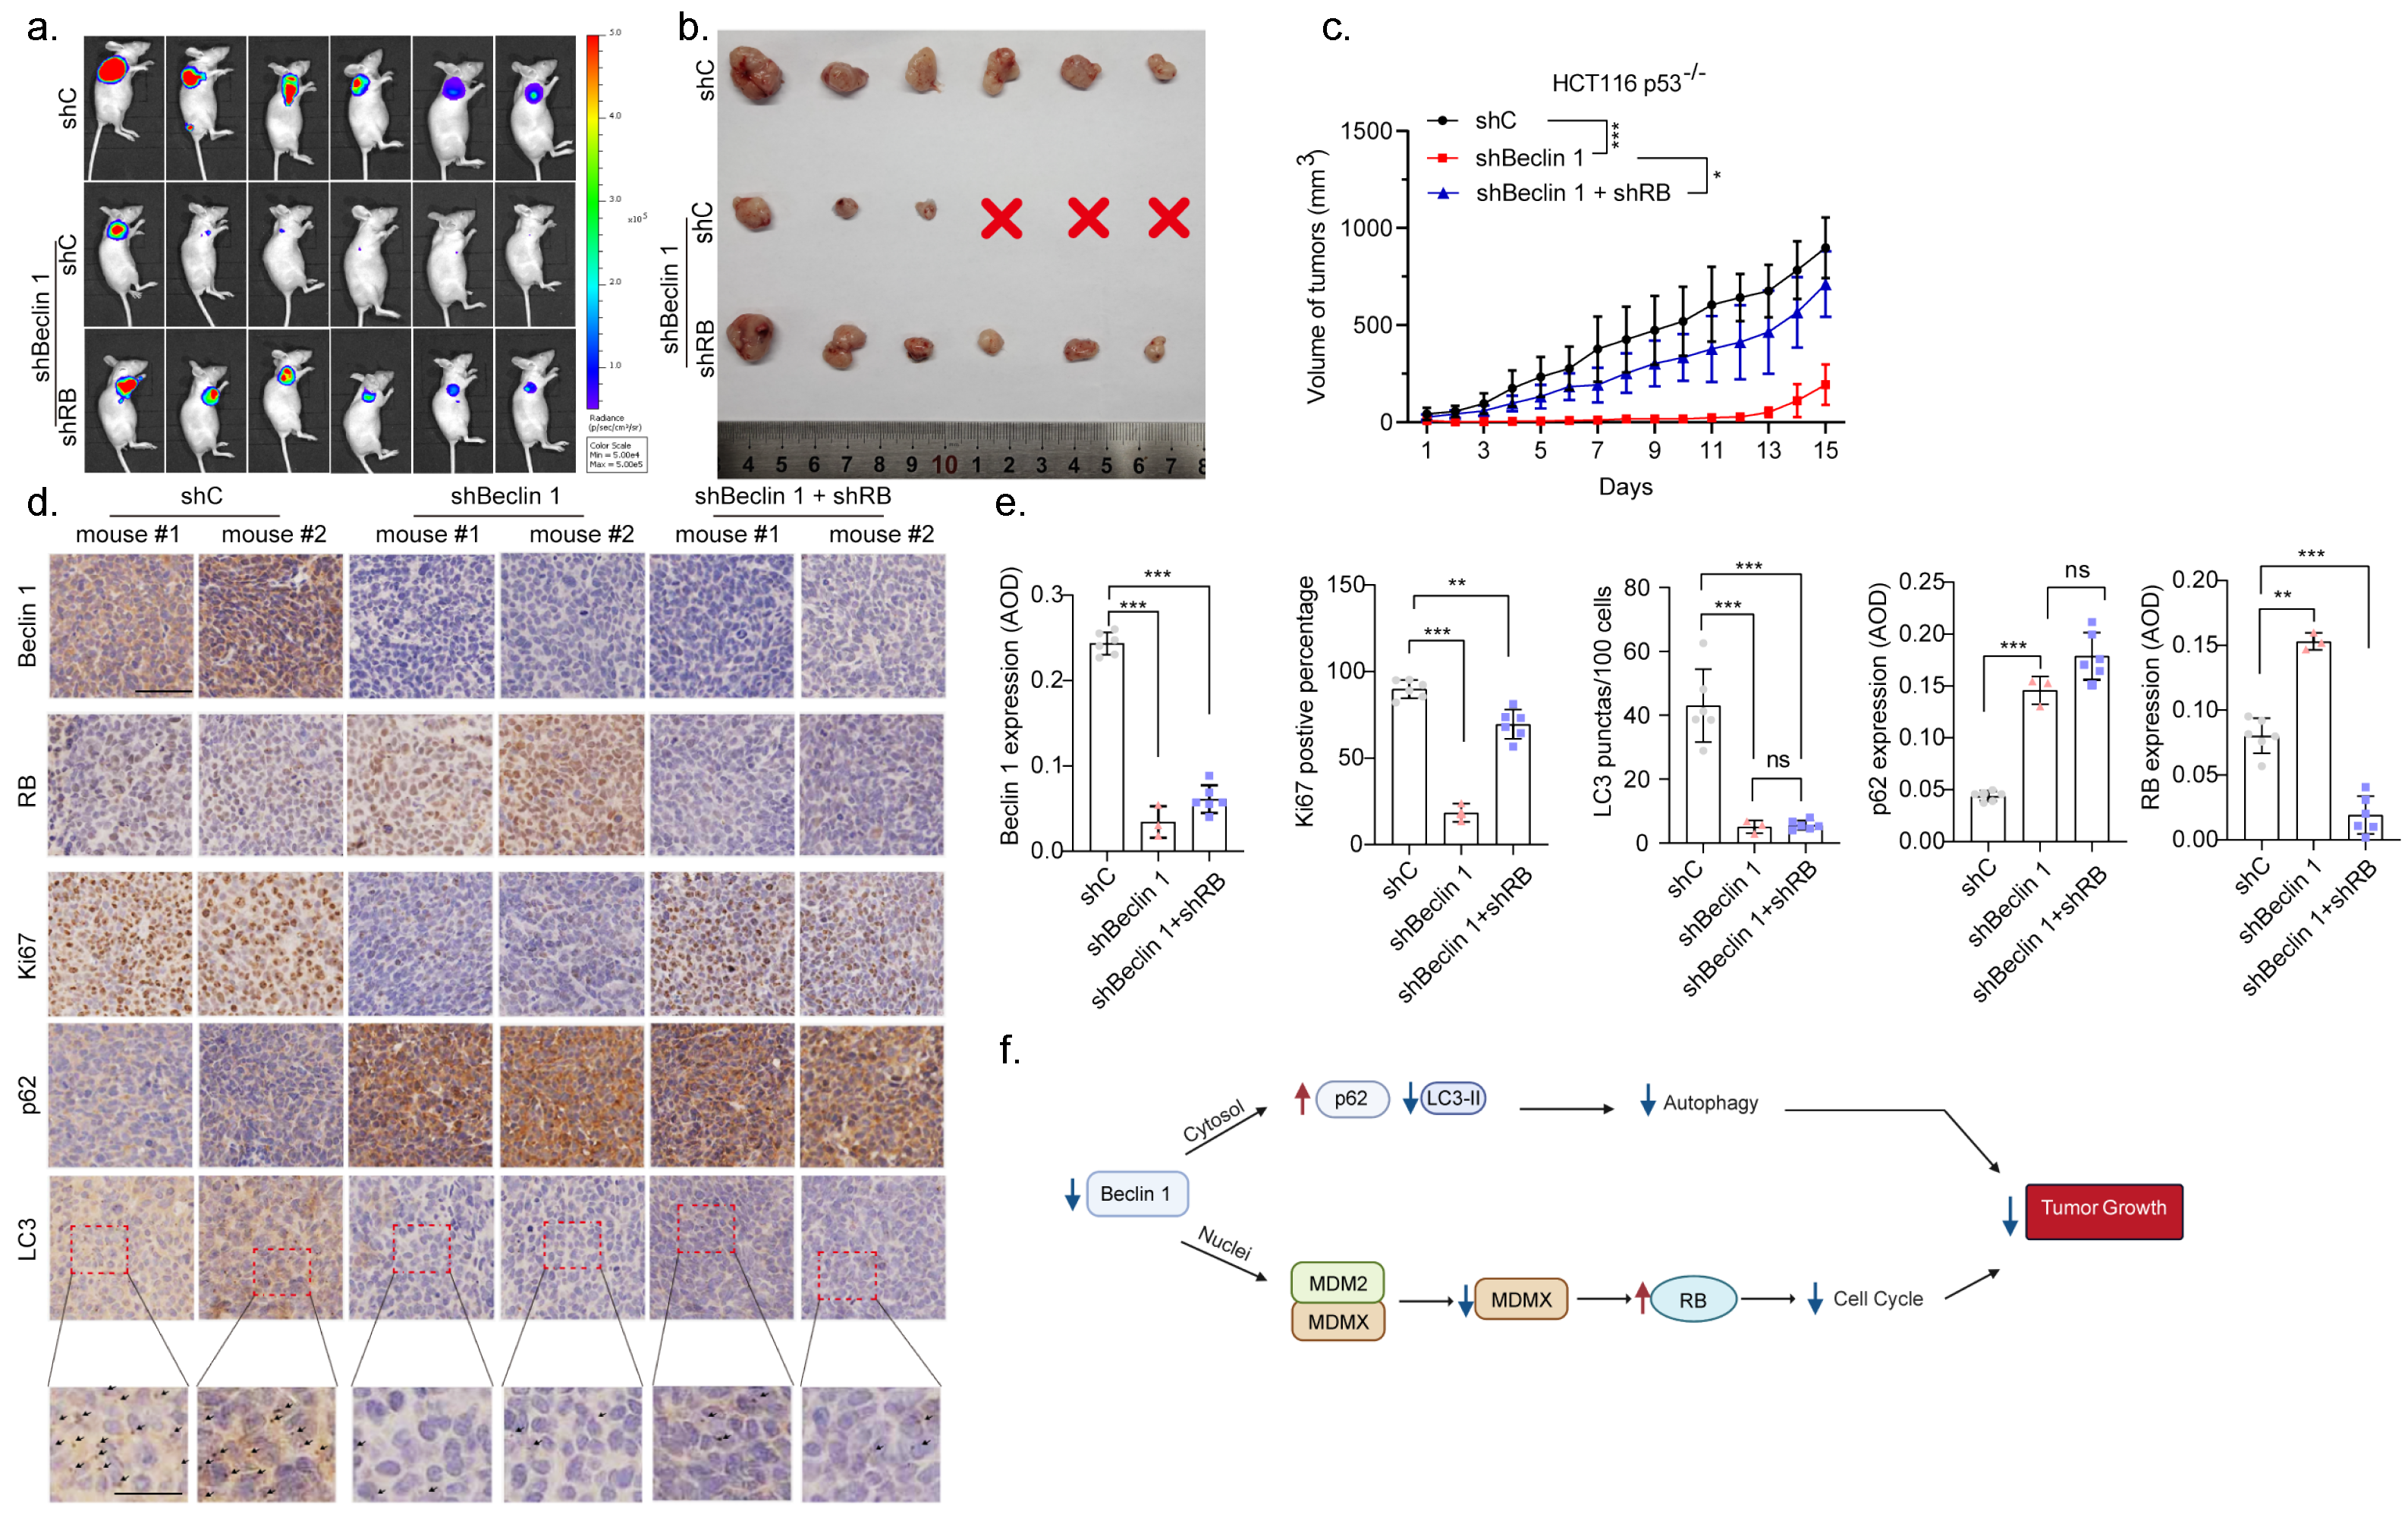
3.5. Knockdown of BECN1 Suppresses Xenograft Tumor Growth through Activation of RB
4. Discussion
Supplementary Materials
Author Contributions
Funding
Institutional Review Board Statement
Informed Consent Statement
Data Availability Statement
Acknowledgments
Conflicts of Interest
References
- Keum, N.; Giovannucci, E. Global burden of colorectal cancer: Emerging trends, risk factors and prevention strategies. Nat. Rev. Gastroenterol. Hepatol. 2019, 16, 713–732. [Google Scholar] [CrossRef] [PubMed]
- Tiziana, P.; Bronson, R.T.; Lees, J.A. Inactivation of the retinoblastoma gene yields a mouse model of malignant colorectal cancer. Oncogene 2015, 34, 5890–5899. [Google Scholar]
- Dick Frederick, A.; Rubin, S.M. Molecular mechanisms underlying RB protein function. Nat. Rev. Gastroenterol. Hepatol. 2013, 14, 297–306. [Google Scholar]
- Patima, S.; Ying, H.; Chang, D.L.F.; Qiu, W.; Zheng, H.; Touitou, R.; Allday, M.J.; Xiao, Z.J. MDM2 promotes proteasome-dependent ubiquitin-independent degradation of retinoblastoma protein. Mol. Cell 2005, 20, 699–708. [Google Scholar]
- Patima, S.; Ying, H.; Zheng, H.; Margulis, A.; Tang, X.; Tian, K.; Xiao, Z.J. The central acidic domain of MDM2 is critical in inhibition of retinoblastoma-mediated suppression of E2F and cell growth. J. Biol. Chem. 2005, 279, 53317–53322. [Google Scholar]
- Zhang, H.; Hu, L.; Qiu, W.; Deng, T.; Zhang, Y.; Bergholz, J.; Xiao, Z.X. MDMX exerts its oncogenic activity via suppression of retinoblastoma protein. Oncogene 2015, 34, 5560–5569. [Google Scholar] [CrossRef]
- Bo, Z.; Liu, L. Autophagy is a double-edged sword in the therapy of colorectal cancer. Oncol. Lett. 2021, 21, 378. [Google Scholar]
- Ken, L.; Killingsworth, M.C.; Lee, C.S. The significance of autophagy in colorectal cancer pathogenesis and implications for therapy. J. Clin. Pathol. 2014, 67, 854–858. [Google Scholar]
- Florin, B.; Nicoli, E.R.; Ciurea, M.E.; Uscatu, D.C.; Ioana, M.; Gheonea, D.I. Autophagy in colorectal cancer: An important switch from physiology to pathology. World J. Gastrointest. Oncol. 2015, 7, 271–284. [Google Scholar]
- Zhenyu, Y.; Jin, S.; Yang, C.; Levine, A.J.; Heintz, N. Beclin 1, an autophagy gene essential for early embryonic development, is a haploinsufficient tumor suppressor. Proc. Natl. Acad. Sci. USA 2003, 100, 15077–15082. [Google Scholar]
- Hong, S.; Yin, L.; Deng, G.; Guo, C.; Han, Y.; Li, Y.; Cai, C.; Fu, Y.; Liu, S.; Zeng, S. Knockdown of beclin-1 impairs epithelial-mesenchymal transition of colon cancer cells. J. Cell. Biochem. 2018, 119, 7022–7031. [Google Scholar]
- Kenji, K.; Goi, T.; Hirono, Y.; Katayama, K.; Yamaguchi, A. Beclin 1 gene inhibits tumor growth in colon cancer cell lines. Anticancer Res. 2007, 27, 1453–1457. [Google Scholar]
- Huan, L.X.; Yu, J.; Brown, K.; Levine, B. Beclin 1 contains a leucine-rich nuclear export signal that is required for its autophagy and tumor suppressor function. Cancer Res. 2001, 61, 3443–3449. [Google Scholar]
- Congcong, H.; Levine, B. The beclin 1 interactome. Curr. Opin. Cell Biol. 2010, 22, 140–149. [Google Scholar]
- Hsien-Wei, Y.; Karmach, O.; Ji, A.; Carter, D.; Martins-Green, M.M.; Ai, H. Red-shifted luciferase-luciferin pairs for enhanced bioluminescence imaging. Nat. Methods 2017, 14, 971–974. [Google Scholar]
- Yang, W.; Li, J.; Gao, Y.; Luo, Y.; Luo, H.; Wang, L.; Yi, Y.; Yuan, Z.; Xiao, Z.J. Hippo kinases regulate cell junctions to inhibit tumor metastasis in response to oxidative stress. Redox Biol. 2019, 26, 101233. [Google Scholar]
- Peter, B.; Loughrey, M.B.; Fernández, J.A.; Dombrowski, Y.; McArt, D.G.; Dunne, P.D.; McQuaid, S.; Gray, R.T.; Murray, L.J.; Coleman, H.G. QuPath: Open source software for digital pathology image analysis. Sci. Rep. 2017, 7, 16878. [Google Scholar]
- Christopher, B.; Kirstein, S. Real-time, label-free monitoring of cellular invasion and migration with the xCELLigence system. Nat. Methods 2009, 6, v–vi. [Google Scholar]
- Ethan, C.; Gao, J.; Dogrusoz, U.; Gross, B.E.; Sumer, S.O.; Aksoy, B.A.; Jacobsen, A.; Byrne, C.J.; Heuer, M.L.; Larsson, E. The cBio Cancer Genomics Portal: An Open Platform for Exploring Multidimensional Cancer Genomics Data. Cancer Discov. 2012, 5, 401–404. [Google Scholar]
- Gao, J.; Aksoy, B.A.; Dogrusoz, U.; Dresdner, G.; Gross, B.; Sumer, S.O.; Sun, Y.; Jacobsen, A.; Sinha, R.; Larsson, E. Integrative analysis of complex cancer genomics and clinical profiles using the cBioPortal. Sci. Signal. 2013, 6, pl1. [Google Scholar] [CrossRef]
- Zefang, T.; Li, C.; Kang, B.; Gao, G.; Li, C.; Zhang, Z. GEPIA: A web server for cancer and normal gene expression profiling and interactive analyses. Nucleic Acids Res. 2017, 45, 98–102. [Google Scholar]
- Straub, V.S.V.P.; Wang, J.; Zhang, B. LinkedOmics: Analyzing multi-omics data within and across 32 cancer types. Nucleic Acids Res. 2018, 46, 956–963. [Google Scholar]
- Giacinti, C.; Giordano, A. RB and cell cycle progression. Oncogene 2006, 25, 5220–5227. [Google Scholar] [CrossRef] [PubMed]
- Palmqvist, R.; Stenling, R.; Öberg, Å.; Landberg, G. Expression of cyclin D1 and retinoblastoma protein in colorectal cancer. Eur. J. Cancer 1998, 34, 1575–1581. [Google Scholar] [CrossRef]
- Hirofumi, Y.; Soh, J.; Monden, T.; Klein, M.G.; Zhang, L.M.; Shirin, H.; Arber, N.; Tomita, N.; Schieren, I.; Stein, C.A. Paradoxical Increase in Retinoblastoma Protein in Colorectal Caicinomas May Protect Cell from Apoptosis. Clin. Cancer Res. 1999, 5, 1805–1815. [Google Scholar]
- Grossman, R.L.; Heath, A.P.; Ferretti, V.; Varmus, H.E.; Lowy, D.R.; Kibbe, W.A.; Staudt, L.M. Toward a Shared Vision for Cancer Genomic Data. N. Engl. J. Med. 2016, 12, 1109–1112. [Google Scholar] [CrossRef]
- Yu, P.; Chen, J. MDM2 promotes ubiquitination and degradation of MDMX. Mol. Cell. Biol. 2003, 23, 5113–5121. [Google Scholar]
- Hidehiko, K.; Wiederschain, D.; Kitao, H.; Stuart, J.; Tsai, K.K.C.; Yuan, Z. DNA damage-induced MDMX degradation is mediated by MDM2. J. Biol. Chem. 2003, 278, 45946–45953. [Google Scholar]
- Koukourakis, M.I.; Giatromanolaki, A.; Sivridis, E.; Pitiakoudis, M.; Gatter, K.C.; Harris, A.L. Beclin 1 over-and underexpression in colorectal cancer: Distinct patterns relate to prognosis and tumor hypoxia. Br. J. Cancer 2010, 103, 1209–1214. [Google Scholar] [CrossRef]
- Ye, H.; Xue, X.; Shen, H.; Guo, X.; Wang, X.; Yuan, B.; Guo, X.; Kuang, Y.; Zhi, Q.; Zhao, H. Prognostic significance of Beclin-1 expression in colorectal cancer: A meta-analysis. Asian Pac. J. Cancer Prev. 2014, 15, 4583–4587. [Google Scholar] [CrossRef] [Green Version]
- Juergen, S.K.; Ademi, C.; Bertram, S.; Schmid, K.W.; Baba, H.A. Prognostic relevance of autophagy-related markers LC3, p62/sequestosome 1, Beclin-1 and ULK1 in colorectal cancer patients with respect to KRAS mutational status. World J. Surg. Oncol. 2016, 14, 1–13. [Google Scholar]
- Jean-Paul, D.; Parys, J.B.; Bultynck, G. Regulation of the autophagic bcl-2/beclin 1 interaction. Cells 2012, 3, 284–312. [Google Scholar]
- Fei, X.; Fang, Y.; Yan, L.; Xu, L.; Zhang, S.; Cao, Y.; Xu, L.; Zhang, X.; Xie, J.; Jiang, G. Nuclear localization of Beclin 1 promotes radiation-induced DNA damage repair independent of autophagy. Sci. Rep. 2012, 7, 45385. [Google Scholar]
- Zenggang, L.; Ivanov, A.A.; Su, R.; Gonzalez-Pecchi, V.; Qi, Q.; Liu, S.; Webber, P.; McMillan, E.; Rusnak, L.; Pham, C. The OncoPPi network of cancer-focused protein-protein interactions to inform biological insights and therapeutic strategies. Nat. Commun. 2017, 8, 14356. [Google Scholar]
- Mark, W.; Li, Y.; Wahl, G.M. MDM2, MDMX and p53 in oncogenesis and cancer therapy. Nat. Rev. Cancer 2013, 13, 83–96. [Google Scholar]


Publisher’s Note: MDPI stays neutral with regard to jurisdictional claims in published maps and institutional affiliations. |
© 2022 by the authors. Licensee MDPI, Basel, Switzerland. This article is an open access article distributed under the terms and conditions of the Creative Commons Attribution (CC BY) license (https://creativecommons.org/licenses/by/4.0/).
Share and Cite
Pan, Y.; Zhao, Z.; Li, J.; Li, J.; Luo, Y.; Li, W.; You, W.; Zhang, Y.; Li, Z.; Yang, J.; et al. Nuclear Beclin 1 Destabilizes Retinoblastoma Protein to Promote Cell Cycle Progression and Colorectal Cancer Growth. Cancers 2022, 14, 4735. https://doi.org/10.3390/cancers14194735
Pan Y, Zhao Z, Li J, Li J, Luo Y, Li W, You W, Zhang Y, Li Z, Yang J, et al. Nuclear Beclin 1 Destabilizes Retinoblastoma Protein to Promote Cell Cycle Progression and Colorectal Cancer Growth. Cancers. 2022; 14(19):4735. https://doi.org/10.3390/cancers14194735
Chicago/Turabian StylePan, Yang, Zhiqiang Zhao, Juan Li, Jinsong Li, Yue Luo, Weiyuxin Li, Wanbang You, Yujun Zhang, Zhonghan Li, Jian Yang, and et al. 2022. "Nuclear Beclin 1 Destabilizes Retinoblastoma Protein to Promote Cell Cycle Progression and Colorectal Cancer Growth" Cancers 14, no. 19: 4735. https://doi.org/10.3390/cancers14194735