
Splicing Analysis of 16 PALB2 ClinVar Variants by Minigene Assays: Identification of Six Likely Pathogenic Variants

 , , , , and
Abstract
:Simple Summary
Abstract
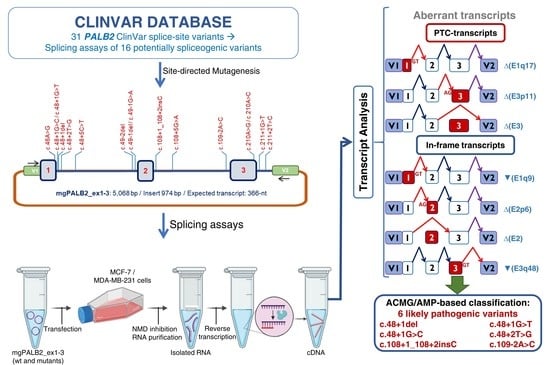
1. Introduction
2. Materials and Methods
2.1. Variant and Transcript Annotations
2.2. Bioinformatics: Databases and In Silico Studies
2.3. Minigene Construction and Mutagenesis
2.4. Splicing Functional Assays
2.5. Clinical Classification of PALB2 Variants
3. Results and Discussion
3.1. Bioinformatics Analysis of ClinVar Variants
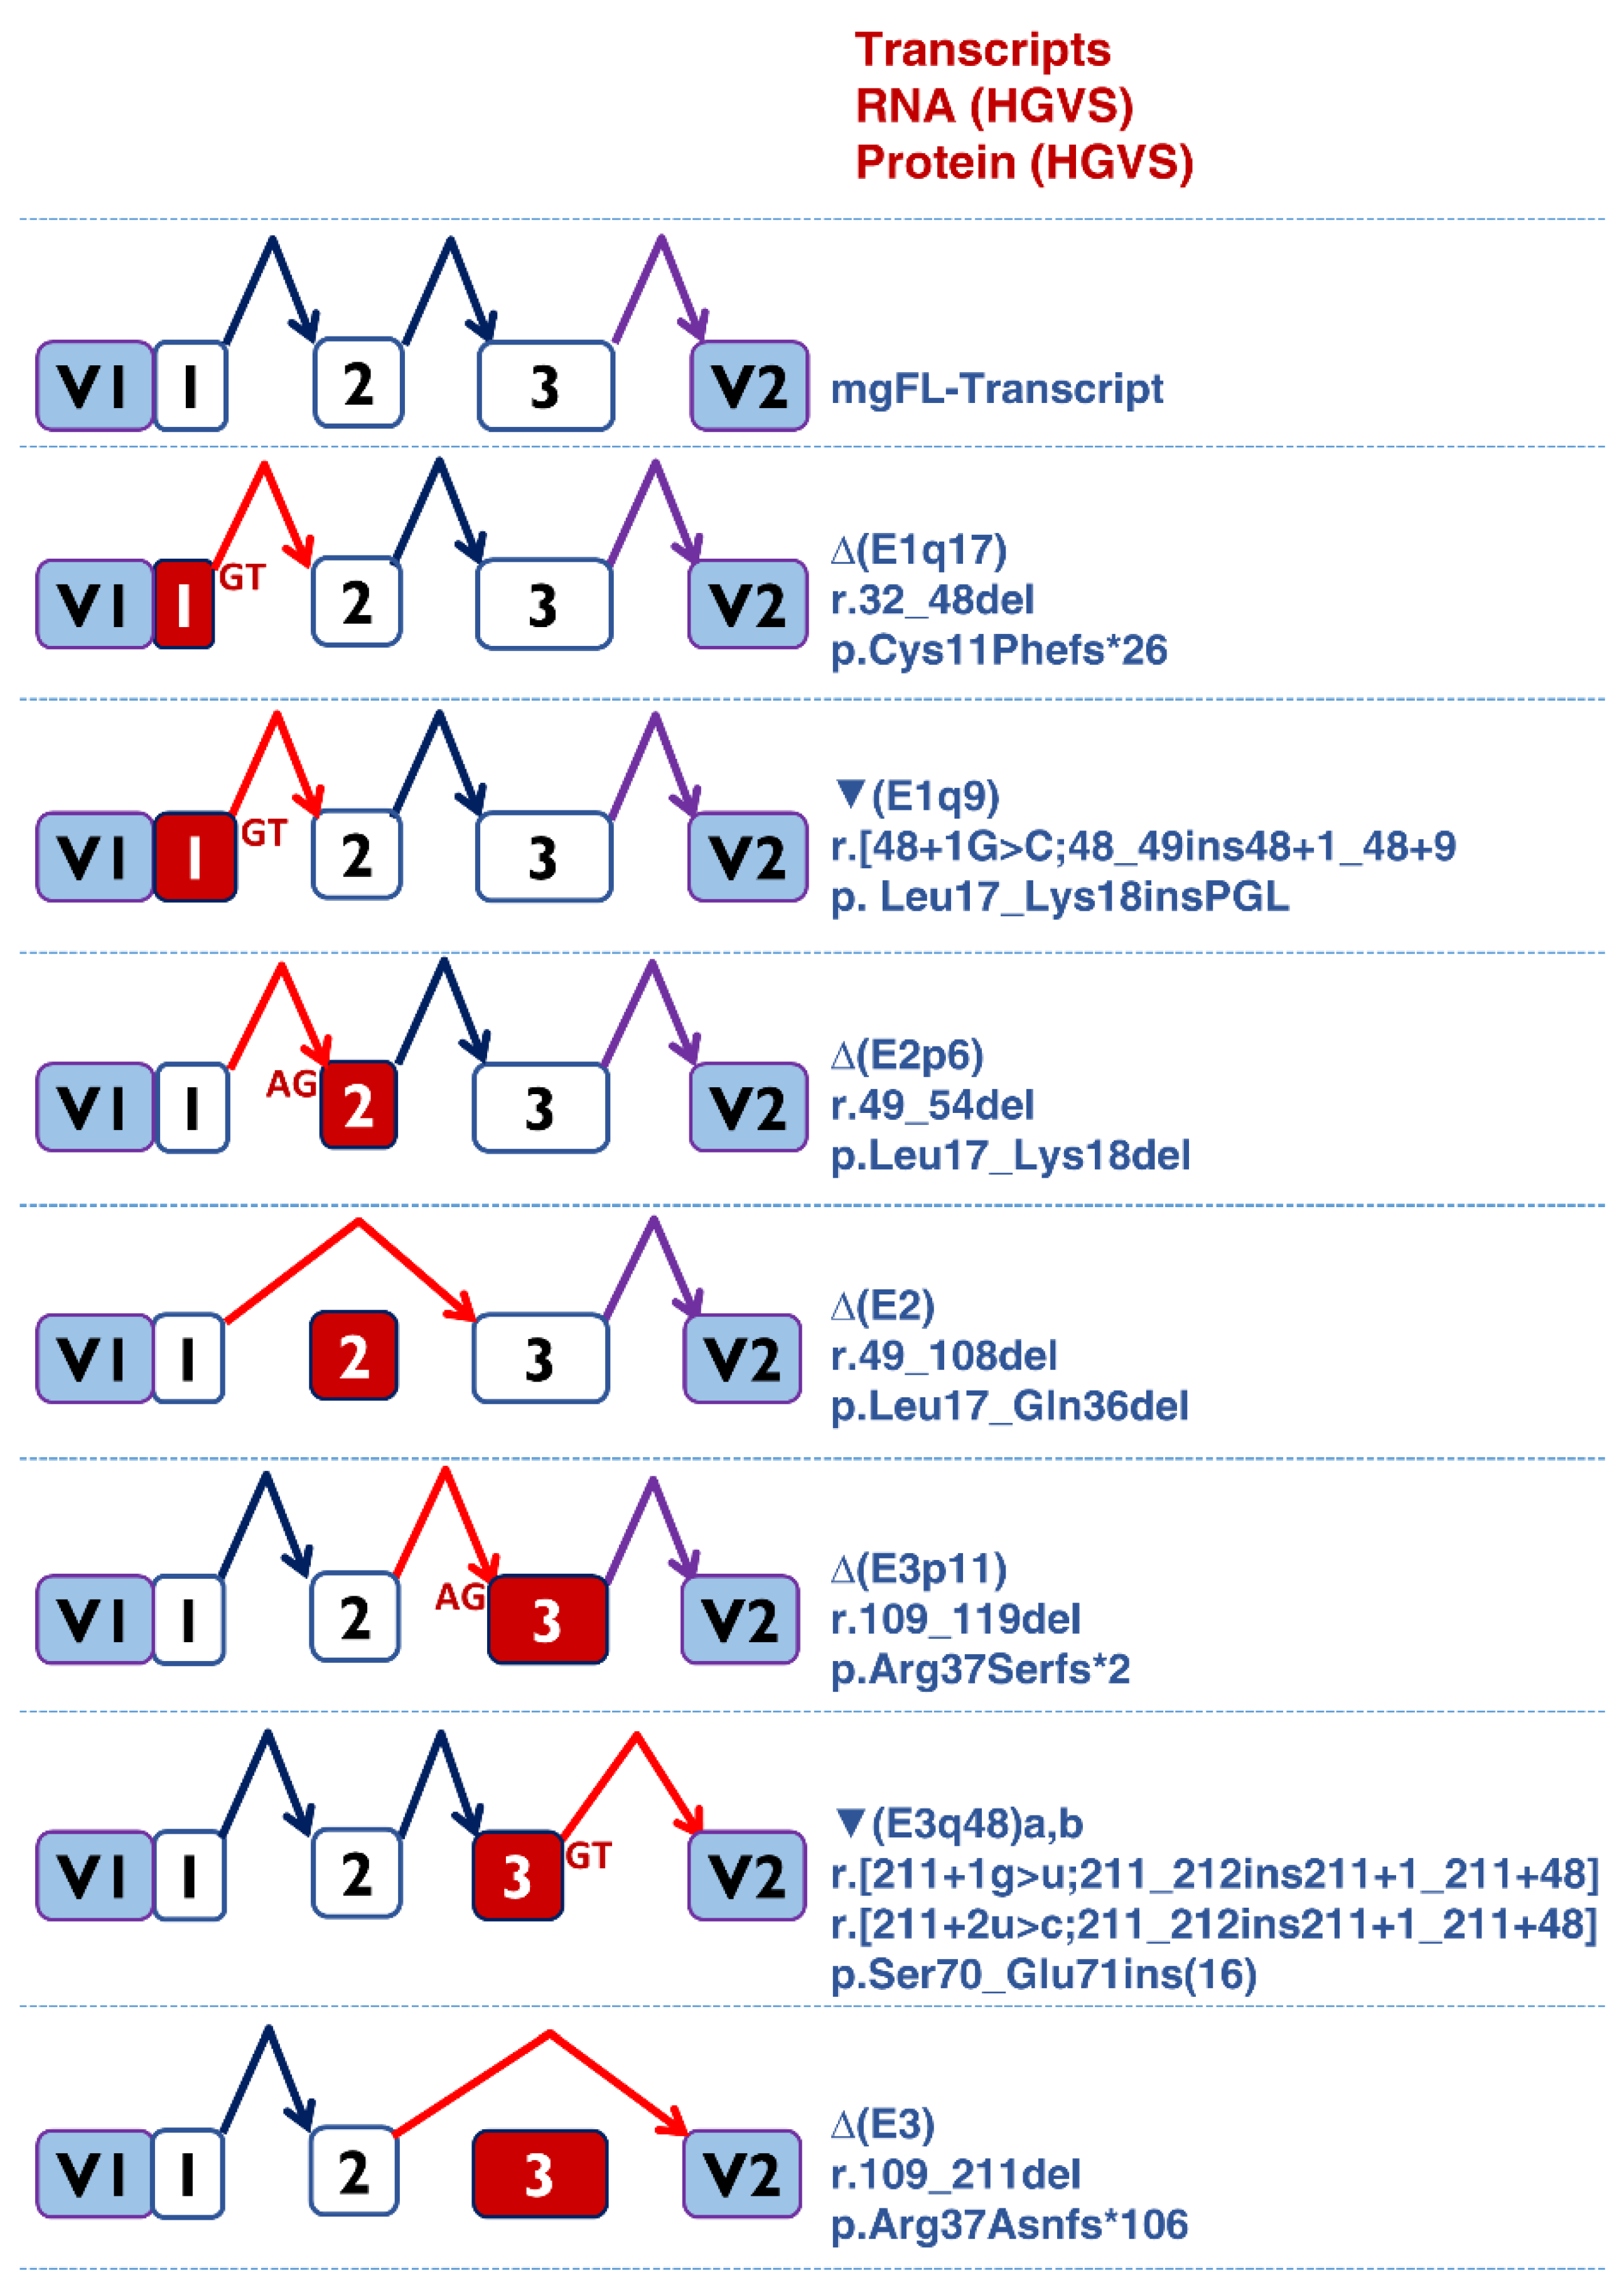
3.2. Minigene Splicing Assays of Candidate Variants

| PALB2 VARIANTS 1 | # ClinVar Records 2 | EXON/INTRON | MES wt | MES m ut | MES Score Change 3 | Cryptic/De novo Splice Sites 4 |
|---|---|---|---|---|---|---|
| c.46A > G | 1 | Exon 1 | 5.74 | 4.05 | −29.4% | |
| c.48 + 1del | 1 | IVS1 | 5.74 | −12.45 | −316.9% | |
| c.48 + 1G > C | 3 | IVS1 | 5.74 | −2.53 | −144.1% | |
| c.48 + 1G > T | 1 | IVS1 | 5.74 | −2.76 | −148.1% | |
| c.48 + 2T > G | 1 | IVS1 | 5.74 | −1.9 | −133.1% | |
| c.48 + 5C > T | 3 | IVS1 | 5.74 | 4.05 | −29.4% | |
| c.48 + 6G > C | 1 | IVS1 | 5.74 | 5.96 | +3.8% | |
| c.49-2del | 1 | IVS1 | 9.28 | 1.16 | −87.5% | 3’SS: 5.47 26 nt upstream 3′SS: 8.65, 6 nt downstream |
| c.49-1del | 1 | IVS1 | 9.28 | −7.59 | −181.8% | 3’SS: 5.47 26 nt upstream 3′SS: 8.76, 6 nt downstream |
| c.49-1G > A | 1 | IVS1 | 9.28 | 0.53 | −94.3% | 3’SS: 5.47 26 nt upstream 3′SS: 7.53, 6 nt downstream |
| c.50T > G | 2 | Exon 2 | 9.28 | 9.02 | −2.8% | 3’SS: 5.47 26 nt upstream |
| c.50dup | 1 | Exon 2 | 9.28 | 9.25 | −0.3% | 3’SS: 5.47 26 nt upstream |
| c.106C > T | 4 | Exon 2 | 10.86 | 9.66 | −11% | de novo 5’SS: 3.81 4 nt downstream |
| c.108G > A | 1 | Exon 2 | 10.86 | 10.08 | −7.2% | |
| c.108 + 1_108 + 2insC | 1 | IVS2 | 10.86 | −4.16 | −138.3% | |
| c.108 + 4A > G | 3 | IVS2 | 10.86 | 10.28 | -5.3% | |
| c.108 + 5G > A | 1 | IVS2 | 10.86 | 8.76 | −19.3% | |
| c.108 + 6T > C | 1 | IVS2 | 10.86 | 9.88 | –9% | |
| c.109-2A > C | 3 | IVS2 | 10.06 | 2.02 | −79.9% | 3′SS: 5.47, 11 nt downstream |
| c.109C > G | 2 | Exon 3 | 10.06 | 11.86 | +11.8% | |
| c.109C > T | 5 | Exon 3 | 10.06 | 9.82 | −2.4% | |
| c.109C > A | 7 | Exon3 | 10.06 | 10.18 | +1.2% | |
| c.110G > T | 2 | Exon 3 | 10.06 | 9.69 | −3.7% | |
| c.110G > A | 9 | Exon 3 | 10.06 | 9.64 | −4.2% | |
| c.111T > C | 3 | Exon 3 | 10.06 | 10.3 | +2.4% | |
| c.210A > G | 2 | Exon 3 | 8.76 | 6.15 | −29.8% | 5′SS: 7.88, 48 nt downstream |
| c.210A > C | 1 | Exon 3 | 8.76 | 6.89 | −21.3% | 5′SS: 7.88, 48 nt downstream |
| c.211 + 1G > T | 1 | IVS3 | 8.76 | 0.26 | –97.0% | 5′SS: 7.88, 48 nt downstream |
| c.211 + 2T > C | 1 | IVS3 | 8.76 | 1.01 | −88.5% | 5′SS: 7.88, 48 nt downstream |
| c.211 + 4A > G | 1 | IVS3 | 8.76 | 7.25 | −17.2% | 5′SS: 7.88, 48 nt downstream |
| c.211 + 6T > A | 1 | IVS3 | 8.76 | 8.59 | −1.9% | 5′SS: 7.88, 48 nt downstream |
| PALB2 Variants 1 | SpliceAI 2 | mgPALB2 Read-out (>10%) | Experimental Data in RNA from Carriers | |||||
|---|---|---|---|---|---|---|---|---|
| AL (>20%) | DL (>20%) | AG (>20%) | DG (>20%) | Predicted Splicing Outcome | ||||
| c.46A > G | - | - | - | 0.27 (+11) | - | mgFL (92.5%); ∆(E1q17) (7.5%) | Normal [45] | |
| c.48 + 1del | - | 0.94 (−2) | - | 0.25 (−171) | ∆(E1q169) | ∆(E1q17) (100%) | ||
| c.48 + 1G > C | - | 0.94 (−1) | - | 0.45 (+8) | ▼(E1q9) | ∆(E1q17) (90.8%)/▼(E1q9) (9.2%) | ||
| c.48 + 1G > T | - | 0.94 (−1) | - | 0.30 (+8) | ▼(E1q9) | ∆(E1q17) (100%) | ||
| c.48 + 2 T > G | - | 0.94 (−2) | - | - | - | ∆(E1q17) (100%) | ||
| c.48 + 5C > T | - | - | - | - | - | FL (100%) | ||
| c.49-2del | 0.98 (+1) | - | 0.74 (+7) | - | ∆(E2p6) | ∆(E2p6) (100%) | ||
| c.49-1del | 0.98 (+1) | - | 0.79 (+6) | - | ∆(E2p6) | ∆(E2p6) (100%) | ||
| c.49-1G > A | 0.98 (+1) | - | 0.65 (+7) | - | ∆(E2p6) | ∆(E2p6) (100%) | ∆(E2p6) [43] | |
| c.108 + 1_108 + 2insC | 0.96 (−61) | 0.99 (−2) | - | - | ∆(E2) | ∆(E2) (100%) | ||
| c.108 + 5G > A | - | - | - | - | - | FL (100%) | ||
| c.109-2A > C | 1 (+2) | 0.33 (+104) | 0.55(+13) | - | ∆(E3p11) | ∆(E3) | ∆(E3p11) (85%)/∆(E3) (15%) | |
| c.210A > G | - | - | - | 0.25 (+49) | - | FL (100%) | ||
| c.210A > C | - | - | - | 0.28(+49) | - | FL (100%) | ||
| c.211 + 1G > T | 0.42 (−103) | 1 (−1) | - | 0.47 (+47) | ▼(E3q48) | ∆(E3) | ∆(E3) (73.3%)/▼(E3q48a) (26.7%) | |
| c.211 + 2T > C | 0.32 (−104) | 0.99 (−2) | - | 0.59 (+46) | ▼(E3q48) | ∆(E3) | ∆(E3) (48.1%)/▼(E3q48b) (51.9%) | |
| Variant (HGVS) 1 | Bioinformatics Summary (MES) 2 | Canonical Transcript | PTC-Transcripts 3 | In-Frame Transcripts 4 |
|---|---|---|---|---|
| Wild type mgPB2_ex1–3 | 100% | |||
| c.46A > G | (↓) 5′SS (5.74→ 4.05) | 92.5% ± 0.1% | ∆(E1q17) (7.5% ± 0.1%) | |
| c.48 + 1del | (−) 5′SS (5.74→ −12.45) | - | ∆(E1q17) (100%) | |
| c.48 + 1G > C | (−) 5′SS (5.74→ −2.53) | - | ∆(E1q17) (90.8% ± 0.6%) | ▼(E1q9) (9.2% ± 0.6%) |
| c.48 + 1G > T | (−) 5′SS (5.74→ -2.76) | - | ∆(E1q17) (100%) | |
| c.48 + 2T > G | (−) 5′SS (5.74→ −1.9) | - | ∆(E1q17) (100%) | |
| c.48 + 5C > T | (↓) 5′SS (5.74→ 4.05) | 100% | ||
| c.49-2del | (−) 3′SS (9.28→1.16) (+) 3′SS (8.65) 6 nt downstream | - | ∆(E2p6) (100%) | |
| c.49-1del | (−) 3′SS (9.28→ −7.59) (+) 3′SS (8.76) 6 nt downstream | - | ∆(E2p6) (100%) | |
| c.49-1G > A | (−) 3′SS (9.28→0.53) (+) 3′SS (7.53) 6 nt downstream | - | ∆(E2p6) (100%) | |
| c.108 + 1_108 + 2insC | (-) 5′SS (10.86→ −4.16) | - | ∆(E2) (100%) | |
| c.108 + 5G > A | (↓) 5′SS (10.86→8.76) | 100% | ||
| c.109-2A > C | (−) 5′SS (10.06→2.02) (+)3′SS (5.47) 11 nt downstream | - | ∆(E3p11) (85% ± 0.5%) ∆(E3) (15% ± 0.5%) | |
| c.210A > G | (↓) 5′SS (8.76→6.15) | 100% | ||
| c.210A > C | (↓) 5′SS (8.76→6.89) | 100% | ||
| c.211 + 1G > T | (↓) 3′SS (8.76→ 0.26) | - | ∆(E3) (73.3% ± 0.6%) | ▼(E3q48a) (26.7% ± 0.6%) |
| c.211 + 2T > C | (−) 3′SS (8.76→1.01) | - | ∆(E3) (48.1% ± 7.4%) | ▼(E3q48b) (51.9% ± 7.4%) |


3.3. ACMG/AMP-Based Interpretation of Variants
4. Conclusions
Author Contributions
Funding
Institutional Review Board Statement
Informed Consent Statement
Data Availability Statement
Conflicts of Interest
References
- Nielsen, F.C.; van Overeem Hansen, T.; Sørensen, C.S. Hereditary breast and ovarian cancer: New genes in confined pathways. Nat. Rev. Cancer 2016, 16, 599–612. [Google Scholar] [CrossRef] [PubMed]
- Gerhardus, A.; Schleberger, H.; Schlegelberger, B.; Gadzicki, D. Diagnostic accuracy of methods for the detection of BRCA1 and BRCA2 mutations: A systematic review. Eur. J. Hum. Genet. 2007, 15, 619–627. [Google Scholar]
- Velasco, E.; Infante, M.; Durán, M.; Esteban-Cardeñosa, E.; Lastra, E.; García-Girón, C.; Miner, C.; Duran, M.; Esteban-Cardenosa, E.; Lastra, E.; et al. Rapid mutation detection in complex genes by heteroduplex analysis with capillary array electrophoresis. Electrophoresis 2005, 26, 2539–2552. [Google Scholar] [CrossRef] [PubMed]
- Dorling, L.; Carvalho, S.; Allen, J.; González-Neira, A.; Luccarini, C.; Wahlström, C.; Pooley, K.A.; Parsons, M.T.; Fortuno, C.; Wang, Q.; et al. Breast Cancer Risk Genes — Association Analysis in More than 113,000 Women. N. Engl. J. Med. 2021, 384, 428–439. [Google Scholar]
- Hu, C.; Hart, S.N.; Gnanaolivu, R.; Huang, H.; Lee, K.Y.; Na, J.; Gao, C.; Lilyquist, J.; Yadav, S.; Boddicker, N.J.; et al. A Population-Based Study of Genes Previously Implicated in Breast Cancer. N. Engl. J. Med. 2021, 384, 440–451. [Google Scholar] [CrossRef]
- Narod, S.A. Which Genes for Hereditary Breast Cancer? N. Engl. J. Med. 2021, 384, 471–473. [Google Scholar]
- Reid, S.; Schindler, D.; Hanenberg, H.; Barker, K.; Hanks, S.; Kalb, R.; Neveling, K.; Kelly, P.; Seal, S.; Freund, M.; et al. Biallelic mutations in PALB2 cause Fanconi anemia subtype FA-N and predispose to childhood cancer. Nat. Genet. 2007, 39, 162–164. [Google Scholar] [CrossRef]
- Zhao, W.; Wiese, C.; Kwon, Y.; Hromas, R.; Sung, P. The BRCA tumor suppressor network in chromosome damage repair by homologous recombination. Annu. Rev. Biochem. 2019, 88, 221–245. [Google Scholar] [CrossRef]
- Nepomuceno, T.C.; De Gregoriis, G.; de Oliveira, F.M.B.; Suarez-Kurtz, G.; Monteiro, A.N.; Carvalho, M.A. The role of PALB2 in the DNA damage response and cancer predisposition. Int. J. Mol. Sci. 2017, 18, 1886. [Google Scholar] [CrossRef]
- Rahman, N.; Seal, S.; Thompson, D.; Kelly, P.; Renwick, A.; Elliott, A.; Reid, S.; Spanova, K.; Barfoot, R.; Chagtai, T.; et al. PALB2, which encodes a BRCA2-interacting protein, is a breast cancer susceptibility gene. Nat. Genet. 2007, 39, 165–167. [Google Scholar] [CrossRef]
- Antoniou, A.C.; Foulkes, W.D.; Tischkowitz, M. Breast cancer risk in women with PALB2 mutations in different populations. Lancet Oncol. 2015, 16, e375. [Google Scholar] [CrossRef]
- Yang, X.; Leslie, G.; Doroszuk, A.; Schneider, S.; Allen, J.; Decker, B.; Dunning, A.M.; Redman, J.; Scarth, J.; Plaskocinska, I.; et al. Cancer risks associated with germline PALB2 pathogenic variants: An international study of 524 families. J. Clin. Oncol. 2020, 38, 674–685. [Google Scholar] [CrossRef]
- Eccles, D.M.; Mitchell, G.; Monteiro, A.N.A.; Schmutzler, R.; Couch, F.J.; Spurdle, A.B.; Gómez-García, E.B. ENIGMA Clinical Working Group BRCA1 and BRCA2 genetic testing—pitfalls and recommendations for managing variants of uncertain clinical significance. Ann. Oncol. 2015, 26, 2057–2065. [Google Scholar] [CrossRef]
- Radice, P.; de Summa, S.; Caleca, L.; Tommasi, S. Unclassified variants in BRCA genes: Guidelines for interpretation. Ann. Oncol. 2011, 22, i18–i23. [Google Scholar] [CrossRef]
- De Vooght, K.M.K.; Van Wijk, R.; Van Solinge, W.W. Management of gene promoter mutations in molecular diagnostics. Clin. Chem. 2009, 55, 698–708. [Google Scholar] [CrossRef]
- Fraile-Bethencourt, E.; Valenzuela-Palomo, A.; Díez-Gómez, B.; Infante, M.; Durán, M.; Marcos, G.; Lastra, E.; Gómez-Barrero, S.; Velasco, E.A. Genetic dissection of the BRCA2 promoter and transcriptional impact of DNA variants. Breast Cancer Res. Treat. 2018, 171, 53–63. [Google Scholar] [CrossRef]
- Buratti, E.; Baralle, M.; Baralle, F.E. Defective splicing, disease and therapy: Searching for master checkpoints in exon definition. Nucleic Acids Res. 2006, 34, 3494–3510. [Google Scholar] [CrossRef]
- Manning, K.S.; Cooper, T.A. The roles of RNA processing in translating genotype to phenotype. Nat. Rev. Mol. Cell Biol. 2017, 18, 102–114. [Google Scholar] [CrossRef]
- Wang, G.-S.S.; Cooper, T.A. Splicing in disease: Disruption of the splicing code and the decoding machinery. Nat. Rev. Genet. 2007, 8, 749–761. [Google Scholar] [CrossRef]
- Baralle, D.; Lucassen, A.; Buratti, E. Missed threads. The impact of pre-mRNA splicing defects on clinical practice. EMBO Rep. 2009, 10, 810–816. [Google Scholar] [CrossRef]
- Scotti, M.M.; Swanson, M.S. RNA mis-splicing in disease. Nat. Rev. Genet. 2016, 17, 19–32. [Google Scholar] [CrossRef]
- Lopez-Bigas, N.; Audit, B.; Ouzounis, C.; Parra, G.; Guigo, R.; López-Bigas, N.; Audit, B.; Ouzounis, C.; Parra, G.; Guigó, R. Are splicing mutations the most frequent cause of hereditary disease? FEBS Lett. 2005, 579, 1900–1903. [Google Scholar] [CrossRef]
- Rhine, C.L.; Cygan, K.J.; Soemedi, R.; Maguire, S.; Murray, M.F.; Monaghan, S.F.; Fairbrother, W.G. Hereditary cancer genes are highly susceptible to splicing mutations. PLoS Genet. 2018, 14, e1007231. [Google Scholar] [CrossRef] [Green Version]
- Sanz, D.J.; Acedo, A.; Infante, M.; Durán, M.; Pérez-Cabornero, L.; Esteban-Cardeñosa, E.; Lastra, E.; Pagani, F.; Miner, C.; Velasco, E.A. A high proportion of DNA variants of BRCA1 and BRCA2 is associated with aberrant splicing in breast/ovarian cancer patients. Clin. Cancer Res. 2010, 16, 1957–1967. [Google Scholar] [CrossRef]
- Fraile-Bethencourt, E.; Díez-Gómez, B.; Velásquez-Zapata, V.; Acedo, A.; Sanz, D.J.; Velasco, E.A. Functional classification of DNA variants by hybrid minigenes: Identification of 30 spliceogenic variants of BRCA2 exons 17 and 18. PLoS Genet. 2017, 13, e1006691. [Google Scholar] [CrossRef]
- Sanoguera-Miralles, L.; Valenzuela-Palomo, A.; Bueno-Martínez, E.; Llovet, P.; Díez-Gómez, B.; Caloca, M.J.; Pérez-Segura, P.; Fraile-Bethencourt, E.; Colmena, M.; Carvalho, S.; et al. Comprehensive Functional Characterization and Clinical Interpretation of 20 Splice-Site Variants of the RAD51C Gene. Cancers 2020, 12, 3771. [Google Scholar] [CrossRef]
- Bueno-Martínez, E.; Sanoguera-Miralles, L.; Valenzuela-Palomo, A.; Lorca, V.; Gómez-Sanz, A.; Carvalho, S.; Allen, J.; Infante, M.; Pérez-Segura, P.; Lázaro, C.; et al. Rad51d aberrant splicing in breast cancer: Identification of splicing regulatory elements and minigene-based evaluation of 53 dna variants. Cancers 2021, 13, 2845. [Google Scholar] [CrossRef]
- Valenzuela-Palomo, A.; Bueno-Martínez, E.; Sanoguera-Miralles, L.; Lorca, V.; Fraile-Bethencourt, E.; Esteban-Sánchez, A.; Gómez-Barrero, S.; Carvalho, S.; Allen, J.; García-Álvarez, A.; et al. Splicing predictions, minigene analyses, and ACMG-AMP clinical classification of 42 germline PALB2 splice-site variants. J. Pathol. 2022, 256, 321–334. [Google Scholar] [CrossRef]
- Bueno-Martínez, E.; Sanoguera-Miralles, L.; Valenzuela-Palomo, A.; Esteban-Sánchez, A.; Lorca, V.; Llinares-Burguet, I.; Allen, J.; García-Álvarez, A.; Pérez-Segura, P.; Durán, M.; et al. Minigene-based splicing analysis and ACMG/AMP-based tentative classification of 56 ATM variants. J. Pathol. 2022, 258, 83–101. [Google Scholar] [CrossRef]
- Lopez-Perolio, I.; Leman, R.; Behar, R.; Lattimore, V.; Pearson, J.F.; Castéra, L.; Martins, A.; Vaur, D.; Goardon, N.; Davy, G.; et al. Alternative splicing and ACMG-AMP-2015-based classification of PALB2 genetic variants: An ENIGMA report. J. Med. Genet. 2019, 56, 453–460. [Google Scholar] [CrossRef]
- Fraile-Bethencourt, E.; Valenzuela-Palomo, A.; Díez-Gómez, B.; Caloca, M.J.; Gómez-Barrero, S.; Velasco, E.A. Minigene Splicing Assays Identify 12 Spliceogenic Variants of BRCA2 Exons 14 and 15. Front. Genet. 2019, 10, 503. [Google Scholar] [CrossRef] [PubMed]
- Yeo, G.; Burge, C.B. Maximum entropy modeling of short sequence motifs with applications to RNA splicing signals. J. Comput. Biol. 2004, 11, 377–394. [Google Scholar] [CrossRef] [PubMed]
- Houdayer, C.; Caux-Moncoutier, V.; Krieger, S.; Barrois, M.; Bonnet, F.; Bourdon, V.; Bronner, M.; Buisson, M.; Coulet, F.; Gaildrat, P.; et al. Guidelines for splicing analysis in molecular diagnosis derived from a set of 327 combined in silico/in vitro studies on BRCA1 and BRCA2 variants. Hum. Mutat. 2012, 33, 1228–1238. [Google Scholar] [CrossRef] [PubMed]
- Moles-Fernández, A.; Duran-Lozano, L.; Montalban, G.; Bonache, S.; López-Perolio, I.; Menéndez, M.; Santamariña, M.; Behar, R.; Blanco, A.; Carrasco, E.; et al. Computational Tools for Splicing Defect Prediction in Breast/Ovarian Cancer Genes: How Efficient Are They at Predicting RNA Alterations? Front. Genet. 2018, 9, 366. [Google Scholar] [CrossRef]
- Jaganathan, K.; Kyriazopoulou Panagiotopoulou, S.; McRae, J.F.; Darbandi, S.F.; Knowles, D.; Li, Y.I.; Kosmicki, J.A.; Arbelaez, J.; Cui, W.; Schwartz, G.B.; et al. Predicting Splicing from Primary Sequence with Deep Learning. Cell 2019, 176, 535–548.e24. [Google Scholar] [CrossRef]
- De Garibay, G.R.; Acedo, A.; García-Casado, Z.; Gutiérrez-Enríquez, S.; Tosar, A.; Romero, A.; Garre, P.; Llort, G.; Thomassen, M.; Díez, O.; et al. Capillary Electrophoresis Analysis of Conventional Splicing Assays: IARC Analytical and Clinical Classification of 31 BRCA2 Genetic Variants. Hum. Mutat. 2014, 35, 53–57. [Google Scholar] [CrossRef]
- Acedo, A.; Hernández-Moro, C.; Curiel-García, Á.; Díez-Gómez, B.; Velasco, E.A. Functional classification of BRCA2 DNA variants by splicing assays in a large minigene with 9 exons. Hum. Mutat. 2015, 36, 210–221. [Google Scholar] [CrossRef]
- Fraile-Bethencourt, E.; Valenzuela-Palomo, A.; Díez-Gómez, B.; Goina, E.; Acedo, A.; Buratti, E.; Velasco, E.A. Mis-splicing in breast cancer: Identification of pathogenic BRCA2 variants by systematic minigene assays. J. Pathol. 2019, 248, 409–420. [Google Scholar] [CrossRef]
- Tavtigian, S.V.; Greenblatt, M.S.; Harrison, S.M.; Nussbaum, R.L.; Prabhu, S.A.; Boucher, K.M.; Biesecker, L.G. ClinGen Sequence Variant Interpretation Working Group (ClinGen SVI) Modeling the ACMG/AMP variant classification guidelines as a Bayesian classification framework. Genet. Med. 2018, 20, 1054–1060. [Google Scholar] [CrossRef]
- Tavtigian, S.V.; Harrison, S.M.; Boucher, K.M.; Biesecker, L.G. Fitting a naturally scaled point system to the ACMG/AMP variant classification guidelines. Hum. Mutat. 2020, 41, 1734–1737. [Google Scholar] [CrossRef]
- Sanoguera-Miralles, L.; Bueno-Martínez, E.; Valenzuela-Palomo, A.; Esteban-Sánchez, A.; Llinares-Burguet, I.; Pérez-Segura, P.; García-Álvarez, A.; de la Hoya, M.; Velasco-Sampedro, E.A. Minigene Splicing Assays Identify 20 Spliceogenic Variants of the Breast/Ovarian Cancer Susceptibility Gene RAD51C. Cancers 2022, 14, 2960. [Google Scholar] [CrossRef]
- Wilcox, E.H.; Sarmady, M.; Wulf, B.; Wright, M.W.; Rehm, H.L.; Biesecker, L.G.; Abou Tayoun, A.N. Evaluating the impact of in silico predictors on clinical variant classification. Genet. Med. 2022, 24, 924–930. [Google Scholar] [CrossRef]
- Tsaousis, G.N.; Papadopoulou, E.; Apessos, A.; Agiannitopoulos, K.; Pepe, G.; Kampouri, S.; Diamantopoulos, N.; Floros, T.; Iosifidou, R.; Katopodi, O.; et al. Analysis of hereditary cancer syndromes by using a panel of genes: Novel and multiple pathogenic mutations. BMC Cancer 2019, 19, 535. [Google Scholar] [CrossRef] [Green Version]
- Lykke-Andersen, S.; Jensen, T.H. Nonsense-mediated mRNA decay: An intricate machinery that shapes transcriptomes. Nat. Rev. Mol. Cell Biol. 2015, 16, 665–677. [Google Scholar] [CrossRef]
- Casadei, S.; Gulsuner, S.; Shirts, B.H.; Mandell, J.B.; Kortbawi, H.M.; Norquist, B.S.; Swisher, E.M.; Lee, M.K.; Goldberg, Y.; O’Connor, R.; et al. Characterization of splice-altering mutations in inherited predisposition to cancer. Proc. Natl. Acad. Sci. USA 2019, 116, 26798–26807. [Google Scholar] [CrossRef]
- Thanaraj, T.A.; Clark, F. Human GC-AG alternative intron isoforms with weak donor sites show enhanced consensus at acceptor exon positions. Nucleic Acids Res. 2001, 29, 2581–2593. [Google Scholar] [CrossRef]
- Parada, G.E.; Munita, R.; Cerda, C.A.; Gysling, K. A comprehensive survey of non-canonical splice sites in the human transcriptome. Nucleic Acids Res. 2014, 42, 10564–10578. [Google Scholar] [CrossRef]
- Lin, J.H.; Tang, X.Y.; Boulling, A.; Zou, W.B.; Masson, E.; Fichou, Y.; Raud, L.; Le Tertre, M.; Deng, S.J.; Berlivet, I.; et al. First estimate of the scale of canonical 5′ splice site GT>GC variants capable of generating wild-type transcripts. Hum. Mutat. 2019, 40, 1856–1873. [Google Scholar] [CrossRef]
- Song, F.; Li, M.; Liu, G.; Swapna, G.V.T.; Daigham, N.S.; Xia, B.; Montelione, G.T.; Bunting, S.F. Antiparallel Coiled-Coil Interactions Mediate the Homodimerization of the DNA Damage-Repair Protein PALB2. Biochemistry 2018, 57, 6581–6591. [Google Scholar] [CrossRef]
- Richards, S.; Aziz, N.; Bale, S.; Bick, D.; Das, S.; Gastier-Foster, J.; Grody, W.W.; Hegde, M.; Lyon, E.; Spector, E.; et al. Standards and guidelines for the interpretation of sequence variants: A joint consensus recommendation of the American College of Medical Genetics and Genomics and the Association for Molecular Pathology. Genet. Med. 2015, 17, 405–424. [Google Scholar] [CrossRef]
- Gailite, L.; Valenzuela-Palomo, A.; Sanoguera-Miralles, L.; Rots, D.; Kreile, M.; Velasco, E.A. UGT1A1 Variants c.864+5G>T and c.996+2_996+5del of a Crigler-Najjar Patient Induce Aberrant Splicing in Minigene Assays. Front. Genet. 2020, 11, 169. [Google Scholar] [CrossRef]
- Villate, O.; Ibarluzea, N.; Fraile-Bethencourt, E.; Valenzuela, A.; Velasco, E.A.; Grozeva, D.; Raymond, F.L.; Botella, M.P.; Tejada, M.-I. Functional Analyses of a Novel Splice Variant in the CHD7 Gene, Found by Next Generation Sequencing, Confirm Its Pathogenicity in a Spanish Patient and Diagnose Him with CHARGE Syndrome. Front. Genet. 2018, 9, 26–31. [Google Scholar] [CrossRef]
- Zhu, L.; Miao, B.; Dymerska, D.; Kuswik, M.; Bueno-Martínez, E.; Sanoguera-Miralles, L.; Velasco, E.A.; Paramasivam, N.; Schlesner, M.; Kumar, A.; et al. Germline Variants of CYBA and TRPM4 Predispose to Familial Colorectal Cancer. Cancers 2022, 14, 670. [Google Scholar] [CrossRef]

| Variant | Exon/Intron | Primers (5′→3′) |
|---|---|---|
| c.46A > G | Ex1 | CTGTGAGGAGAAGGAAGAGGTGCCGGGGGTGCGGGAAGGG |
| CCCTTCCCGCACCCCCGGCACCTCTTCCTTCTCCTCACAG | ||
| c.48 + 1del | IVS1 | AGCTGTGAGGAGAAGGAAAAGGGGCCGGGGGTGCGGGAAG |
| CTTCCCGCACCCCCGGCCCCTTTTCCTTCTCCTCACAGCT | ||
| c.48 + 1G > C | IVS1 | GCTGTGAGGAGAAGGAAAAGCTGCCGGGGGTGCGGGAAGG |
| CCTTCCCGCACCCCCGGCAGCTTTTCCTTCTCCTCACAGC | ||
| c.48 + 1G > T | IVS1 | TCAGCTGTGAGGAGAAGGAAAAGTTGCCGGGGGTGCGGGA |
| TCCCGCACCCCCGGCAACTTTTCCTTCTCCTCACAGCTGA | ||
| c.48 + 2T > G | IVS1 | CAGCTGTGAGGAGAAGGAAAAGTGCCGGGGGTGCGGGAAG |
| CTTCCCGCACCCCCGGCACTTTTCCTTCTCCTCACAGCTG | ||
| c.48 + 5C > T | IVS1 | GAGGAGAAGGAAAAGGTGCTGGGGGTGCGGGAAGGGCGGA |
| TCCGCCCTTCCCGCACCCCCAGCACCTTTTCCTTCTCCTC | ||
| c.49-2del | IVS1 | TGCCCAGTATTGTTGGTGTTTTTCTTCTTCCGTTAAAGGA |
| TCCTTTAACGGAAGAAGAAAAACACCAACAATACTGGGCA | ||
| c.49-1del | IVS1 | TGCCCAGTATTGTTGGTGTTTTTCTTCTTCCATTAAAGGA |
| TCCTTTAATGGAAGAAGAAAAACACCAACAATACTGGGCA | ||
| c.49-1G > A | IVS1 | TTCTTCCAATTAAAGGAGAAATTAGCATTCTTGAAAAGGG |
| CCCTTTTCAAGAATGCTAATTTCTCCTTTAATTGGAAGAA | ||
| c.108 + 1_108 + 2insC | IVS2 | CCTTCAGGCTAAGTGAATCGTATTCTCAAATTAAGGTGTT |
| AACACCTTAATTTGAGAATACGATTCACTTAGCCTGAAGG | ||
| c.108 + 5G > A | IVS2 | TAGCCCGCCTTCAGGTAAATGAATCGTATTCTCAAATTAA |
| TTAATTTGAGAATACGATTCATTTACCTGAAGGCGGGCTA | ||
| c.109-2A > C | IVS2 | TTTGTCTCCTCTCGCGTGCCCAAAGAGCTGAAAAGATTAA |
| TTAATCTTTTCAGCTCTTTGGGCACGCGAGAGGAGACAAA | ||
| c.210A> G | Ex3 | CCGCAGCTAAAACACTCGGGTAAATCTAGACCATTCACTT |
| AAGTGAATGGTCTAGATTTACCCGAGTGTTTTAGCTGCGG | ||
| c.210A > C | Ex3 | CGCAGCTAAAACACTCCGGTAAATCTAGACCATTCACTTA |
| TAAGTGAATGGTCTAGATTTACCGGAGTGTTTTAGCTGCG | ||
| c.211 + 1G > T | IVS3 | CCGCAGCTAAAACACTCAGTTAAATCTAGACCATTCACTT |
| AAGTGAATGGTCTAGATTTAACTGAGTGTTTTAGCTGCGG | ||
| c.211 + 2T > C | IVS3 | ACCGCAGCTAAAACACTCAGGCAAATCTAGACCATTCACT |
| AGTGAATGGTCTAGATTTGCCTGAGTGTTTTAGCTGCGGT |
| Variants | ClinVar 1 | ACMG-AMP 2 Classification | Splicing Predictive PVS1/PP3 3 | PVS1_O/BP7_O (mgPALB2 Readouts) 4 | PM2 5 |
|---|---|---|---|---|---|
| c.46A > G (p.Lys16Glu) | B | LB (−1) | PP3 | BP7_O_M (-2): 93% [BP7_O_M, FL] 6 + 7% [PVS1_O, ∆(E1q17)] | PM2_P (+1) |
| c.48 + 1del | LP | LP (+9) | PVS1 | PVS1_O (+8): 100% [PVS1_O, ∆(E1q17)] | PM2_P (+1) |
| c.48 + 1G > C | Conflicting | LP (+9) | PVS1 | PVS1_O (+8): 91% [PVS1_O, ∆(E1q17)]+ 9% [PVS1_O_M, ▼(E1q9)] | PM2_P (+1) |
| c.48 + 1G > T | P/LP | LP (+9) | PVS1 | PVS1_O (+8): 100% [PVS1_O, ∆(E1q17)] | PM2_P (+1) |
| c.48 + 2T > G | LP | LP (+9) | PVS1 | PVS1_O (+8): 100% [PVS1_O, ∆(E1q17)] | PM2_P (+1) |
| c.48 + 5C > T | Conflicting | LB (−3) | PP3 | BP7_O_S (-4): 100% [BP7_O_S, FL] 7 | PM2_P (+1) |
| c.49-2del | VUS | VUS (+3) | PVS1 | PVS1_O_M (+2): 100% [PVS1_O_M, ∆(E2p6)] | PM2_P (+1) |
| c.49-1del | P | VUS (+3) | PVS1 | PVS1_O_M (+2): 100% [PVS1_O_M, ∆(E2p6)] | PM2_P (+1) |
| c.49-1G > A | LP | VUS (+3) | PVS1 | PVS1_O_M (+2): 100% [PVS1_O_M, ∆(E2p6)] | PM2_P (+1) |
| c.108 + 1_108 + 2insC | LP | LP (+9) | PVS1 | PVS1_O (+8): 100% [PVS1_O, ∆(E2)] | PM2_P (+1) |
| c.108 + 5G > A | VUS | LB (−3) | PP3 | BP7_O_S (-4): 100% [BP7_O_S, FL] 7 | PM2_P (+1) |
| c.109-2A > C | LP | LP (+9) | PVS1 | PVS1_O (+8): 85% [PVS1_O, ∆(E3p11)] + 15% [PVS1_O, ∆(E3)] | PM2_P (+1) |
| c.210A > G (p.Ser70=) | Conflicting | LB (−3) | PP3 | BP7_O_S (-4): 100% [BP7_O_S, FL] 8 | PM2_P (+1) |
| c.210A > C (p.Ser70=) | LB | LB (−3) | PP3 | BP7_O_S (-4): 100% [BP7_O_S, FL] 8 | PM2_P (+1) |
| c.211 + 1G > T | P/LP | VUS (+2) | PVS1 | PVS1_O_P (+1): 73% [PVS1_O, ∆(E3)] + 27% [PVS1_O_P, ▼(E3q48a)] | PM2_P (+1) |
| c.211 + 2T > C | LP | VUS (+2) | PVS1 | PVS1_O_P (+1): 48% PVS1_O, ∆(E3)] + 52% [PVS1_O_P, ▼(E3q48b)] | PM2_P (+1) |
Publisher’s Note: MDPI stays neutral with regard to jurisdictional claims in published maps and institutional affiliations. |
© 2022 by the authors. Licensee MDPI, Basel, Switzerland. This article is an open access article distributed under the terms and conditions of the Creative Commons Attribution (CC BY) license (https://creativecommons.org/licenses/by/4.0/).
Share and Cite
Valenzuela-Palomo, A.; Sanoguera-Miralles, L.; Bueno-Martínez, E.; Esteban-Sánchez, A.; Llinares-Burguet, I.; García-Álvarez, A.; Pérez-Segura, P.; Gómez-Barrero, S.; de la Hoya, M.; Velasco-Sampedro, E.A. Splicing Analysis of 16 PALB2 ClinVar Variants by Minigene Assays: Identification of Six Likely Pathogenic Variants. Cancers 2022, 14, 4541. https://doi.org/10.3390/cancers14184541
Valenzuela-Palomo A, Sanoguera-Miralles L, Bueno-Martínez E, Esteban-Sánchez A, Llinares-Burguet I, García-Álvarez A, Pérez-Segura P, Gómez-Barrero S, de la Hoya M, Velasco-Sampedro EA. Splicing Analysis of 16 PALB2 ClinVar Variants by Minigene Assays: Identification of Six Likely Pathogenic Variants. Cancers. 2022; 14(18):4541. https://doi.org/10.3390/cancers14184541
Chicago/Turabian StyleValenzuela-Palomo, Alberto, Lara Sanoguera-Miralles, Elena Bueno-Martínez, Ada Esteban-Sánchez, Inés Llinares-Burguet, Alicia García-Álvarez, Pedro Pérez-Segura, Susana Gómez-Barrero, Miguel de la Hoya, and Eladio A. Velasco-Sampedro. 2022. "Splicing Analysis of 16 PALB2 ClinVar Variants by Minigene Assays: Identification of Six Likely Pathogenic Variants" Cancers 14, no. 18: 4541. https://doi.org/10.3390/cancers14184541