
Differential DNA Methylation of THOR and hTAPAS in the Regulation of hTERT and the Diagnosis of Cancer
 , , , and
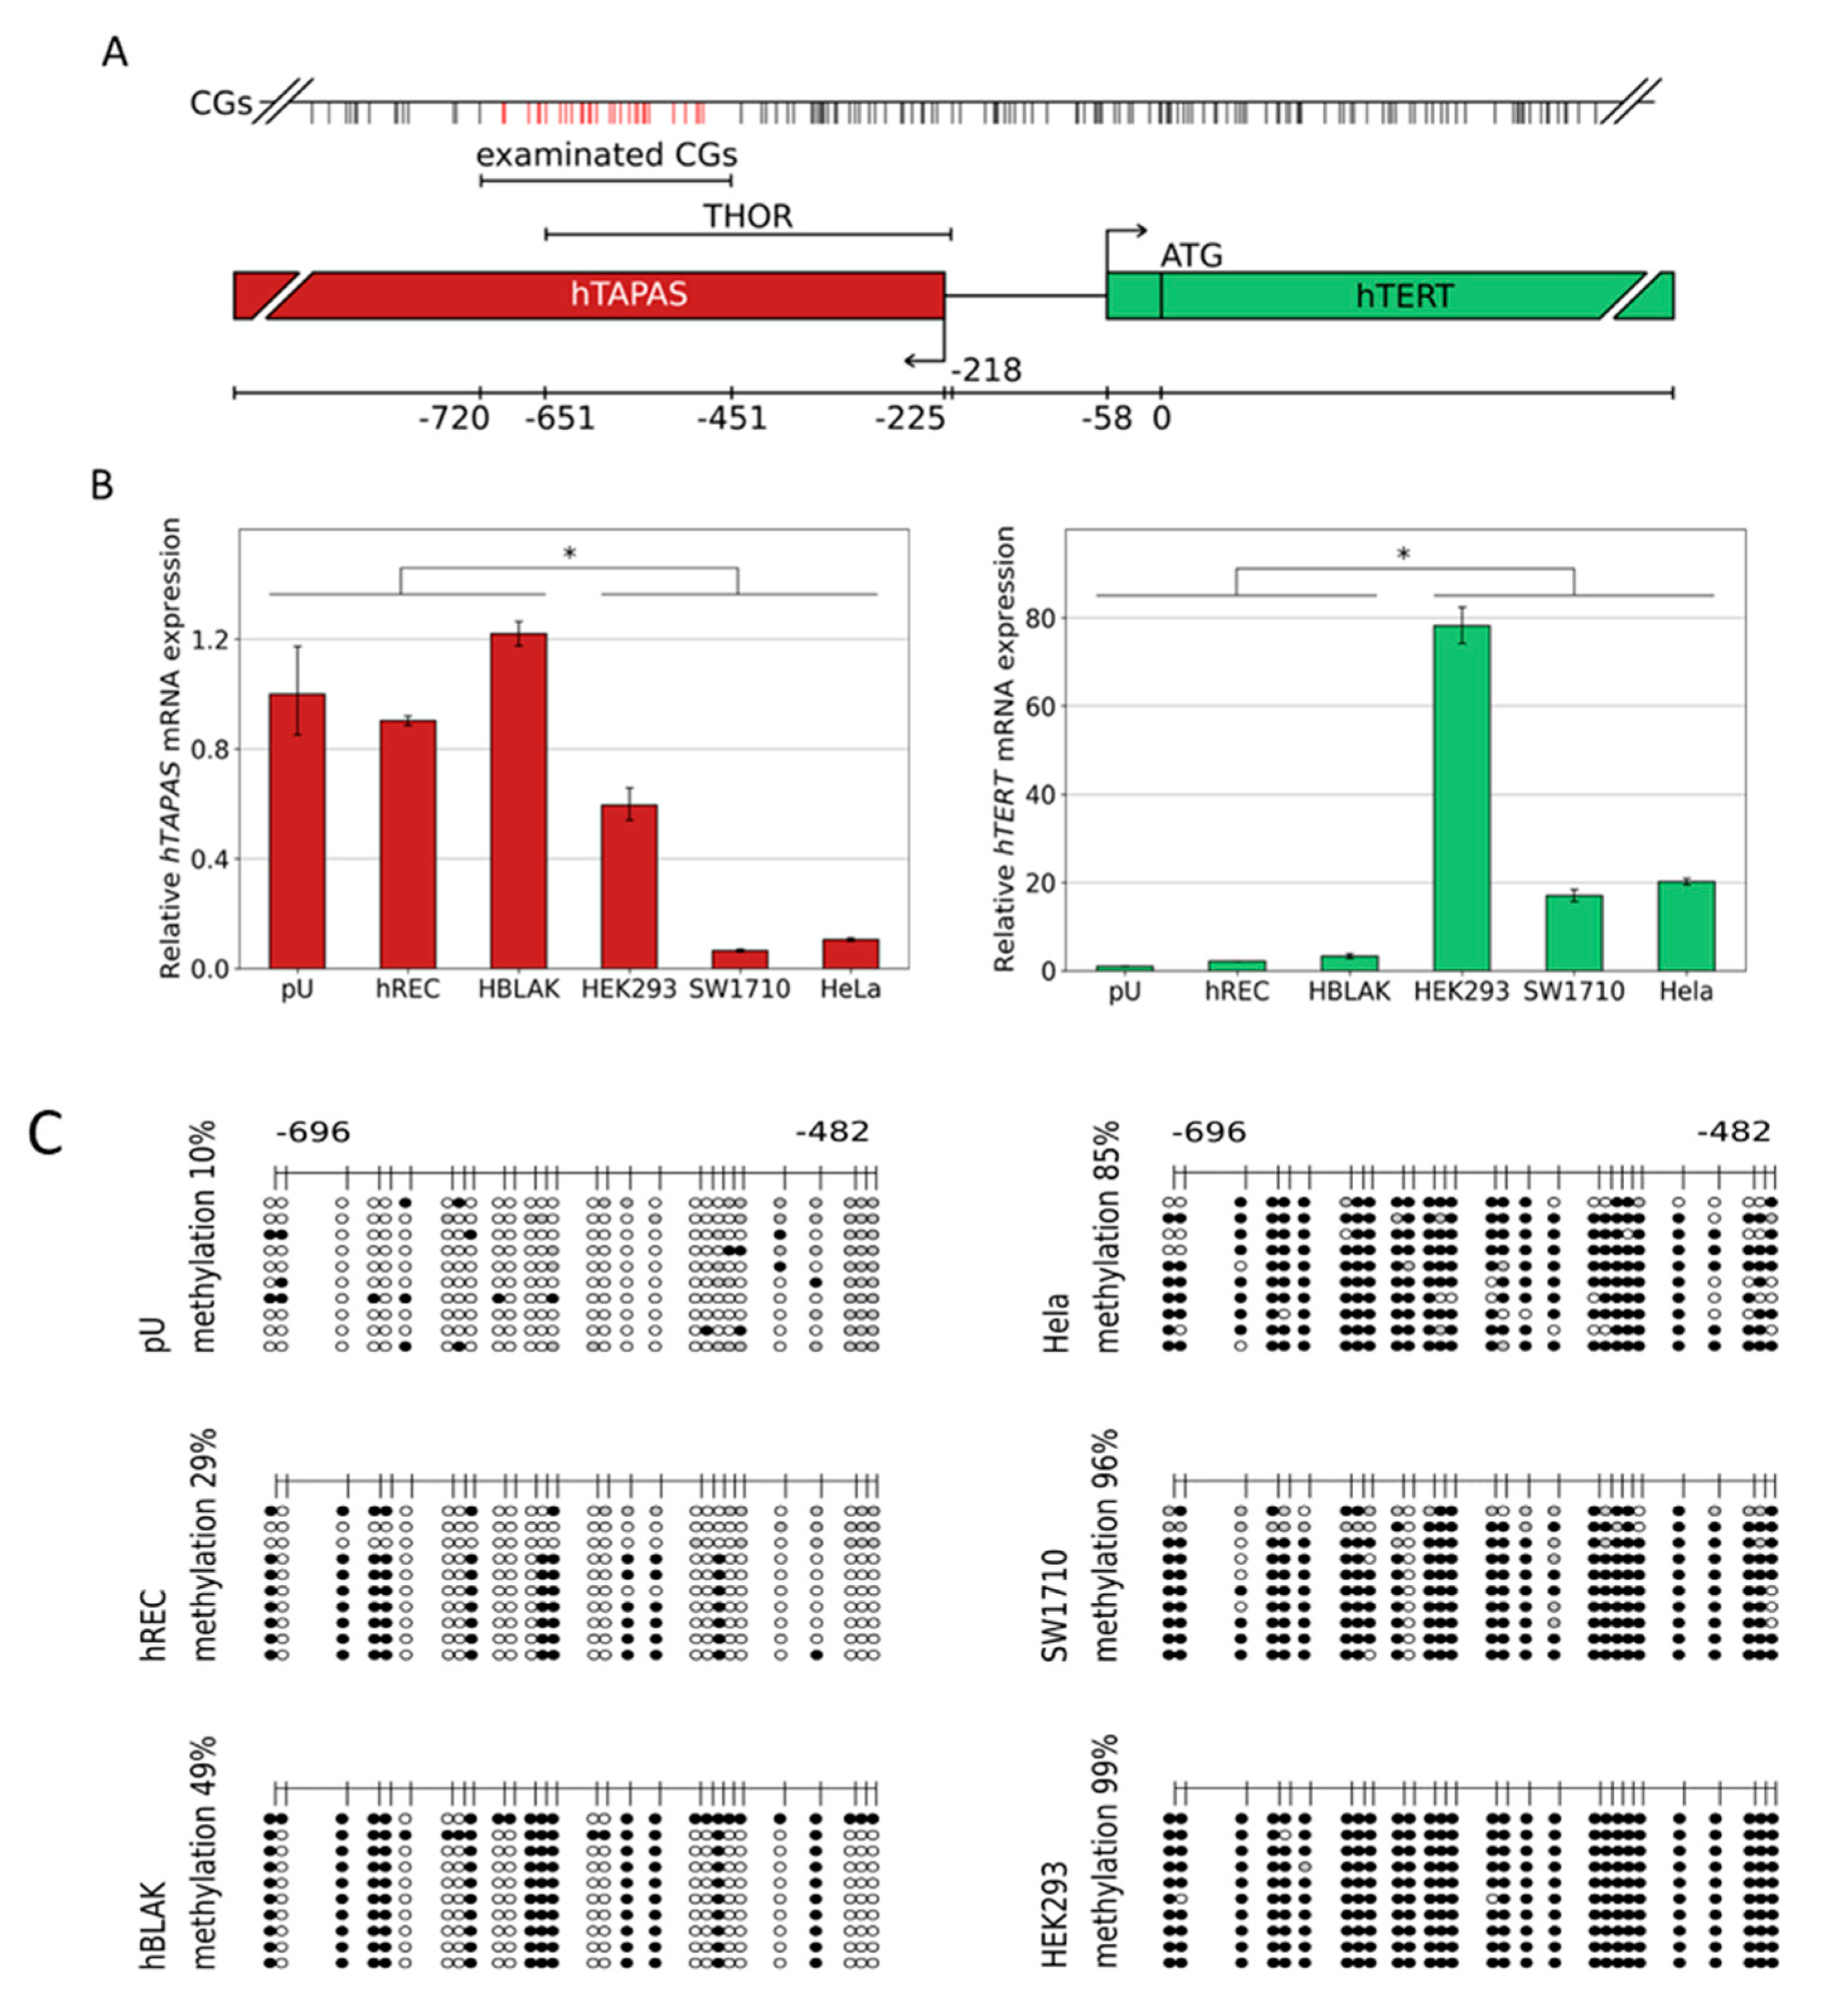
Abstract
:Simple Summary
Abstract
1. Introduction
2. Material and Methods
2.1. Cell Lines and Cell Cultures
2.2. Preparation of DNA from Formalin-Fixed, Paraffin-Embedded (FFPE) Tissue Samples and Cell Lines and Preparation of DNA Methylation Arrays
2.3. RNA Preparation, cDNA Synthesis, and Real-Time PCR
2.4. Bisulfite Genomic Sequencing
2.5. Relative Quantification of THOR Methylation
3. Results
3.1. DNA Methylation of the CpG Island Direct Upstream of the HTERT Core Promoter Region Correlates with hTAPASRepression and HTERTExpression
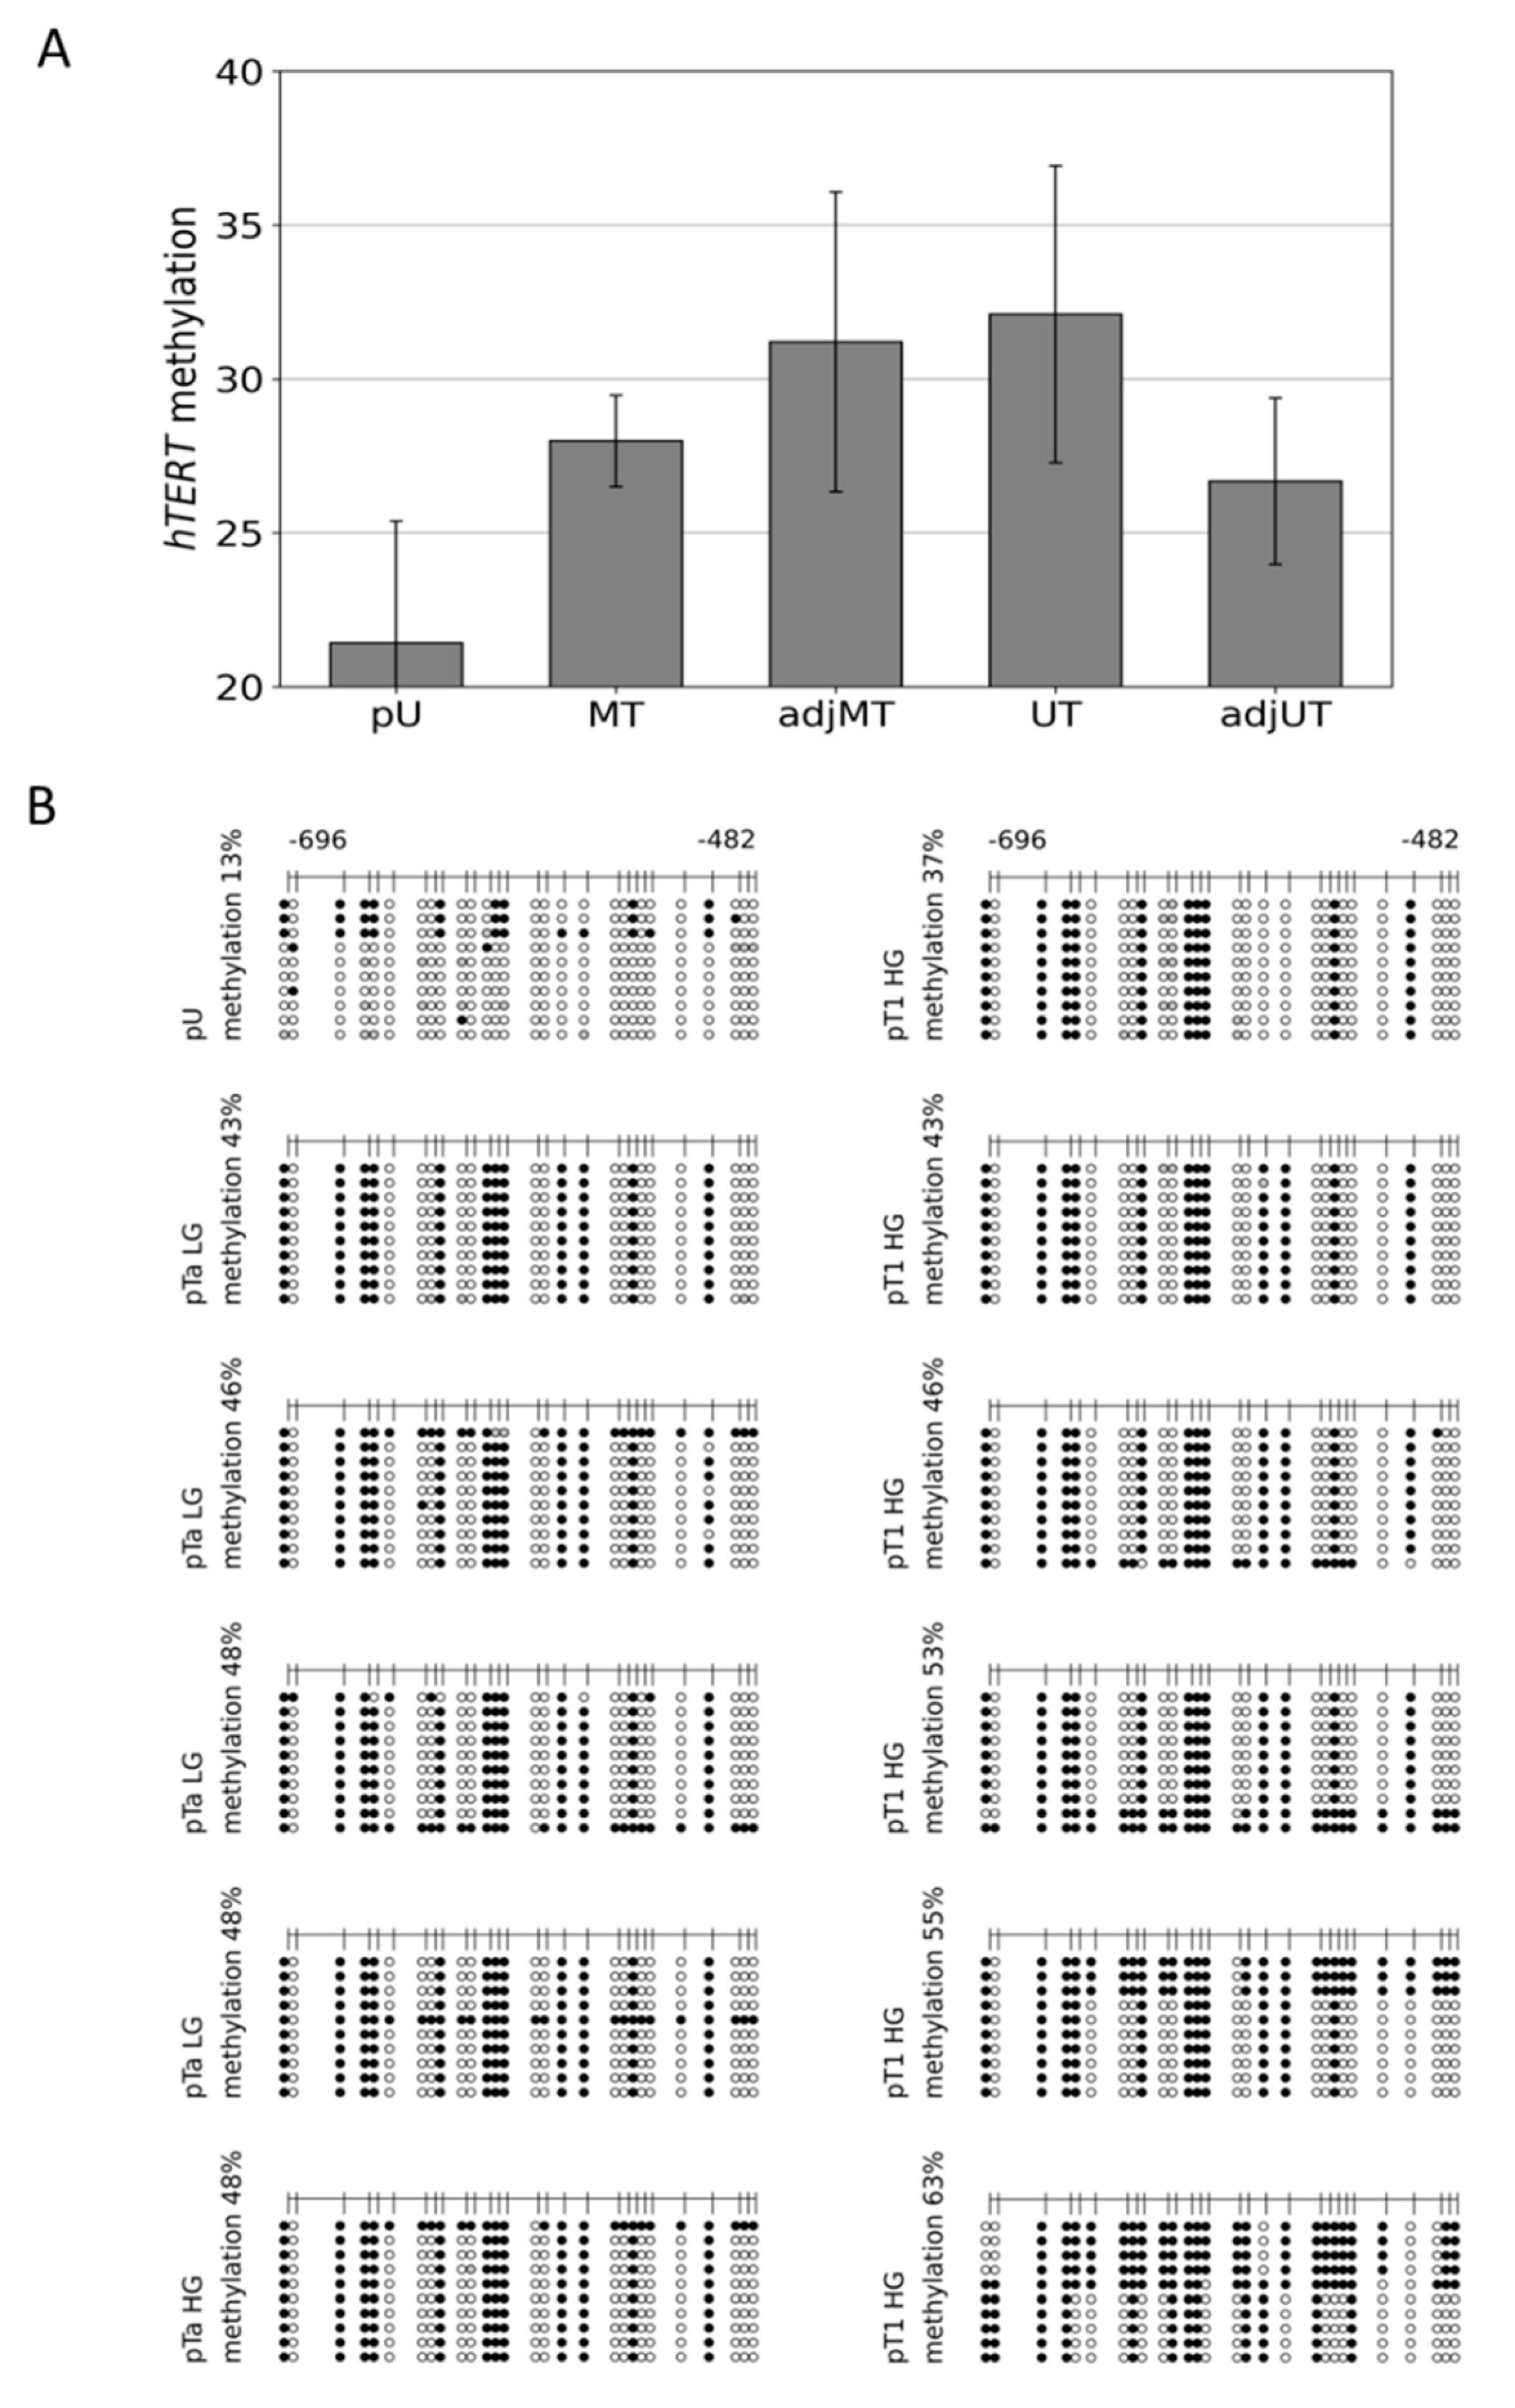
3.2. Hypermethylation Constitutes Distinct DNA Methylation Profiles of the THOR/hTAPAS CpG-Island Direct Upstream of the hTERT Core Promoter Region in Early Urothelial Cancer
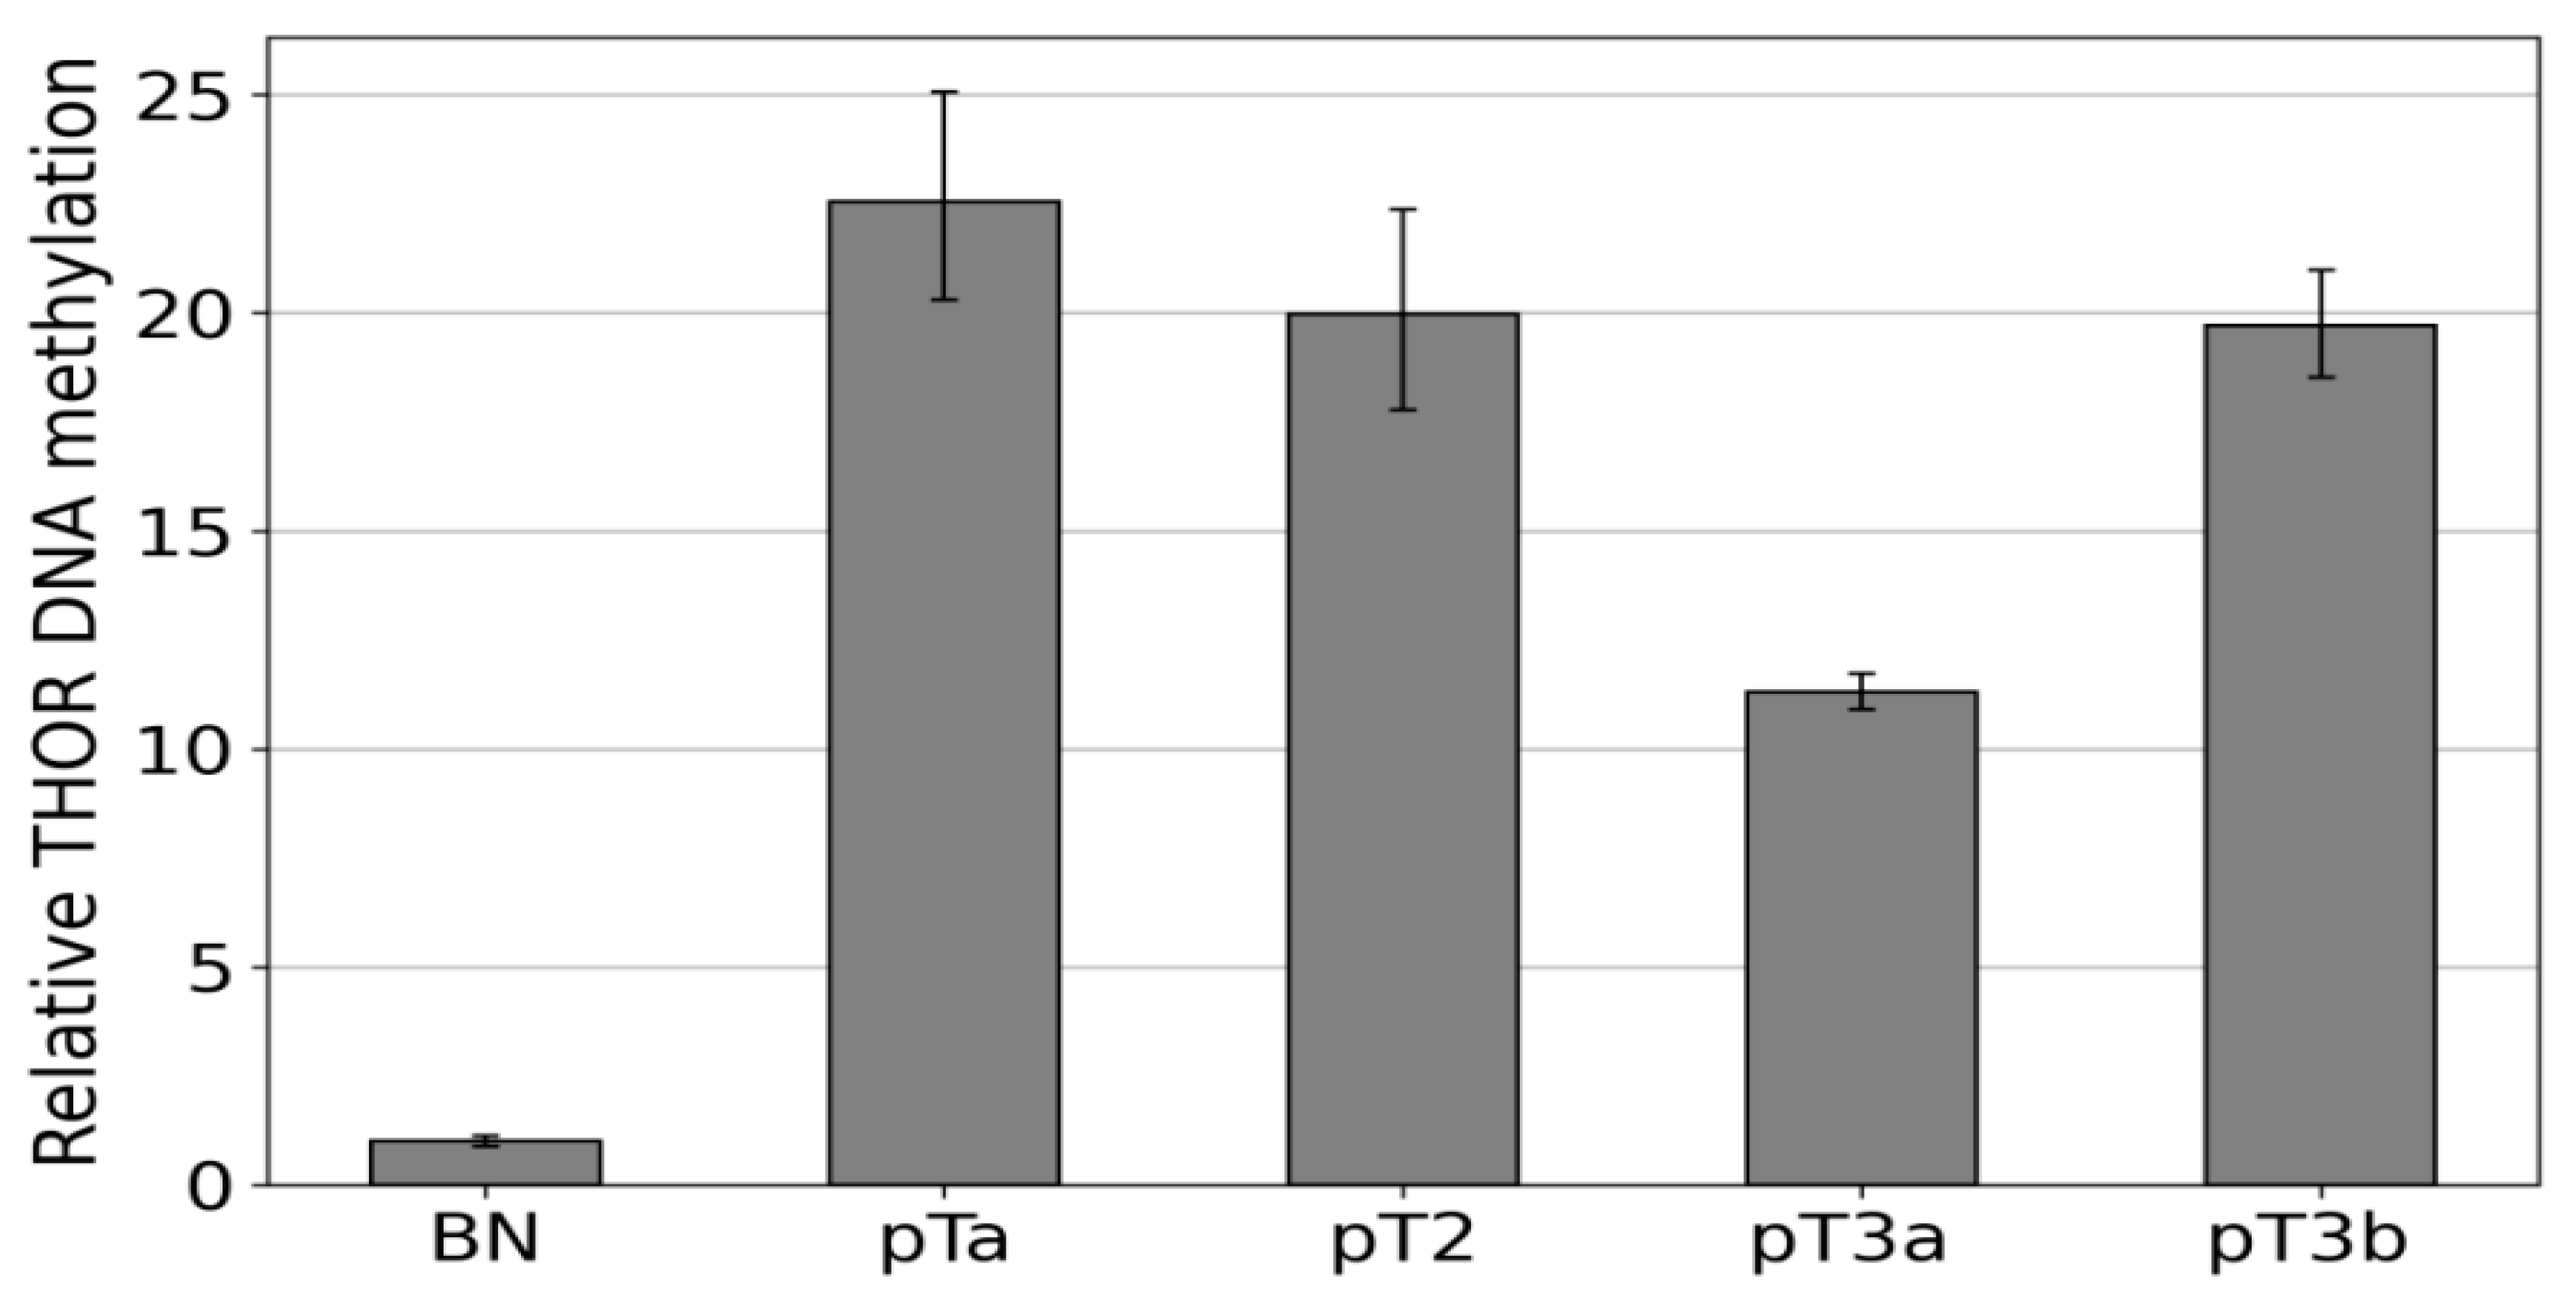
3.3. Dense DNA Methylation of the THOR/hTAPAS CpG-Island in Advanced Stage Urothelial Cancer and the Correlation of hTAPAS Repression with the HTERT Expression in Primary Urothelial Cancer Cells of Diverse Stagesand Grades
3.4. Discrimination between Hypo, Partial, and Dense Methylation of THOR by IdiolocalNormalized Methylation Specific PCR (IDLN-MSPCR)
4. Discussion
5. Conclusions
Author Contributions
Funding
Institutional Review Board Statement
Informed Consent Statement
Data Availability Statement
Acknowledgments
Conflicts of Interest
References
- Blasco, M.A. Telomeres and human disease: Ageing, cancer and beyond. Nat. Rev. Genet. 2005, 6, 611–622. [Google Scholar] [CrossRef]
- Greider, C.W.; Blackburn, E.H. Identification of a specific telomere terminal transferase activity in Tetrahymena extracts. Cell 1985, 43, 405–413. [Google Scholar]
- Harrington, L.; Zhou, W.; McPhail, T.; Oulton, R.; Yeung, D.S.; Mar, V.; Bass, M.B.; Robinson, M.O. Human telomerase contains evolutionarily conserved catalytic and structural subunits. Genes Dev. 1997, 11, 3109–3115. [Google Scholar] [CrossRef]
- Kilian, A.; Bowtell, D.D.; Abud, H.E.; Hime, G.R.; Venter, D.J.; Keese, P.K.; Duncan, E.L.; Reddel, R.R.; Jefferson, R.A. Isolation of a candidate human telomerase catalytic subunit gene, which reveals complex splicing patterns in different cell types. Hum. Mol. Genet. 1997, 6, 2011–2019. [Google Scholar] [CrossRef]
- Lingner, J.; Hughes, T.R.; Shevchenko, A.; Mann, M.; Lundblad, V.; Cech, T.R. Reverse Transcriptase Motifs in the Catalytic Subunit of Telomerase. Science 1997, 276, 561–567. [Google Scholar] [CrossRef]
- Avilion, A.A.; Piatyszek, M.A.; Gupta, J.; Shay, J.W.; Bacchetti, S.; Greider, C.W. Human telomerase RNA and telomerase activity in immortal cell lines and tumor tissues. Cancer Res. 1996, 56, 645–650. [Google Scholar]
- Yi, X.; Tesmer, V.M.; Savre-Train, I.; Shay, J.W.; Wright, W.E. Both transcriptional and posttranscriptional mechanisms regulate human telomerase template RNA levels. Mol. Cell Biol. 1999, 19, 3989–3997. [Google Scholar]
- Wright, W.E.; Tesmer, V.M.; Huffman, K.E.; Levene, S.D.; Shay, J.W. Normal human chromosomes have long G-rich telomeric overhangs at one end. Genes Dev. 1997, 11, 2801–2809. [Google Scholar] [CrossRef]
- Makarov, V.L.; Hirose, Y.; Langmore, J.P. Long G Tails at Both Ends of Human Chromosomes Suggest a C Strand Degradation Mechanism for Telomere Shortening. Cell 1997, 88, 657–666. [Google Scholar] [CrossRef]
- Shay, J.W.; Bacchetti, S. A survey of telomerase activity in human cancer. Eur. J. Cancer 1997, 33, 787–791. [Google Scholar] [CrossRef]
- Kim, S.-H.; Kaminker, P.; Campisi, J. TIN2, a new regulator of telomere length in human cells. Nat. Genet. 1999, 23, 405–412. [Google Scholar] [CrossRef]
- Olovnikov, A. A theory of marginotomy: The incomplete copying of template margin in enzymic synthesis of polynucleotides and biological significance of the phenomenon. J. Theor. Biol. 1973, 41, 181–190. [Google Scholar] [CrossRef]
- Watson, J.D. Origin of Concatemeric T7DNA. Nat. New Biol. 1972, 239, 197–201. [Google Scholar] [CrossRef]
- Shay, J.W. Role of Telomeres and Telomerase in Aging and Cancer. Cancer Discov. 2016, 6, 584–593. [Google Scholar]
- Fumagalli, M.; Rossiello, F.; Clerici, M.; Barozzi, S.; Cittaro, D.; Kaplunov, J.M.; Bucci, G.; Dobreva, M.; Matti, V.; Beausejour, C.M.; et al. Telomeric DNA damage is irreparable and causes persistent DNA-damage-response activation. Nat. Cell Biol. 2012, 14, 355–365, Erratum in Nat. Cell Biol. 2012, 14, 555. [Google Scholar] [CrossRef]
- von Zglinicki, T.; Saretzki, G.; Ladhoff, J.; d’Adda di Fagagna, F.; Jackson, S.P. Human cell senescence as a DNA damage response. Mech. Ageing Dev. 2005, 126, 111–117. [Google Scholar]
- Zou, Y.; Sfeir, A.; Gryaznov, S.M.; Shay, J.W.; Wright, W.E. Does a sentinel or a subset of short telomeres determine replicative senescence? Mol. Biol. Cell 2004, 15, 3709–3718. [Google Scholar]
- Hayflick, L. The limited in vitro Lifetime of human diploid cell strains. Exp. Cell Res. 1965, 37, 614–636. [Google Scholar]
- Wright, W.E.; Pereira-Smith, O.M.; Shay, J.W. Reversible cellular senescence: Implications for immortalization of normal human diploid fibroblasts. Mol. Cell Biol. 1989, 9, 3088–3092. [Google Scholar] [CrossRef]
- Counter, C.M.; Avilion, A.A.; LeFeuvre, C.E.; Stewart, N.G.; Greider, C.W.; Harley, C.B.; Bacchetti, S. Telomere shortening associated with chromosome instability is arrested in immortal cells which express telomerase activity. EMBO J. 1992, 11, 1921–1929. [Google Scholar]
- Shay, J.W.; Wright, W.E.; Brasiskyte, D.; Van Der Haegen, B.A. E6 of human papillomavirus type 16 can overcome the M1 stage of immortalization in human mammary epithelial cells but not in human fibroblasts. Oncogene 1993, 8, 1407–1413. [Google Scholar]
- Cong, Y.-S.; Wright, W.E.; Shay, J.W. Human telomerase and its regulation. Microbiol. Mol. Biol. Rev. 2002, 66, 407–425. [Google Scholar]
- Kim, N.W.; Piatyszek, M.A.; Prowse, K.R.; Harley, C.B.; West, M.D.; Ho, P.L.; Coviello, G.M.; Wright, W.E.; Weinrich, S.L.; Shay, J.W. Specific association of human telomerase activity with immortal cells and cancer. Science 1994, 66, 2011–2015. [Google Scholar] [CrossRef]
- Huang, F.W.; Hodis, E.; Xu, M.J.; Kryukov, G.V.; Chin, L.; Garraway, L.A. Highly recurrent TERT promoter mutations in human melanoma. Science 2013, 339, 957–959. [Google Scholar]
- Killela, P.J.; Reitman, Z.J.; Jiao, Y.; Bettegowda, C.; Agrawal, N.; Diaz, L.A., Jr.; Friedman, A.H.; Friedman, H.; Gallia, G.L.; Giovanella, B.C.; et al. TERT promoter mutations occur frequently in gliomas and a subset of tumors derived from cells with low rates of self-renewal. Proc. Natl. Acad. Sci. USA 2013, 110, 6021–6026. [Google Scholar] [CrossRef]
- Lam, G.; Xian, R.R.; Li, Y.; Burns, K.H.; Beemon, K.L. Lack of TERT Promoter Mutations in Human B-Cell Non-Hodgkin Lymphoma. Genes 2016, 7, 93. [Google Scholar] [CrossRef]
- Gay-Bellile, M.; Véronèse, L.; Combes, P.; Eymard-Pierre, E.; Kwiatkowski, F.; Dauplat, M.-M.; Cayre, A.; Privat, M.; Abrial, C.; Bignon, Y.-J.; et al. TERT promoter status and gene copy number gains: Effect on TERT expression and association with prognosis in breast cancer. Oncotarget 2017, 8, 77540–77551. [Google Scholar] [CrossRef]
- Stoehr, R.; Taubert, H.; Zinnall, U.; Giedl, J.; Gaisa, N.T.; Burger, M.; Ruemmele, P.; Hurst, C.D.; Knowles, M.A.; Wullich, B.; et al. Frequency of TERT Promoter Mutations in Prostate Cancer. Pathobiology 2015, 82, 53–57. [Google Scholar] [CrossRef]
- Sze, K.M.; Ho, D.W.; Chiu, Y.; Tsui, Y.; Chan, L.; Lee, J.M.; Chok, K.S.; Chan, A.C.; Tang, C.; Tang, V.W.; et al. Hepatitis B Virus–Telomerase Reverse Transcriptase Promoter Integration Harnesses Host ELF4, Resulting in Telomerase Reverse Transcriptase Gene Transcription in Hepatocellular Carcinoma. Hepatology 2020, 73, 23–40. [Google Scholar] [CrossRef]
- Brane, A.C.; Tollefsbol, T.O. Targeting Telomeres and Telomerase: Studies in Aging and Disease Utilizing CRISPR/Cas9 Technology. Cells 2019, 8, 186. [Google Scholar] [CrossRef]
- Guilleret, I.; Yan, P.; Grange, F.; Braunschweig, R.; Bosman, F.T.; Benhattar, J. Hypermethylation of the human te-lomerase catalytic subunit (hTERT) gene correlates with telomerase activity. Int. J. Cancer 2002, 101, 335–341. [Google Scholar]
- Lee, D.D.; Leão, R.; Komosa, M.; Gallo, M.; Zhang, C.H.; Lipman, T.; Remke, M.; Heidari, A.; Nunes, N.M.; Apolónio, J.D.; et al. DNA hypermethylation within TERT promoter upregulates TERT expression in cancer. J. Clin. Investig. 2019, 129, 223–229, Erratum in J. Clin. Investig. 2019, 129, 1801. [Google Scholar] [CrossRef] [Green Version]
- Castelo-Branco, P.; Choufani, S.; Mack, S.; Gallagher, D.; Zhang, C.; Lipman, T.; Zhukova, N.; Walker, E.J.; Martin, D.; Merino, D.; et al. Methylation of the TERT promoter and risk stratification of childhood brain tumours: An integrative genomic and molecular study. Lancet Oncol. 2013, 14, 534–542. [Google Scholar]
- Castelo-Branco, P.; Leão, R.; Lipman, T.; Campbell, B.; Lee, D.; Price, A.; Zhang, C.; Heidari, A.; Stephens, D.; Boerno, S.; et al. A cancer specific hypermethylation signature of the TERT promoter predicts biochemical relapse in prostate cancer: A retrospective cohort study. Oncotarget 2016, 7, 57726–57736. [Google Scholar] [CrossRef]
- Leão, R.; Lee, D.; Figueiredo, A.; Hermanns, T.; Wild, P.; Komosa, M.; Lau, I.; Mistry, M.; Nunes, N.M.; Price, A.J.; et al. Combined genetic and epigenetic alterations of the TERT promoter affect clinical and biological behavior of bladder cancer. Int. J. Cancer 2019, 144, 1676–1684. [Google Scholar] [CrossRef]
- Faleiro, I.; Apolónio, J.D.; Price, A.J.; De Mello, R.A.; Roberto, V.P.; Tabori, U.; Castelo-Branco, P. The TERT hypermethylated oncologic region predicts recurrence and survival in pancreatic cancer. Futur. Oncol. 2017, 13, 2045–2051. [Google Scholar] [CrossRef]
- Malhotra, S.; Freeberg, M.A.; Winans, S.J.; Taylor, J.; Beemon, K.L. A Novel Long Non-Coding RNA in the hTERT Promoter Region Regulates hTERT Expression. Non-Coding RNA 2017, 4, 1. [Google Scholar] [CrossRef]
- Swiatkowski, S.; Seifert, H.H.; Steinhoff, C.; Prior, A.; Thievessen, I.; Schliess, F.; Schulz, W.A. Activities of MAP-kinase pathways in normal uroepithelial cells and urothelial carcinoma cell lines. Exp. Cell Res. 2003, 282, 48–57. [Google Scholar] [CrossRef]
- Hoffmann, M.J.; Koutsogiannouli, E.; Skowron, M.A.; Pinkerneil, M.; Niegisch, G.; Brandt, A.; Stepanow, S.; Rieder, H.; Schulz, W.A. The New Immortalized Uroepithelial Cell Line HBLAK Contains Defined Genetic Aberrations Typical of Early Stage Urothelial Tumors. Bladder Cancer. 2016, 2, 449–463. [Google Scholar] [CrossRef]
- Graham, F.L.; Smiley, J.; Russell, W.C.; Nairn, R. Characteristics of a Human Cell Line Transformed by DNA from Human Adenovirus Type 5. J. Gen. Virol. 1977, 36, 59–74. [Google Scholar] [CrossRef]
- Kyriazis, A.A.; Kyriazis, A.P.; McCombs, W.B., 3rd; Peterson, W.D., Jr. Morphological, biological, and biochemical characteristics of human bladder transitional cell carcinomas grown in tissue culture and in nude mice. Cancer Res. 1984, 44, 3997–4005. [Google Scholar]
- Scherer, W.F.; Syverton, J.T.; Gey, G.O. Studies on the propagation in vitro of poliomyelitis viruses. IV. Viral multiplication in a stable strain of human malignant epithelial cells (strain HeLa) derived from an epidermoid carcinoma of the cervix. J. Exp. Med. 1953, 97, 695–710. [Google Scholar]
- Erichsen, L.; Ghanjati, F.; Beermann, A.; Poyet, C.; Hermanns, T.; Schulz, W.A.; Seifert, H.H.; Wild, P.J.; Buser, L.; Kröning, A.; et al. Aberrant methylated key genes of methyl group metabolism within the molecular etiology of urothelial carcinogenesis. Sci. Rep. 2018, 8, 3477, Erratum in Sci. Rep. 2018, 8, 6051. [Google Scholar] [CrossRef]
- Santourlidis, S.; Trompeter, H.I.; Weinhold, S.; Eisermann, B.; Meyer, K.L.; Wernet, P.; Uhrberg, M. Crucial role of DNA methylation in determination of clonally distributed killer cell Ig-like receptor expression patterns in NK cells. J. Immunol. 2002, 169, 4253–4261. [Google Scholar] [CrossRef]
- Santourlidis, S.; Wernet, P.; Ghanjati, F.; Graffmann, N.; Springer, J.; Kriegs, C.; Zhao, X.; Brands, J.; Araúzo-Bravo, M.J.; Neves, R.; et al. Unrestricted somatic stem cells (USSC) from human umbilical cord blood display uncommitted epigenetic signatures of the major stem cell pluripotency genes. Stem Cell Res. 2011, 6, 60–69. [Google Scholar] [CrossRef] [Green Version]
- Santourlidis, S.; Ghanjati, F.; Beermann, A.; Hermanns, T.; Poyet, C. IDLN-MSP: Idiolocal normalization of realtime methylation-specific PCR for genetic imbalanced DNA specimens. Biotechniques 2016, 60, 84–87. [Google Scholar]
- Erichsen, L.; Seifert, H.-H.; Schulz, W.A.; Hoffmann, M.J.; Niegisch, G.; Araúzo-Bravo, M.J.; Bendhack, M.L.; Poyet, C.; Hermanns, T.; Beermann, A.; et al. Basic Hallmarks of Urothelial Cancer Unleashed in Primary Uroepithelium by Interference with the Epigenetic Master Regulator ODC1. Sci. Rep. 2020, 10, 3808–3810. [Google Scholar] [CrossRef] [Green Version]


Publisher’s Note: MDPI stays neutral with regard to jurisdictional claims in published maps and institutional affiliations. |
© 2022 by the authors. Licensee MDPI, Basel, Switzerland. This article is an open access article distributed under the terms and conditions of the Creative Commons Attribution (CC BY) license (https://creativecommons.org/licenses/by/4.0/).
Share and Cite
Ott, P.; Araúzo-Bravo, M.J.; Hoffmann, M.J.; Poyet, C.; Bendhack, M.L.; Santourlidis, S.; Erichsen, L. Differential DNA Methylation of THOR and hTAPAS in the Regulation of hTERT and the Diagnosis of Cancer. Cancers 2022, 14, 4384. https://doi.org/10.3390/cancers14184384
Ott P, Araúzo-Bravo MJ, Hoffmann MJ, Poyet C, Bendhack ML, Santourlidis S, Erichsen L. Differential DNA Methylation of THOR and hTAPAS in the Regulation of hTERT and the Diagnosis of Cancer. Cancers. 2022; 14(18):4384. https://doi.org/10.3390/cancers14184384
Chicago/Turabian StyleOtt, Pauline, Marcos J. Araúzo-Bravo, Michèle J. Hoffmann, Cedric Poyet, Marcelo L. Bendhack, Simeon Santourlidis, and Lars Erichsen. 2022. "Differential DNA Methylation of THOR and hTAPAS in the Regulation of hTERT and the Diagnosis of Cancer" Cancers 14, no. 18: 4384. https://doi.org/10.3390/cancers14184384