
Techniques for Profiling the Cellular Immune Response and Their Implications for Interventional Oncology


Abstract
:Simple Summary
Abstract
1. Introduction
2. Tissue Section-Based Immune Profiling
2.1. Nanostring nCounter
2.2. Multiplex Immunofluorescence
2.3. Spatial Transcriptomics
2.3.1. Nanostring (GeoMX)
2.3.2. Visium (10× Genomics)
2.3.3. Vizgen Merscope
2.4. Imaging Mass Spectrometry
3. Bulk Tissue Analysis
3.1. Conventional Assays
3.2. Cytokine Analysis with Luminex
3.3. Genomic Analysis Tools
4. Single-Cell Characterization
4.1. Mass Cytometry
4.2. Single-Cell RNA Expression and Chromatin Availability Assays

5. Approaches to Data Analysis
5.1. Analysis of Multi-Color Flow Cytometry Data
5.1.1. Data Pre-Processing
5.1.2. Cell Population Identification
5.1.3. Cross-Sample Comparison
5.1.4. Interpretation
5.1.5. Visualization
5.2. Analysis of Bulk RNA-Seq Data
5.2.1. Quality Control
5.2.2. Transcript Identification
5.2.3. Transcript Quantification
5.2.4. Differential Gene Expression Analysis
5.2.5. Visualization
5.2.6. Ontology Databases (e.g., GO)
6. Applications in Interventional Oncology
6.1. Biopsy Procedure and Sample Processing
6.2. Evaluating the Immune Ramifications of Locoregional Therapies
7. Conclusions
Author Contributions
Funding
Conflicts of Interest
References
- Burke, H.B. Outcome Prediction and the Future of the TNM Staging System. J. Natl. Cancer Inst. 2004, 96, 1408–1409. [Google Scholar] [CrossRef] [PubMed]
- Fridman, W.H.; Pagès, F.; Sautès-Fridman, C.; Galon, J. The Immune Contexture in Human Tumours: Impact on Clinical Outcome. Nat. Rev. Cancer 2012, 12, 298–306. [Google Scholar] [CrossRef] [PubMed]
- Galon, J.; Costes, A.; Sanchez-Cabo, F.; Kirilovsky, A.; Mlecnik, B.; Lagorce-Pagès, C.; Tosolini, M.; Camus, M.; Berger, A.; Wind, P.; et al. Type, Density, and Location of Immune Cells within Human Colorectal Tumors Predict Clinical Outcome. Science 2006, 313, 1960–1964. [Google Scholar] [CrossRef] [PubMed] [Green Version]
- Galon, J.; Fridman, W.-H.; Pagès, F. The Adaptive Immunologic Microenvironment in Colorectal Cancer: A Novel Perspective: Figure 1. Cancer Res. 2007, 67, 1883–1886. [Google Scholar] [CrossRef] [Green Version]
- Mlecnik, B.; Tosolini, M.; Charoentong, P.; Kirilovsky, A.; Bindea, G.; Berger, A.; Camus, M.; Gillard, M.; Bruneval, P.; Fridman, W.; et al. Biomolecular Network Reconstruction Identifies T-Cell Homing Factors Associated with Survival in Colorectal Cancer. Gastroenterology 2010, 138, 1429–1440. [Google Scholar] [CrossRef]
- Grivennikov, S.I.; Greten, F.R.; Karin, M. Immunity, Inflammation, and Cancer. Cell 2010, 140, 883–899. [Google Scholar] [CrossRef] [Green Version]
- Pagès, F.; Berger, A.; Camus, M.; Sanchez-Cabo, F.; Costes, A.; Molidor, R.; Mlecnik, B.; Kirilovsky, A.; Nilsson, M.; Damotte, D.; et al. Effector Memory T Cells, Early Metastasis, and Survival in Colorectal Cancer. N. Engl. J. Med. 2005, 353, 2654–2666. [Google Scholar] [CrossRef] [PubMed]
- Angell, H.; Galon, J. From the Immune Contexture to the Immunoscore: The Role of Prognostic and Predictive Immune Markers in Cancer. Curr. Opin. Immunol. 2013, 25, 261–267. [Google Scholar] [CrossRef]
- Tefany, F.J.; Barnetson, R.S.; Halliday, G.M.; McCarthy, S.W.; McCarthy, W.H. Immunocytochemical Analysis of the Cellular Infiltrate in Primary Regressing and Non-Regressing Malignant Melanoma. J. Investig. Dermatol. 1991, 97, 197–202. [Google Scholar] [CrossRef] [Green Version]
- Sinicrope, F.A.; Rego, R.L.; Ansell, S.M.; Knutson, K.L.; Foster, N.R.; Sargent, D.J. Intraepithelial Effector (CD3+)/Regulatory (FoxP3+) T-Cell Ratio Predicts a Clinical Outcome of Human Colon Carcinoma. Gastroenterology 2009, 137, 1270–1279. [Google Scholar] [CrossRef] [Green Version]
- Kawai, O.; Ishii, G.; Kubota, K.; Murata, Y.; Naito, Y.; Mizuno, T.; Aokage, K.; Saijo, N.; Nishiwaki, Y.; Gemma, A.; et al. Predominant Infiltration of Macrophages and CD8 + T Cells in Cancer Nests Is a Significant Predictor of Survival in Stage IV Nonsmall Cell Lung Cancer. Cancer 2008, 113, 1387–1395. [Google Scholar] [CrossRef] [PubMed]
- Hamanishi, J.; Mandai, M.; Iwasaki, M.; Okazaki, T.; Tanaka, Y.; Yamaguchi, K.; Higuchi, T.; Yagi, H.; Takakura, K.; Minato, N.; et al. Programmed Cell Death 1 Ligand 1 and Tumor-Infiltrating CD8 + T Lymphocytes Are Prognostic Factors of Human Ovarian Cancer. Proc. Natl. Acad. Sci. USA 2007, 104, 3360–3365. [Google Scholar] [CrossRef] [PubMed] [Green Version]
- Richardsen, E.; Uglehus, R.D.; Due, J.; Busch, C.; Busund, L.-T.R. The Prognostic Impact of M-CSF, CSF-1 Receptor, CD68 and CD3 in Prostatic Carcinoma. Histopathology 2008, 53, 30–38. [Google Scholar] [CrossRef] [PubMed]
- Galon, J.; Pagès, F.; Marincola, F.M.; Angell, H.K.; Thurin, M.; Lugli, A.; Zlobec, I.; Berger, A.; Bifulco, C.; Botti, G.; et al. Cancer Classification Using the Immunoscore: A Worldwide Task Force. J. Transl. Med. 2012, 10, 205. [Google Scholar] [CrossRef]
- Pagès, F.; Mlecnik, B.; Marliot, F.; Bindea, G.; Ou, F.-S.; Bifulco, C.; Lugli, A.; Zlobec, I.; Rau, T.T.; Berger, M.D.; et al. International Validation of the Consensus Immunoscore for the Classification of Colon Cancer: A Prognostic and Accuracy Study. Lancet 2018, 391, 2128–2139. [Google Scholar] [CrossRef]
- Walkowska, J.; Kallemose, T.; Jönsson, G.; Jönsson, M.; Andersen, O.; Andersen, M.H.; Svane, I.M.; Langkilde, A.; Nilbert, M.; Therkildsen, C. Immunoprofiles of Colorectal Cancer from Lynch Syndrome. OncoImmunology 2019, 8, e1515612. [Google Scholar] [CrossRef]
- Spranger, S.; Bao, R.; Gajewski, T.F. Melanoma-Intrinsic β-Catenin Signalling Prevents Anti-Tumour Immunity. Nature 2015, 523, 231–235. [Google Scholar] [CrossRef]
- Cremonesi, E.; Governa, V.; Garzon, J.F.G.; Mele, V.; Amicarella, F.; Muraro, M.G.; Trella, E.; Galati-Fournier, V.; Oertli, D.; Däster, S.R.; et al. Gut Microbiota Modulate T Cell Trafficking into Human Colorectal Cancer. Gut 2018, 67, 1984–1994. [Google Scholar] [CrossRef]
- Wirta, E.-V.; Seppälä, T.; Friman, M.; Väyrynen, J.; Ahtiainen, M.; Kautiainen, H.; Kuopio, T.; Kellokumpu, I.; Mecklin, J.-P.; Böhm, J. Immunoscore in Mismatch Repair-Proficient and -Deficient Colon Cancer: Immunoscore in Colon Cancer. J. Path Clin. Res. 2017, 3, 203–213. [Google Scholar] [CrossRef]
- Galon, J.; Lanzi, A. Immunoscore and Its Introduction in Clinical Practice. Q. J. Nucl. Med. Mol. Imaging 2020, 64, 152–161. [Google Scholar] [CrossRef]
- Angell, H.K.; Bruni, D.; Barrett, J.C.; Herbst, R.; Galon, J. The Immunoscore: Colon Cancer and Beyond. Clin. Cancer Res. 2020, 26, 332–339. [Google Scholar] [CrossRef] [PubMed] [Green Version]
- Zhang, X.; Yang, J.; Du, L.; Zhou, Y.; Li, K. The Prognostic Value of Immunoscore in Patients with Cancer: A Pooled Analysis of 10,328 Patients. Int. J. Biol. Markers 2020, 35, 3–13. [Google Scholar] [CrossRef] [PubMed]
- Bruni, D.; Angell, H.K.; Galon, J. The Immune Contexture and Immunoscore in Cancer Prognosis and Therapeutic Efficacy. Nat. Rev. Cancer 2020, 20, 662–680. [Google Scholar] [CrossRef] [PubMed]
- Galon, J.; Pagès, F.; Marincola, F.M.; Thurin, M.; Trinchieri, G.; Fox, B.A.; Gajewski, T.F.; Ascierto, P.A. The Immune Score as a New Possible Approach for the Classification of Cancer. J. Transl. Med. 2012, 10, 1. [Google Scholar] [CrossRef]
- Tselikas, L.; Champiat, S.; Sheth, R.A.; Yevich, S.; Ammari, S.; Deschamps, F.; Farhane, S.; Roux, C.; Susini, S.; Mouraud, S.; et al. Interventional Radiology for Local Immunotherapy in Oncology. Clin. Cancer Res. 2021, 27, 2698–2705. [Google Scholar] [CrossRef]
- Muñoz, N.M.; Dupuis, C.; Williams, M.; Dixon, K.; McWatters, A.; Avritscher, R.; Bouchard, R.; Kaseb, A.; Schachtschneider, K.M.; Rao, A.; et al. Molecularly Targeted Photothermal Ablation Improves Tumor Specificity and Immune Modulation in a Rat Model of Hepatocellular Carcinoma. Commun. Biol. 2020, 3, 783. [Google Scholar] [CrossRef]
- Adnan, A.; Muñoz, N.M.; Prakash, P.; Habibollahi, P.; Cressman, E.N.K.; Sheth, R.A. Hyperthermia and Tumor Immunity. Cancers 2021, 13, 2507. [Google Scholar] [CrossRef]
- Mehta, A.; Oklu, R.; Sheth, R.A. Thermal Ablative Therapies and Immune Checkpoint Modulation: Can Locoregional Approaches Effect a Systemic Response? Gastroenterol. Res. Pract. 2016, 2016, 9251375. [Google Scholar] [CrossRef] [Green Version]
- Qiao, Y.; Sheth, R.A.; Tam, A. Image-Guided Intratumoral Delivery of Immunotherapeutics in Gastrointestinal Malignancies. Dig. Dis. Interv. 2021, 5, 22–31. [Google Scholar] [CrossRef]
- Salgado, R.; Denkert, C.; Demaria, S.; Sirtaine, N.; Klauschen, F.; Pruneri, G.; Wienert, S.; Van den Eynden, G.; Baehner, F.L.; Penault-Llorca, F.; et al. The Evaluation of Tumor-Infiltrating Lymphocytes (TILs) in Breast Cancer: Recommendations by an International TILs Working Group 2014. Ann. Oncol. 2015, 26, 259–271. [Google Scholar] [CrossRef]
- Matsutani, S.; Shibutani, M.; Maeda, K.; Nagahara, H.; Fukuoka, T.; Iseki, Y.; Kashiwagi, S.; Tanaka, H.; Hirakawa, K.; Ohira, M. Tumor-Infiltrating Immune Cells in H&E-Stained Sections of Colorectal Cancer Tissue as a Reasonable Immunological Biomarker. Anticancer Res. 2018, 38, 6721–6727. [Google Scholar] [CrossRef] [PubMed]
- Iseki, Y.; Shibutani, M.; Maeda, K.; Nagahara, H.; Fukuoka, T.; Matsutani, S.; Kashiwagi, S.; Tanaka, H.; Hirakawa, K.; Ohira, M. A New Method for Evaluating Tumor-Infiltrating Lymphocytes (TILs) in Colorectal Cancer Using Hematoxylin and Eosin (H-E)-Stained Tumor Sections. PLoS ONE 2018, 13, e0192744. [Google Scholar] [CrossRef] [PubMed]
- Hendry, S.; Salgado, R.; Gevaert, T.; Russell, P.A.; John, T.; Thapa, B.; Christie, M.; van de Vijver, K.; Estrada, M.V.; Gonzalez-Ericsson, P.I.; et al. Assessing Tumor-Infiltrating Lymphocytes in Solid Tumors: A Practical Review for Pathologists and Proposal for a Standardized Method From the International Immunooncology Biomarkers Working Group: Part 1: Assessing the Host Immune Response, TILs in Invasive Breast Carcinoma and Ductal Carcinoma In Situ, Metastatic Tumor Deposits and Areas for Further Research. Adv. Anat. Pathol. 2017, 24, 235–251. [Google Scholar] [CrossRef] [PubMed] [Green Version]
- Pruneri, G.; Lazzeroni, M.; Bagnardi, V.; Tiburzio, G.B.; Rotmensz, N.; DeCensi, A.; Guerrieri-Gonzaga, A.; Vingiani, A.; Curigliano, G.; Zurrida, S.; et al. The Prevalence and Clinical Relevance of Tumor-Infiltrating Lymphocytes (TILs) in Ductal Carcinoma in Situ of the Breast. Ann. Oncol. 2017, 28, 321–328. [Google Scholar] [CrossRef]
- Kaliyappan, K.; Palanisamy, M.; Duraiyan, J.; Govindarajan, R. Applications of Immunohistochemistry. J. Pharm. Bioall. Sci. 2012, 4, 307–309. [Google Scholar] [CrossRef]
- Geiss, G.K.; Bumgarner, R.E.; Birditt, B.; Dahl, T.; Dowidar, N.; Dunaway, D.L.; Fell, H.P.; Ferree, S.; George, R.D.; Grogan, T.; et al. Direct Multiplexed Measurement of Gene Expression with Color-Coded Probe Pairs. Nat. Biotechnol. 2008, 26, 317–325. [Google Scholar] [CrossRef]
- Prokopec, S.D.; Watson, J.D.; Waggott, D.M.; Smith, A.B.; Wu, A.H.; Okey, A.B.; Pohjanvirta, R.; Boutros, P.C. Systematic Evaluation of Medium-Throughput MRNA Abundance Platforms. RNA 2013, 19, 51–62. [Google Scholar] [CrossRef] [Green Version]
- Malkov, V.A.; Serikawa, K.A.; Balantac, N.; Watters, J.; Geiss, G.; Mashadi-Hossein, A.; Fare, T. Multiplexed Measurements of Gene Signatures in Different Analytes Using the Nanostring NCounter Assay System. BMC Res. Notes 2009, 2, 80. [Google Scholar] [CrossRef] [Green Version]
- Ibusuki, M.; Fu, P.; Yamamoto, S.; Fujiwara, S.; Yamamoto, Y.; Honda, Y.; Iyama, K.; Iwase, H. Establishment of a Standardized Gene-Expression Analysis System Using Formalin-Fixed, Paraffin-Embedded, Breast Cancer Specimens. Breast Cancer 2013, 20, 159–166. [Google Scholar] [CrossRef]
- Wimmer, I.; Tröscher, A.R.; Brunner, F.; Rubino, S.J.; Bien, C.G.; Weiner, H.L.; Lassmann, H.; Bauer, J. Systematic Evaluation of RNA Quality, Microarray Data Reliability and Pathway Analysis in Fresh, Fresh Frozen and Formalin-Fixed Paraffin-Embedded Tissue Samples. Sci. Rep. 2018, 8, 6351. [Google Scholar] [CrossRef]
- Fortina, P.; Surrey, S. Digital mRNA Profiling. Nat. Biotechnol. 2008, 26, 293–294. [Google Scholar] [CrossRef]
- Kojima, K.; April, C.; Canasto-Chibuque, C.; Chen, X.; Deshmukh, M.; Venkatesh, A.; Tan, P.S.; Kobayashi, M.; Kumada, H.; Fan, J.-B.; et al. Transcriptome Profiling of Archived Sectioned Formalin-Fixed Paraffin-Embedded (AS-FFPE) Tissue for Disease Classification. PLoS ONE 2014, 9, e86961. [Google Scholar] [CrossRef] [PubMed]
- Payton, J.E.; Grieselhuber, N.R.; Chang, L.-W.; Murakami, M.; Geiss, G.K.; Link, D.C.; Nagarajan, R.; Watson, M.A.; Ley, T.J. High Throughput Digital Quantification of MRNA Abundance in Primary Human Acute Myeloid Leukemia Samples. J. Clin. Invest. 2009, 119, 1714–1726. [Google Scholar] [CrossRef] [PubMed]
- Reis, P.P.; Waldron, L.; Goswami, R.S.; Xu, W.; Xuan, Y.; Perez-Ordonez, B.; Gullane, P.; Irish, J.; Jurisica, I.; Kamel-Reid, S. MRNA Transcript Quantification in Archival Samples Using Multiplexed, Color-Coded Probes. BMC Biotechnol. 2011, 11, 46. [Google Scholar] [CrossRef] [PubMed] [Green Version]
- Tan, W.C.C.; Nerurkar, S.N.; Cai, H.Y.; Ng, H.H.M.; Wu, D.; Wee, Y.T.F.; Lim, J.C.T.; Yeong, J.; Lim, T.K.H. Overview of Multiplex Immunohistochemistry/Immunofluorescence Techniques in the Era of Cancer Immunotherapy. Cancer Commun. 2020, 40, 135–153. [Google Scholar] [CrossRef] [PubMed] [Green Version]
- Schürch, C.M.; Bhate, S.S.; Barlow, G.L.; Phillips, D.J.; Noti, L.; Zlobec, I.; Chu, P.; Black, S.; Demeter, J.; McIlwain, D.R.; et al. Coordinated Cellular Neighborhoods Orchestrate Antitumoral Immunity at the Colorectal Cancer Invasive Front. Cell 2020, 182, 1341–1359. [Google Scholar] [CrossRef]
- Goltsev, Y.; Samusik, N.; Kennedy-Darling, J.; Bhate, S.; Hale, M.; Vazquez, G.; Black, S.; Nolan, G.P. Deep Profiling of Mouse Splenic Architecture with CODEX Multiplexed Imaging. Cell 2018, 174, 968–981.e15. [Google Scholar] [CrossRef] [Green Version]
- Phillips, D.; Matusiak, M.; Gutierrez, B.R.; Bhate, S.S.; Barlow, G.L.; Jiang, S.; Demeter, J.; Smythe, K.S.; Pierce, R.H.; Fling, S.P.; et al. Immune Cell Topography Predicts Response to PD-1 Blockade in Cutaneous T Cell Lymphoma. Nat. Commun. 2021, 12, 6726. [Google Scholar] [CrossRef]
- Giesen, C.; Wang, H.A.O.; Schapiro, D.; Zivanovic, N.; Jacobs, A.; Hattendorf, B.; Schüffler, P.J.; Grolimund, D.; Buhmann, J.M.; Brandt, S.; et al. Highly Multiplexed Imaging of Tumor Tissues with Subcellular Resolution by Mass Cytometry. Nat. Methods 2014, 11, 417–422. [Google Scholar] [CrossRef]
- Jackson, H.W.; Fischer, J.R.; Zanotelli, V.R.T.; Ali, H.R.; Mechera, R.; Soysal, S.D.; Moch, H.; Muenst, S.; Varga, Z.; Weber, W.P.; et al. The Single-Cell Pathology Landscape of Breast Cancer. Nature 2020, 578, 615–620. [Google Scholar] [CrossRef]
- Ijsselsteijn, M.E.; van der Breggen, R.; Farina Sarasqueta, A.; Koning, F.; de Miranda, N.F.C.C. A 40-Marker Panel for High Dimensional Characterization of Cancer Immune Microenvironments by Imaging Mass Cytometry. Front. Immunol. 2019, 10, 2534. [Google Scholar] [CrossRef] [PubMed]
- Pelka, K.; Hofree, M.; Chen, J.H.; Sarkizova, S.; Pirl, J.D.; Jorgji, V.; Bejnood, A.; Dionne, D.; Ge, W.H.; Xu, K.H.; et al. Spatially Organized Multicellular Immune Hubs in Human Colorectal Cancer. Cell 2021, 184, 4734–4752.e20. [Google Scholar] [CrossRef] [PubMed]
- Van, T.M.; Blank, C.U. A User’s Perspective on GeoMxTM Digital Spatial Profiling. Immuno-Oncol. Technol. 2019, 1, 11–18. [Google Scholar] [CrossRef] [PubMed] [Green Version]
- Garon, E.B.; Rizvi, N.A.; Hui, R.; Leighl, N.; Balmanoukian, A.S.; Eder, J.P.; Patnaik, A.; Aggarwal, C.; Gubens, M.; Horn, L.; et al. Pembrolizumab for the Treatment of Non–Small-Cell Lung Cancer. N. Engl. J. Med. 2015, 372, 2018–2028. [Google Scholar] [CrossRef]
- Yu, H.; Batenchuk, C.; Badzio, A.; Boyle, T.A.; Czapiewski, P.; Chan, D.C.; Lu, X.; Gao, D.; Ellison, K.; Kowalewski, A.A.; et al. PD-L1 Expression by Two Complementary Diagnostic Assays and MRNA In Situ Hybridization in Small Cell Lung Cancer. J. Thorac. Oncol. 2017, 12, 110–120. [Google Scholar] [CrossRef] [Green Version]
- Ting, D.T.; Lipson, D.; Paul, S.; Brannigan, B.W.; Akhavanfard, S.; Coffman, E.J.; Contino, G.; Deshpande, V.; Iafrate, A.J.; Letovsky, S.; et al. Aberrant Overexpression of Satellite Repeats in Pancreatic and Other Epithelial Cancers. Science 2011, 331, 593–596. [Google Scholar] [CrossRef] [Green Version]
- Merritt, C.R.; Ong, G.T.; Church, S.E.; Barker, K.; Danaher, P.; Geiss, G.; Hoang, M.; Jung, J.; Liang, Y.; McKay-Fleisch, J.; et al. Multiplex digital spatial profiling of proteins and RNA in fixed tissue. Nat. Biotechnol. 2020, 38, 586–599. [Google Scholar] [CrossRef] [PubMed]
- Wang, Y.; Mashock, M.; Tong, Z.; Mu, X.; Chen, H.; Zhou, X.; Zhang, H.; Zhao, G.; Liu, B.; Li, X. Changing Technologies of RNA Sequencing and Their Applications in Clinical Oncology. Front. Oncol. 2020, 10, 447. [Google Scholar] [CrossRef] [Green Version]
- Nagasawa, S.; Kashima, Y.; Suzuki, A.; Suzuki, Y. Single-Cell and Spatial Analyses of Cancer Cells: Toward Elucidating the Molecular Mechanisms of Clonal Evolution and Drug Resistance Acquisition. Inflamm. Regener. 2021, 41, 22. [Google Scholar] [CrossRef]
- Bassiouni, R.; Gibbs, L.D.; Craig, D.W.; Carpten, J.D.; McEachron, T.A. Applicability of Spatial Transcriptional Profiling to Cancer Research. Mol. Cell 2021, 81, 1631–1639. [Google Scholar] [CrossRef]
- Chen, K.H.; Boettiger, A.N.; Moffitt, J.R.; Wang, S.; Zhuang, X. Spatially Resolved, Highly Multiplexed RNA Profiling in Single Cells. Science 2015, 348, aaa6090. [Google Scholar] [CrossRef] [PubMed] [Green Version]
- Moffitt, J.R.; Hao, J.; Bambah-Mukku, D.; Lu, T.; Dulac, C.; Zhuang, X. High-Performance Multiplexed Fluorescence in Situ Hybridization in Culture and Tissue with Matrix Imprinting and Clearing. Proc. Natl. Acad. Sci. USA 2016, 113, 14456–14461. [Google Scholar] [CrossRef] [PubMed] [Green Version]
- Price, C.; Chen, J.; Pelka, K.; Chao, S.; He, J.; Boland, G.; Emanuel, G.; Hacohen, N. 920 A Single-Cell Spatially Resolved MERFISH Map of the Colorectal Tumor Immune Microenvironment. J. Immunother. Cancer 2021, 9, A965. [Google Scholar] [CrossRef]
- Lu, Y.; Liu, M.; Yang, J.; Weissman, S.M.; Pan, X.; Katz, S.G.; Wang, S. Spatial Transcriptome Profiling by MERFISH Reveals Fetal Liver Hematopoietic Stem Cell Niche Architecture. Cell Discov. 2021, 7, 47. [Google Scholar] [CrossRef]
- Xia, C.; Fan, J.; Emanuel, G.; Hao, J.; Zhuang, X. Spatial Transcriptome Profiling by MERFISH Reveals Subcellular RNA Compartmentalization and Cell Cycle-Dependent Gene Expression. Proc. Natl. Acad. Sci. USA 2019, 116, 19490–19499. [Google Scholar] [CrossRef] [PubMed] [Green Version]
- Zhang, M.; Eichhorn, S.W.; Zingg, B.; Yao, Z.; Cotter, K.; Zeng, H.; Dong, H.; Zhuang, X. Spatially Resolved Cell Atlas of the Mouse Primary Motor Cortex by MERFISH. Nature 2021, 598, 137–143. [Google Scholar] [CrossRef]
- AGBT 2022 Poster: In Situ Single-Cell Transcriptomic Imaging in Formalin-Fixed Paraffin-Embedded Tissues with MERSCOPETM. Available online: https://vizgen.com/resources/agbt-2022-poster/ (accessed on 22 June 2022).
- Caprioli, R.M.; Farmer, T.B.; Gile, J. Molecular Imaging of Biological Samples: Localization of Peptides and Proteins Using MALDI-TOF MS. Anal. Chem. 1997, 69, 4751–4760. [Google Scholar] [CrossRef]
- Zimmerman, T.A.; Monroe, E.B.; Tucker, K.R.; Rubakhin, S.S.; Sweedler, J.V. Chapter 13 Imaging of Cells and Tissues with Mass Spectrometry. In Methods in Cell Biology; Elsevier: Amsterdam, The Netherlands, 2008; Volume 89, pp. 361–390. ISBN 978-0-12-372521-9. [Google Scholar]
- Celis, J.E.; Gromov, P. Proteomics in Translational Cancer Research: Toward an Integrated Approach. Cancer Cell 2003, 3, 9–15. [Google Scholar] [CrossRef] [Green Version]
- Hanash, S. Disease Proteomics. Nature 2003, 422, 226–232. [Google Scholar] [CrossRef]
- Mann, M.; Hendrickson, R.C.; Pandey, A. Analysis of Proteins and Proteomes by Mass Spectrometry. Annu. Rev. Biochem. 2001, 70, 437–473. [Google Scholar] [CrossRef]
- Berghmans, E.; Van Raemdonck, G.; Schildermans, K.; Willems, H.; Boonen, K.; Maes, E.; Mertens, I.; Pauwels, P.; Baggerman, G. MALDI Mass Spectrometry Imaging Linked with Top-Down Proteomics as a Tool to Study the Non-Small-Cell Lung Cancer Tumor Microenvironment. Methods Protoc. 2019, 2, 44. [Google Scholar] [CrossRef] [PubMed] [Green Version]
- Powers, T.W.; Neely, B.A.; Shao, Y.; Tang, H.; Troyer, D.A.; Mehta, A.S.; Haab, B.B.; Drake, R.R. MALDI Imaging Mass Spectrometry Profiling of N-Glycans in Formalin-Fixed Paraffin Embedded Clinical Tissue Blocks and Tissue Microarrays. PLoS ONE 2014, 9, e106255. [Google Scholar] [CrossRef] [PubMed]
- Lou, S.; Balluff, B.; Cleven, A.H.G.; Bovée, J.V.M.G.; McDonnell, L.A. Prognostic Metabolite Biomarkers for Soft Tissue Sarcomas Discovered by Mass Spectrometry Imaging. J. Am. Soc. Mass Spectrom. 2017, 28, 376–383. [Google Scholar] [CrossRef] [PubMed] [Green Version]
- Paine, M.R.L.; Liu, J.; Huang, D.; Ellis, S.R.; Trede, D.; Kobarg, J.H.; Heeren, R.M.A.; Fernández, F.M.; MacDonald, T.J. Three-Dimensional Mass Spectrometry Imaging Identifies Lipid Markers of Medulloblastoma Metastasis. Sci. Rep. 2019, 9, 2205. [Google Scholar] [CrossRef] [Green Version]
- Schwartz, S.A.; Weil, R.J.; Thompson, R.C.; Shyr, Y.; Moore, J.H.; Toms, S.A.; Johnson, M.D.; Caprioli, R.M. Proteomic-Based Prognosis of Brain Tumor Patients Using Direct-Tissue Matrix-Assisted Laser Desorption Ionization Mass Spectrometry. Cancer Res. 2005, 65, 7674–7681. [Google Scholar] [CrossRef] [Green Version]
- Patel, S.A.; Barnes, A.; Loftus, N.; Martin, R.; Sloan, P.; Thakker, N.; Goodacre, R. Imaging Mass Spectrometry Using Chemical Inkjet Printing Reveals Differential Protein Expression in Human Oral Squamous Cell Carcinoma. Analyst 2009, 134, 301–307. [Google Scholar] [CrossRef]
- Rauser, S.; Marquardt, C.; Balluff, B.; Deininger, S.-O.; Albers, C.; Belau, E.; Hartmer, R.; Suckau, D.; Specht, K.; Ebert, M.P.; et al. Classification of HER2 Receptor Status in Breast Cancer Tissues by MALDI Imaging Mass Spectrometry. J. Proteome Res. 2010, 9, 1854–1863. [Google Scholar] [CrossRef] [Green Version]
- Bauer, J.A.; Chakravarthy, A.B.; Rosenbluth, J.M.; Mi, D.; Seeley, E.H.; De Matos Granja-Ingram, N.; Olivares, M.G.; Kelley, M.C.; Mayer, I.A.; Meszoely, I.M.; et al. Identification of Markers of Taxane Sensitivity Using Proteomic and Genomic Analyses of Breast Tumors from Patients Receiving Neoadjuvant Paclitaxel and Radiation. Clin. Cancer Res. 2010, 16, 681–690. [Google Scholar] [CrossRef] [Green Version]
- Morita, Y.; Ikegami, K.; Goto-Inoue, N.; Hayasaka, T.; Zaima, N.; Tanaka, H.; Uehara, T.; Setoguchi, T.; Sakaguchi, T.; Igarashi, H.; et al. Imaging Mass Spectrometry of Gastric Carcinoma in Formalin-Fixed Paraffin-Embedded Tissue Microarray. Cancer Sci. 2010, 101, 267–273. [Google Scholar] [CrossRef] [Green Version]
- Djidja, M.-C.; Claude, E.; Snel, M.F.; Scriven, P.; Francese, S.; Carolan, V.; Clench, M.R. MALDI-Ion Mobility Separation-Mass Spectrometry Imaging of Glucose-Regulated Protein 78 KDa (Grp78) in Human Formalin-Fixed, Paraffin-Embedded Pancreatic Adenocarcinoma Tissue Sections. J. Proteome Res. 2009, 8, 4876–4884. [Google Scholar] [CrossRef]
- Oppenheimer, S.R.; Mi, D.; Sanders, M.E.; Caprioli, R.M. Molecular Analysis of Tumor Margins by MALDI Mass Spectrometry in Renal Carcinoma. J. Proteome Res. 2010, 9, 2182–2190. [Google Scholar] [CrossRef] [PubMed] [Green Version]
- Lemaire, R.; Ait Menguellet, S.; Stauber, J.; Marchaudon, V.; Lucot, J.-P.; Collinet, P.; Farine, M.-O.; Vinatier, D.; Day, R.; Ducoroy, P.; et al. Specific MALDI Imaging and Profiling for Biomarker Hunting and Validation: Fragment of the 11S Proteasome Activator Complex, Reg Alpha Fragment, Is a New Potential Ovary Cancer Biomarker. J. Proteome Res. 2007, 6, 4127–4134. [Google Scholar] [CrossRef] [PubMed]
- Kang, S.; Shim, H.S.; Lee, J.S.; Kim, D.S.; Kim, H.Y.; Hong, S.H.; Kim, P.S.; Yoon, J.H.; Cho, N.H. Molecular Proteomics Imaging of Tumor Interfaces by Mass Spectrometry. J. Proteome Res. 2010, 9, 1157–1164. [Google Scholar] [CrossRef] [PubMed]
- Herring, K.D.; Oppenheimer, S.R.; Caprioli, R.M. Direct Tissue Analysis by Matrix-Assisted Laser Desorption Ionization Mass Spectrometry: Application to Kidney Biology. Semin. Nephrol. 2007, 27, 597–608. [Google Scholar] [CrossRef] [Green Version]
- Kriegsmann, M.; Casadonte, R.; Kriegsmann, J.; Dienemann, H.; Schirmacher, P.; Hendrik Kobarg, J.; Schwamborn, K.; Stenzinger, A.; Warth, A.; Weichert, W. Reliable Entity Subtyping in Non-Small Cell Lung Cancer by Matrix-Assisted Laser Desorption/Ionization Imaging Mass Spectrometry on Formalin-Fixed Paraffin-Embedded Tissue Specimens. Mol. Cell. Proteom. 2016, 15, 3081–3089. [Google Scholar] [CrossRef] [Green Version]
- Pallua, J.D.; Schaefer, G.; Seifarth, C.; Becker, M.; Meding, S.; Rauser, S.; Walch, A.; Handler, M.; Netzer, M.; Popovscaia, M.; et al. MALDI-MS Tissue Imaging Identification of Biliverdin Reductase B Overexpression in Prostate Cancer. J. Proteom. 2013, 91, 500–514. [Google Scholar] [CrossRef] [PubMed]
- Shruthi, B.; Vinodhkumar, P.; Selvamani, M. Proteomics: A New Perspective for Cancer. Adv. Biomed. Res. 2016, 5, 67. [Google Scholar] [CrossRef]
- Planchard, D.; Smit, E.F.; Groen, H.J.M.; Mazieres, J.; Besse, B.; Helland, Å.; Giannone, V.; D’Amelio, A.M.; Zhang, P.; Mookerjee, B.; et al. Dabrafenib plus Trametinib in Patients with Previously Untreated BRAFV600E-Mutant Metastatic Non-Small-Cell Lung Cancer: An Open-Label, Phase 2 Trial. Lancet Oncol. 2017, 18, 1307–1316. [Google Scholar] [CrossRef]
- Drilon, A.; Rekhtman, N.; Arcila, M.; Wang, L.; Ni, A.; Albano, M.; Van Voorthuysen, M.; Somwar, R.; Smith, R.S.; Montecalvo, J.; et al. Cabozantinib in Patients with Advanced RET-Rearranged Non-Small-Cell Lung Cancer: An Open-Label, Single-Centre, Phase 2, Single-Arm Trial. Lancet Oncol. 2016, 17, 1653–1660. [Google Scholar] [CrossRef] [Green Version]
- Lee, S.-H.; Lee, J.-K.; Ahn, M.-J.; Kim, D.-W.; Sun, J.-M.; Keam, B.; Kim, T.M.; Heo, D.S.; Ahn, J.S.; Choi, Y.-L.; et al. Vandetanib in Pretreated Patients with Advanced Non-Small Cell Lung Cancer-Harboring RET Rearrangement: A Phase II Clinical Trial. Ann. Oncol. 2017, 28, 292–297. [Google Scholar] [CrossRef]
- Kurien, B.T.; Scofield, R.H. Other Notable Protein Blotting Methods: A Brief Review. Methods Mol. Biol. 2015, 1312, 487–503. [Google Scholar] [CrossRef] [PubMed]
- Aebersold, R.H.; Pipes, G.D.; Nika, H.; Hood, L.E.; Kent, S.B. Covalent Immobilization of Proteins for High-Sensitivity Sequence Analysis: Electroblotting onto Chemically Activated Glass from Sodium Dodecyl Sulfate-Polyacrylamide Gels. Biochemistry 1988, 27, 6860–6867. [Google Scholar] [CrossRef] [PubMed]
- He, M.; Herr, A.E. Automated Microfluidic Protein Immunoblotting. Nat. Protoc. 2010, 5, 1844–1856. [Google Scholar] [CrossRef] [PubMed]
- O’Neill, R.A.; Bhamidipati, A.; Bi, X.; Deb-Basu, D.; Cahill, L.; Ferrante, J.; Gentalen, E.; Glazer, M.; Gossett, J.; Hacker, K.; et al. Isoelectric Focusing Technology Quantifies Protein Signaling in 25 Cells. Proc. Natl. Acad. Sci. USA 2006, 103, 16153–16158. [Google Scholar] [CrossRef] [PubMed] [Green Version]
- Treindl, F.; Ruprecht, B.; Beiter, Y.; Schultz, S.; Döttinger, A.; Staebler, A.; Joos, T.O.; Kling, S.; Poetz, O.; Fehm, T.; et al. A Bead-Based Western for High-Throughput Cellular Signal Transduction Analyses. Nat. Commun. 2016, 7, 12852. [Google Scholar] [CrossRef] [Green Version]
- Vallejo-Illarramendi, A.; Marciano, D.K.; Reichardt, L.F. A Novel Method That Improves Sensitivity of Protein Detection in PAGE and Western Blot. Electrophoresis 2013, 34, 1148–1150. [Google Scholar] [CrossRef] [PubMed] [Green Version]
- Liu, C.-Y.; Lu, D.-C.; Jiang, Y.-W.; Yen, Y.-K.; Chang, S.-C.; Wang, A.-B. Easy and Fast Western Blotting by Thin-Film Direct Coating with Suction. Anal. Chem. 2016, 88, 6349–6356. [Google Scholar] [CrossRef]
- Olsen, I.; Wiker, H.G. Diffusion Blotting: A Rapid and Simple Method for Production of Multiple Blots from a Single Gel. Methods Mol. Biol. 2015, 1312, 73–76. [Google Scholar] [CrossRef]
- Byrne, M.B.; Leslie, M.T.; Gaskins, H.R.; Kenis, P.J.A. Methods to Study the Tumor Microenvironment under Controlled Oxygen Conditions. Trends Biotechnol. 2014, 32, 556–563. [Google Scholar] [CrossRef] [Green Version]
- Kang, C.-C.; Lin, J.-M.G.; Xu, Z.; Kumar, S.; Herr, A.E. Single-Cell Western Blotting after Whole-Cell Imaging to Assess Cancer Chemotherapeutic Response. Anal. Chem. 2014, 86, 10429–10436. [Google Scholar] [CrossRef] [Green Version]
- Hughes, A.J.; Spelke, D.P.; Xu, Z.; Kang, C.-C.; Schaffer, D.V.; Herr, A.E. Single-Cell Western Blotting. Nat. Methods 2014, 11, 749–755. [Google Scholar] [CrossRef] [PubMed] [Green Version]
- Hornbeck, P. Enzyme-Linked Immunosorbent Assays. Curr. Protoc. Immunol. 1992, 1, 2.1.1–2.1.22. [Google Scholar] [CrossRef] [PubMed]
- Turner, M.D.; Nedjai, B.; Hurst, T.; Pennington, D.J. Cytokines and Chemokines: At the Crossroads of Cell Signalling and Inflammatory Disease. Biochim. Et Biophys. Acta (BBA)-Mol. Cell Res. 2014, 1843, 2563–2582. [Google Scholar] [CrossRef] [Green Version]
- Sabat, R.; Grütz, G.; Warszawska, K.; Kirsch, S.; Witte, E.; Wolk, K.; Geginat, J. Biology of Interleukin-10. Cytokine Growth Factor Rev. 2010, 21, 331–344. [Google Scholar] [CrossRef] [PubMed] [Green Version]
- Popa, C.; Netea, M.G.; van Riel, P.L.C.M.; van der Meer, J.W.M.; Stalenhoef, A.F.H. The Role of TNF-α in Chronic Inflammatory Conditions, Intermediary Metabolism, and Cardiovascular Risk. J. Lipid Res. 2007, 48, 751–762. [Google Scholar] [CrossRef] [Green Version]
- Santibañez, J.F.; Quintanilla, M.; Bernabeu, C. TGF-β/TGF-β Receptor System and Its Role in Physiological and Pathological Conditions. Clin. Sci. 2011, 121, 233–251. [Google Scholar] [CrossRef] [Green Version]
- Heikkilä, K.; Ebrahim, S.; Lawlor, D.A. Systematic Review of the Association between Circulating Interleukin-6 (IL-6) and Cancer. Eur. J. Cancer 2008, 44, 937–945. [Google Scholar] [CrossRef]
- Lee, S.H.; Hong, H.S.; Liu, Z.X.; Kim, R.H.; Kang, M.K.; Park, N.-H.; Shin, K.-H. TNFα Enhances Cancer Stem Cell-like Phenotype via Notch-Hes1 Activation in Oral Squamous Cell Carcinoma Cells. Biochem. Biophys. Res. Commun. 2012, 424, 58–64. [Google Scholar] [CrossRef] [Green Version]
- Zamarron, B.F.; Chen, W. Dual Roles of Immune Cells and Their Factors in Cancer Development and Progression. Int. J. Biol. Sci. 2011, 7, 651–658. [Google Scholar] [CrossRef]
- Kupcova Skalnikova, H.; Cizkova, J.; Cervenka, J.; Vodicka, P. Advances in Proteomic Techniques for Cytokine Analysis: Focus on Melanoma Research. Int. J. Mol. Sci. 2017, 18, 2697. [Google Scholar] [CrossRef] [Green Version]
- Valekova, I.; Skalnikova, H.K.; Jarkovska, K.; Motlik, J.; Kovarova, H. Multiplex Immunoassays for Quantification of Cytokines, Growth Factors, and Other Proteins in Stem Cell Communication. In Stem Cell Renewal and Cell-Cell Communication; Methods in Molecular Biology; Turksen, K., Ed.; Springer New York: New York, NY, USA, 2014; Volume 1212, pp. 39–63. ISBN 978-1-4939-2589-6. [Google Scholar]
- Tighe, P.; Negm, O.; Todd, I.; Fairclough, L. Utility, Reliability and Reproducibility of Immunoassay Multiplex Kits. Methods 2013, 61, 23–29. [Google Scholar] [CrossRef]
- Espinoza, J.A.; Jabeen, S.; Batra, R.; Papaleo, E.; Haakensen, V.; Timmermans Wielenga, V.; Møller Talman, M.-L.; Brunner, N.; Børresen-Dale, A.-L.; Gromov, P.; et al. Cytokine Profiling of Tumor Interstitial Fluid of the Breast and Its Relationship with Lymphocyte Infiltration and Clinicopathological Characteristics. OncoImmunology 2016, 5, e1248015. [Google Scholar] [CrossRef] [PubMed]
- Zeh, H.J., III; Malehorn, D.E.; Siegfried, J.M.; Bartlett, D.L.; Lotze, M.T.; Winikoff, S.E.; Lokshin, A.; Bigbee, W.L. Serum SELDI-TOF-MS Expression Profiling and Luminex Xmap® Marker Panel Classification Analysis of Pancreatic Cancer Patients and Controls. Cancer Res. 2004, 64, 821–822. [Google Scholar]
- Lehmann, J.S.; Zhao, A.; Sun, B.; Jiang, W.; Ji, S. Multiplex Cytokine Profiling of Stimulated Mouse Splenocytes Using a Cytometric Bead-Based Immunoassay Platform. JoVE 2017, 129, 56440. [Google Scholar] [CrossRef] [PubMed] [Green Version]
- Mlynska, A.; Salciuniene, G.; Zilionyte, K.; Garberyte, S.; Strioga, M.; Intaite, B.; Barakauskiene, A.; Lazzari, G.; Dobrovolskiene, N.; Krasko, J.; et al. Chemokine Profiling in Serum from Patients with Ovarian Cancer Reveals Candidate Biomarkers for Recurrence and Immune Infiltration. Oncol. Rep. 2018, 41, 1238–1252. [Google Scholar] [CrossRef] [Green Version]
- Newman, A.M.; Liu, C.L.; Green, M.R.; Gentles, A.J.; Feng, W.; Xu, Y.; Hoang, C.D.; Diehn, M.; Alizadeh, A.A. Robust Enumeration of Cell Subsets from Tissue Expression Profiles. Nat. Methods 2015, 12, 453–457. [Google Scholar] [CrossRef] [Green Version]
- Ciriello, G.; Gatza, M.L.; Beck, A.H.; Wilkerson, M.D.; Rhie, S.K.; Pastore, A.; Zhang, H.; McLellan, M.; Yau, C.; Kandoth, C.; et al. Comprehensive Molecular Portraits of Invasive Lobular Breast Cancer. Cell 2015, 163, 506–519. [Google Scholar] [CrossRef] [Green Version]
- Saito, R.; Smith, C.C.; Utsumi, T.; Bixby, L.M.; Kardos, J.; Wobker, S.E.; Stewart, K.G.; Chai, S.; Manocha, U.; Byrd, K.M.; et al. Molecular Subtype-Specific Immunocompetent Models of High-Grade Urothelial Carcinoma Reveal Differential Neoantigen Expression and Response to Immunotherapy. Cancer Res. 2018, 78, 3954–3968. [Google Scholar] [CrossRef] [Green Version]
- Hellmann, M.D.; Callahan, M.K.; Awad, M.M.; Calvo, E.; Ascierto, P.A.; Atmaca, A.; Rizvi, N.A.; Hirsch, F.R.; Selvaggi, G.; Szustakowski, J.D.; et al. Tumor Mutational Burden and Efficacy of Nivolumab Monotherapy and in Combination with Ipilimumab in Small-Cell Lung Cancer. Cancer Cell 2018, 33, 853–861.e4. [Google Scholar] [CrossRef] [Green Version]
- Castle, J.C.; Kreiter, S.; Diekmann, J.; Löwer, M.; van de Roemer, N.; de Graaf, J.; Selmi, A.; Diken, M.; Boegel, S.; Paret, C.; et al. Exploiting the Mutanome for Tumor Vaccination. Cancer Res. 2012, 72, 1081–1091. [Google Scholar] [CrossRef] [Green Version]
- Matsushita, H.; Vesely, M.D.; Koboldt, D.C.; Rickert, C.G.; Uppaluri, R.; Magrini, V.J.; Arthur, C.D.; White, J.M.; Chen, Y.-S.; Shea, L.K.; et al. Cancer Exome Analysis Reveals a T-Cell-Dependent Mechanism of Cancer Immunoediting. Nature 2012, 482, 400–404. [Google Scholar] [CrossRef] [PubMed]
- Wang, L.; Ge, J.; Lan, Y.; Shi, Y.; Luo, Y.; Tan, Y.; Liang, M.; Deng, S.; Zhang, X.; Wang, W.; et al. Tumor Mutational Burden Is Associated with Poor Outcomes in Diffuse Glioma. BMC Cancer 2020, 20, 213. [Google Scholar] [CrossRef] [PubMed]
- Seo, J.-S.; Ju, Y.S.; Lee, W.-C.; Shin, J.-Y.; Lee, J.K.; Bleazard, T.; Lee, J.; Jung, Y.J.; Kim, J.-O.; Shin, J.-Y.; et al. The Transcriptional Landscape and Mutational Profile of Lung Adenocarcinoma. Genome Res. 2012, 22, 2109–2119. [Google Scholar] [CrossRef] [PubMed] [Green Version]
- Nakagawa, M.; Nakatani, F.; Matsunaga, H.; Seki, T.; Endo, M.; Ogawara, Y.; Machida, Y.; Katsumoto, T.; Yamagata, K.; Hattori, A.; et al. Selective Inhibition of Mutant IDH1 by DS-1001b Ameliorates Aberrant Histone Modifications and Impairs Tumor Activity in Chondrosarcoma. Oncogene 2019, 38, 6835–6849. [Google Scholar] [CrossRef] [PubMed] [Green Version]
- Unruh, D.; Zewde, M.; Buss, A.; Drumm, M.R.; Tran, A.N.; Scholtens, D.M.; Horbinski, C. Methylation and Transcription Patterns Are Distinct in IDH Mutant Gliomas Compared to Other IDH Mutant Cancers. Sci. Rep. 2019, 9, 8946. [Google Scholar] [CrossRef] [PubMed]
- Shao, F.; Huang, M.; Meng, F.; Huang, Q. Circular RNA Signature Predicts Gemcitabine Resistance of Pancreatic Ductal Adenocarcinoma. Front. Pharmacol. 2018, 9, 584. [Google Scholar] [CrossRef] [Green Version]
- Gorski, M.M.; Blighe, K.; Lotta, L.A.; Pappalardo, E.; Garagiola, I.; Mancini, I.; Mancuso, M.E.; Fasulo, M.R.; Santagostino, E.; Peyvandi, F. Whole-Exome Sequencing to Identify Genetic Risk Variants Underlying Inhibitor Development in Severe Hemophilia A Patients. Blood 2016, 127, 2924–2933. [Google Scholar] [CrossRef] [Green Version]
- LaHaye, S.; Corsmeier, D.; Basu, M.; Bowman, J.L.; Fitzgerald-Butt, S.; Zender, G.; Bosse, K.; McBride, K.L.; White, P.; Garg, V. Utilization of Whole Exome Sequencing to Identify Causative Mutations in Familial Congenital Heart Disease. Circ. Cardiovasc. Genet. 2016, 9, 320–329. [Google Scholar] [CrossRef] [Green Version]
- Gambin, T.; Akdemir, Z.C.; Yuan, B.; Gu, S.; Chiang, T.; Carvalho, C.M.B.; Shaw, C.; Jhangiani, S.; Boone, P.M.; Eldomery, M.K.; et al. Homozygous and Hemizygous CNV Detection from Exome Sequencing Data in a Mendelian Disease Cohort. Nucleic Acids Res. 2016, 45, 1633–1648. [Google Scholar] [CrossRef]
- Gupta, S.; Chatterjee, S.; Mukherjee, A.; Mutsuddi, M. Whole Exome Sequencing: Uncovering Causal Genetic Variants for Ocular Diseases. Exp. Eye Res. 2017, 164, 139–150. [Google Scholar] [CrossRef]
- Hixson, J.E.; Jun, G.; Shimmin, L.C.; Wang, Y.; Yu, G.; Mao, C.; Warren, A.S.; Howard, T.D.; Heide, R.S.V.; Van Eyk, J.; et al. Whole Exome Sequencing to Identify Genetic Variants Associated with Raised Atherosclerotic Lesions in Young Persons. Sci. Rep. 2017, 7, 4091. [Google Scholar] [CrossRef] [PubMed] [Green Version]
- Mueller, J.J.; Schlappe, B.A.; Kumar, R.; Olvera, N.; Dao, F.; Abu-Rustum, N.; Aghajanian, C.; DeLair, D.; Hussein, Y.R.; Soslow, R.A.; et al. Massively Parallel Sequencing Analysis of Mucinous Ovarian Carcinomas: Genomic Profiling and Differential Diagnoses. Gynecol. Oncol. 2018, 150, 127–135. [Google Scholar] [CrossRef] [PubMed]
- Weigelt, B.; Bi, R.; Kumar, R.; Blecua, P.; Mandelker, D.L.; Geyer, F.C.; Pareja, F.; James, P.A.; kConFab Investigators; Couch, F.J.; et al. The Landscape of Somatic Genetic Alterations in Breast Cancers From ATM Germline Mutation Carriers. JNCI J. Natl. Cancer Inst. 2018, 110, 1030–1034. [Google Scholar] [CrossRef] [PubMed] [Green Version]
- Goodwin, S.; McPherson, J.D.; McCombie, W.R. Coming of Age: Ten Years of next-Generation Sequencing Technologies. Nat. Rev. Genet. 2016, 17, 333–351. [Google Scholar] [CrossRef]
- Hargadon, K.M.; Johnson, C.E.; Williams, C.J. Immune Checkpoint Blockade Therapy for Cancer: An Overview of FDA-Approved Immune Checkpoint Inhibitors. Int. Immunopharmacol. 2018, 62, 29–39. [Google Scholar] [CrossRef]
- Meléndez, B.; Campenhout, C.V.; Rorive, S.; Remmelink, M.; Salmon, I.; D’Haene, N. Methods of Measurement for Tumor Mutational Burden in Tumor Tissue. Transl. Lung Cancer Res. 2018, 7, 661–667. [Google Scholar] [CrossRef]
- Germano, G.; Lamba, S.; Rospo, G.; Barault, L.; Magrì, A.; Maione, F.; Russo, M.; Crisafulli, G.; Bartolini, A.; Lerda, G.; et al. Inactivation of DNA Repair Triggers Neoantigen Generation and Impairs Tumour Growth. Nature 2017, 552, 116–120. [Google Scholar] [CrossRef]
- Australian Pancreatic Cancer Genome Initiative; ICGC Breast Cancer Consortium; ICGC MMML-Seq Consortium; ICGC PedBrain; Alexandrov, L.B.; Nik-Zainal, S.; Wedge, D.C.; Aparicio, S.A.J.R.; Behjati, S.; Biankin, A.V.; et al. Signatures of Mutational Processes in Human Cancer. Nature 2013, 500, 415–421. [Google Scholar] [CrossRef] [Green Version]
- Oh, B.Y.; Shin, H.-T.; Yun, J.W.; Kim, K.-T.; Kim, J.; Bae, J.S.; Cho, Y.B.; Lee, W.Y.; Yun, S.H.; Park, Y.A.; et al. Intratumor Heterogeneity Inferred from Targeted Deep Sequencing as a Prognostic Indicator. Sci. Rep. 2019, 9, 4542. [Google Scholar] [CrossRef] [Green Version]
- Goh, G.; Choi, M. Application of Whole Exome Sequencing to Identify Disease-Causing Variants in Inherited Human Diseases. Genom. Inform. 2012, 10, 214. [Google Scholar] [CrossRef] [Green Version]
- Parla, J.S.; Iossifov, I.; Grabill, I.; Spector, M.S.; Kramer, M.; McCombie, W.R. A Comparative Analysis of Exome Capture. Genome Biol. 2011, 12, R97. [Google Scholar] [CrossRef] [PubMed] [Green Version]
- Overwijk, W.W.; Theoret, M.R.; Finkelstein, S.E.; Surman, D.R.; de Jong, L.A.; Vyth-Dreese, F.A.; Dellemijn, T.A.; Antony, P.A.; Spiess, P.J.; Palmer, D.C.; et al. Tumor Regression and Autoimmunity after Reversal of a Functionally Tolerant State of Self-Reactive CD8+ T Cells. J. Exp. Med. 2003, 198, 569–580. [Google Scholar] [CrossRef] [PubMed]
- Ahmadzadeh, M.; Johnson, L.A.; Heemskerk, B.; Wunderlich, J.R.; Dudley, M.E.; White, D.E.; Rosenberg, S.A. Tumor Antigen–Specific CD8 T Cells Infiltrating the Tumor Express High Levels of PD-1 and Are Functionally Impaired. Blood 2009, 114, 1537–1544. [Google Scholar] [CrossRef] [PubMed]
- Pasetto, A.; Gros, A.; Robbins, P.F.; Deniger, D.C.; Prickett, T.D.; Matus-Nicodemos, R.; Douek, D.C.; Howie, B.; Robins, H.; Parkhurst, M.R.; et al. Tumor- and Neoantigen-Reactive T-Cell Receptors Can Be Identified Based on Their Frequency in Fresh Tumor. Cancer Immunol. Res. 2016, 4, 734–743. [Google Scholar] [CrossRef] [Green Version]
- Gros, A.; Robbins, P.F.; Yao, X.; Li, Y.F.; Turcotte, S.; Tran, E.; Wunderlich, J.R.; Mixon, A.; Farid, S.; Dudley, M.E.; et al. PD-1 Identifies the Patient-Specific CD8+ Tumor-Reactive Repertoire Infiltrating Human Tumors. J. Clin. Investig. 2014, 124, 2246–2259. [Google Scholar] [CrossRef]
- Schrama, D.; Ritter, C.; Becker, J.C. T Cell Receptor Repertoire Usage in Cancer as a Surrogate Marker for Immune Responses. Semin. Immunopathol. 2017, 39, 255–268. [Google Scholar] [CrossRef]
- Rosati, E.; Dowds, C.M.; Liaskou, E.; Henriksen, E.K.K.; Karlsen, T.H.; Franke, A. Overview of Methodologies for T-Cell Receptor Repertoire Analysis. BMC Biotechnol. 2017, 17, 61. [Google Scholar] [CrossRef]
- Pai, J.A.; Satpathy, A.T. High-Throughput and Single-Cell T Cell Receptor Sequencing Technologies. Nat. Methods 2021, 18, 881–892. [Google Scholar] [CrossRef]
- Barennes, P.; Quiniou, V.; Shugay, M.; Egorov, E.S.; Davydov, A.N.; Chudakov, D.M.; Uddin, I.; Ismail, M.; Oakes, T.; Chain, B.; et al. Benchmarking of T Cell Receptor Repertoire Profiling Methods Reveals Large Systematic Biases. Nat. Biotechnol. 2021, 39, 236–245. [Google Scholar] [CrossRef]
- Ye, J.; Ma, N.; Madden, T.L.; Ostell, J.M. IgBLAST: An Immunoglobulin Variable Domain Sequence Analysis Tool. Nucleic Acids Res. 2013, 41, W34–W40. [Google Scholar] [CrossRef] [Green Version]
- Bolotin, D.A.; Poslavsky, S.; Mitrophanov, I.; Shugay, M.; Mamedov, I.Z.; Putintseva, E.V.; Chudakov, D.M. MiXCR: Software for Comprehensive Adaptive Immunity Profiling. Nat. Methods 2015, 12, 380–381. [Google Scholar] [CrossRef] [PubMed]
- Gerritsen, B.; Pandit, A.; Andeweg, A.C.; de Boer, R.J. RTCR: A Pipeline for Complete and Accurate Recovery of T Cell Repertoires from High Throughput Sequencing Data. Bioinformatics 2016, 32, 3098–3106. [Google Scholar] [CrossRef] [PubMed] [Green Version]
- Li, H.; van der Leun, A.M.; Yofe, I.; Lubling, Y.; Gelbard-Solodkin, D.; van Akkooi, A.C.J.; van den Braber, M.; Rozeman, E.A.; Haanen, J.B.A.G.; Blank, C.U.; et al. Dysfunctional CD8 T Cells Form a Proliferative, Dynamically Regulated Compartment within Human Melanoma. Cell 2019, 176, 775–789.e18. [Google Scholar] [CrossRef] [PubMed]
- Simoni, Y.; Becht, E.; Fehlings, M.; Loh, C.Y.; Koo, S.-L.; Teng, K.W.W.; Yeong, J.P.S.; Nahar, R.; Zhang, T.; Kared, H.; et al. Bystander CD8+ T Cells Are Abundant and Phenotypically Distinct in Human Tumour Infiltrates. Nature 2018, 557, 575–579. [Google Scholar] [CrossRef] [PubMed]
- Tumeh, P.C.; Harview, C.L.; Yearley, J.H.; Shintaku, I.P.; Taylor, E.J.M.; Robert, L.; Chmielowski, B.; Spasic, M.; Henry, G.; Ciobanu, V.; et al. PD-1 Blockade Induces Responses by Inhibiting Adaptive Immune Resistance. Nature 2014, 515, 568–571. [Google Scholar] [CrossRef]
- Roh, W.; Chen, P.-L.; Reuben, A.; Spencer, C.N.; Prieto, P.A.; Miller, J.P.; Gopalakrishnan, V.; Wang, F.; Cooper, Z.A.; Reddy, S.M.; et al. Integrated Molecular Analysis of Tumor Biopsies on Sequential CTLA-4 and PD-1 Blockade Reveals Markers of Response and Resistance. Sci. Transl. Med. 2017, 9, eaah3560. [Google Scholar] [CrossRef] [Green Version]
- Yusko, E.; Vignali, M.; Wilson, R.K.; Mardis, E.R.; Hodi, F.S.; Horak, C.; Chang, H.; Woods, D.M.; Robins, H.; Weber, J. Association of Tumor Microenvironment T-Cell Repertoire and Mutational Load with Clinical Outcome after Sequential Checkpoint Blockade in Melanoma. Cancer Immunol. Res. 2019, 7, 458–465. [Google Scholar] [CrossRef]
- Valpione, S.; Mundra, P.A.; Galvani, E.; Campana, L.G.; Lorigan, P.; De Rosa, F.; Gupta, A.; Weightman, J.; Mills, S.; Dhomen, N.; et al. The T Cell Receptor Repertoire of Tumor Infiltrating T Cells Is Predictive and Prognostic for Cancer Survival. Nat. Commun. 2021, 12, 4098. [Google Scholar] [CrossRef]
- Abdolalipour, E.; Mahooti, M.; Salehzadeh, A.; Torabi, A.; Mohebbi, S.R.; Gorji, A.; Ghaemi, A. Evaluation of the Antitumor Immune Responses of Probiotic Bifidobacterium Bifidum in Human Papillomavirus-Induced Tumor Model. Microb. Pathog. 2020, 145, 104207. [Google Scholar] [CrossRef]
- Nederlof, I.; Horlings, H.M.; Curtis, C.; Kok, M. A High-Dimensional Window into the Micro-Environment of Triple Negative Breast Cancer. Cancers 2021, 13, 316. [Google Scholar] [CrossRef]
- Bommareddy, P.K.; Lowe, D.B.; Kaufman, H.L.; Rabkin, S.D.; Saha, D. Multi-Parametric Flow Cytometry Staining Procedure for Analyzing Tumor-Infiltrating Immune Cells Following Oncolytic Herpes Simplex Virus Immunotherapy in Intracranial Glioblastoma. J. Biol. Methods 2019, 6, e112. [Google Scholar] [CrossRef] [PubMed] [Green Version]
- Bonilla, D.L.; Reinin, G.; Chua, E. Full Spectrum Flow Cytometry as a Powerful Technology for Cancer Immunotherapy Research. Front. Mol. Biosci. 2021, 7, 612801. [Google Scholar] [CrossRef] [PubMed]
- Bandura, D.R.; Baranov, V.I.; Ornatsky, O.I.; Antonov, A.; Kinach, R.; Lou, X.; Pavlov, S.; Vorobiev, S.; Dick, J.E.; Tanner, S.D. Mass Cytometry: Technique for Real Time Single Cell Multitarget Immunoassay Based on Inductively Coupled Plasma Time-of-Flight Mass Spectrometry. Anal. Chem. 2009, 81, 6813–6822. [Google Scholar] [CrossRef] [PubMed]
- Irish, J.M.; Doxie, D.B. High-Dimensional Single-Cell Cancer Biology. In High-Dimensional Single Cell Analysis; Current Topics in Microbiology and, Immunology; Fienberg, H.G., Nolan, G.P., Eds.; Springer Berlin Heidelberg: Berlin/Heidelberg, Germany, 2014; Volume 377, pp. 1–21. ISBN 978-3-642-54826-0. [Google Scholar]
- Bjornson, Z.B.; Nolan, G.P.; Fantl, W.J. Single-Cell Mass Cytometry for Analysis of Immune System Functional States. Curr. Opin. Immunol. 2013, 25, 484–494. [Google Scholar] [CrossRef] [PubMed] [Green Version]
- Nair, N.; Mei, H.E.; Chen, S.-Y.; Hale, M.; Nolan, G.P.; Maecker, H.T.; Genovese, M.; Fathman, C.G.; Whiting, C.C. Mass Cytometry as a Platform for the Discovery of Cellular Biomarkers to Guide Effective Rheumatic Disease Therapy. Arthritis Res. Ther. 2015, 17, 127. [Google Scholar] [CrossRef] [Green Version]
- Ermann, J.; Rao, D.A.; Teslovich, N.C.; Brenner, M.B.; Raychaudhuri, S. Immune Cell Profiling to Guide Therapeutic Decisions in Rheumatic Diseases. Nat. Rev. Rheumatol. 2015, 11, 541–551. [Google Scholar] [CrossRef] [Green Version]
- Huang, A.C.; Postow, M.A.; Orlowski, R.J.; Mick, R.; Bengsch, B.; Manne, S.; Xu, W.; Harmon, S.; Giles, J.R.; Wenz, B.; et al. T-Cell Invigoration to Tumour Burden Ratio Associated with Anti-PD-1 Response. Nature 2017, 545, 60–65. [Google Scholar] [CrossRef] [Green Version]
- Lavin, Y.; Kobayashi, S.; Leader, A.; Amir, E.D.; Elefant, N.; Bigenwald, C.; Remark, R.; Sweeney, R.; Becker, C.D.; Levine, J.H.; et al. Innate Immune Landscape in Early Lung Adenocarcinoma by Paired Single-Cell Analyses. Cell 2017, 169, 750–765.e17. [Google Scholar] [CrossRef] [Green Version]
- Iori, V.; Frigerio, F.; Vezzani, A. Modulation of Neuronal Excitability by Immune Mediators in Epilepsy. Curr. Opin. Pharmacol. 2016, 26, 118–123. [Google Scholar] [CrossRef] [Green Version]
- Wu, Y.; Dissing-Olesen, L.; MacVicar, B.A.; Stevens, B. Microglia: Dynamic Mediators of Synapse Development and Plasticity. Trends Immunol. 2015, 36, 605–613. [Google Scholar] [CrossRef] [Green Version]
- Paolicelli, R.C.; Bolasco, G.; Pagani, F.; Maggi, L.; Scianni, M.; Panzanelli, P.; Giustetto, M.; Ferreira, T.A.; Guiducci, E.; Dumas, L.; et al. Synaptic Pruning by Microglia Is Necessary for Normal Brain Development. Science 2011, 333, 1456–1458. [Google Scholar] [CrossRef] [PubMed] [Green Version]
- Korin, B.; Ben-Shaanan, T.L.; Schiller, M.; Dubovik, T.; Azulay-Debby, H.; Boshnak, N.T.; Koren, T.; Rolls, A. High-Dimensional, Single-Cell Characterization of the Brain’s Immune Compartment. Nat. Neurosci. 2017, 20, 1300–1309. [Google Scholar] [CrossRef] [PubMed]
- Bendall, S.C.; Simonds, E.F.; Qiu, P.; Amir, E.D.; Krutzik, P.O.; Finck, R.; Bruggner, R.V.; Melamed, R.; Trejo, A.; Ornatsky, O.I.; et al. Single-Cell Mass Cytometry of Differential Immune and Drug Responses Across a Human Hematopoietic Continuum. Science 2011, 332, 687–696. [Google Scholar] [CrossRef] [Green Version]
- Mair, F.; Hartmann, F.J.; Mrdjen, D.; Tosevski, V.; Krieg, C.; Becher, B. The End of Gating? An Introduction to Automated Analysis of High Dimensional Cytometry Data: Highlights. Eur. J. Immunol. 2016, 46, 34–43. [Google Scholar] [CrossRef] [PubMed]
- Lowther, D.E.; Goods, B.A.; Lucca, L.E.; Lerner, B.A.; Raddassi, K.; van Dijk, D.; Hernandez, A.L.; Duan, X.; Gunel, M.; Coric, V.; et al. PD-1 Marks Dysfunctional Regulatory T Cells in Malignant Gliomas. JCI Insight 2016, 1, e85935. [Google Scholar] [CrossRef] [PubMed] [Green Version]
- van Unen, V.; Li, N.; Molendijk, I.; Temurhan, M.; Höllt, T.; van der Meulen-de Jong, A.E.; Verspaget, H.W.; Mearin, M.L.; Mulder, C.J.; van Bergen, J.; et al. Mass Cytometry of the Human Mucosal Immune System Identifies Tissue- and Disease-Associated Immune Subsets. Immunity 2016, 44, 1227–1239. [Google Scholar] [CrossRef] [Green Version]
- Diggins, K.E.; Ferrell, P.B.; Irish, J.M. Methods for Discovery and Characterization of Cell Subsets in High Dimensional Mass Cytometry Data. Methods 2015, 82, 55–63. [Google Scholar] [CrossRef] [PubMed] [Green Version]
- Leelatian, N.; Diggins, K.E.; Irish, J.M. Characterizing Phenotypes and Signaling Networks of Single Human Cells by Mass Cytometry. In Single Cell Protein Analysis; Methods in Molecular Biology; Singh, A.K., Chandrasekaran, A., Eds.; Springer New York: New York, NY, USA, 2015; Volume 1346, pp. 99–113. ISBN 978-1-4939-2986-3. [Google Scholar]
- Nicholas, K.J.; Greenplate, A.R.; Flaherty, D.K.; Matlock, B.K.; Juan, J.S.; Smith, R.M.; Irish, J.M.; Kalams, S.A. Multiparameter Analysis of Stimulated Human Peripheral Blood Mononuclear Cells: A Comparison of Mass and Fluorescence Cytometry: T Cells by Mass and Fluorescence Cytometry. Cytometry 2016, 89, 271–280. [Google Scholar] [CrossRef] [Green Version]
- Daud, A.I.; Loo, K.; Pauli, M.L.; Sanchez-Rodriguez, R.; Sandoval, P.M.; Taravati, K.; Tsai, K.; Nosrati, A.; Nardo, L.; Alvarado, M.D.; et al. Tumor Immune Profiling Predicts Response to Anti–PD-1 Therapy in Human Melanoma. J. Clin. Investig. 2016, 126, 3447–3452. [Google Scholar] [CrossRef]
- Wei, S.C.; Levine, J.H.; Cogdill, A.P.; Zhao, Y.; Anang, N.-A.A.S.; Andrews, M.C.; Sharma, P.; Wang, J.; Wargo, J.A.; Pe’er, D.; et al. Distinct Cellular Mechanisms Underlie Anti-CTLA-4 and Anti-PD-1 Checkpoint Blockade. Cell 2017, 170, 1120–1133.e17. [Google Scholar] [CrossRef] [Green Version]
- Sharma, A.; Subudhi, S.K.; Blando, J.; Scutti, J.; Vence, L.; Wargo, J.; Allison, J.P.; Ribas, A.; Sharma, P. Anti-CTLA-4 Immunotherapy Does Not Deplete FOXP3+ Regulatory T Cells (Tregs) in Human Cancers. Clin. Cancer Res. 2019, 25, 1233–1238. [Google Scholar] [CrossRef] [PubMed] [Green Version]
- Schelker, M.; Feau, S.; Du, J.; Ranu, N.; Klipp, E.; MacBeath, G.; Schoeberl, B.; Raue, A. Estimation of Immune Cell Content in Tumour Tissue Using Single-Cell RNA-Seq Data. Nat. Commun. 2017, 8, 2032. [Google Scholar] [CrossRef] [Green Version]
- Andrews, T.S.; Hemberg, M. Identifying Cell Populations with ScRNASeq. Mol. Asp. Med. 2018, 59, 114–122. [Google Scholar] [CrossRef]
- Patel, A.P.; Tirosh, I.; Trombetta, J.J.; Shalek, A.K.; Gillespie, S.M.; Wakimoto, H.; Cahill, D.P.; Nahed, B.V.; Curry, W.T.; Martuza, R.L.; et al. Single-Cell RNA-Seq Highlights Intratumoral Heterogeneity in Primary Glioblastoma. Science 2014, 344, 1396–1401. [Google Scholar] [CrossRef] [PubMed] [Green Version]
- Tang, F.; Barbacioru, C.; Wang, Y.; Nordman, E.; Lee, C.; Xu, N.; Wang, X.; Bodeau, J.; Tuch, B.B.; Siddiqui, A.; et al. MRNA-Seq Whole-Transcriptome Analysis of a Single Cell. Nat. Methods 2009, 6, 377–382. [Google Scholar] [CrossRef] [PubMed]
- Haque, A.; Engel, J.; Teichmann, S.A.; Lönnberg, T. A Practical Guide to Single-Cell RNA-Sequencing for Biomedical Research and Clinical Applications. Genome Med. 2017, 9, 75. [Google Scholar] [CrossRef]
- Dumitrascu, B.; Villar, S.; Mixon, D.G.; Engelhardt, B.E. Optimal Marker Gene Selection for Cell Type Discrimination in Single Cell Analyses. Nat. Commun. 2021, 12, 1186. [Google Scholar] [CrossRef]
- Ramsköld, D.; Luo, S.; Wang, Y.-C.; Li, R.; Deng, Q.; Faridani, O.R.; Daniels, G.A.; Khrebtukova, I.; Loring, J.F.; Laurent, L.C.; et al. Full-Length MRNA-Seq from Single-Cell Levels of RNA and Individual Circulating Tumor Cells. Nat. Biotechnol. 2012, 30, 777–782. [Google Scholar] [CrossRef] [Green Version]
- See, P.; Lum, J.; Chen, J.; Ginhoux, F. A Single-Cell Sequencing Guide for Immunologists. Front. Immunol. 2018, 9, 2425. [Google Scholar] [CrossRef]
- Sánchez Barea, J.; Lee, J.; Kang, D.-K. Recent Advances in Droplet-Based Microfluidic Technologies for Biochemistry and Molecular Biology. Micromachines 2019, 10, 412. [Google Scholar] [CrossRef] [Green Version]
- Guo, M.T.; Rotem, A.; Heyman, J.A.; Weitz, D.A. Droplet Microfluidics for High-Throughput Biological Assays. Lab Chip 2012, 12, 2146. [Google Scholar] [CrossRef] [PubMed]
- Hashimshony, T.; Wagner, F.; Sher, N.; Yanai, I. CEL-Seq: Single-Cell RNA-Seq by Multiplexed Linear Amplification. Cell Rep. 2012, 2, 666–673. [Google Scholar] [CrossRef] [PubMed] [Green Version]
- Islam, S.; Zeisel, A.; Joost, S.; La Manno, G.; Zajac, P.; Kasper, M.; Lönnerberg, P.; Linnarsson, S. Quantitative Single-Cell RNA-Seq with Unique Molecular Identifiers. Nat. Methods 2014, 11, 163–166. [Google Scholar] [CrossRef] [PubMed]
- Savage, P.; Blanchet-Cohen, A.; Revil, T.; Badescu, D.; Saleh, S.M.I.; Wang, Y.-C.; Zuo, D.; Liu, L.; Bertos, N.R.; Munoz-Ramos, V.; et al. A Targetable EGFR-Dependent Tumor-Initiating Program in Breast Cancer. Cell Rep. 2017, 21, 1140–1149. [Google Scholar] [CrossRef] [Green Version]
- Jerby-Arnon, L.; Shah, P.; Cuoco, M.S.; Rodman, C.; Su, M.-J.; Melms, J.C.; Leeson, R.; Kanodia, A.; Mei, S.; Lin, J.-R.; et al. A Cancer Cell Program Promotes T Cell Exclusion and Resistance to Checkpoint Blockade. Cell 2018, 175, 984–997.e24. [Google Scholar] [CrossRef] [Green Version]
- Sade-Feldman, M.; Yizhak, K.; Bjorgaard, S.L.; Ray, J.P.; de Boer, C.G.; Jenkins, R.W.; Lieb, D.J.; Chen, J.H.; Frederick, D.T.; Barzily-Rokni, M.; et al. Defining T Cell States Associated with Response to Checkpoint Immunotherapy in Melanoma. Cell 2018, 175, 998–1013.e20. [Google Scholar] [CrossRef] [Green Version]
- Peterson, V.M.; Zhang, K.X.; Kumar, N.; Wong, J.; Li, L.; Wilson, D.C.; Moore, R.; McClanahan, T.K.; Sadekova, S.; Klappenbach, J.A. Multiplexed Quantification of Proteins and Transcripts in Single Cells. Nat. Biotechnol. 2017, 35, 936–939. [Google Scholar] [CrossRef]
- Stoeckius, M.; Hafemeister, C.; Stephenson, W.; Houck-Loomis, B.; Chattopadhyay, P.K.; Swerdlow, H.; Satija, R.; Smibert, P. Simultaneous Epitope and Transcriptome Measurement in Single Cells. Nat. Methods 2017, 14, 865–868. [Google Scholar] [CrossRef] [Green Version]
- Hao, Y.; Hao, S.; Andersen-Nissen, E.; Mauck, W.M.; Zheng, S.; Butler, A.; Lee, M.J.; Wilk, A.J.; Darby, C.; Zager, M.; et al. Integrated Analysis of Multimodal Single-Cell Data. Cell 2021, 184, 3573–3587.e29. [Google Scholar] [CrossRef]
- Blighe, K.; Rana, S.; Lewis, M. EnhancedVolcano: Publication-Ready Volcano Plots with Enhanced Colouring and Labeling. R Package Version 1.14.0. 2022. Available online: https://github.com/kevinblighe/EnhancedVolcano (accessed on 22 June 2022).
- Buenrostro, J.D.; Wu, B.; Chang, H.Y.; Greenleaf, W.J. ATAC-seq: A Method for Assaying Chromatin Accessibility Genome-Wide. Curr. Protoc. Mol. Biol. 2015, 109, 21.29.1–21.29.9. [Google Scholar] [CrossRef]
- Buenrostro, J.D.; Giresi, P.G.; Zaba, L.C.; Chang, H.Y.; Greenleaf, W.J. Transposition of Native Chromatin for Fast and Sensitive Epigenomic Profiling of Open Chromatin, DNA-Binding Proteins and Nucleosome Position. Nat. Methods 2013, 10, 1213–1218. [Google Scholar] [CrossRef] [PubMed]
- Kagohara, L.T.; Zamuner, F.; Davis-Marcisak, E.F.; Sharma, G.; Considine, M.; Allen, J.; Yegnasubramanian, S.; Gaykalova, D.A.; Fertig, E.J. Correction: Integrated Single-Cell and Bulk Gene Expression and ATAC-Seq Reveals Heterogeneity and Early Changes in Pathways Associated with Resistance to Cetuximab in HNSCC-Sensitive Cell Lines. Br. J. Cancer 2020, 123, 1582–1583. [Google Scholar] [CrossRef]
- Satpathy, A.T.; Granja, J.M.; Yost, K.E.; Qi, Y.; Meschi, F.; McDermott, G.P.; Olsen, B.N.; Mumbach, M.R.; Pierce, S.E.; Corces, M.R.; et al. Massively Parallel Single-Cell Chromatin Landscapes of Human Immune Cell Development and Intratumoral T Cell Exhaustion. Nat. Biotechnol. 2019, 37, 925–936. [Google Scholar] [CrossRef]
- Guo, H.; Zhu, P.; Wu, X.; Li, X.; Wen, L.; Tang, F. Single-Cell Methylome Landscapes of Mouse Embryonic Stem Cells and Early Embryos Analyzed Using Reduced Representation Bisulfite Sequencing. Genome Res. 2013, 23, 2126–2135. [Google Scholar] [CrossRef] [PubMed] [Green Version]
- Smallwood, S.A.; Lee, H.J.; Angermueller, C.; Krueger, F.; Saadeh, H.; Peat, J.; Andrews, S.R.; Stegle, O.; Reik, W.; Kelsey, G. Single-Cell Genome-Wide Bisulfite Sequencing for Assessing Epigenetic Heterogeneity. Nat. Methods 2014, 11, 817–820. [Google Scholar] [CrossRef]
- Farlik, M.; Sheffield, N.C.; Nuzzo, A.; Datlinger, P.; Schönegger, A.; Klughammer, J.; Bock, C. Single-Cell DNA Methylome Sequencing and Bioinformatic Inference of Epigenomic Cell-State Dynamics. Cell Rep. 2015, 10, 1386–1397. [Google Scholar] [CrossRef] [Green Version]
- Rotem, A.; Ram, O.; Shoresh, N.; Sperling, R.A.; Goren, A.; Weitz, D.A.; Bernstein, B.E. Single-Cell ChIP-Seq Reveals Cell Subpopulations Defined by Chromatin State. Nat. Biotechnol. 2015, 33, 1165–1172. [Google Scholar] [CrossRef]
- Kind, J.; Pagie, L.; de Vries, S.S.; Nahidiazar, L.; Dey, S.S.; Bienko, M.; Zhan, Y.; Lajoie, B.; de Graaf, C.A.; Amendola, M.; et al. Genome-Wide Maps of Nuclear Lamina Interactions in Single Human Cells. Cell 2015, 163, 134–147. [Google Scholar] [CrossRef] [PubMed] [Green Version]
- Cusanovich, D.A.; Daza, R.; Adey, A.; Pliner, H.A.; Christiansen, L.; Gunderson, K.L.; Steemers, F.J.; Trapnell, C.; Shendure, J. Multiplex Single Cell Profiling of Chromatin Accessibility by Combinatorial Cellular Indexing. Science 2015, 348, 910–914. [Google Scholar] [CrossRef] [Green Version]
- Jin, W.; Tang, Q.; Wan, M.; Cui, K.; Zhang, Y.; Ren, G.; Ni, B.; Sklar, J.; Przytycka, T.M.; Childs, R.; et al. Genome-Wide Detection of DNase I Hypersensitive Sites in Single Cells and FFPE Tissue Samples. Nature 2015, 528, 142–146. [Google Scholar] [CrossRef] [Green Version]
- Clark, S.J.; Lee, H.J.; Smallwood, S.A.; Kelsey, G.; Reik, W. Single-Cell Epigenomics: Powerful New Methods for Understanding Gene Regulation and Cell Identity. Genome Biol. 2016, 17, 72. [Google Scholar] [CrossRef] [PubMed] [Green Version]
- Bashashati, A.; Brinkman, R.R. A Survey of Flow Cytometry Data Analysis Methods. Adv. Bioinform. 2009, 2009, 584603. [Google Scholar] [CrossRef] [PubMed] [Green Version]
- Spidlen, J.; Moore, W.; Parks, D.; Goldberg, M.; Bray, C.; Bierre, P.; Gorombey, P.; Hyun, B.; Hubbard, M.; Lange, S.; et al. Data File Standard for Flow Cytometry, Version FCS 3.1. Cytom. A 2010, 77, 97–100. [Google Scholar] [CrossRef]
- Spidlen, J.; Leif, R.C.; Moore, W.; Roederer, M.; International Society for the Advancement of Cytometry Data Standards Task Force; Brinkman, R.R. Gating-ML: XML-Based Gating Descriptions in Flow Cytometry. Cytom. A 2008, 73A, 1151–1157. [Google Scholar] [CrossRef] [PubMed]
- Hahne, F.; Khodabakhshi, A.H.; Bashashati, A.; Wong, C.-J.; Gascoyne, R.D.; Weng, A.P.; Seyfert-Margolis, V.; Bourcier, K.; Asare, A.; Lumley, T.; et al. Per-Channel Basis Normalization Methods for Flow Cytometry Data. Cytom. A 2009, 77A, 121–131. [Google Scholar] [CrossRef] [Green Version]
- Hahne, F.; LeMeur, N.; Brinkman, R.R.; Ellis, B.; Haaland, P.; Sarkar, D.; Spidlen, J.; Strain, E.; Gentleman, R. FlowCore: A Bioconductor Package for High Throughput Flow Cytometry. BMC Bioinform. 2009, 10, 106. [Google Scholar] [CrossRef] [PubMed] [Green Version]
- Finak, G.; Jiang, W.; Pardo, J.; Asare, A.; Gottardo, R. QUAliFiER: An Automated Pipeline for Quality Assessment of Gated Flow Cytometry Data. BMC Bioinform. 2012, 13, 252. [Google Scholar] [CrossRef] [Green Version]
- Monaco, G.; Chen, H.; Poidinger, M.; Chen, J.; de Magalhães, J.P.; Larbi, A. FlowAI: Automatic and Interactive Anomaly Discerning Tools for Flow Cytometry Data. Bioinformatics 2016, 32, 2473–2480. [Google Scholar] [CrossRef] [Green Version]
- Fletez-Brant, K.; Špidlen, J.; Brinkman, R.R.; Roederer, M.; Chattopadhyay, P.K. FlowClean: Automated Identification and Removal of Fluorescence Anomalies in Flow Cytometry Data. Cytom. A 2016, 89, 461–471. [Google Scholar] [CrossRef]
- Frelinger, J.; Ottinger, J.; Gouttefangeas, C.; Chan, C. Modeling Flow Cytometry Data for Cancer Vaccine Immune Monitoring. Cancer Immunol. Immunother. 2010, 59, 1435–1441. [Google Scholar] [CrossRef] [Green Version]
- Meehan, S.; Walther, G.; Moore, W.; Orlova, D.; Meehan, C.; Parks, D.; Ghosn, E.; Philips, M.; Mitsunaga, E.; Waters, J.; et al. AutoGate: Automating Analysis of Flow Cytometry Data. Immunol. Res. 2014, 58, 218–223. [Google Scholar] [CrossRef] [PubMed] [Green Version]
- Aghaeepour, N.; Nikolic, R.; Hoos, H.H.; Brinkman, R.R. Rapid Cell Population Identification in Flow Cytometry Data. Cytom. A 2011, 79, 6–13. [Google Scholar] [CrossRef] [PubMed] [Green Version]
- Pyne, S.; Hu, X.; Wang, K.; Rossin, E.; Lin, T.-I.; Maier, L.M.; Baecher-Allan, C.; McLachlan, G.J.; Tamayo, P.; Hafler, D.A.; et al. Automated High-Dimensional Flow Cytometric Data Analysis. Proc. Natl. Acad. Sci. USA 2009, 106, 8519–8524. [Google Scholar] [CrossRef] [PubMed] [Green Version]
- Weber, L.M.; Robinson, M.D. Comparison of Clustering Methods for High-Dimensional Single-Cell Flow and Mass Cytometry Data: Comparison of High-Dim. Cytometry Clustering Methods. Cytometry 2016, 89, 1084–1096. [Google Scholar] [CrossRef] [PubMed] [Green Version]
- Malek, M.; Taghiyar, M.J.; Chong, L.; Finak, G.; Gottardo, R.; Brinkman, R.R. FlowDensity: Reproducing Manual Gating of Flow Cytometry Data by Automated Density-Based Cell Population Identification. Bioinformatics 2015, 31, 606–607. [Google Scholar] [CrossRef] [Green Version]
- Finak, G.; Frelinger, J.; Jiang, W.; Newell, E.W.; Ramey, J.; Davis, M.M.; Kalams, S.A.; De Rosa, S.C.; Gottardo, R. OpenCyto: An Open Source Infrastructure for Scalable, Robust, Reproducible, and Automated, End-to-End Flow Cytometry Data Analysis. PLoS Comput. Biol. 2014, 10, e1003806. [Google Scholar] [CrossRef] [Green Version]
- Qiu, P.; Simonds, E.F.; Bendall, S.C.; Gibbs, K.D.; Bruggner, R.V.; Linderman, M.D.; Sachs, K.; Nolan, G.P.; Plevritis, S.K. Extracting a Cellular Hierarchy from High-Dimensional Cytometry Data with SPADE. Nat. Biotechnol. 2011, 29, 886–891. [Google Scholar] [CrossRef] [Green Version]
- Bruggner, R.V.; Bodenmiller, B.; Dill, D.L.; Tibshirani, R.J.; Nolan, G.P. Automated Identification of Stratifying Signatures in Cellular Subpopulations. Proc. Natl. Acad. Sci. USA 2014, 111, E2770–E2777. [Google Scholar] [CrossRef] [Green Version]
- Azad, A.; Pyne, S.; Pothen, A. Matching Phosphorylation Response Patterns of Antigen-Receptor-Stimulated T Cells via Flow Cytometry. BMC Bioinform. 2012, 13 (Suppl. 2), S10. [Google Scholar] [CrossRef] [Green Version]
- Aghaeepour, N.; Jalali, A.; O’Neill, K.; Chattopadhyay, P.K.; Roederer, M.; Hoos, H.H.; Brinkman, R.R. RchyOptimyx: Cellular Hierarchy Optimization for Flow Cytometry. Cytom. A 2012, 81, 1022–1030. [Google Scholar] [CrossRef] [Green Version]
- Aghaeepour, N.; Chattopadhyay, P.K.; Ganesan, A.; O’Neill, K.; Zare, H.; Jalali, A.; Hoos, H.H.; Roederer, M.; Brinkman, R.R. Early Immunologic Correlates of HIV Protection Can Be Identified from Computational Analysis of Complex Multivariate T-Cell Flow Cytometry Assays. Bioinformatics 2012, 28, 1009–1016. [Google Scholar] [CrossRef]
- Hu, Z.; Jujjavarapu, C.; Hughey, J.J.; Andorf, S.; Lee, H.-C.; Gherardini, P.F.; Spitzer, M.H.; Thomas, C.G.; Campbell, J.; Dunn, P.; et al. MetaCyto: A Tool for Automated Meta-Analysis of Mass and Flow Cytometry Data. Cell Rep. 2018, 24, 1377–1388. [Google Scholar] [CrossRef] [PubMed] [Green Version]
- Sarkar, D.; Le Meur, N.; Gentleman, R. Using FlowViz to Visualize Flow Cytometry Data. Bioinformatics 2008, 24, 878–879. [Google Scholar] [CrossRef] [PubMed] [Green Version]
- Dai, M.; Thompson, R.C.; Maher, C.; Contreras-Galindo, R.; Kaplan, M.H.; Markovitz, D.M.; Omenn, G.; Meng, F. NGSQC: Cross-Platform Quality Analysis Pipeline for Deep Sequencing Data. BMC Genom. 2010, 11 (Suppl. 4), S7. [Google Scholar] [CrossRef] [PubMed] [Green Version]
- Patel, R.K.; Jain, M. NGS QC Toolkit: A Toolkit for Quality Control of Next Generation Sequencing Data. PLoS ONE 2012, 7, e30619. [Google Scholar] [CrossRef]
- Dobin, A.; Davis, C.A.; Schlesinger, F.; Drenkow, J.; Zaleski, C.; Jha, S.; Batut, P.; Chaisson, M.; Gingeras, T.R. STAR: Ultrafast Universal RNA-Seq Aligner. Bioinformatics 2013, 29, 15–21. [Google Scholar] [CrossRef]
- Wang, L.; Wang, S.; Li, W. RSeQC: Quality Control of RNA-Seq Experiments. Bioinformatics 2012, 28, 2184–2185. [Google Scholar] [CrossRef] [Green Version]
- García-Alcalde, F.; Okonechnikov, K.; Carbonell, J.; Cruz, L.M.; Götz, S.; Tarazona, S.; Dopazo, J.; Meyer, T.F.; Conesa, A. Qualimap: Evaluating next-Generation Sequencing Alignment Data. Bioinformatics 2012, 28, 2678–2679. [Google Scholar] [CrossRef]
- Kim, D.; Pertea, G.; Trapnell, C.; Pimentel, H.; Kelley, R.; Salzberg, S.L. TopHat2: Accurate Alignment of Transcriptomes in the Presence of Insertions, Deletions and Gene Fusions. Genome Biol. 2013, 14, R36. [Google Scholar] [CrossRef] [Green Version]
- Grant, G.R.; Farkas, M.H.; Pizarro, A.D.; Lahens, N.F.; Schug, J.; Brunk, B.P.; Stoeckert, C.J.; Hogenesch, J.B.; Pierce, E.A. Comparative Analysis of RNA-Seq Alignment Algorithms and the RNA-Seq Unified Mapper (RUM). Bioinformatics 2011, 27, 2518–2528. [Google Scholar] [CrossRef]
- Corchete, L.A.; Rojas, E.A.; Alonso-López, D.; De Las Rivas, J.; Gutiérrez, N.C.; Burguillo, F.J. Systematic Comparison and Assessment of RNA-Seq Procedures for Gene Expression Quantitative Analysis. Sci. Rep. 2020, 10, 19737. [Google Scholar] [CrossRef] [PubMed]
- Tarazona, S.; Furió-Tarí, P.; Turrà, D.; Pietro, A.D.; Nueda, M.J.; Ferrer, A.; Conesa, A. Data Quality Aware Analysis of Differential Expression in RNA-Seq with NOISeq R/Bioc Package. Nucleic Acids Res. 2015, 43, e140. [Google Scholar] [CrossRef] [PubMed] [Green Version]
- Risso, D.; Schwartz, K.; Sherlock, G.; Dudoit, S. GC-Content Normalization for RNA-Seq Data. BMC Bioinform. 2011, 12, 480. [Google Scholar] [CrossRef] [PubMed] [Green Version]
- Roberts, A.; Pimentel, H.; Trapnell, C.; Pachter, L. Identification of Novel Transcripts in Annotated Genomes Using RNA-Seq. Bioinformatics 2011, 27, 2325–2329. [Google Scholar] [CrossRef]
- Mezlini, A.M.; Smith, E.J.M.; Fiume, M.; Buske, O.; Savich, G.L.; Shah, S.; Aparicio, S.; Chiang, D.Y.; Goldenberg, A.; Brudno, M. IReckon: Simultaneous Isoform Discovery and Abundance Estimation from RNA-Seq Data. Genome Res. 2013, 23, 519–529. [Google Scholar] [CrossRef] [Green Version]
- Li, J.J.; Jiang, C.-R.; Brown, J.B.; Huang, H.; Bickel, P.J. Sparse Linear Modeling of Next-Generation MRNA Sequencing (RNA-Seq) Data for Isoform Discovery and Abundance Estimation. Proc. Natl. Acad. Sci. USA 2011, 108, 19867–19872. [Google Scholar] [CrossRef] [Green Version]
- Pertea, M.; Pertea, G.M.; Antonescu, C.M.; Chang, T.-C.; Mendell, J.T.; Salzberg, S.L. StringTie Enables Improved Reconstruction of a Transcriptome from RNA-Seq Reads. Nat. Biotechnol. 2015, 33, 290–295. [Google Scholar] [CrossRef] [Green Version]
- Stanke, M.; Keller, O.; Gunduz, I.; Hayes, A.; Waack, S.; Morgenstern, B. AUGUSTUS: Ab Initio Prediction of Alternative Transcripts. Nucleic Acids Res. 2006, 34, W435–W439. [Google Scholar] [CrossRef] [Green Version]
- Engström, P.G.; Steijger, T.; Sipos, B.; Grant, G.R.; Kahles, A.; Rätsch, G.; Goldman, N.; Hubbard, T.J.; Harrow, J.; Guigó, R.; et al. Systematic Evaluation of Spliced Alignment Programs for RNA-Seq Data. Nat. Methods 2013, 10, 1185–1191. [Google Scholar] [CrossRef]
- Patro, R.; Mount, S.M.; Kingsford, C. Sailfish Enables Alignment-Free Isoform Quantification from RNA-Seq Reads Using Lightweight Algorithms. Nat. Biotechnol. 2014, 32, 462–464. [Google Scholar] [CrossRef] [Green Version]
- Anders, S.; Pyl, P.T.; Huber, W. HTSeq—A Python Framework to Work with High-Throughput Sequencing Data. Bioinformatics 2015, 31, 166–169. [Google Scholar] [CrossRef] [PubMed]
- Liao, Y.; Smyth, G.K.; Shi, W. FeatureCounts: An Efficient General Purpose Program for Assigning Sequence Reads to Genomic Features. Bioinformatics 2014, 30, 923–930. [Google Scholar] [CrossRef] [PubMed] [Green Version]
- Li, B.; Dewey, C.N. RSEM: Accurate Transcript Quantification from RNA-Seq Data with or without a Reference Genome. BMC Bioinform. 2011, 12, 323. [Google Scholar] [CrossRef] [PubMed] [Green Version]
- Roberts, A.; Pachter, L. Streaming Fragment Assignment for Real-Time Analysis of Sequencing Experiments. Nat. Methods 2013, 10, 71–73. [Google Scholar] [CrossRef] [Green Version]
- Bullard, J.H.; Purdom, E.; Hansen, K.D.; Dudoit, S. Evaluation of Statistical Methods for Normalization and Differential Expression in MRNA-Seq Experiments. BMC Bioinform. 2010, 11, 94. [Google Scholar] [CrossRef] [PubMed] [Green Version]
- Hansen, K.D.; Brenner, S.E.; Dudoit, S. Biases in Illumina Transcriptome Sequencing Caused by Random Hexamer Priming. Nucleic Acids Res. 2010, 38, e131. [Google Scholar] [CrossRef] [Green Version]
- Robinson, M.D.; Oshlack, A. A Scaling Normalization Method for Differential Expression Analysis of RNA-Seq Data. Genome Biol. 2010, 11, R25. [Google Scholar] [CrossRef] [Green Version]
- Anders, S.; Huber, W. Differential Expression Analysis for Sequence Count Data. Genome Biol. 2010, 11, R106. [Google Scholar] [CrossRef] [Green Version]
- Li, J.; Witten, D.M.; Johnstone, I.M.; Tibshirani, R. Normalization, Testing, and False Discovery Rate Estimation for RNA-Sequencing Data. Biostatistics 2012, 13, 523–538. [Google Scholar] [CrossRef]
- Steijger, T.; Abril, J.F.; Engström, P.G.; Kokocinski, F.; RGASP Consortium; Hubbard, T.J.; Guigó, R.; Harrow, J.; Bertone, P. Assessment of Transcript Reconstruction Methods for RNA-Seq. Nat. Methods 2013, 10, 1177–1184. [Google Scholar] [CrossRef] [Green Version]
- Auer, P.L.; Doerge, R.W. Statistical Design and Analysis of RNA Sequencing Data. Genetics 2010, 185, 405–416. [Google Scholar] [CrossRef] [Green Version]
- Johnson, W.E.; Li, C.; Rabinovic, A. Adjusting Batch Effects in Microarray Expression Data Using Empirical Bayes Methods. Biostatistics 2007, 8, 118–127. [Google Scholar] [CrossRef]
- Nueda, M.J.; Ferrer, A.; Conesa, A. ARSyN: A Method for the Identification and Removal of Systematic Noise in Multifactorial Time Course Microarray Experiments. Biostatistics 2012, 13, 553–566. [Google Scholar] [CrossRef]
- Robinson, M.D.; Smyth, G.K. Moderated Statistical Tests for Assessing Differences in Tag Abundance. Bioinformatics 2007, 23, 2881–2887. [Google Scholar] [CrossRef] [Green Version]
- Tarazona, S.; García-Alcalde, F.; Dopazo, J.; Ferrer, A.; Conesa, A. Differential Expression in RNA-Seq: A Matter of Depth. Genome Res. 2011, 21, 2213–2223. [Google Scholar] [CrossRef] [Green Version]
- Li, J.; Tibshirani, R. Finding Consistent Patterns: A Nonparametric Approach for Identifying Differential Expression in RNA-Seq Data. Stat. Methods Med. Res. 2013, 22, 519–536. [Google Scholar] [CrossRef] [Green Version]
- Soneson, C.; Delorenzi, M. A Comparison of Methods for Differential Expression Analysis of RNA-Seq Data. BMC Bioinform. 2013, 14, 91. [Google Scholar] [CrossRef] [Green Version]
- Rapaport, F.; Khanin, R.; Liang, Y.; Pirun, M.; Krek, A.; Zumbo, P.; Mason, C.E.; Socci, N.D.; Betel, D. Comprehensive Evaluation of Differential Gene Expression Analysis Methods for RNA-Seq Data. Genome Biol. 2013, 14, R95. [Google Scholar] [CrossRef] [Green Version]
- Seyednasrollah, F.; Laiho, A.; Elo, L.L. Comparison of Software Packages for Detecting Differential Expression in RNA-Seq Studies. Brief. Bioinform. 2015, 16, 59–70. [Google Scholar] [CrossRef] [Green Version]
- Baik, B.; Yoon, S.; Nam, D. Benchmarking RNA-Seq Differential Expression Analysis Methods Using Spike-in and Simulation Data. PLoS ONE 2020, 15, e0232271. [Google Scholar] [CrossRef]
- Kent, W.J.; Sugnet, C.W.; Furey, T.S.; Roskin, K.M.; Pringle, T.H.; Zahler, A.M.; Haussler, D. The Human Genome Browser at UCSC. Genome Res. 2002, 12, 996–1006. [Google Scholar] [CrossRef] [Green Version]
- Thorvaldsdóttir, H.; Robinson, J.T.; Mesirov, J.P. Integrative Genomics Viewer (IGV): High-Performance Genomics Data Visualization and Exploration. Brief. Bioinform. 2013, 14, 178–192. [Google Scholar] [CrossRef] [Green Version]
- Medina, I.; Salavert, F.; Sanchez, R.; de Maria, A.; Alonso, R.; Escobar, P.; Bleda, M.; Dopazo, J. Genome Maps, a New Generation Genome Browser. Nucleic Acids Res. 2013, 41, W41–W46. [Google Scholar] [CrossRef]
- Fiume, M.; Williams, V.; Brook, A.; Brudno, M. Savant: Genome Browser for High-Throughput Sequencing Data. Bioinformatics 2010, 26, 1938–1944. [Google Scholar] [CrossRef] [Green Version]
- Rogé, X.; Zhang, X. RNAseqViewer: Visualization Tool for RNA-Seq Data. Bioinformatics 2014, 30, 891–892. [Google Scholar] [CrossRef] [Green Version]
- Trapnell, C.; Roberts, A.; Goff, L.; Pertea, G.; Kim, D.; Kelley, D.R.; Pimentel, H.; Salzberg, S.L.; Rinn, J.L.; Pachter, L. Differential Gene and Transcript Expression Analysis of RNA-Seq Experiments with TopHat and Cufflinks. Nat. Protoc. 2012, 7, 562–578. [Google Scholar] [CrossRef] [Green Version]
- Katz, Y.; Wang, E.T.; Silterra, J.; Schwartz, S.; Wong, B.; Thorvaldsdóttir, H.; Robinson, J.T.; Mesirov, J.P.; Airoldi, E.M.; Burge, C.B. Quantitative Visualization of Alternative Exon Expression from RNA-Seq Data. Bioinformatics 2015, 31, 2400–2402. [Google Scholar] [CrossRef] [Green Version]
- Xiang, R.; Wang, W.; Yang, L.; Wang, S.; Xu, C.; Chen, X. A Comparison for Dimensionality Reduction Methods of Single-Cell RNA-Seq Data. Front. Genet. 2021, 12, 646936. [Google Scholar] [CrossRef]
- Subramanian, A.; Tamayo, P.; Mootha, V.K.; Mukherjee, S.; Ebert, B.L.; Gillette, M.A.; Paulovich, A.; Pomeroy, S.L.; Golub, T.R.; Lander, E.S.; et al. Gene Set Enrichment Analysis: A Knowledge-Based Approach for Interpreting Genome-Wide Expression Profiles. Proc. Natl. Acad. Sci. USA 2005, 102, 15545–15550. [Google Scholar] [CrossRef] [Green Version]
- Klopfenstein, D.V.; Tang, H.; Ramirez, F.; Botvinnik, O.; Pedersen-Bioinformatics, B.; Flick, P.; Sato, K.; Mungall, C.; Schmitt, U.; Stupp, G.; et al. tanghaibao/goatools: GOATOOLS v0.7.6. Zenodo 2017. [Google Scholar] [CrossRef]
- Map2slim-Maps Gene Associations to a “Slim” Ontology-Metacpan.Org. Available online: https://metacpan.org/dist/go-perl/view/scripts/map2slim (accessed on 9 April 2022).
- Maleki, F.; Ovens, K.; Hogan, D.J.; Kusalik, A.J. Gene Set Analysis: Challenges, Opportunities, and Future Research. Front. Genet. 2020, 11, 654. [Google Scholar] [CrossRef]
- Culhane, A.C.; Schroder, M.S.; Sultana, R.; Picard, S.C.; Martinelli, E.N.; Kelly, C.; Haibe-Kains, B.; Kapushesky, M.; St Pierre, A.-A.; Flahive, W.; et al. GeneSigDB: A Manually Curated Database and Resource for Analysis of Gene Expression Signatures. Nucleic Acids Res. 2012, 40, D1060–D1066. [Google Scholar] [CrossRef]
- Araki, H.; Knapp, C.; Tsai, P.; Print, C. GeneSetDB: A Comprehensive Meta-Database, Statistical and Visualisation Framework for Gene Set Analysis. FEBS Open Bio 2012, 2, 76–82. [Google Scholar] [CrossRef] [Green Version]
- Sheth, R.A.; Baerlocher, M.O.; Connolly, B.L.; Dariushnia, S.R.; Shyn, P.B.; Vatsky, S.; Tam, A.L.; Gupta, S. Society of Interventional Radiology Quality Improvement Standards on Percutaneous Needle Biopsy in Adult and Pediatric Patients. J. Vasc. Interv. Radiol. 2020, 31, 1840–1848. [Google Scholar] [CrossRef]
- Weinfurtner, K.; Cho, J.; Ackerman, D.; Chen, J.X.; Woodard, A.; Li, W.; Ostrowski, D.; Soulen, M.C.; Dagli, M.; Shamimi-Noori, S.; et al. Variability in Biopsy Quality Informs Translational Research Applications in Hepatocellular Carcinoma. Sci. Rep. 2021, 11, 22763. [Google Scholar] [CrossRef]
- Australian Pancreatic Cancer Genome Initiative; Biankin, A.V.; Waddell, N.; Kassahn, K.S.; Gingras, M.-C.; Muthuswamy, L.B.; Johns, A.L.; Miller, D.K.; Wilson, P.J.; Patch, A.-M.; et al. Pancreatic Cancer Genomes Reveal Aberrations in Axon Guidance Pathway Genes. Nature 2012, 491, 399–405. [Google Scholar] [CrossRef]
- Gerlinger, M.; Rowan, A.J.; Horswell, S.; Larkin, J.; Endesfelder, D.; Gronroos, E.; Martinez, P.; Matthews, N.; Stewart, A.; Tarpey, P.; et al. Intratumor Heterogeneity and Branched Evolution Revealed by Multiregion Sequencing. N. Engl. J. Med. 2012, 366, 883–892. [Google Scholar] [CrossRef] [Green Version]
- Tanimoto, K.; Yoshikawa, K.; Obata, T.; Ikehira, H.; Shiraishi, T.; Watanabe, K.; Saga, T.; Mizoe, J.; Kamada, T.; Kato, A.; et al. Role of Glucose Metabolism and Cellularity for Tumor Malignancy Evaluation Using FDG-PET/CT and MRI. Nucl. Med. Commun. 2010, 31, 604–609. [Google Scholar] [CrossRef]
- Zelenetz, A.D.; Gordon, L.I.; Chang, J.E.; Christian, B.; Abramson, J.S.; Advani, R.H.; Bartlett, N.L.; Budde, L.E.; Caimi, P.F.; De Vos, S.; et al. NCCN Guidelines® Insights: B-Cell Lymphomas, Version 5.2021: Featured Updates to the NCCN Guidelines. J. Natl. Compr. Cancer Netw. 2021, 19, 1218–1230. [Google Scholar] [CrossRef]
- Havel, J.J.; Chowell, D.; Chan, T.A. The Evolving Landscape of Biomarkers for Checkpoint Inhibitor Immunotherapy. Nat. Rev. Cancer 2019, 19, 133–150. [Google Scholar] [CrossRef]
- Tischfield, D.J.; Gurevich, A.; Johnson, O.; Gatmaytan, I.; Nadolski, G.J.; Soulen, M.C.; Kaplan, D.E.; Furth, E.; Hunt, S.J.; Gade, T.P.F. Transarterial Embolization Modulates the Immune Response within Target and Nontarget Hepatocellular Carcinomas in a Rat Model. Radiology 2022, 303, 215–225. [Google Scholar] [CrossRef]
- Dumolard, L.; Ghelfi, J.; Roth, G.; Decaens, T.; Macek Jilkova, Z. Percutaneous Ablation-Induced Immunomodulation in Hepatocellular Carcinoma. Int. J. Mol. Sci. 2020, 21, 4398. [Google Scholar] [CrossRef]
- Campbell, M.T.; Matin, S.F.; Tam, A.L.; Sheth, R.A.; Ahrar, K.; Tidwell, R.S.; Rao, P.; Karam, J.A.; Wood, C.G.; Tannir, N.M.; et al. Pilot Study of Tremelimumab with and without Cryoablation in Patients with Metastatic Renal Cell Carcinoma. Nat. Commun. 2021, 12, 6375. [Google Scholar] [CrossRef]
- Chu, K.F.; Dupuy, D.E. Thermal Ablation of Tumours: Biological Mechanisms and Advances in Therapy. Nat. Rev. Cancer 2014, 14, 199–208. [Google Scholar] [CrossRef]
- Waitz, R.; Solomon, S.B.; Petre, E.N.; Trumble, A.E.; Fassò, M.; Norton, L.; Allison, J.P. Potent Induction of Tumor Immunity by Combining Tumor Cryoablation with Anti-CTLA-4 Therapy. Cancer Res. 2012, 72, 430–439. [Google Scholar] [CrossRef] [Green Version]
- Duffy, A.G.; Ulahannan, S.V.; Makorova-Rusher, O.; Rahma, O.; Wedemeyer, H.; Pratt, D.; Davis, J.L.; Hughes, M.S.; Heller, T.; ElGindi, M.; et al. Tremelimumab in Combination with Ablation in Patients with Advanced Hepatocellular Carcinoma. J. Hepatol. 2017, 66, 545–551. [Google Scholar] [CrossRef] [Green Version]
- Kepp, O.; Marabelle, A.; Zitvogel, L.; Kroemer, G. Oncolysis without Viruses-Inducing Systemic Anticancer Immune Responses with Local Therapies. Nat. Rev. Clin. Oncol. 2020, 17, 49–64. [Google Scholar] [CrossRef]
- Li, L.; Wang, W.; Pan, H.; Ma, G.; Shi, X.; Xie, H.; Liu, X.; Ding, Q.; Zhou, W.; Wang, S. Microwave Ablation Combined with OK-432 Induces Th1-Type Response and Specific Antitumor Immunity in a Murine Model of Breast Cancer. J. Transl. Med. 2017, 15, 23. [Google Scholar] [CrossRef] [Green Version]
- Huang, K.W.; Jayant, K.; Lee, P.-H.; Yang, P.-C.; Hsiao, C.-Y.; Habib, N.; Sodergren, M.H. Positive Immuno-Modulation Following Radiofrequency Assisted Liver Resection in Hepatocellular Carcinoma. J. Clin. Med. 2019, 8, 385. [Google Scholar] [CrossRef] [Green Version]
- Haen, S.P.; Gouttefangeas, C.; Schmidt, D.; Boss, A.; Clasen, S.; von Herbay, A.; Kosan, B.; Aebert, H.; Pereira, P.L.; Rammensee, H.-G. Elevated Serum Levels of Heat Shock Protein 70 Can Be Detected after Radiofrequency Ablation. Cell Stress Chaperones 2011, 16, 495–504. [Google Scholar] [CrossRef] [Green Version]
- Mizukoshi, E.; Yamashita, T.; Arai, K.; Sunagozaka, H.; Ueda, T.; Arihara, F.; Kagaya, T.; Yamashita, T.; Fushimi, K.; Kaneko, S. Enhancement of Tumor-Associated Antigen-Specific T Cell Responses by Radiofrequency Ablation of Hepatocellular Carcinoma. Hepatology 2013, 57, 1448–1457. [Google Scholar] [CrossRef] [PubMed] [Green Version]
- Rochigneux, P.; Nault, J.-C.; Mallet, F.; Chretien, A.-S.; Barget, N.; Garcia, A.J.; Del Pozo, L.; Bourcier, V.; Blaise, L.; Grando-Lemaire, V.; et al. Dynamic of Systemic Immunity and Its Impact on Tumor Recurrence after Radiofrequency Ablation of Hepatocellular Carcinoma. OncoImmunology 2019, 8, 1615818. [Google Scholar] [CrossRef] [PubMed] [Green Version]
- Tu, J.-F.; Ding, Y.-H.; Ying, X.-H.; Wu, F.-Z.; Zhou, X.-M.; Zhang, D.-K.; Zou, H.; Ji, J.-S. Regulatory T Cells, Especially ICOS+ FOXP3+ Regulatory T Cells, Are Increased in the Hepatocellular Carcinoma Microenvironment and Predict Reduced Survival. Sci. Rep. 2016, 6, 35056. [Google Scholar] [CrossRef]
- Ahmad, F.; Gravante, G.; Bhardwaj, N.; Strickland, A.; Basit, R.; West, K.; Sorge, R.; Dennison, A.R.; Lloyd, D.M. Changes in Interleukin-1β and 6 after Hepatic Microwave Tissue Ablation Compared with Radiofrequency, Cryotherapy and Surgical Resections. Am. J. Surg. 2010, 200, 500–506. [Google Scholar] [CrossRef] [PubMed]
- Ahmad, F.; Gravante, G.; Bhardwaj, N.; Strickland, A.; Basit, R.; West, K.; Sorge, R.; Dennison, A.R.; Lloyd, D.M. Renal Effects of Microwave Ablation Compared with Radiofrequency, Cryotherapy and Surgical Resection at Different Volumes of the Liver Treated: Renal Damage after Liver Ablation. Liver Int. 2010, 30, 1305–1314. [Google Scholar] [CrossRef]
- Dong, B.W.; Zhang, J.; Liang, P.; Yu, X.L.; Su, L.; Yu, D.J.; Ji, X.L.; Yu, G. Sequential Pathological and Immunologic Analysis of Percutaneous Microwave Coagulation Therapy of Hepatocellular Carcinoma. Int. J. Hyperthermia 2003, 19, 119–133. [Google Scholar] [CrossRef]
- Zhang, H.; Hou, X.; Cai, H.; Zhuang, X. Effects of Microwave Ablation on T-Cell Subsets and Cytokines of Patients with Hepatocellular Carcinoma. Minim. Invasive Ther. Allied Technol. 2017, 26, 207–211. [Google Scholar] [CrossRef]
- Erinjeri, J.P.; Thomas, C.T.; Samoilia, A.; Fleisher, M.; Gonen, M.; Sofocleous, C.T.; Thornton, R.H.; Siegelbaum, R.H.; Covey, A.M.; Brody, L.A.; et al. Image-Guided Thermal Ablation of Tumors Increases the Plasma Level of Interleukin-6 and Interleukin-10. J. Vasc. Interv. Radiol. 2013, 24, 1105–1112. [Google Scholar] [CrossRef] [Green Version]
- Zhou, L.; Fu, J.-L.; Lu, Y.-Y.; Fu, B.-Y.; Wang, C.-P.; An, L.-J.; Wang, X.-Z.; Zeng, Z.; Zhou, C.-B.; Yang, Y.-P.; et al. Regulatory T Cells Are Associated with Post-Cryoablation Prognosis in Patients with Hepatitis B Virus-Related Hepatocellular Carcinoma. J. Gastroenterol. 2010, 45, 968–978. [Google Scholar] [CrossRef]
- Sheth, R.A. Intratumoral and Oncoviral Immunotherapy. Dig. Dis. Interv. 2021, 5, 50–54. [Google Scholar] [CrossRef]
- Muñoz, N.M.; Williams, M.; Dixon, K.; Dupuis, C.; McWatters, A.; Avritscher, R.; Manrique, S.Z.; McHugh, K.; Murthy, R.; Tam, A.; et al. Influence of Injection Technique, Drug Formulation and Tumor Microenvironment on Intratumoral Immunotherapy Delivery and Efficacy. J. Immunother. Cancer 2021, 9, e001800. [Google Scholar] [CrossRef] [PubMed]


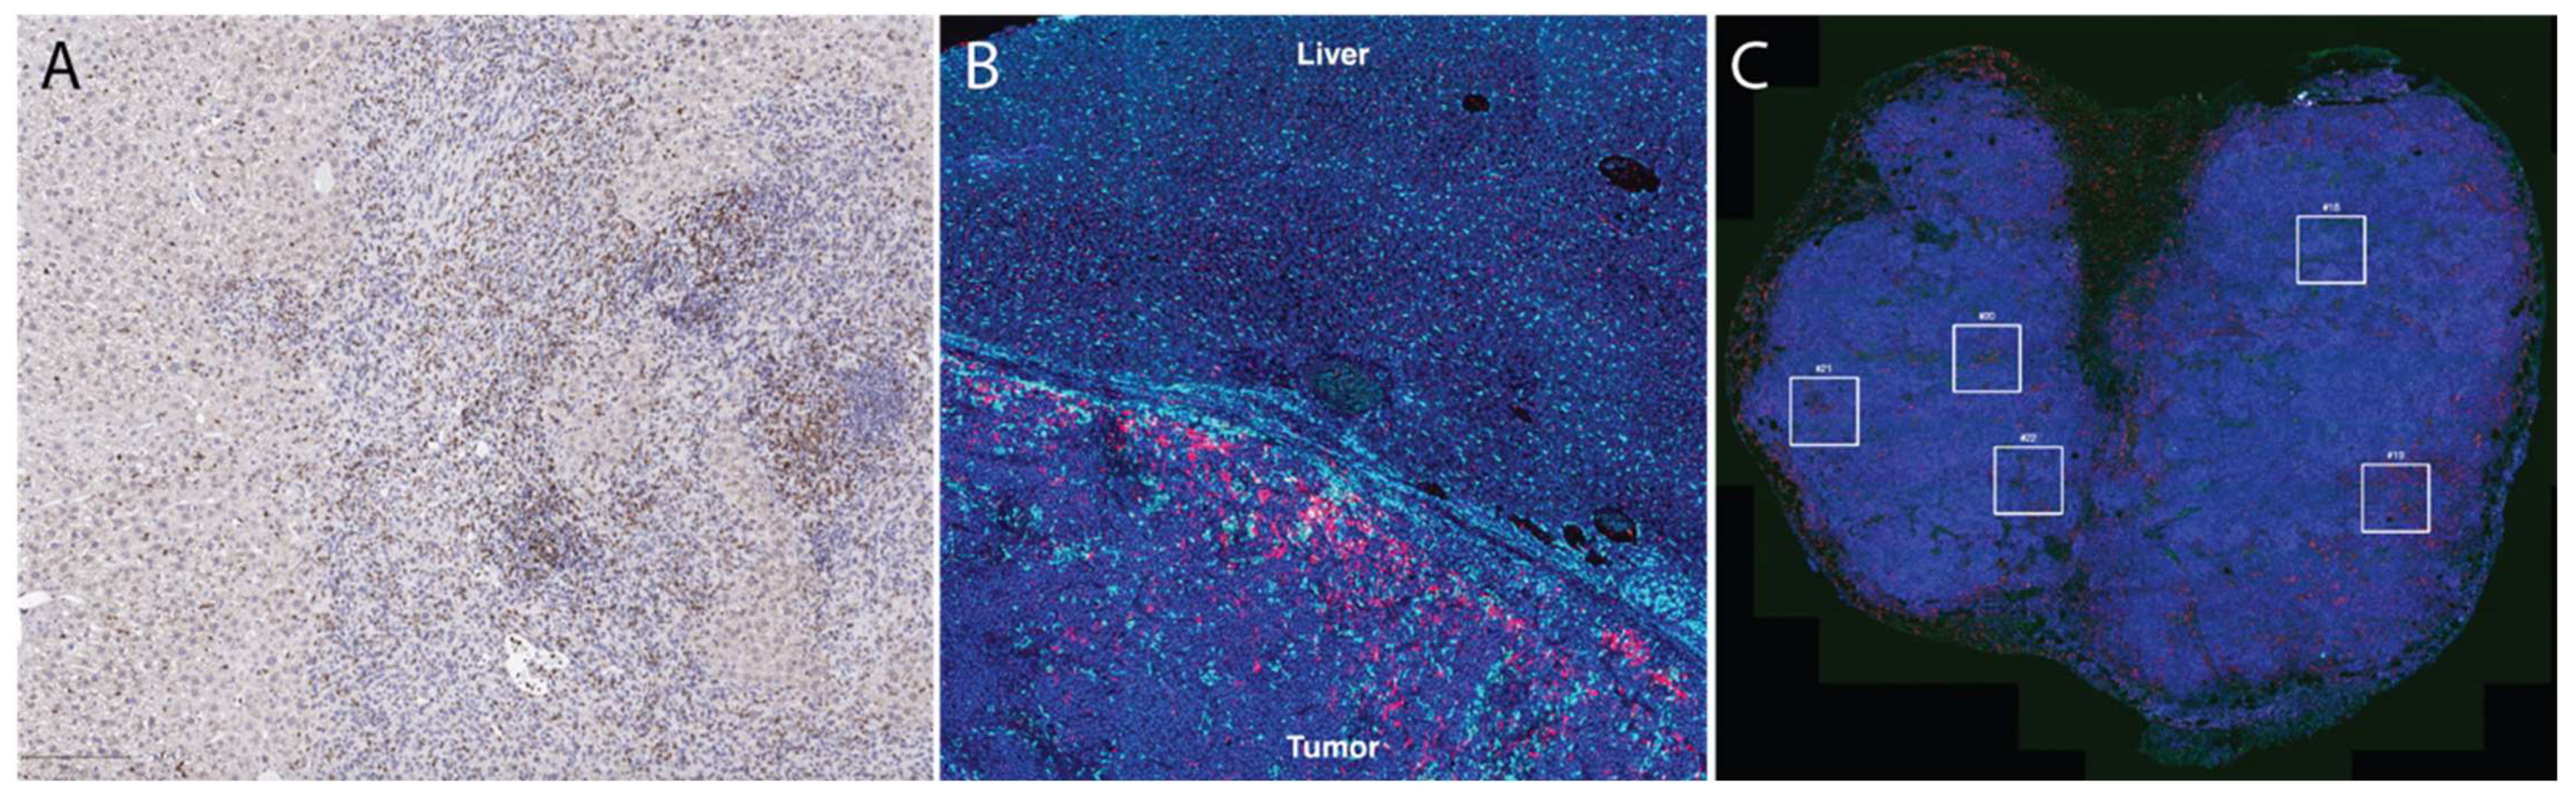
| Comparison Parameters | 10× Genomics Visium | NanoString Ge-oMX DSP |
|---|---|---|
| Tissue compatibility | Compatible with fresh frozen tissue | Compatible with fresh frozen tissue and FFPE |
| RNA quality | Needs RNA integrity number >7 | No requirements for RNA quality |
| Tissue preparation | Tissue is mounted on a specialized gene expression slide | Tissue is mounted on a standard microscope slide |
| Tissue size | 6.5 × 6.5 mm per capture area | 14.6 × 36.2 mm |
| Detection area | Within the full capture area | Within user-defined regions of interest |
| Cellular resolution | ~10 cells/feature | ~20–200 cells/region of interest |
| Direct RNA detection | Absent | Present |
| Concurrent protein detection | Present | Present |
| Technique | Tissue Requirements |
|---|---|
| Tissue Section-Based Immune Profiling | |
| Nanostring nCounter | FFPE-derived RNA: 300 ng Total RNA: 50–100 ng Fragmented DNA: 300 ng ChiP DNA: 10–100 ng (based on presence or absence of amplification) Single cell: 8 µL of amplified sample |
| Multiplex immunofluorescent (CODEX and VECTRA) | Tissue section with thickness of 5–10 µm |
| GeoMX Digital Spatial Profiler | Small cells: 10–20 cells for protein, 50–200 cells for RNA Large cells: 1–5 cells for protein, 5–20 cells for RNA |
| Visium (10× Genomics) | ≤6.5 × 6.5 mm tissue section |
| Vizgen Merscope | Tissue block size up to 1.5 cm3 |
| Matrix-assisted laser desorption ionization (MALDI) | 0.05 µL of sample mixed with 0.45 µL of matrix |
| Bulk Tissue Analysis | |
| Polymerase chain reaction | For solid tissues 25–50 mg |
| Western blots | 20–50 mg of cellular lysate |
| Enzyme immunoassay | 100 µL |
| Luminex | 25–50 µL |
| RNA-seq | >2 µg or >50 ng/µL |
| Whole exome sequencing | 500 ng |
| TCR-seq | FFPE: 25 µm in 100 µL Sorted cells: 10–25 ng/µL or 1–3 µg |
| Single-Cell Characterization | |
| Cytometry by time-of-flight | 1 × 10⁶ cells/mL |
| scRNA-seq | >1 million cells in 1 mL |
| CITE-seq | 1–2 million cells in 0.1 mL of staining buffer |
| ATAC-seq | >1 million cells in 1 mL |
Publisher’s Note: MDPI stays neutral with regard to jurisdictional claims in published maps and institutional affiliations. |
© 2022 by the authors. Licensee MDPI, Basel, Switzerland. This article is an open access article distributed under the terms and conditions of the Creative Commons Attribution (CC BY) license (https://creativecommons.org/licenses/by/4.0/).
Share and Cite
Garg, T.; Weiss, C.R.; Sheth, R.A. Techniques for Profiling the Cellular Immune Response and Their Implications for Interventional Oncology. Cancers 2022, 14, 3628. https://doi.org/10.3390/cancers14153628
Garg T, Weiss CR, Sheth RA. Techniques for Profiling the Cellular Immune Response and Their Implications for Interventional Oncology. Cancers. 2022; 14(15):3628. https://doi.org/10.3390/cancers14153628
Chicago/Turabian StyleGarg, Tushar, Clifford R. Weiss, and Rahul A. Sheth. 2022. "Techniques for Profiling the Cellular Immune Response and Their Implications for Interventional Oncology" Cancers 14, no. 15: 3628. https://doi.org/10.3390/cancers14153628