Review

Efficacy of Artificial Intelligence-Assisted Discrimination of Oral Cancerous Lesions from Normal Mucosa Based on the Oral Mucosal Image: A Systematic Review and Meta-Analysis

1
Department of Otolaryngology-Head and Neck Surgery, Eunpyeong St. Mary’s Hospital, College of Medicine, Catholic University of Korea, Seoul 03312, Korea
2
Department of Otolaryngology-Head and Neck Surgery, Bucheon St. Mary’s Hospital, College of Medicine, Catholic University of Korea, Bucheon 14647, Korea
*
Author to whom correspondence should be addressed.
Cancers 2022, 14(14), 3499; https://doi.org/10.3390/cancers14143499
Submission received: 29 June 2022 / Revised: 16 July 2022 / Accepted: 17 July 2022 / Published: 19 July 2022
(This article belongs to the Topic Artificial Intelligence in Cancer Diagnosis and Therapy)

Abstract

:

Simple Summary

Early detection of oral cancer is important to increase the survival rate and reduce morbidity. For the past few years, the early detection of oral cancer using artificial intelligence (AI) technology based on autofluorescence imaging, photographic imaging, and optical coherence tomography imaging has been an important research area. In this study, diagnostic values including sensitivity and specificity data were comprehensively confirmed in various studies that performed AI analysis of images. The diagnostic sensitivity of AI-assisted screening was 0.92. In subgroup analysis, there was no statistically significant difference in the diagnostic rate according to each image tool. AI shows good diagnostic performance with high sensitivity for oral cancer. Image analysis using AI is expected to be used as a clinical tool for early detection and evaluation of treatment efficacy for oral cancer.

Abstract

The accuracy of artificial intelligence (AI)-assisted discrimination of oral cancerous lesions from normal mucosa based on mucosal images was evaluated. Two authors independently reviewed the database until June 2022. Oral mucosal disorder, as recorded by photographic images, autofluorescence, and optical coherence tomography (OCT), was compared with the reference results by histology findings. True-positive, true-negative, false-positive, and false-negative data were extracted. Seven studies were included for discriminating oral cancerous lesions from normal mucosa. The diagnostic odds ratio (DOR) of AI-assisted screening was 121.66 (95% confidence interval [CI], 29.60; 500.05). Twelve studies were included for discriminating all oral precancerous lesions from normal mucosa. The DOR of screening was 63.02 (95% CI, 40.32; 98.49). Subgroup analysis showed that OCT was more diagnostically accurate (324.33 vs. 66.81 and 27.63) and more negatively predictive (0.94 vs. 0.93 and 0.84) than photographic images and autofluorescence on the screening for all oral precancerous lesions from normal mucosa. Automated detection of oral cancerous lesions by AI would be a rapid, non-invasive diagnostic tool that could provide immediate results on the diagnostic work-up of oral cancer. This method has the potential to be used as a clinical tool for the early diagnosis of pathological lesions.

1. Introduction

Oral cancer accounts for 4% of all malignancies and is the most common type of head and neck cancer [1]. The diagnosis of oral cancer is often delayed, resulting in a poor prognosis. It has been reported that early diagnosis increases the 5-year survival rate to 83%, but if a diagnosis is delayed and metastasis occurs, the survival rate drops to less than 30% [2]. Therefore, there is an urgent need for early and accurate detection of oral lesions and for distinguishing precancerous and cancerous tissues from normal tissues.
The conventional screening method for oral cancer is visual examination and palpation of the oral cavity. However, the accuracy of this method is highly dependent on the subjective judgment of the clinician. Diagnostic methods such as toluidine blue staining, autofluorescence, optical coherence tomography (OCT), and photographic imaging were useful as adjunctive methods for oral cancer screening [3,4,5,6].
Over the past decade, studies have increasingly showed that artificial intelligence (AI) technology is consistent with or even superior to human experts in identifying abnormal lesions in additional images of various organs [7,8,9,10,11]. These results give us hope for the potential of AI in the screening of oral cancer. However, large-scale statistical approaches to diagnostic power for using oral imaging with AI are lacking. Therefore, in this study, the sensitivity and specificity were analyzed through meta-analysis to evaluate the accuracy of detecting oral precancerous and cancerous lesions in AI-assisted oral mucosa images. We also performed subgroup analysis to determine whether accuracy differs between imaging tools.

2. Materials and Methods

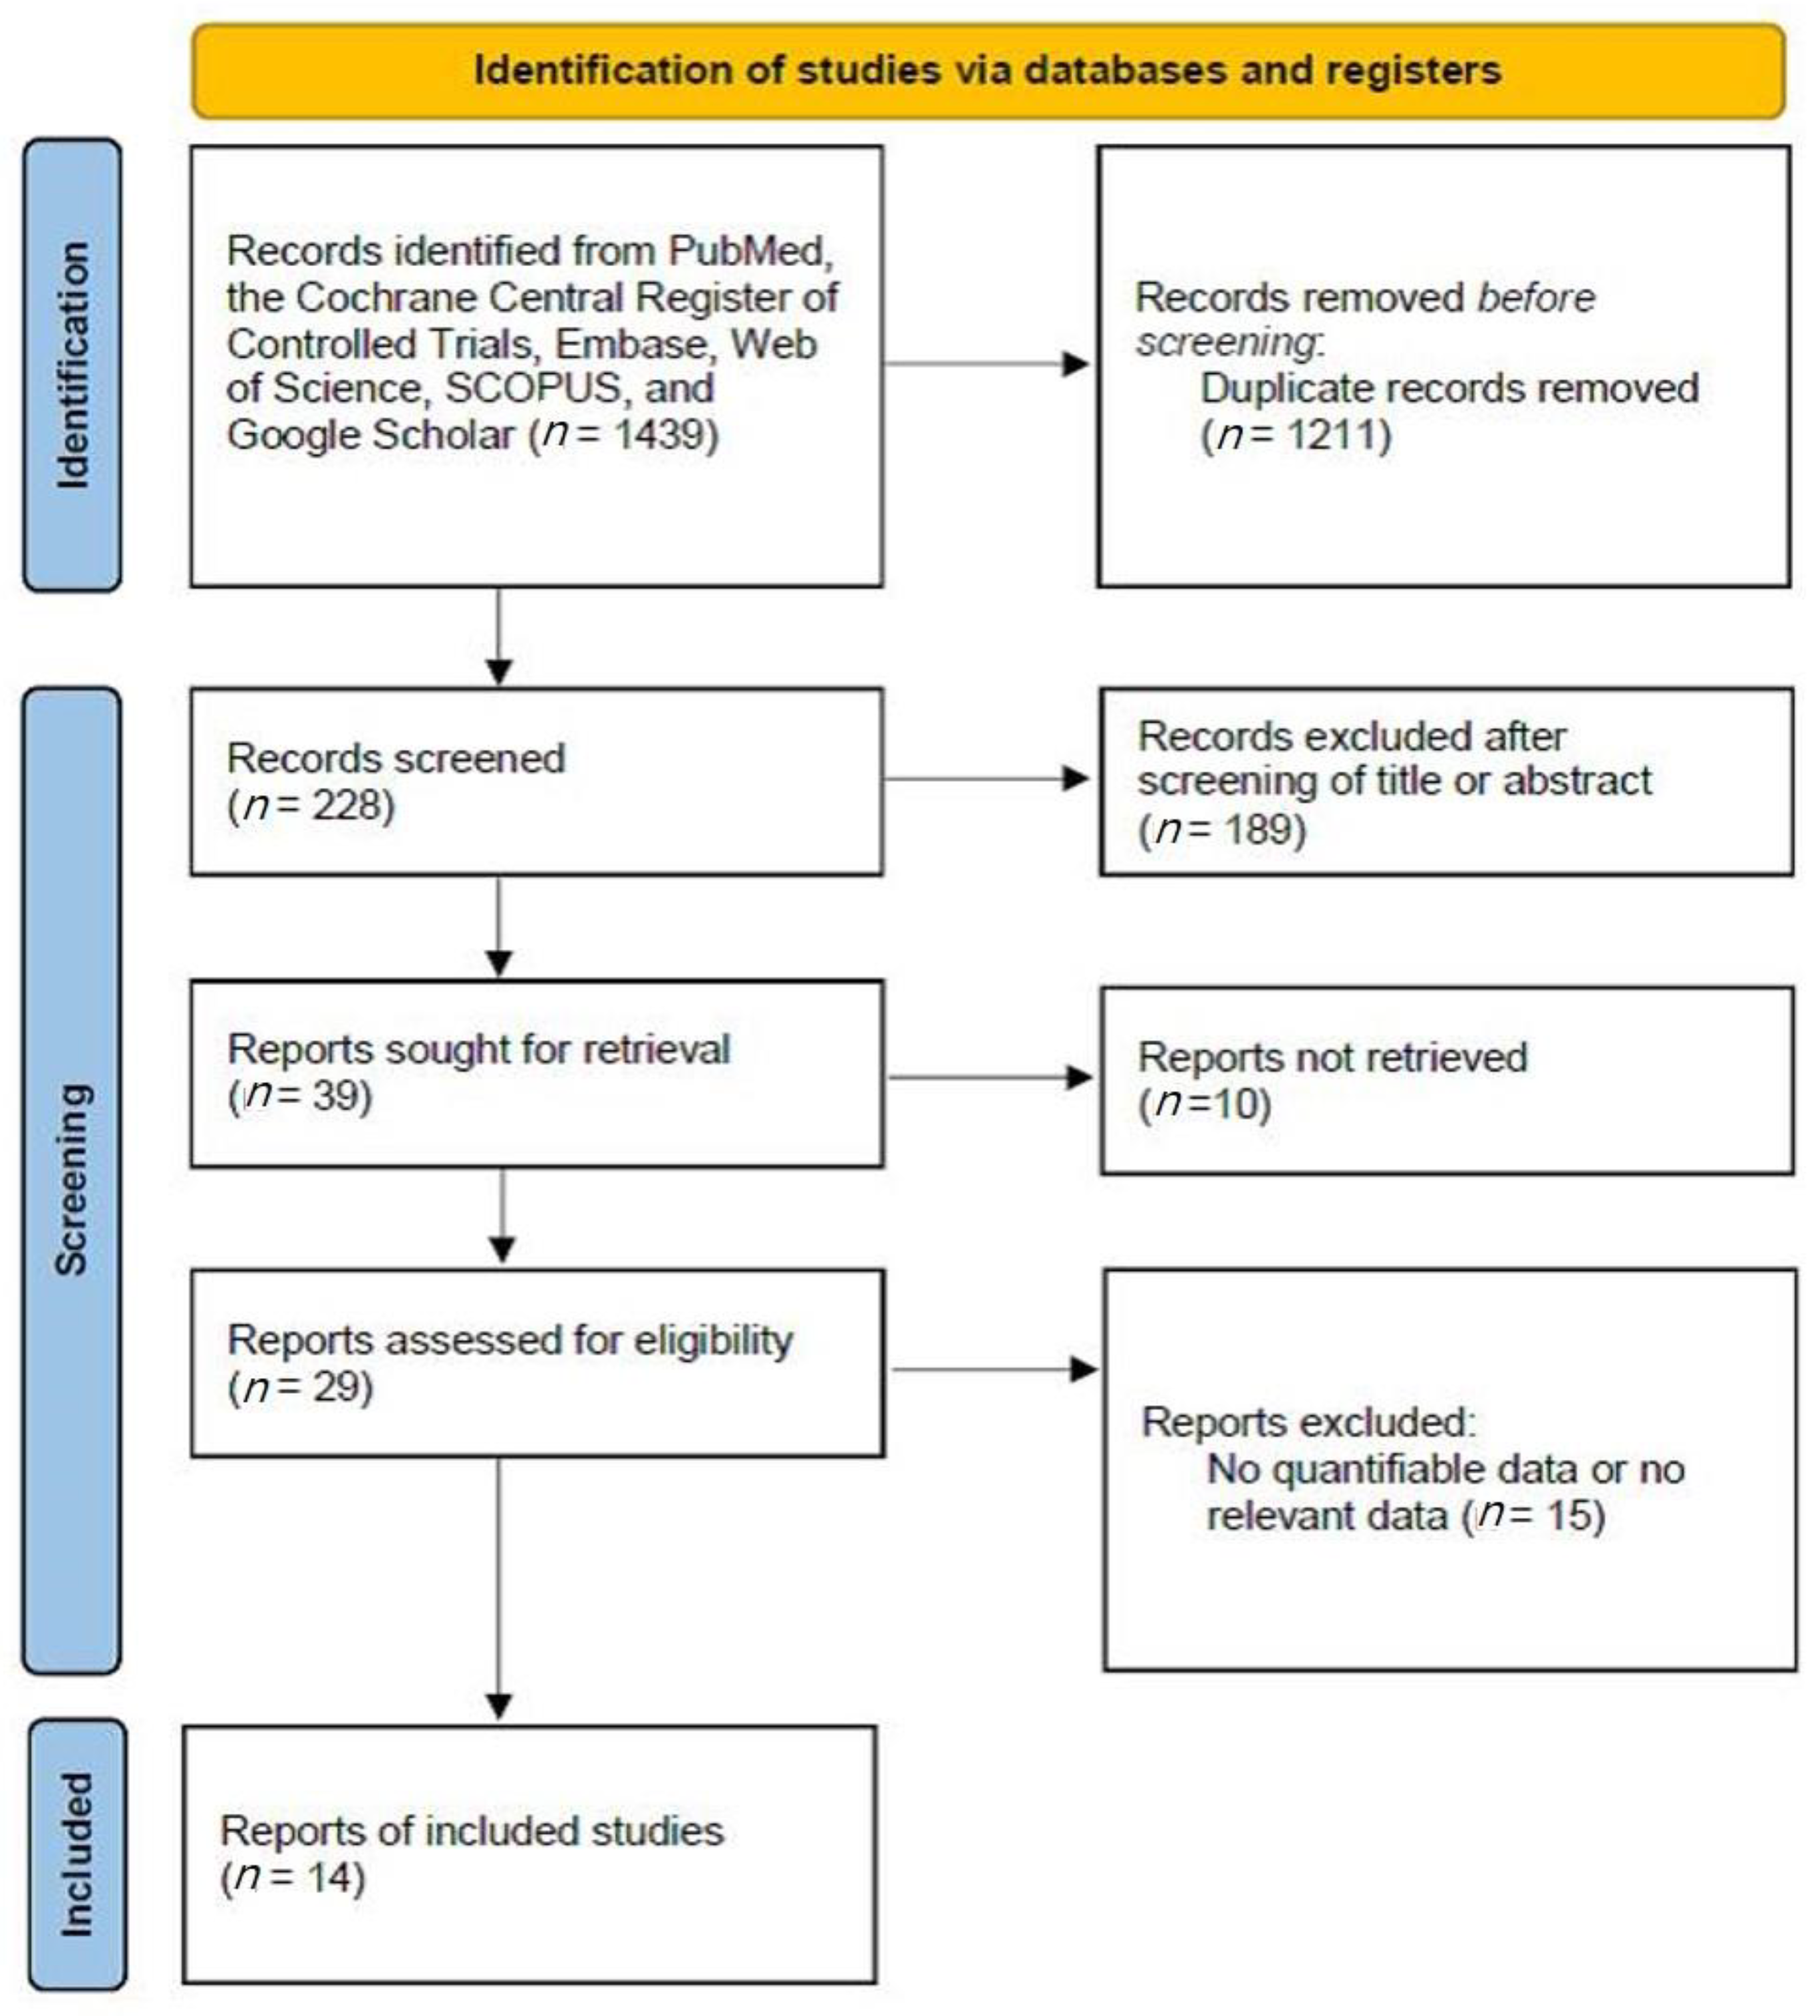
2.1. Literature Search

Searches were performed in six databases: PubMed, Embase, Web of Science, SCOPUS, Cochrane Central Register of Controlled Trials, and Google Scholar. The search terms were: “artificial intelligence”, “photo”, “optical image”, “dysplasia”, “oral precancer”, “oral cancer”, and “oral carcinoma”. The search period was set to June 2022, and data written in English were reviewed. Two independent reviewers reviewed all abstracts and titles of candidate studies. Among studies diagnosing oral cancer using images, studies that did not deal with AI were excluded.

2.2. Selection Criteria

The inclusion criteria were: (1) use of AI; (2) prospective or retrospective study protocol; (3) comparison of AI-assisted screening of oral mucosal lesions with the reference test (histology); and (4) sensitivity and specificity analyses. The exclusion criteria were: (1) case report format; (2) review article format; (3) diagnosis of other tumors (laryngeal cancer or nasal cavity tumors); and (4) lack of diagnostic AI data. The search strategy is summarized in Figure 1.

2.3. Data Extraction and Risk of Bias Assessment

All data were collected using standardized forms. As diagnostic accuracy, diagnostic odds ratio (DOR), areas under the curve (AUC), and summary receiver operating characteristic (SROC) were identified. The diagnostic performance was compared with histological examination results.
A random-effect model was used in this study. DOR represents the effectiveness of a diagnostic test. DOR is mathematically defined as (true positive/false positive)/(false negative/true negative). When DOR is greater than 1, higher values indicate better performance of the diagnostic method. A value of 1 means that the presence or absence of a disease cannot be determined and that the method cannot provide diagnostic information. To obtain an approximately normal distribution, we calculated the logarithm of each DOR and then calculated 95% confidence intervals [12]. SROC is a statistical technique used when performing a meta-analysis of studies that report both sensitivity and specificity. As the diagnostic ability of the test increases, the SROC curve shifts towards the upper-left corner of the ROC space, where both sensitivity and specificity are 1. AUC ranges from 0 to 1, with higher values indicating better diagnostic performance. We collected data on the number of patients, true-positive, true-negative, false-positive, and false-negative values in all included studies, and calculated AUCs and DORs from these values. The methodological quality of the included studies was evaluated using the Quality Assessment of Diagnostic Accuracy Study (QUADAS-2) tool.

2.4. Statistical Analysis and Outcome Measurements

R statistical software (R Foundation for Statistical Computing, Vienna, Austria) was used to conduct a meta-analysis of the studies. Homogeneity analyses were then performed using the Q statistic. Forest plots were drawn for the sensitivity, specificity, and negative predictive values, and for the SROC curves. A meta-regression analysis was performed to determine the potential influence of imaging tools on AI-based diagnostic accuracy for all premalignant lesions.

3. Results

This analysis included 14 studies [6,13,14,15,16,17,18,19,20,21,22,23,24,25]. Table 1 presents the assessment of bias. The characteristics of the studies are attached in Table S1.

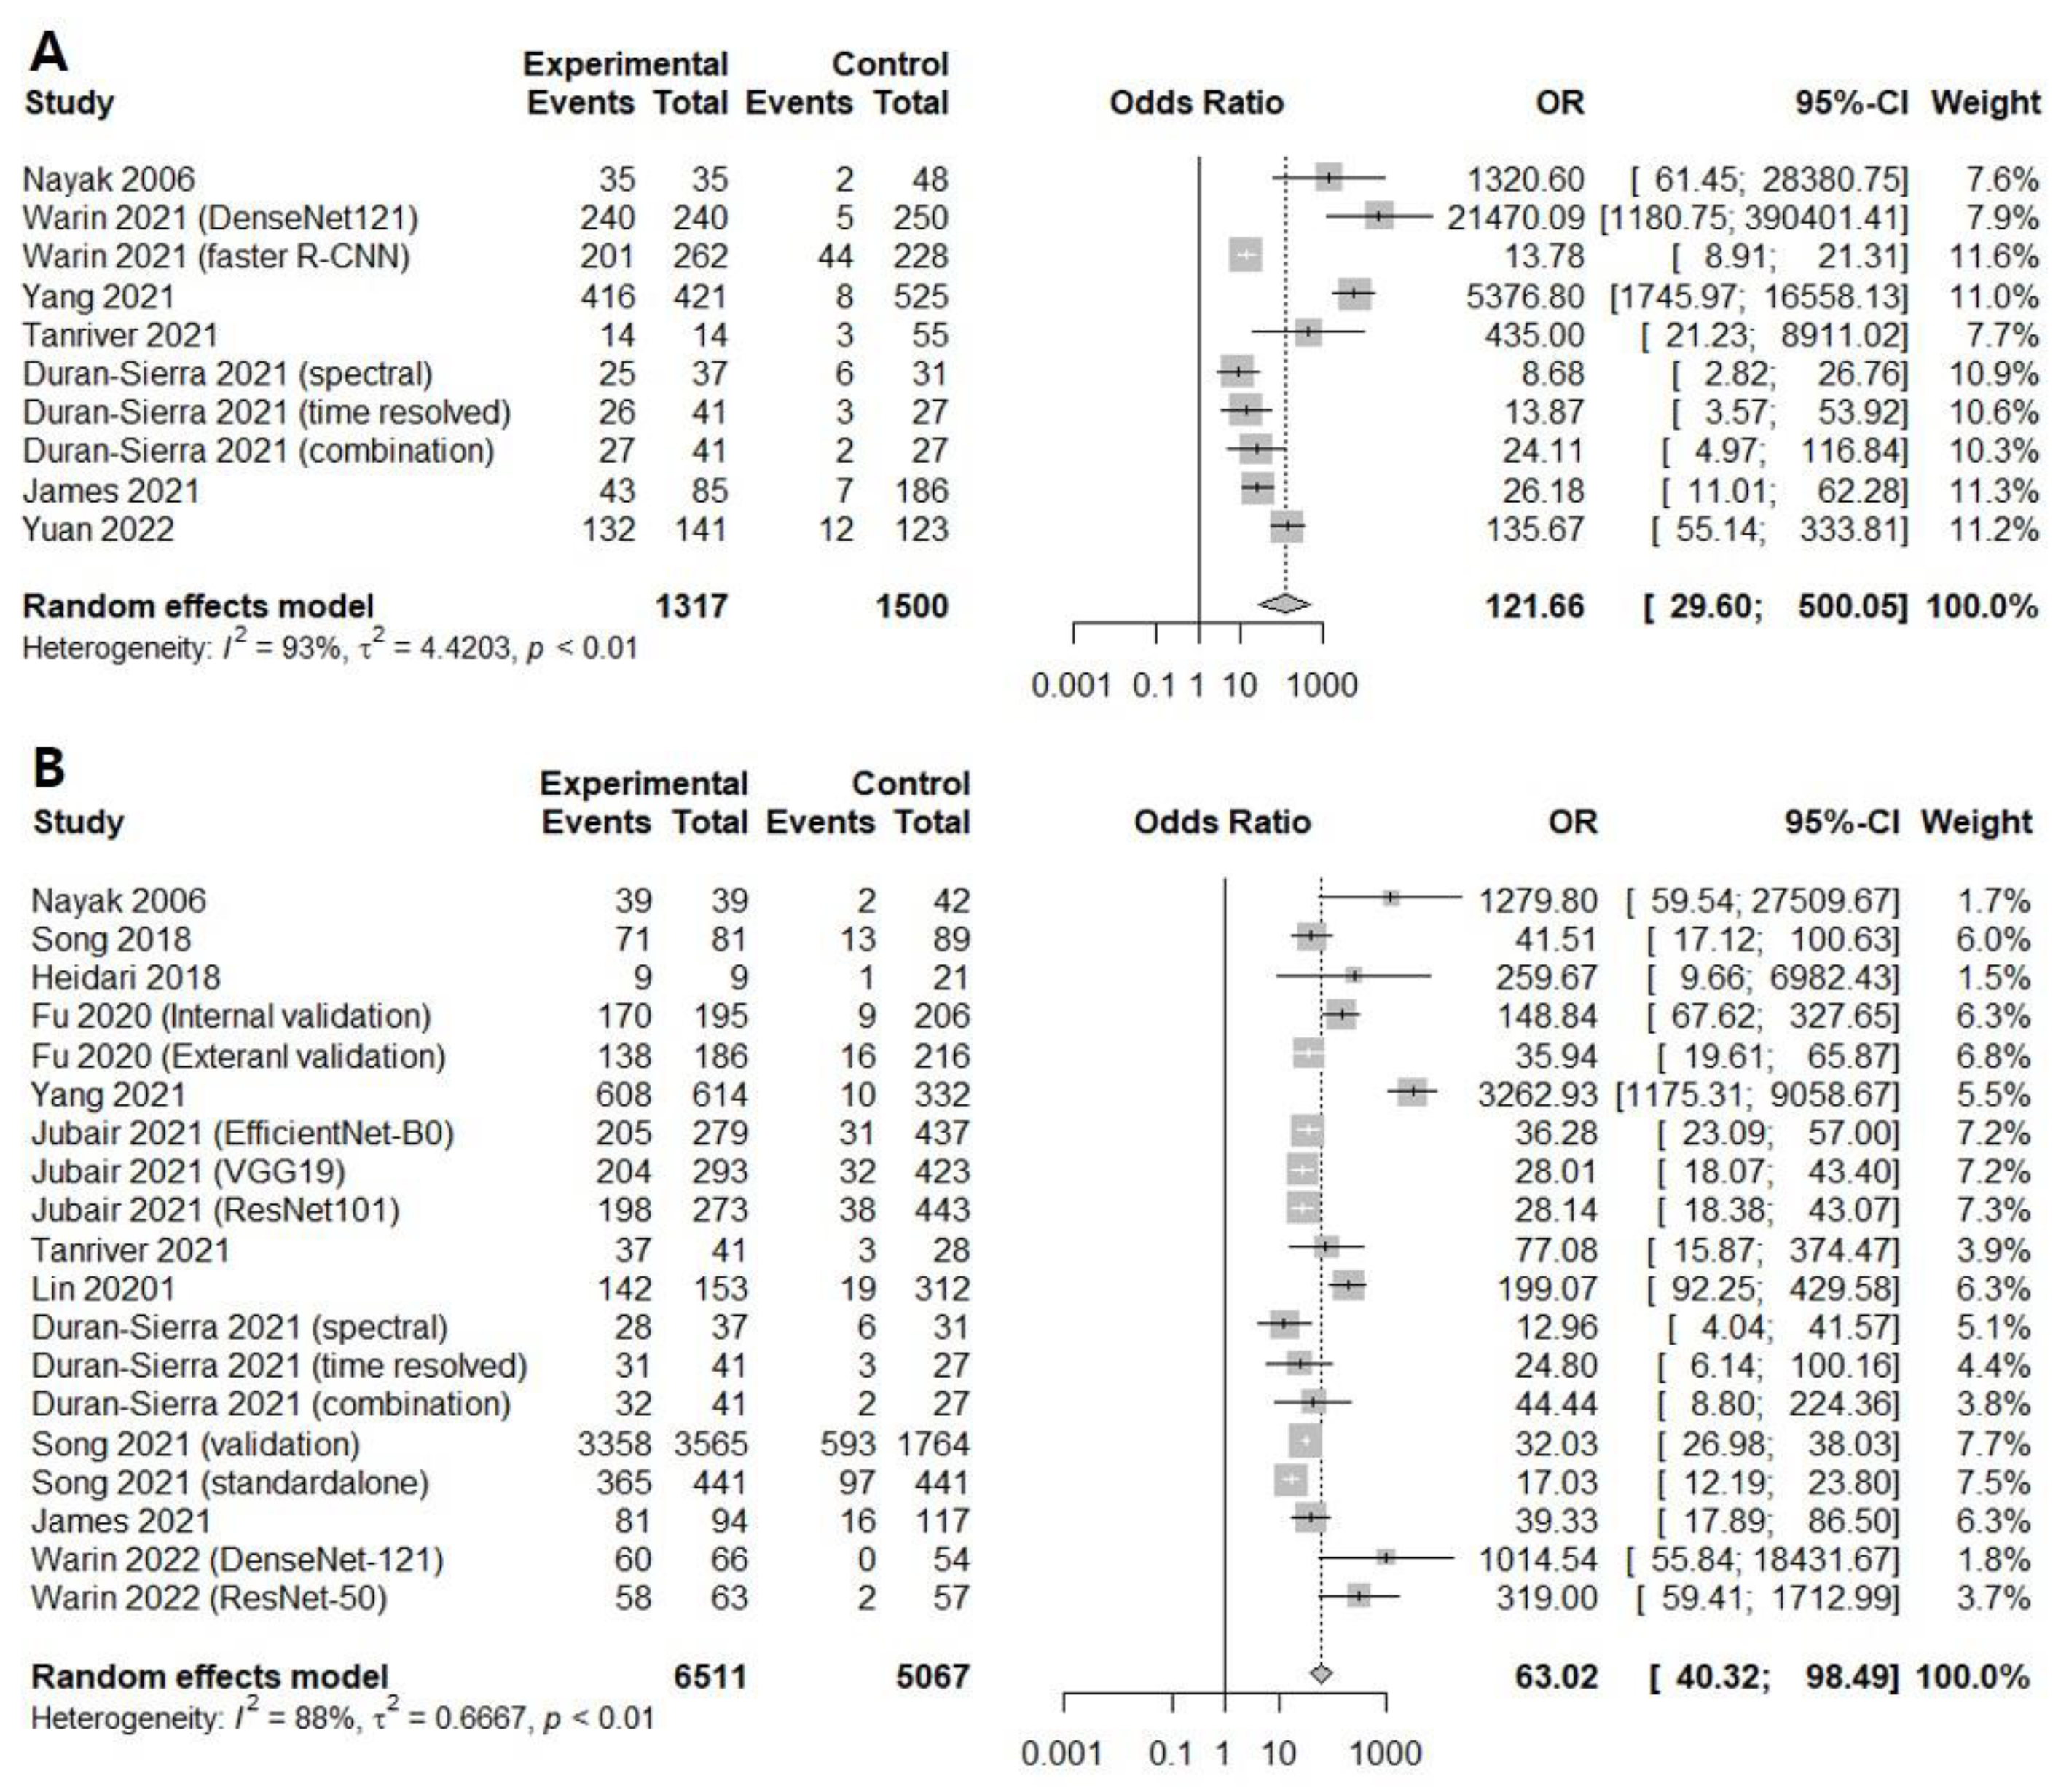
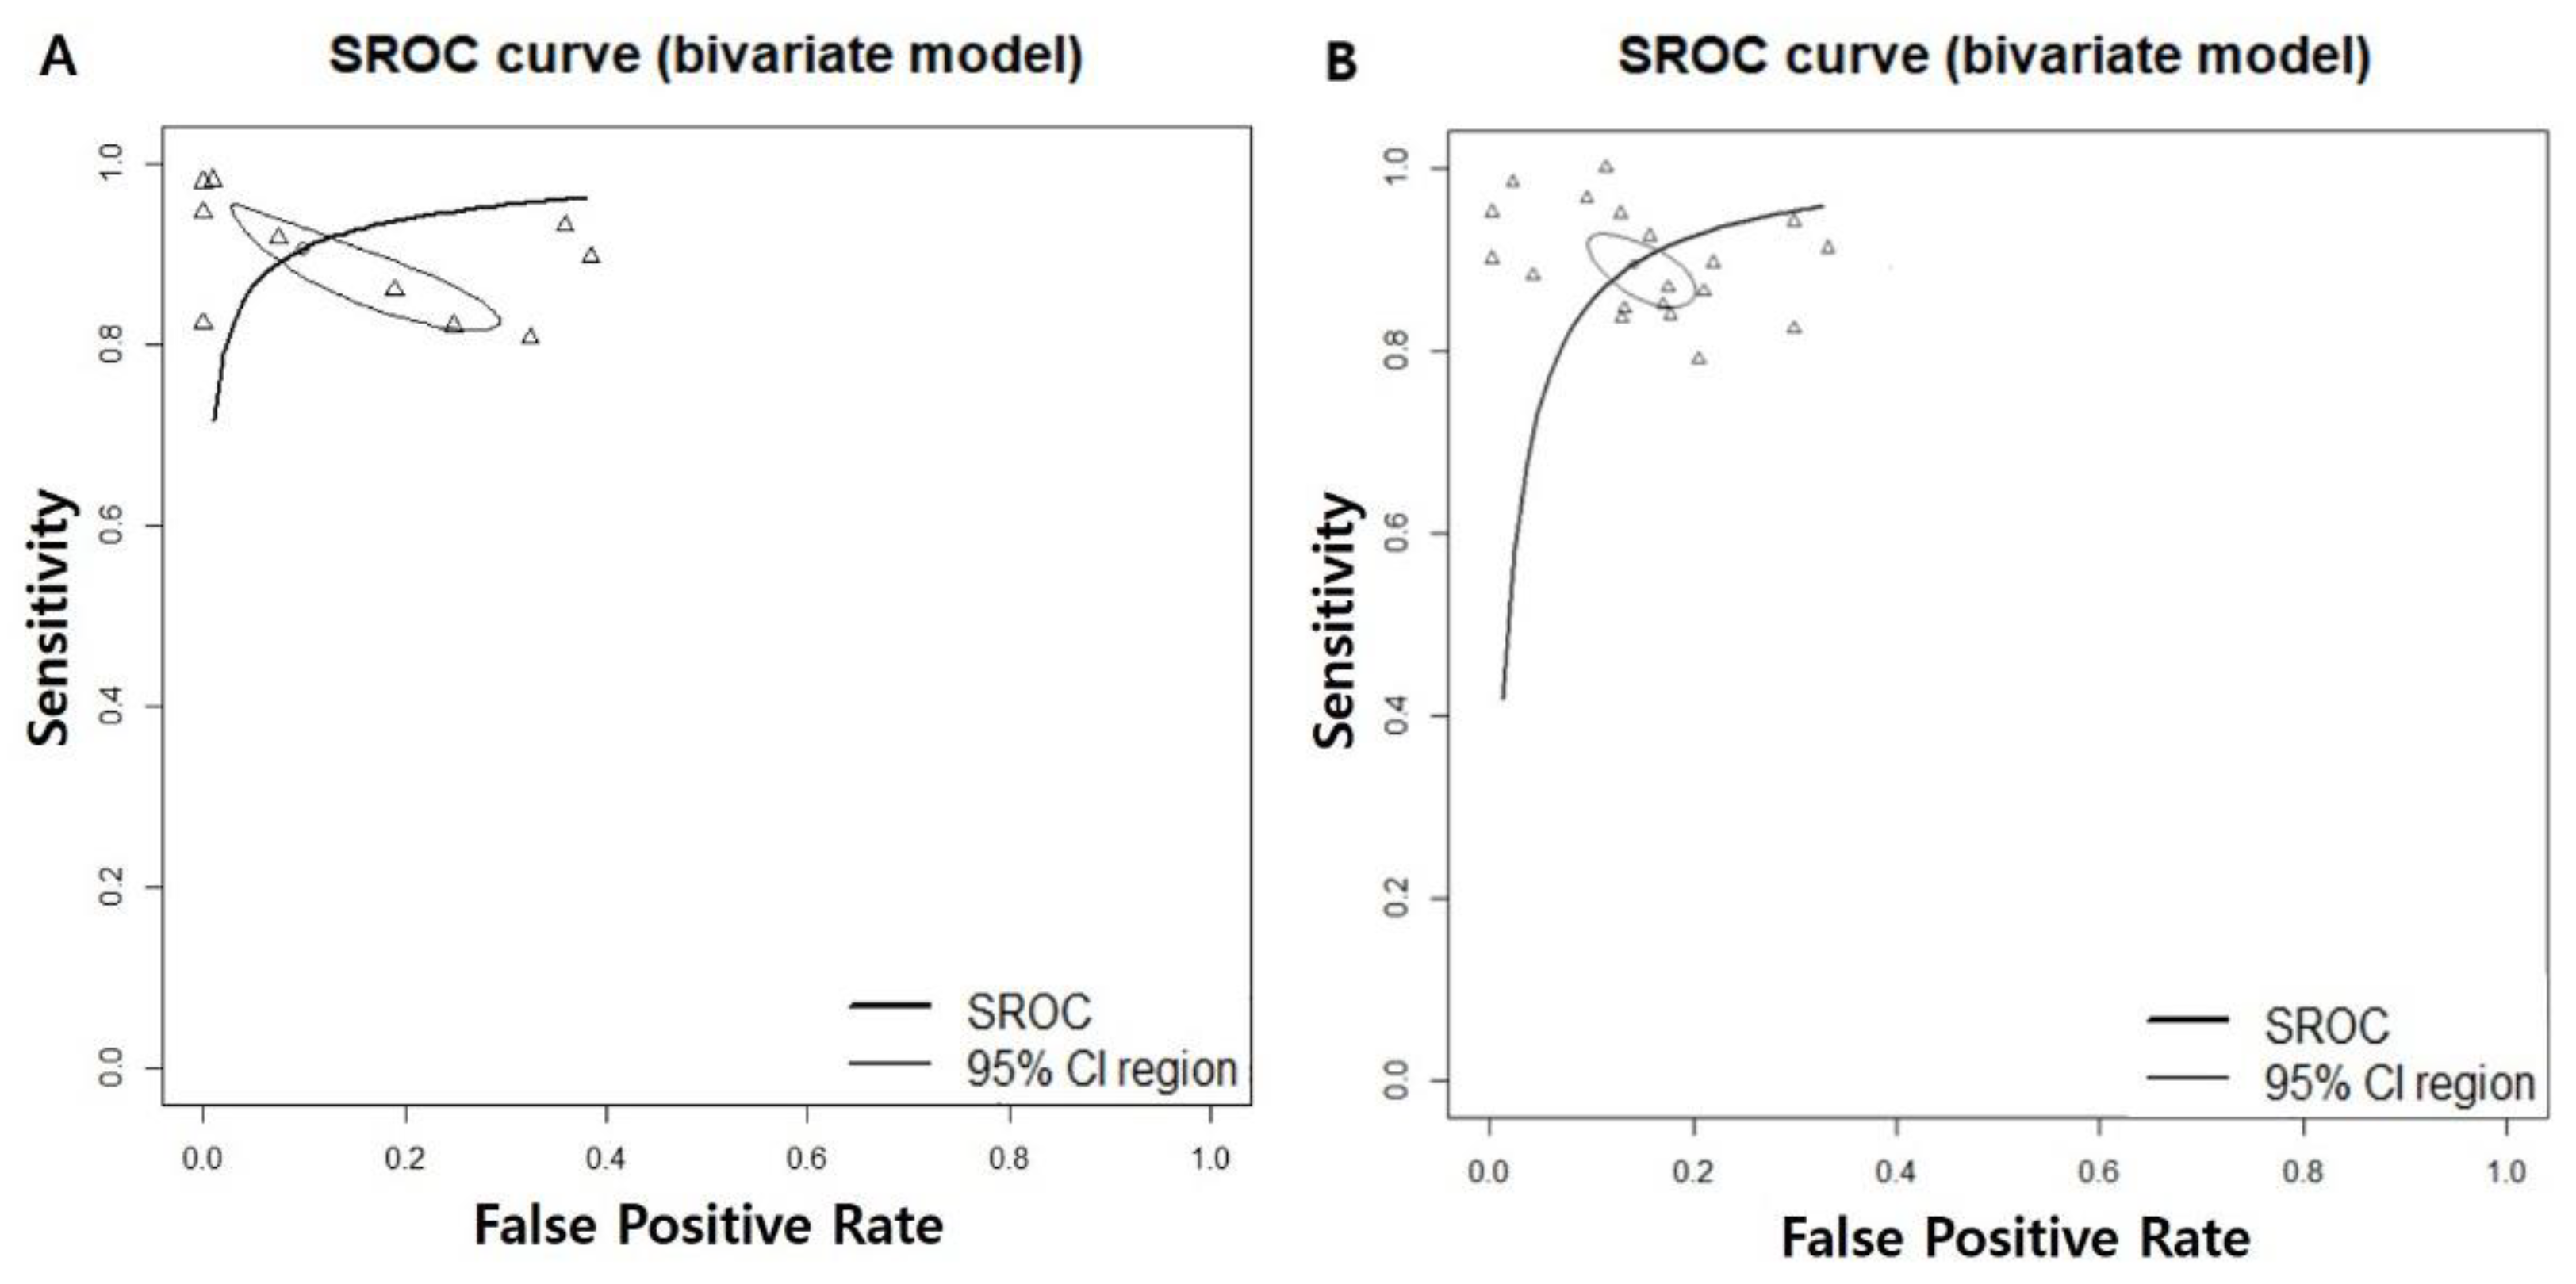
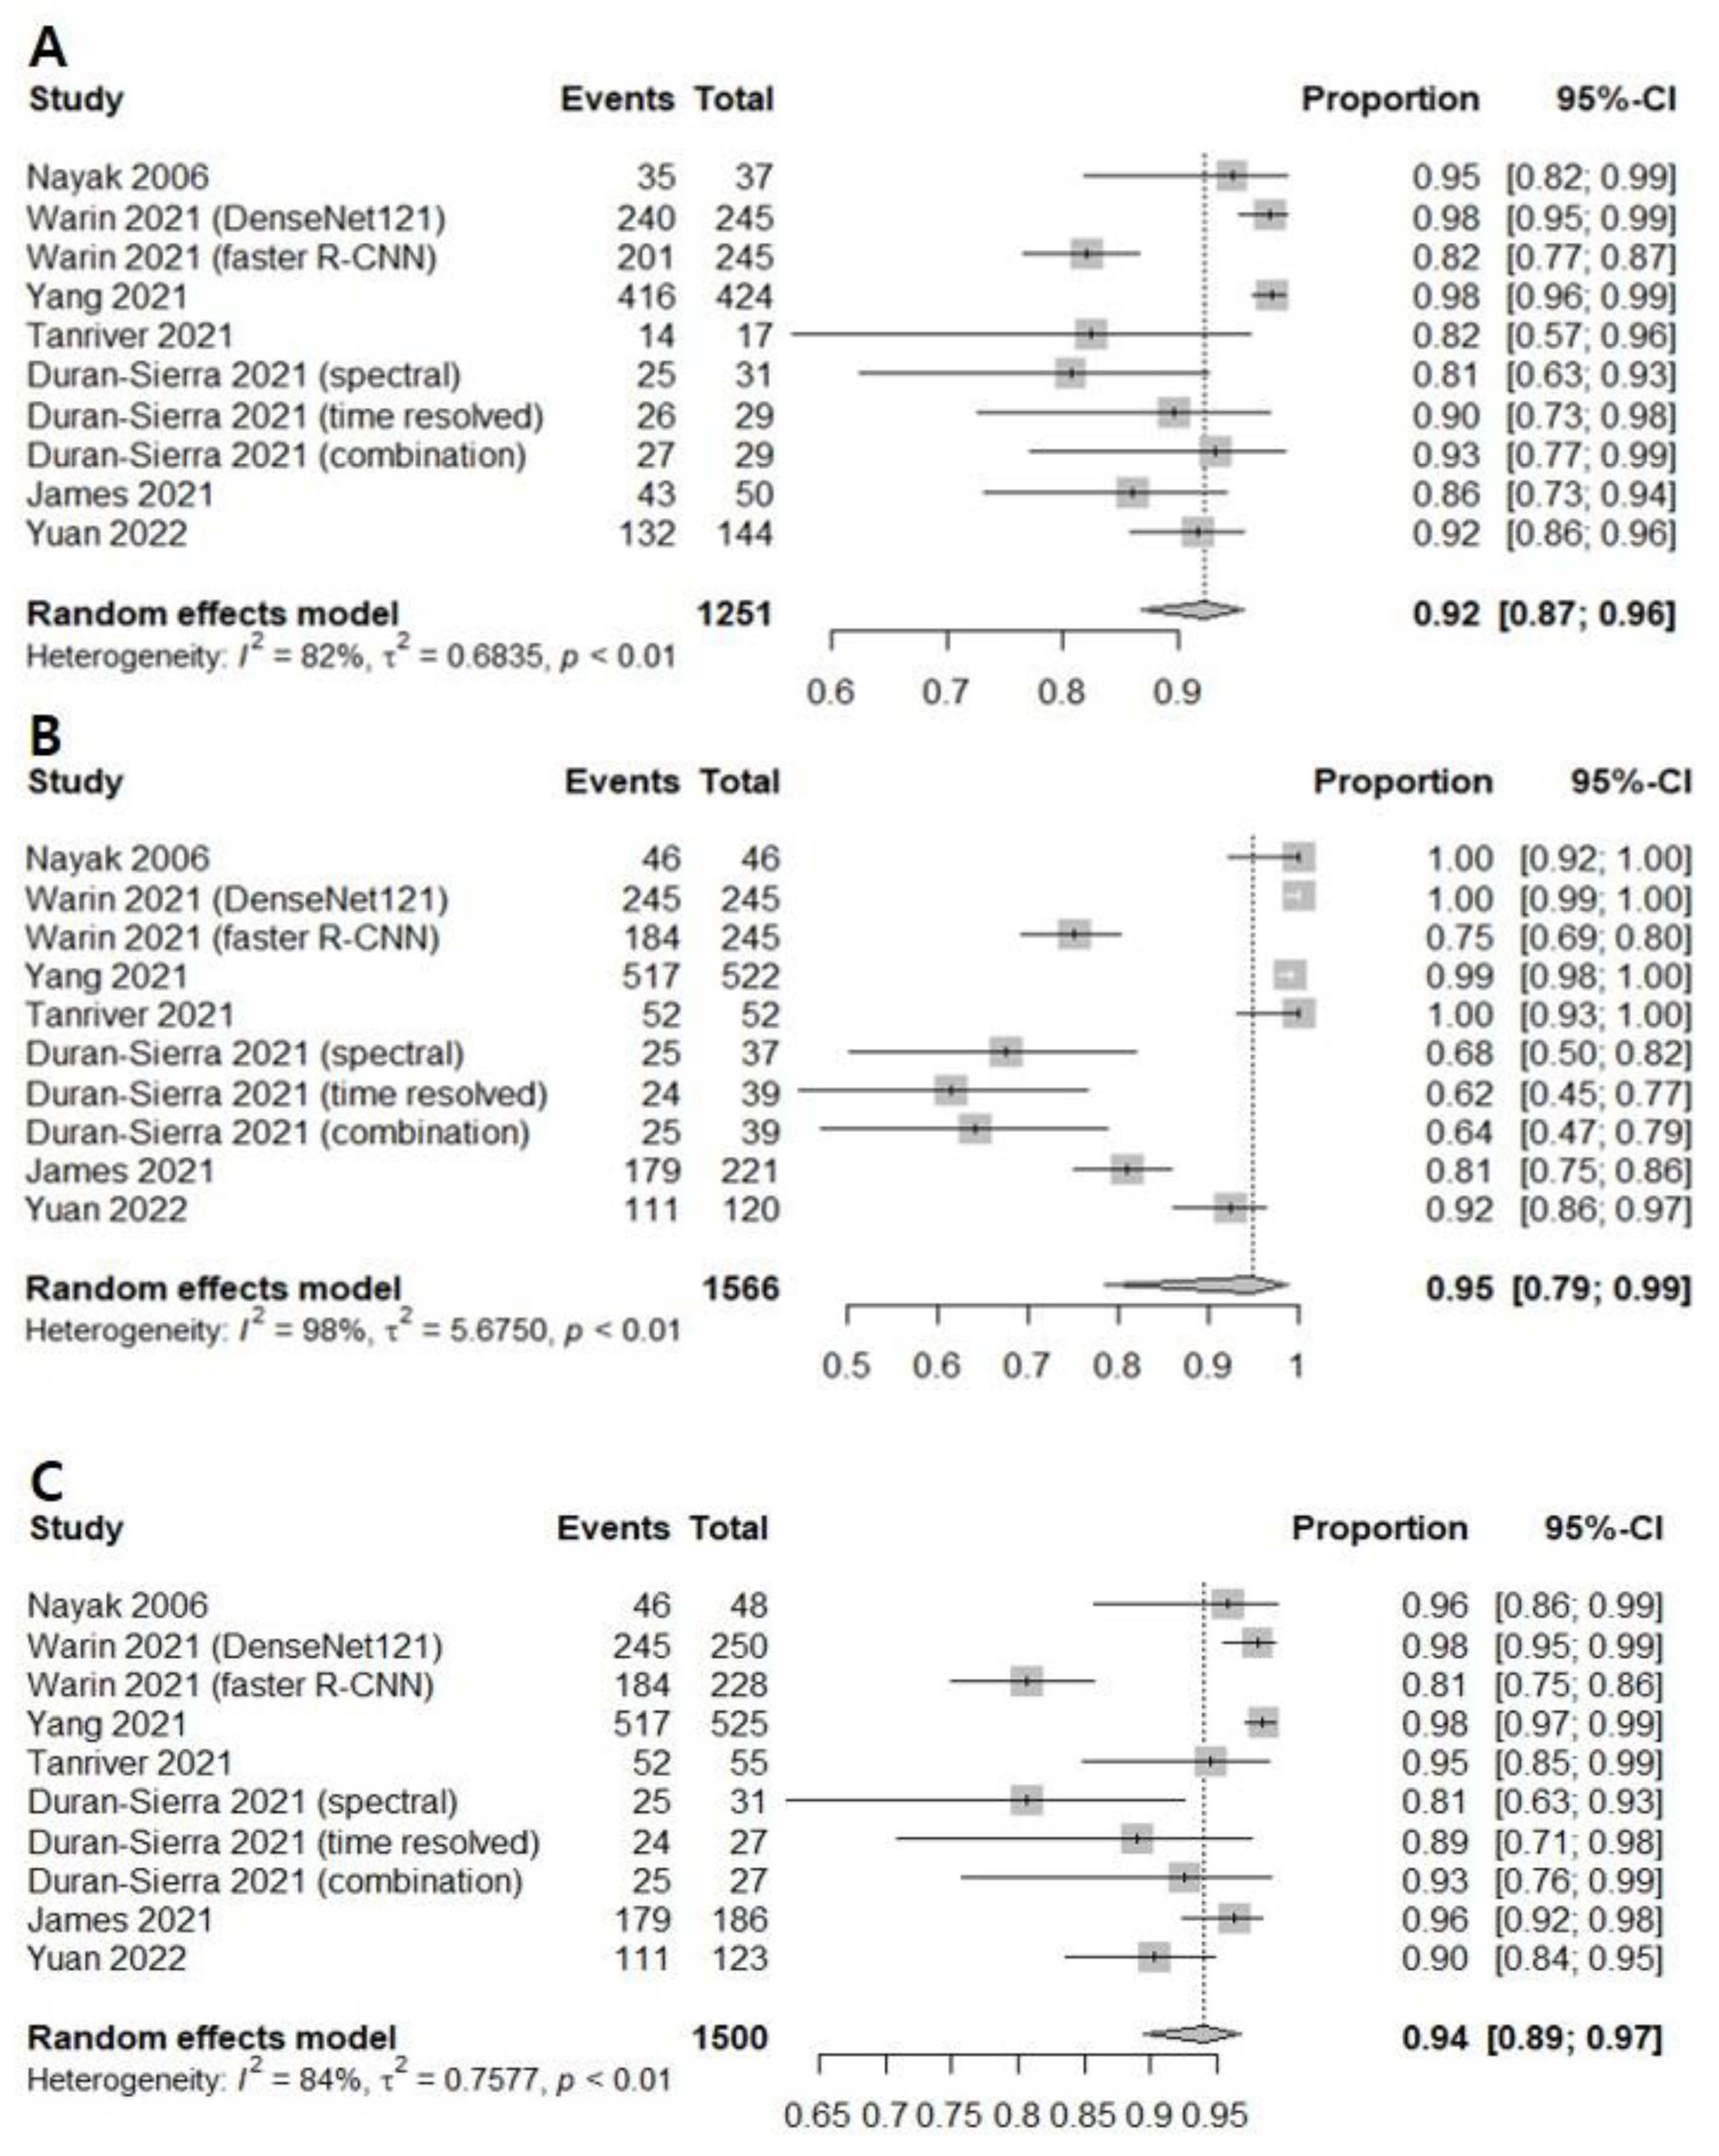
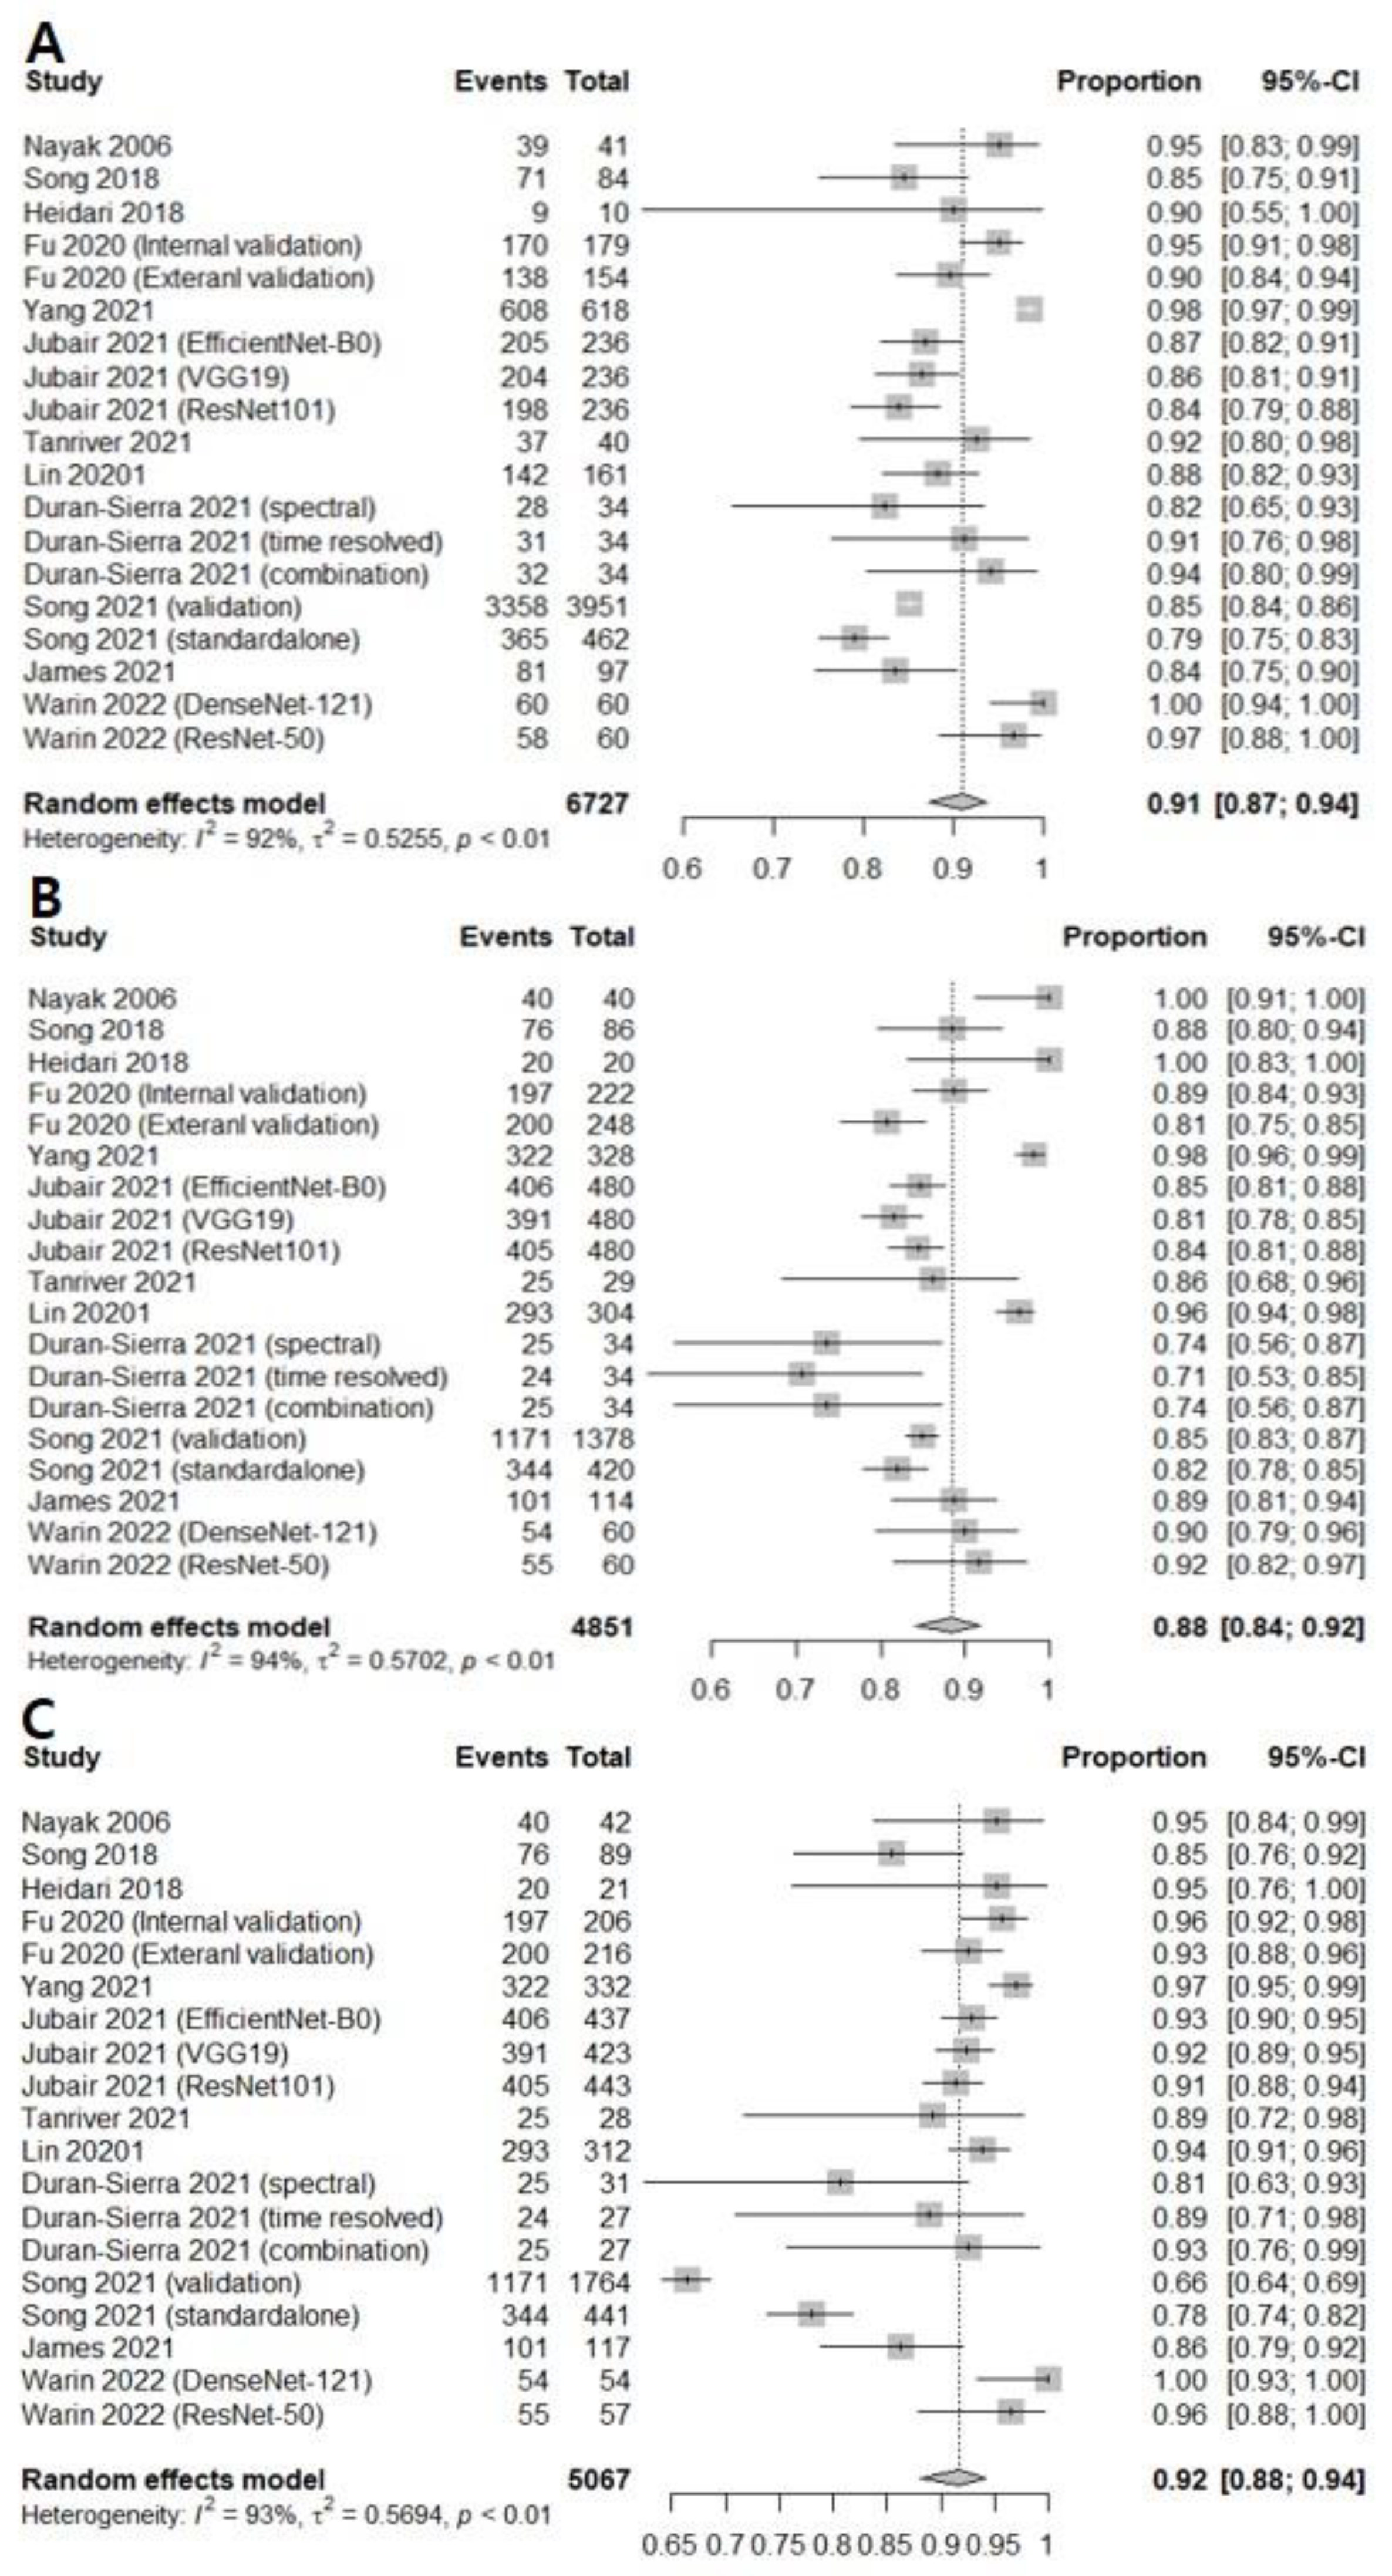
3.1. Diagnostic Accuracy of AI-Assisted Screening of Oral Mucosal Cancerous Lesions

Seven prospective and retrospective studies were included for discriminating oral cancerous lesions from normal mucosa. The diagnostic odds ratio (DOR) of AI-assisted screening was 121.6609 (95% confidence interval [CI], 29.5996; 500.0534, I2 = 93.5%) (Figure 2A).
The area under the summary receiver operating characteristic curve was 0.948, suggesting excellent diagnostic accuracy (Figure 3A).
The correlation between the sensitivity and the false-positive rate was 0.437, indicating the absence of heterogeneity. AI-assisted screening exhibited good sensitivity (0.9232 [0.8686; 0.9562]; I2 = 81.9%), specificity (0.9494 [0.7850; 0.9897], I2 = 98.3%), and negative predictive value (0.9405 [0.8947; 0.9671]. I2 = 83.6%) (Figure 4). The Begg’s funnel plot (Supplementary Figure S1) shows that a source of bias was not evident in the included studies. The Egger’s test result (p > 0.05) also shows that the possibility of publication bias is low.
Subgroup analyses were performed to determine which image tool assisted by AI had higher discriminating power between oral cancer lesions and normal mucosa. This analysis showed that that there were no significant differences between the photographic image, autofluorescence, and OCT in AI based on the screening for oral cancer lesion (Table 2).

3.2. Diagnostic Accuracy of AI-Assisted Screening of Oral Mucosal Precancerous and Cancerous Lesions

Twelve prospective and retrospective studies were included for discriminating oral precancerous and cancerous lesions from normal mucosa. The diagnostic odds ratio (DOR) of AI-assisted screening was 63.0193 (95% confidence interval [CI], 40.3234; 98.4896, I2 = 88.2%) (Figure 2B). The area under the summary receiver operating characteristic curve was 0.943, suggesting excellent diagnostic accuracy (Figure 3B). The correlation between the sensitivity and the false-positive rate was 0.337, indicating the absence of heterogeneity. AI-assisted screening exhibited good sensitivity (0.9094 [0.8725; 0.9364]; I2 = 92.3%), specificity (0.8848 [0.8400; 0.9183], I2 = 93.8%), and negative predictive value (0.9169 [0.8815; 0.9424], I2 = 92.8%) (Figure 5).
The Egger’s test results of sensitivity (p = 0.02025) and negative predictive value (p < 0.001) also show that the possibility of publication bias is high. To compensate for the publication bias using statistical methods, trim-and-fill methods (trimfill) were applied to the outcomes. After implementation of trimfill, sensitivity dropped from 0.9094 [0.8725; 0.9364] to 0.8504 [0.7889; 0.8963] and NPV also dropped from 0.9169 [0.8815; 0.9424] to 0.7815 [0.6577; 0.8694]. These results could mean that the diagnostic power of AI-assisted screening of precancerous and cancerous lesions would be overestimated and clinicians would need to be careful when interpreting these outcomes.
Subgroup analyses were performed to determine which image tool assisted by AI had higher discriminating power of oral mucosal cancerous lesions including precancerous lesions. Subgroup analysis showed that OCT was more diagnostically accurate (324.3335 vs. 66.8107 and 27.6313) and more negatively predictive (0.9399 vs. 0.9311 and 0.8405) than photographic images and autofluorescence in AI based on the screening for oral precancerous and cancerous lesions from normal mucosa (Table 3). Meta-regression of AI diagnostic accuracy for oral precancerous and cancerous lesions on the basis of imaging tool revealed the significant correlations (p = 0.0050).

4. Discussion

Oral cancer is a malignant disease with high disease-related morbidity and mortality due to its advanced loco-regional status at diagnosis. Early detection of oral cancer is the most effective means to increase the survival rate and reduce morbidity, but a significant number of patients experience delays between noticing the first symptoms and receiving a diagnosis from a clinician [26]. In clinical practice, a conventional visual examination is not a strong predictor of oral cancer diagnosis, and a quantitatively validated diagnostic method is needed [27]. Radiographic imaging, such as magnetic resonance imaging and computed tomography, can help determine the size and extent of oral cancer before treatment, but these techniques are not sensitive enough to distinguish precancerous lesions. Accordingly, various adjunct clinical imaging techniques such as autofluorescence and OCT have been used [28].
AI has been introduced in various industries, including healthcare, to increase efficiency and reduce costs, and the performance of AI models is improving day by day [29]. For the past few years, the early detection of oral cancer using AI technology based on autofluorescence imaging, photographic imaging, and OCT imaging has been an important research area. In this study, diagnostic values including sensitivity and specificity data were comprehensively confirmed in various studies that performed AI analysis of images. The diagnostic sensitivity of oral cancer analyzed by AI was as high as 0.92, and the analysis including precancerous lesions was slightly lower than the diagnostic sensitivity for cancer, but this also exceeded 90%. In subgroup analysis, there was no statistically significant difference in the diagnostic rate according to each image tool. In particular, the sensitivity of OCT to all precancerous lesions was found to be very high at 0.94.
Autofluorescence images are created using the characteristic that autofluorescence naturally occurring from collagen, elastin, and other endogenous fluorophores such as nicotinamide adenine dinucleotide in mucosal tissues by blue light or ultraviolet light is expressed differently in cancerous lesions [30,31]. Although it has been used widely in the dental field for the purpose of screening abnormal lesions in the oral cavity, it has been reported that the accuracy is low, with a sensitivity of only 30–50% [32,33]. It has been noted that autofluorescence images have a low diagnostic rate when used in oral cancer screening. Most of the previous clinical studies on autofluorescence-obtained images used differences in spectral fluorescence signals between normal and diseased tissues. Recently, time-resolved autofluorescence measurements using the characteristics of different fluorescence lifetimes of endogenous fluorophores have been used to solve the problem of broadly overlapping spectra of fluorophores, improving image accuracy [34]. Using various AI algorithms for advanced autofluorescence images, the diagnostic sensitivity of precancerous and cancerous lesions was reported to be as high as 94% [15]. As confirmed in our study, AI diagnosis sensitivity using autofluorescence images was confirmed to be 85% in all precancerous lesions. It showed relatively low diagnostic accuracy when compared to other imaging tools in this study. However, autofluorescence imaging is of sufficient value as an adjunct diagnostic tool. Efforts are also being made to improve the diagnostic accuracy for oral cancer by using AI to analyze images obtained using other tools along with the autofluorescence image [19].
The photographic image is a fast and convenient method with high accessibility compared to other adjunct methods. However, there is a disadvantage in that the image quality varies greatly depending on the camera, lighting, and resolution used while obtaining the image. Unlike external skin lesions, the oral cavity is surrounded by a complex, three-dimensional structure including the lips, teeth, and buccal mucosa, which may decrease the image accuracy [6]. In a recent study introducing a smartphone-based device, it was reported that the problem of the image itself was solved through a probe that can easily access the inside of the mouth and increasing images pixel [35]. Image diagnosis using a smartphone is very accessible in the current era of billions of phone subscribers worldwide, and in particular, it is expected that accurate and efficient screening will be possible by diagnosing a vast number of these images with AI. According to our analysis, AI-aided diagnosis from photographic images was confirmed to have a diagnostic sensitivity of over 91% for precancerous and cancerous lesions.
OCT is a medical technology that images tissues using the difference in physical properties between the reference light path and the sample light path reflected after interaction in the tissue [13]. OCT is non-invasive and uses infrared light, unlike other radiology tests that use X-rays. It is also a good diagnostic method that allows real-time image verification. Since its introduction in 1991 [36], OCT has been developed to provide high-resolution images at a faster speed and has played an important role in the biomedical field. In an AI analysis study of OCT images published by Yang et al., it was reported that the sensitivity and specificity of oral cancer diagnosis was 98% or more [22]. In our study, OCT images were found to be the most accurate diagnostic test, with sensitivity of 94% in AI diagnosis compared to other image tools (sensitivity of autofluorescence and photographic images of 89% and 91%, respectively). Therefore, AI diagnosis using OCT images is considered to be of sufficient value as a screening method for oral lesions. Each image tool included in our study has its own pros and cons to be considered when using it in actual clinical practice. In addition, accessibility of equipment or systems that can be performed on patients in actual outpatient treatment will be an important factor.
Based on our results, AI analysis of images in cancer diagnosis is thought to be helpful in making fast decisions regarding further examination and treatment. The accuracy of discriminating between precancerous lesions and normal tissues showed a high sensitivity of over 90%, showing good accuracy as a screening method. Although the question of whether AI can replace experts still exists, it is expected that oral cancer diagnosis using AI will sufficiently improve mortality and morbidity due to disease in low- and middle-income countries with poor health care systems. Acquisition of large-scale image datasets to improve AI analysis accuracy will be a clinically important key.
Our study has several limitations. First, our results include data from multiple imaging tools analyzed at once. This created heterogeneity in the results. Therefore, the sensitivity of each imaging tool was checked separately. The study is meaningful as it is the first meta-analysis to judge the accuracy of AI-based image analysis. Second, even with the same imaging tool, differences in the quality of the devices used in each study and differences between techniques may affect the accuracy of diagnosis. The images used to train the AI algorithm may not fully represent the diversity of oral lesions. Third, there is a limit to the interpretation of the results due to the absolute lack of prospective studies between the conventional examination and AI imaging diagnosis. It is our task to study this in various clinical fields in order to prepare for a future in which AI-assisted healthcare will be successful

5. Conclusions

AI shows good diagnostic performance with high sensitivity for oral cancer. Through the development of image acquisition devices and the grafting of various AI algorithms, the diagnostic accuracy is expected to increase. As new studies in this field are published frequently, a comprehensive review of the clinical implications of AI in oral cancer will be necessary again in the future.

Supplementary Materials

The following supporting information can be downloaded at: https://www.mdpi.com/article/10.3390/cancers14143499/s1, Figure S1: Begg’s funnel plot; Table S1: Study characteristics.

Author Contributions

Conceptualization, J.-S.K., B.G.K. and S.H.H.; methodology, J.-S.K. and S.H.H.; software, S.H.H.; validation, S.H.H.; formal analysis, J.-S.K. and S.H.H.; investigation, J.-S.K. and S.H.H.; data curation, J.-S.K. and S.H.H.; writing—original draft preparation, J.-S.K. and S.H.H.; writing—review and editing, J.-S.K. and S.H.H.; visualization, J.-S.K. and S.H.H.; supervision, J.-S.K., B.G.K. and S.H.H. All authors have read and agreed to the published version of the manuscript.

Funding

This work was supported by the National Research Foundation of Korea (NRF) grant funded by the Korea government (MSIT) (2022R1F1A1066232). The sponsors had no role in the study design, data collection and analysis, decision to publish, or preparation of the manuscript.

Conflicts of Interest

The authors declare no conflict of interest.

References

  1. Cunningham, M.J.; Johnson, J.T.; Myers, E.N.; Schramm, V.L., Jr.; Thearle, P.B. Cervical lymph node metastasis after local excision of early squamous cell carcinoma of the oral cavity. Am. J. Surg. 1986, 152, 361–366. [Google Scholar] [CrossRef]
  2. Messadi, D.V. Diagnostic aids for detection of oral precancerous conditions. Int. J. Oral Sci. 2013, 5, 59–65. [Google Scholar] [CrossRef] [PubMed]
  3. Kim, D.H.; Song, E.A.; Kim, S.W.; Hwang, S.H. Efficacy of toluidine blue in the diagnosis and screening of oral cancer and pre-cancer: A systematic review and meta-analysis. Clin. Otolaryngol. 2021, 46, 23–30. [Google Scholar] [CrossRef] [PubMed]
  4. Awan, K.; Morgan, P.; Warnakulasuriya, S. Evaluation of an autofluorescence based imaging system (VELscope™) in the detection of oral potentially malignant disorders and benign keratoses. Oral Oncol. 2011, 47, 274–277. [Google Scholar] [CrossRef]
  5. Tsai, M.-T.; Lee, H.-C.; Lee, C.-K.; Yu, C.-H.; Chen, H.-M.; Chiang, C.-P.; Chang, C.-C.; Wang, Y.-M.; Yang, C. Effective indicators for diagnosis of oral cancer using optical coherence tomography. Opt. Express 2008, 16, 15847–15862. [Google Scholar]
  6. Fu, Q.; Chen, Y.; Li, Z.; Jing, Q.; Hu, C.; Liu, H.; Bao, J.; Hong, Y.; Shi, T.; Li, K. A deep learning algorithm for detection of oral cavity squamous cell carcinoma from photographic images: A retrospective study. eClinicalMedicine 2020, 27, 100558. [Google Scholar] [CrossRef]
  7. LeCun, Y.; Bengio, Y.; Hinton, G. Deep learning. Nature 2015, 521, 436–444. [Google Scholar] [CrossRef]
  8. Gulshan, V.; Peng, L.; Coram, M.; Stumpe, M.C.; Wu, D.; Narayanaswamy, A.; Venugopalan, S.; Widner, K.; Madams, T.; Cuadros, J.; et al. Development and Validation of a Deep Learning Algorithm for Detection of Diabetic Retinopathy in Retinal Fundus Photographs. JAMA 2016, 316, 2402–2410. [Google Scholar] [CrossRef]
  9. Esteva, A.; Kuprel, B.; Novoa, R.A.; Ko, J.; Swetter, S.M.; Blau, H.M.; Thrun, S. Dermatologist-level classification of skin cancer with deep neural networks. Nature 2017, 542, 115–118. [Google Scholar] [CrossRef]
  10. Varshni, D.; Thakral, K.; Agarwal, L.; Nijhawan, R.; Mittal, A. Pneumonia detection using CNN based feature extraction. In Proceedings of the 2019 IEEE International Conference on Electrical, Computer and Communication Technologies (ICECCT), Coimbatore, India, 20–22 February 2019; pp. 1–7. [Google Scholar]
  11. Ilhan, B.; Guneri, P.; Wilder-Smith, P. The contribution of artificial intelligence to reducing the diagnostic delay in oral cancer. Oral Oncol. 2021, 116, 105254. [Google Scholar] [CrossRef]
  12. Kim, D.H.; Kim, S.W.; Kim, S.H.; Jung, J.H.; Hwang, S.H. Usefulness of imaging studies for diagnosing and localizing cerebrospinal fluid rhinorrhea: A systematic review and meta-analysis. Int. Forum. Allergy Rhinol. 2022, 12, 828–837. [Google Scholar] [CrossRef] [PubMed]
  13. Nayak, G.; Kamath, S.; Pai, K.M.; Sarkar, A.; Ray, S.; Kurien, J.; D’Almeida, L.; Krishnanand, B.; Santhosh, C.; Kartha, V. Principal component analysis and artificial neural network analysis of oral tissue fluorescence spectra: Classification of normal premalignant and malignant pathological conditions. Biopolym. Orig. Res. Biomol. 2006, 82, 152–166. [Google Scholar] [CrossRef] [PubMed]
  14. Heidari, A.E.; Sunny, S.P.; James, B.L.; Lam, T.M.; Tran, A.V.; Yu, J.; Ramanjinappa, R.D.; Uma, K.; Birur, P.; Suresh, A. Optical coherence tomography as an oral cancer screening adjunct in a low resource settings. IEEE J. Sel. Top. Quantum Electron. 2018, 25, 7202008. [Google Scholar] [CrossRef] [Green Version]
  15. Song, B.; Sunny, S.; Uthoff, R.D.; Patrick, S.; Suresh, A.; Kolur, T.; Keerthi, G.; Anbarani, A.; Wilder-Smith, P.; Kuriakose, M.A. Automatic classification of dual-modalilty, smartphone-based oral dysplasia and malignancy images using deep learning. Biomed. Opt. Express 2018, 9, 5318–5329. [Google Scholar] [CrossRef] [PubMed]
  16. Duran-Sierra, E.; Cheng, S.; Cuenca, R.; Ahmed, B.; Ji, J.; Yakovlev, V.V.; Martinez, M.; Al-Khalil, M.; Al-Enazi, H.; Cheng, Y.-S.L. Machine-Learning Assisted Discrimination of Precancerous and Cancerous from Healthy Oral Tissue Based on Multispectral Autofluorescence Lifetime Imaging Endoscopy. Cancers 2021, 13, 4751. [Google Scholar] [CrossRef]
  17. James, B.L.; Sunny, S.P.; Heidari, A.E.; Ramanjinappa, R.D.; Lam, T.; Tran, A.V.; Kankanala, S.; Sil, S.; Tiwari, V.; Patrick, S. Validation of a Point-of-Care Optical Coherence Tomography Device with Machine Learning Algorithm for Detection of Oral Potentially Malignant and Malignant Lesions. Cancers 2021, 13, 3583. [Google Scholar] [CrossRef]
  18. Jubair, F.; Al-karadsheh, O.; Malamos, D.; Al Mahdi, S.; Saad, Y.; Hassona, Y. A novel lightweight deep convolutional neural network for early detection of oral cancer. Oral Dis. 2022, 28, 1123–1130. [Google Scholar] [CrossRef]
  19. Lin, H.; Chen, H.; Weng, L.; Shao, J.; Lin, J. Automatic detection of oral cancer in smartphone-based images using deep learning for early diagnosis. J. Biomed. Opt. 2021, 26, 086007. [Google Scholar] [CrossRef]
  20. Song, B.; Sunny, S.; Li, S.; Gurushanth, K.; Mendonca, P.; Mukhia, N.; Patrick, S.; Gurudath, S.; Raghavan, S.; Imchen, T.; et al. Mobile-based oral cancer classification for point-of-care screening. J. Biomed. Opt. 2021, 26, 065003. [Google Scholar] [CrossRef]
  21. Tanriver, G.; Soluk Tekkesin, M.; Ergen, O. Automated Detection and Classification of Oral Lesions Using Deep Learning to Detect Oral Potentially Malignant Disorders. Cancers 2021, 13, 2766. [Google Scholar] [CrossRef]
  22. Warin, K.; Limprasert, W.; Suebnukarn, S.; Jinaporntham, S.; Jantana, P. Automatic classification and detection of oral cancer in photographic images using deep learning algorithms. J. Oral Pathol. Med. 2021, 50, 911–918. [Google Scholar] [CrossRef] [PubMed]
  23. Yang, Z.; Shang, J.; Liu, C.; Zhang, J.; Liang, Y. Identification of oral precancerous and cancerous tissue by swept source optical coherence tomography. Lasers Surg. Med. 2022, 54, 320–328. [Google Scholar] [CrossRef] [PubMed]
  24. Warin, K.; Limprasert, W.; Suebnukarn, S.; Jinaporntham, S.; Jantana, P. Performance of deep convolutional neural network for classification and detection of oral potentially malignant disorders in photographic images. Int. J. Oral Maxillofac. Surg. 2022, 51, 699–704. [Google Scholar] [CrossRef] [PubMed]
  25. Yuan, W.; Cheng, L.; Yang, J.; Yin, B.; Fan, X.; Yang, J.; Li, S.; Zhong, J.; Huang, X. Noninvasive oral cancer screening based on local residual adaptation network using optical coherence tomography. Med. Biol. Eng. Comput. 2022, 60, 1363–1375. [Google Scholar] [CrossRef]
  26. Scott, S.E.; Grunfeld, E.A.; McGurk, M. Patient’s delay in oral cancer: A systematic review. Community Dent. Oral Epidemiol. 2006, 34, 337–343. [Google Scholar] [CrossRef]
  27. Epstein, J.B.; Güneri, P.; Boyacioglu, H.; Abt, E. The limitations of the clinical oral examination in detecting dysplastic oral lesions and oral squamous cell carcinoma. J. Am. Dent. Assoc. 2012, 143, 1332–1342. [Google Scholar] [CrossRef]
  28. Camalan, S.; Mahmood, H.; Binol, H.; Araujo, A.L.D.; Santos-Silva, A.R.; Vargas, P.A.; Lopes, M.A.; Khurram, S.A.; Gurcan, M.N. Convolutional Neural Network-Based Clinical Predictors of Oral Dysplasia: Class Activation Map Analysis of Deep Learning Results. Cancers 2021, 13, 1291. [Google Scholar] [CrossRef]
  29. Mintz, Y.; Brodie, R. Introduction to artificial intelligence in medicine. Minim. Invasive Ther. Allied Technol. 2019, 28, 73–81. [Google Scholar] [CrossRef]
  30. Pavlova, I.; Williams, M.; El-Naggar, A.; Richards-Kortum, R.; Gillenwater, A. Understanding the biological basis of autofluorescence imaging for oral cancer detection: High-resolution fluorescence microscopy in viable tissue. Clin. Cancer Res. 2008, 14, 2396–2404. [Google Scholar] [CrossRef] [Green Version]
  31. Skala, M.C.; Riching, K.M.; Gendron-Fitzpatrick, A.; Eickhoff, J.; Eliceiri, K.W.; White, J.G.; Ramanujam, N. In vivo multiphoton microscopy of NADH and FAD redox states, fluorescence lifetimes, and cellular morphology in precancerous epithelia. Proc. Natl. Acad. Sci. USA 2007, 104, 19494–19499. [Google Scholar] [CrossRef] [Green Version]
  32. Mehrotra, R.; Singh, M.; Thomas, S.; Nair, P.; Pandya, S.; Nigam, N.S.; Shukla, P. A cross-sectional study evaluating chemiluminescence and autofluorescence in the detection of clinically innocuous precancerous and cancerous oral lesions. J. Am. Dent. Assoc. 2010, 141, 151–156. [Google Scholar] [CrossRef] [PubMed]
  33. Farah, C.S.; McIntosh, L.; Georgiou, A.; McCullough, M.J. Efficacy of tissue autofluorescence imaging (VELScope) in the visualization of oral mucosal lesions. Head Neck 2012, 34, 856–862. [Google Scholar] [CrossRef] [PubMed]
  34. Lagarto, J.L.; Villa, F.; Tisa, S.; Zappa, F.; Shcheslavskiy, V.; Pavone, F.S.; Cicchi, R. Real-time multispectral fluorescence lifetime imaging using Single Photon Avalanche Diode arrays. Sci. Rep. 2020, 10, 8116. [Google Scholar] [CrossRef]
  35. Uthoff, R.D.; Song, B.; Sunny, S.; Patrick, S.; Suresh, A.; Kolur, T.; Keerthi, G.; Spires, O.; Anbarani, A.; Wilder-Smith, P. Point-of-care, smartphone-based, dual-modality, dual-view, oral cancer screening device with neural network classification for low-resource communities. PLoS ONE 2018, 13, e0207493. [Google Scholar] [CrossRef] [PubMed]
  36. Huang, D.; Swanson, E.A.; Lin, C.P.; Schuman, J.S.; Stinson, W.G.; Chang, W.; Hee, M.R.; Flotte, T.; Gregory, K.; Puliafito, C.A.; et al. Optical coherence tomography. Science 1991, 254, 1178–1181. [Google Scholar] [CrossRef] [PubMed] [Green Version]
Figure 1. Summary of the search strategy.
Cancers 14 03499 g001
Figure 2. Forest plot of the diagnostic odds ratios for (A) screening only oral cancerous lesions [13,16,17,21,22,23,25] and (B) screening all premalignant mucosal lesions [13,14,15,16,17,18,19,20,21,23,24].
Cancers 14 03499 g002
Figure 3. Area under the summary receiver operating characteristic for (A) screening only the oral cancerous lesions and (B) screening all premalignant mucosal lesions. SROC; summary receiver operating characteristic, CI; confidence interval.
Cancers 14 03499 g003
Figure 4. Forest plots of (A) sensitivity, (B) specificity, and (C) negative predictive values for screening oral cancerous lesions [13,16,17,21,22,23,25].
Cancers 14 03499 g004
Figure 5. Forest plots of (A) sensitivity, (B) specificity, and (C) negative predictive values for screening all premalignant mucosal lesions [6,13,14,15,16,17,18,19,20,21,23,24].
Cancers 14 03499 g005
Table 1. Methodological quality of all included studies.
ReferenceRisk of BiasConcerns about Application
Patient SelectionIndex TestReference StandardFlow and TimingPatient SelectionIndex TestReference Standard
Nayak 2006 [13]UnclearLowUnclearUnclearLowLowLow
Heidari 2018 [14]LowLowLowLowLowLowLow
Song 2018 [15]LowLowLowLowLowLowLow
Fu 2020 [6]highLowLowLowLowLowLow
Duran-Sierra 2021 [16] UnclearLowUnclearUnclearLowLowLow
James 2021 [17]LowLowUnclearLowLowLowLow
Jubair 2021 [18]UnclearLowLowLowLowLowLow
Lin 2021 [19]UnclearLowUnclearLowLowLowLow
Song 2021 [20]LowLowLowLowLowLowLow
Tanriver 2021 [21]LowLowLowLowLowLowLow
Warin 2021 [22]LowLowLowLowLowLowLow
Yang 2021 [23]LowLowLowLowLowLowLow
Warin 2022 [24]LowLowLowUnclearLowLowLow
Yuan 2022 [25]LowLowLowLowLowLowLow
Table 2. Subgroup analysis regarding image tool in discriminating oral cancerous lesions from normal mucosa.
SubgroupStudy (n)DOR [95% CIs]Sensitivity [95% CIs]Specificity [95% CIs]NPV [95% CIs]AUC
7121.6609 [29.5996; 500.0534]; I2 = 93.5%0.9232 [0.8686; 0.9562]; I2 = 81.9%0.9494 [0.7850; 0.9897]; I2 = 98.3%0.9405 [0.8947; 0.9671]; I2 = 83.6%0.948
Image tool
Autofluorescence225.9083 [ 6.3059; 106.4464]; I2 = 68.0%0.8972 [0.8262; 0.9413]; I2 = 63.5%0.8213 [0.4430; 0.9637]; 94.0%0.9041 [0.8263; 0.9492]; 23.9%
Optical coherense tomography3261.9981 [14.7102; 4666.3521]; I2 = 96.3%0.9419 [0.8544; 0.9781]; I2 = 84.4%0.9461 [0.7931; 0.9877]; 94.6%0.9625 [0.9106; 0.9848]; 81.9%
Photographic image2431.6524 [ 4.0037; 46537.4743]; I2 = 93.0%0.9149 [0.7475; 0.9750]; I2 = 87.4%0.9983 [0.2906; 1.0000]; 94.9%0.9381 [0.8109; 0.9816]; 87.5%
0.23320.59100.29070.2291
DOR; diagnostic odds ratio, AUC; area under the curve, NPV; negative predictive value.
Table 3. Subgroup analysis regarding image tool in discriminating oral precancerous and cancerous lesions from normal mucosa.
SubgroupStudy (n)DOR [95% CIs]Sensitivity [95% CIs]Specificity [95% CIs]NPV [95% CIs]AUC
1263.0193 [40.3234; 98.4896]; I2 = 88.2%0.9094 [0.8725; 0.9364]; I2 = 92.3%0.8848 [0.8400; 0.9183]; I2 = 93.8%0.9169 [0.8815; 0.9424]; I2 = 92.8%0.943
Image tool
Autofluorescence427.6313 [17.2272; 44.3186]; I2 = 69.3%0.8562 [0.8002; 0.8985]; I2 = 69.6%0.8356 [0.7591; 0.8913]; 86.8%0.8405 [0.7487; 0.9031]; 91.1%
Optical coherense tomography3324.3335 [10.2511; 10261.6006]; I2 = 95.6%0.9424 [0.8000; 0.9853]; I2 = 88.3%0.9653 [0.8737; 0.9911]; 79.8%0.9399 [0.8565; 0.9762]; 75.7%
Photographic image566.8107 [38.0216; 117.3983]; I2 = 81.7%0.9123 [0.8683; 0.9426]; I2 = 79.5%0.8779 [0.8322; 0.9125]; 87.4%0.9311 [0.9196; 0.9410]; 0.0%
0.03120.11200.06590.0073
DOR; diagnostic odds ratio, AUC; area under the curve, NPV; negative predictive value.
Publisher’s Note: MDPI stays neutral with regard to jurisdictional claims in published maps and institutional affiliations.

