
Diagnostic Strategies for Breast Cancer Detection: From Image Generation to Classification Strategies Using Artificial Intelligence Algorithms

 , and
, and
Abstract
:Simple Summary
Abstract
1. Introduction
2. Technologies Used to Obtain Breast Tissue Images
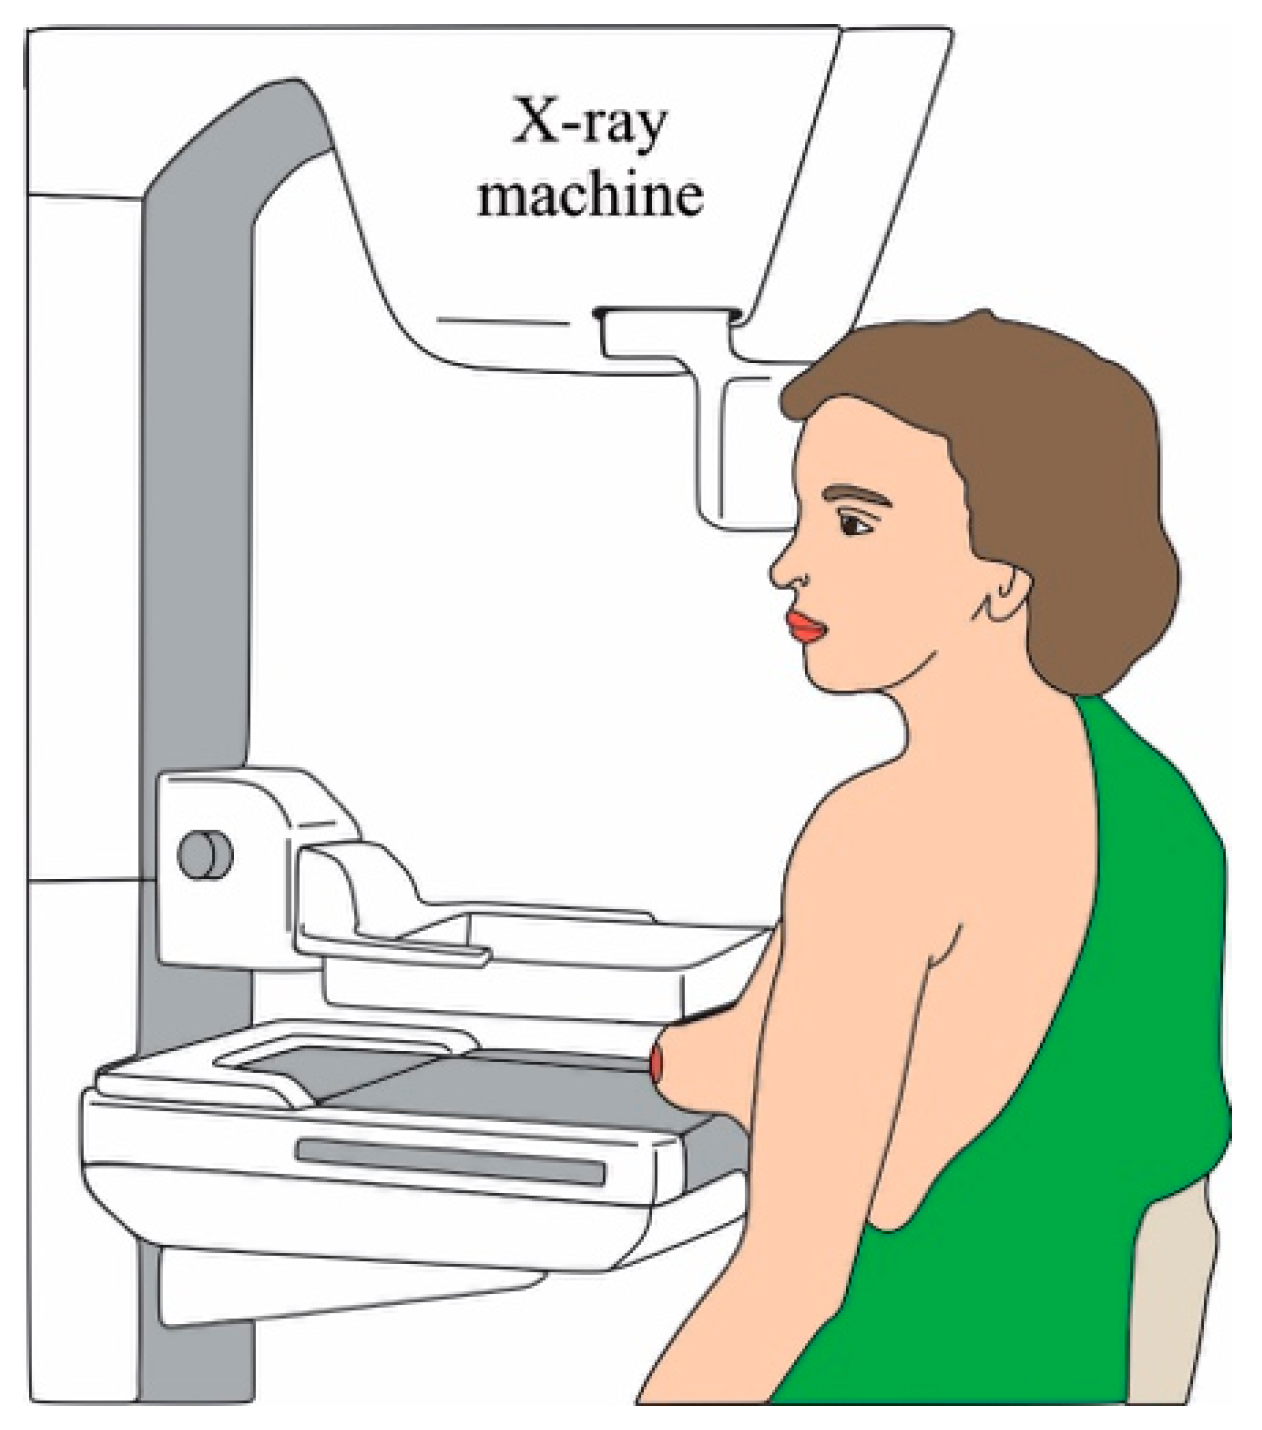
2.1. Mammography
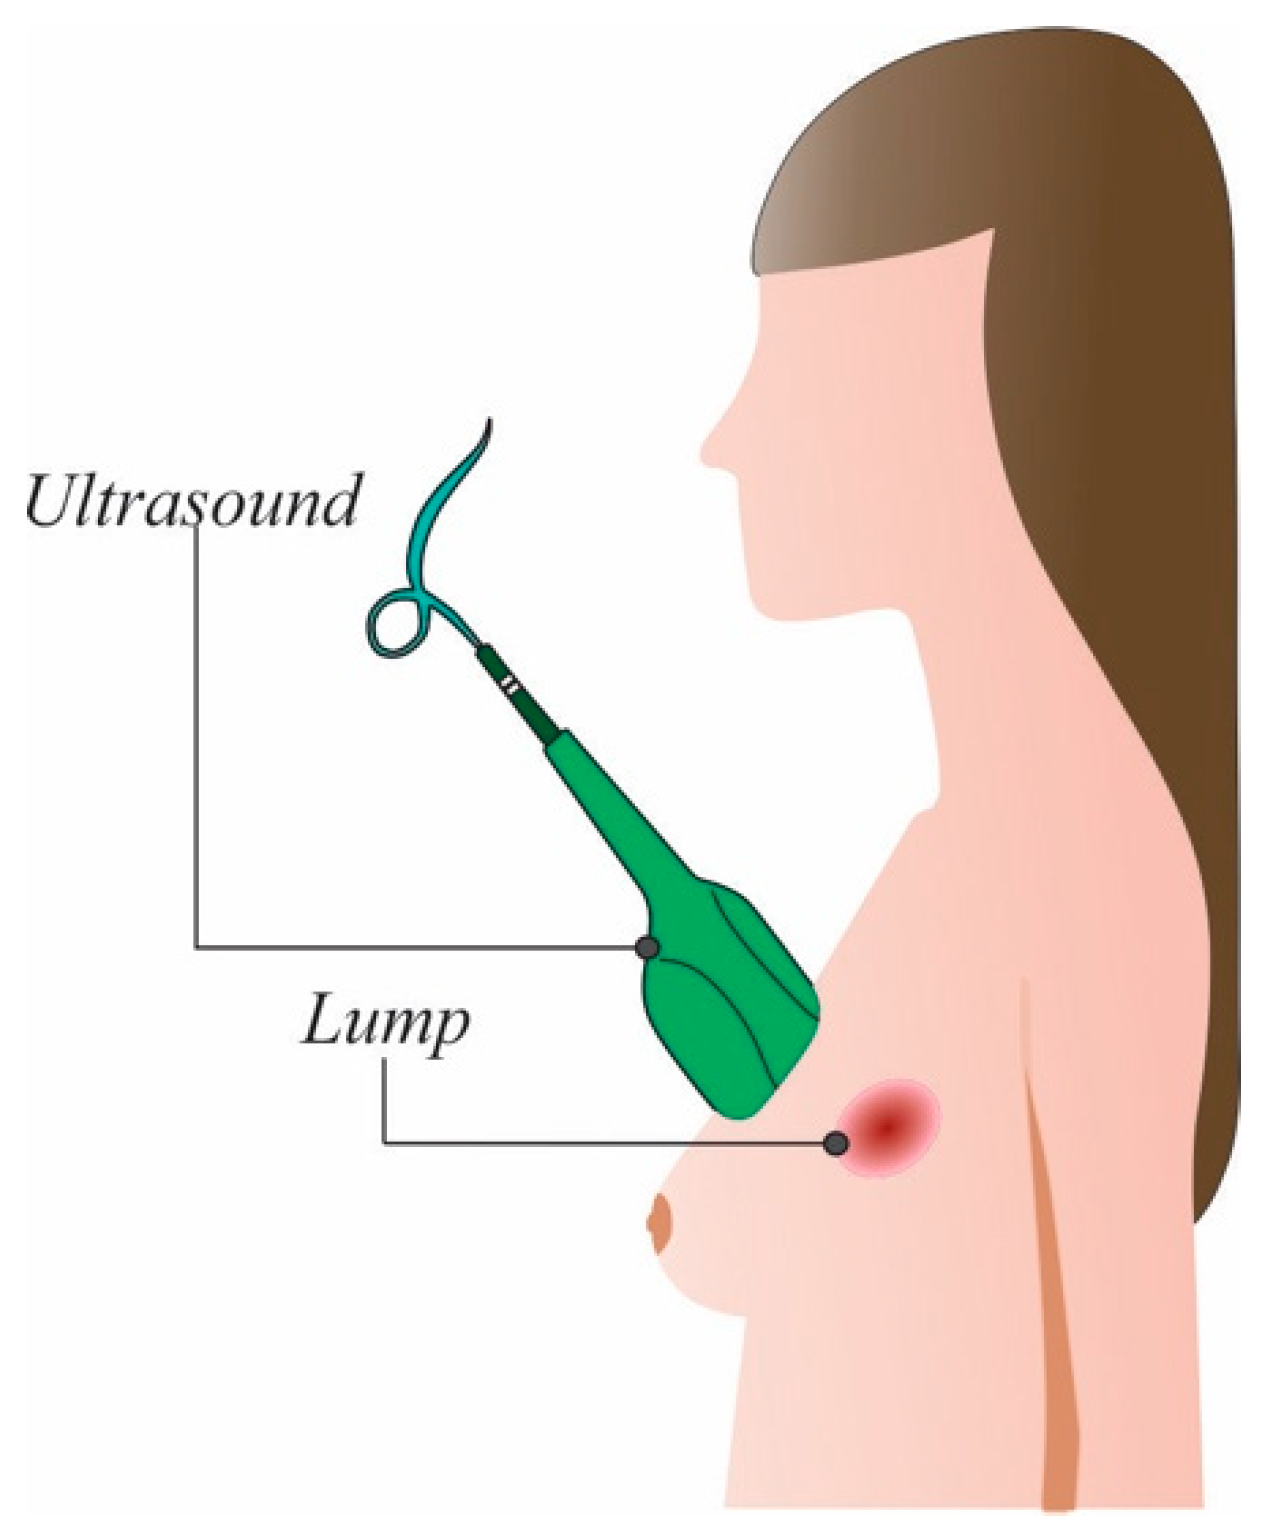
2.2. Ultrasound
2.3. Magnetic Resonance Imagining (MRI)
2.4. Other Approaches
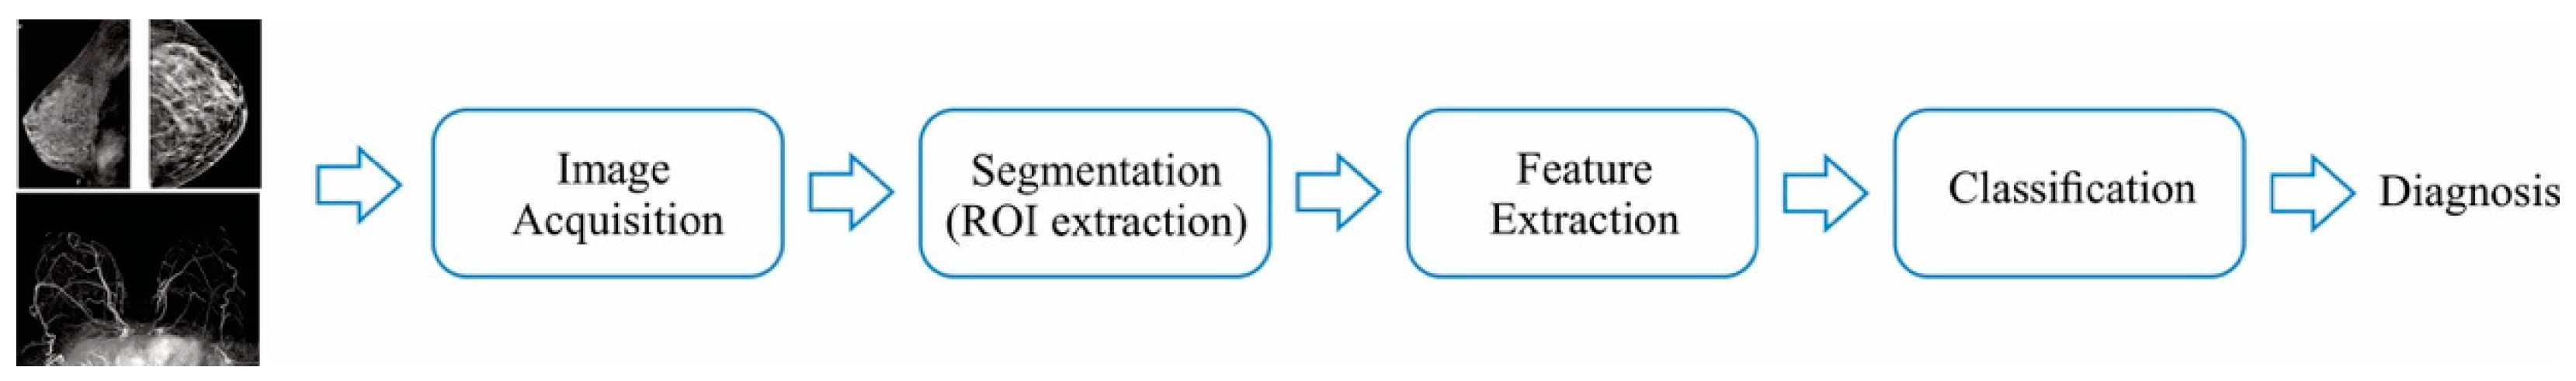
3. Image Processing and Classification Strategies
3.1. ROI Estimation
3.2. Feature Extraction
3.3. Classifiers
3.3.1. Unsupervised Classifiers
3.3.2. Supervised Classifiers
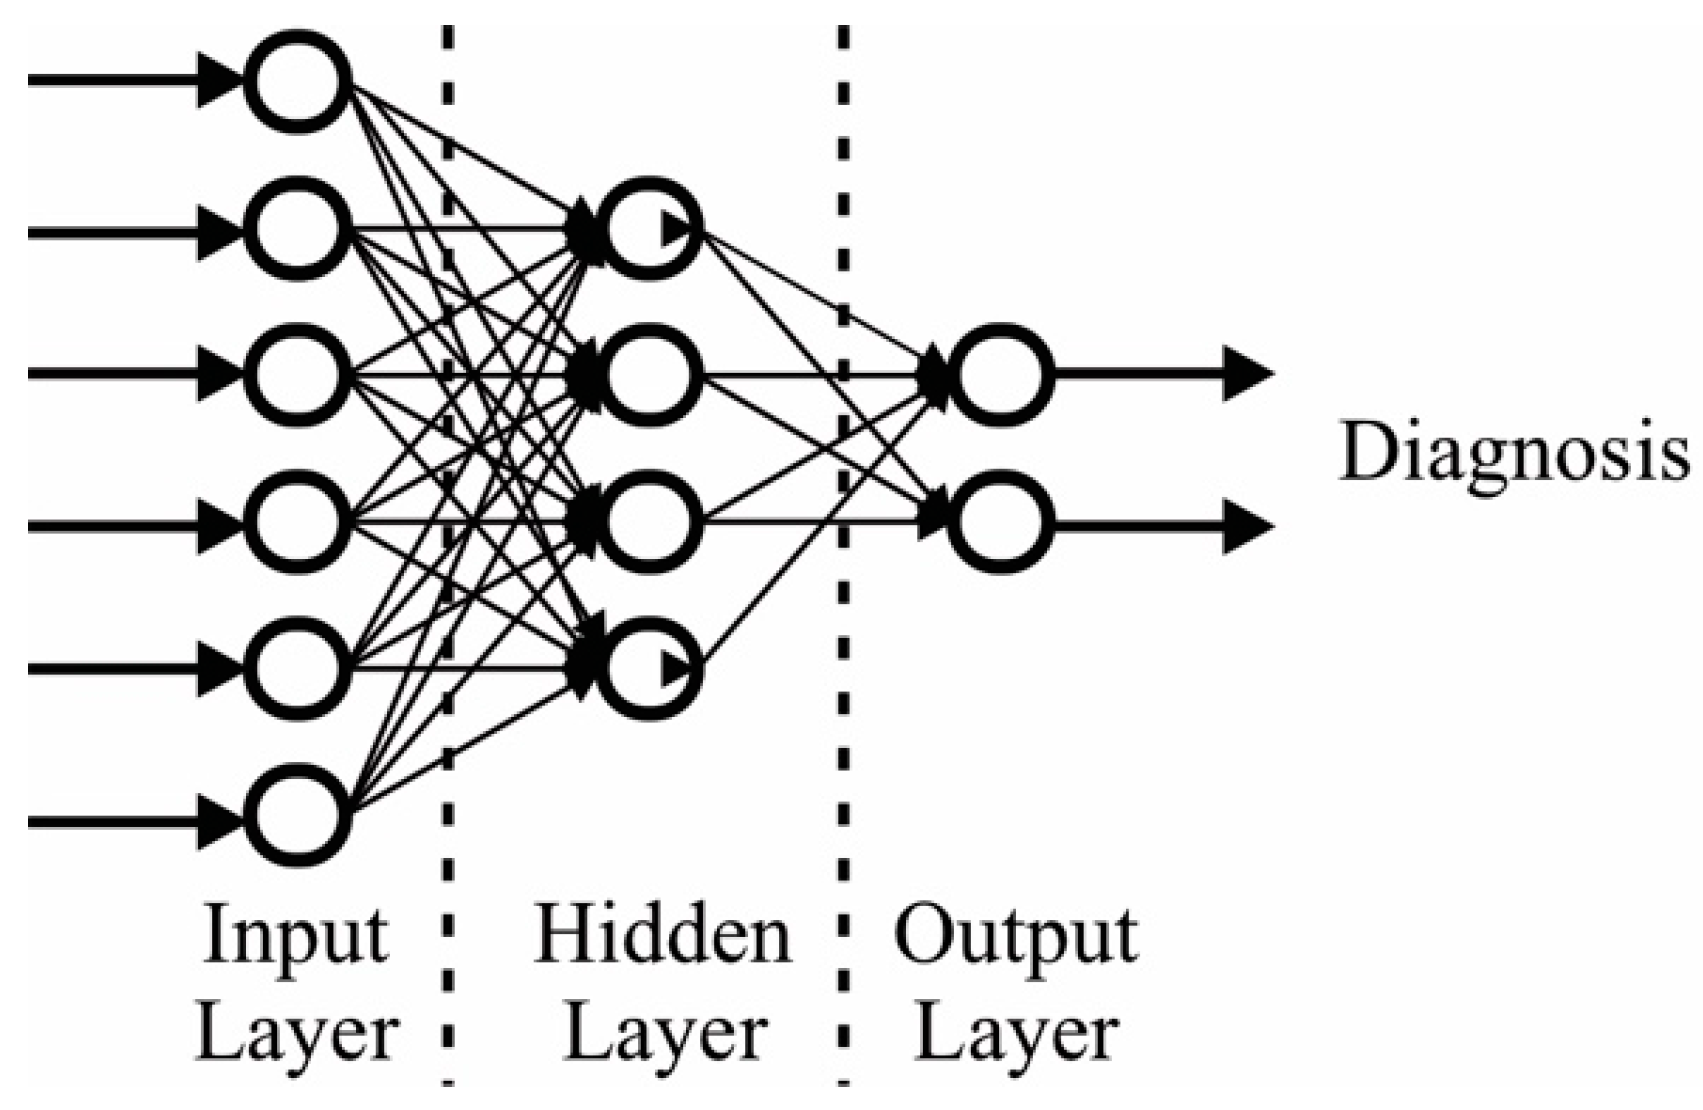
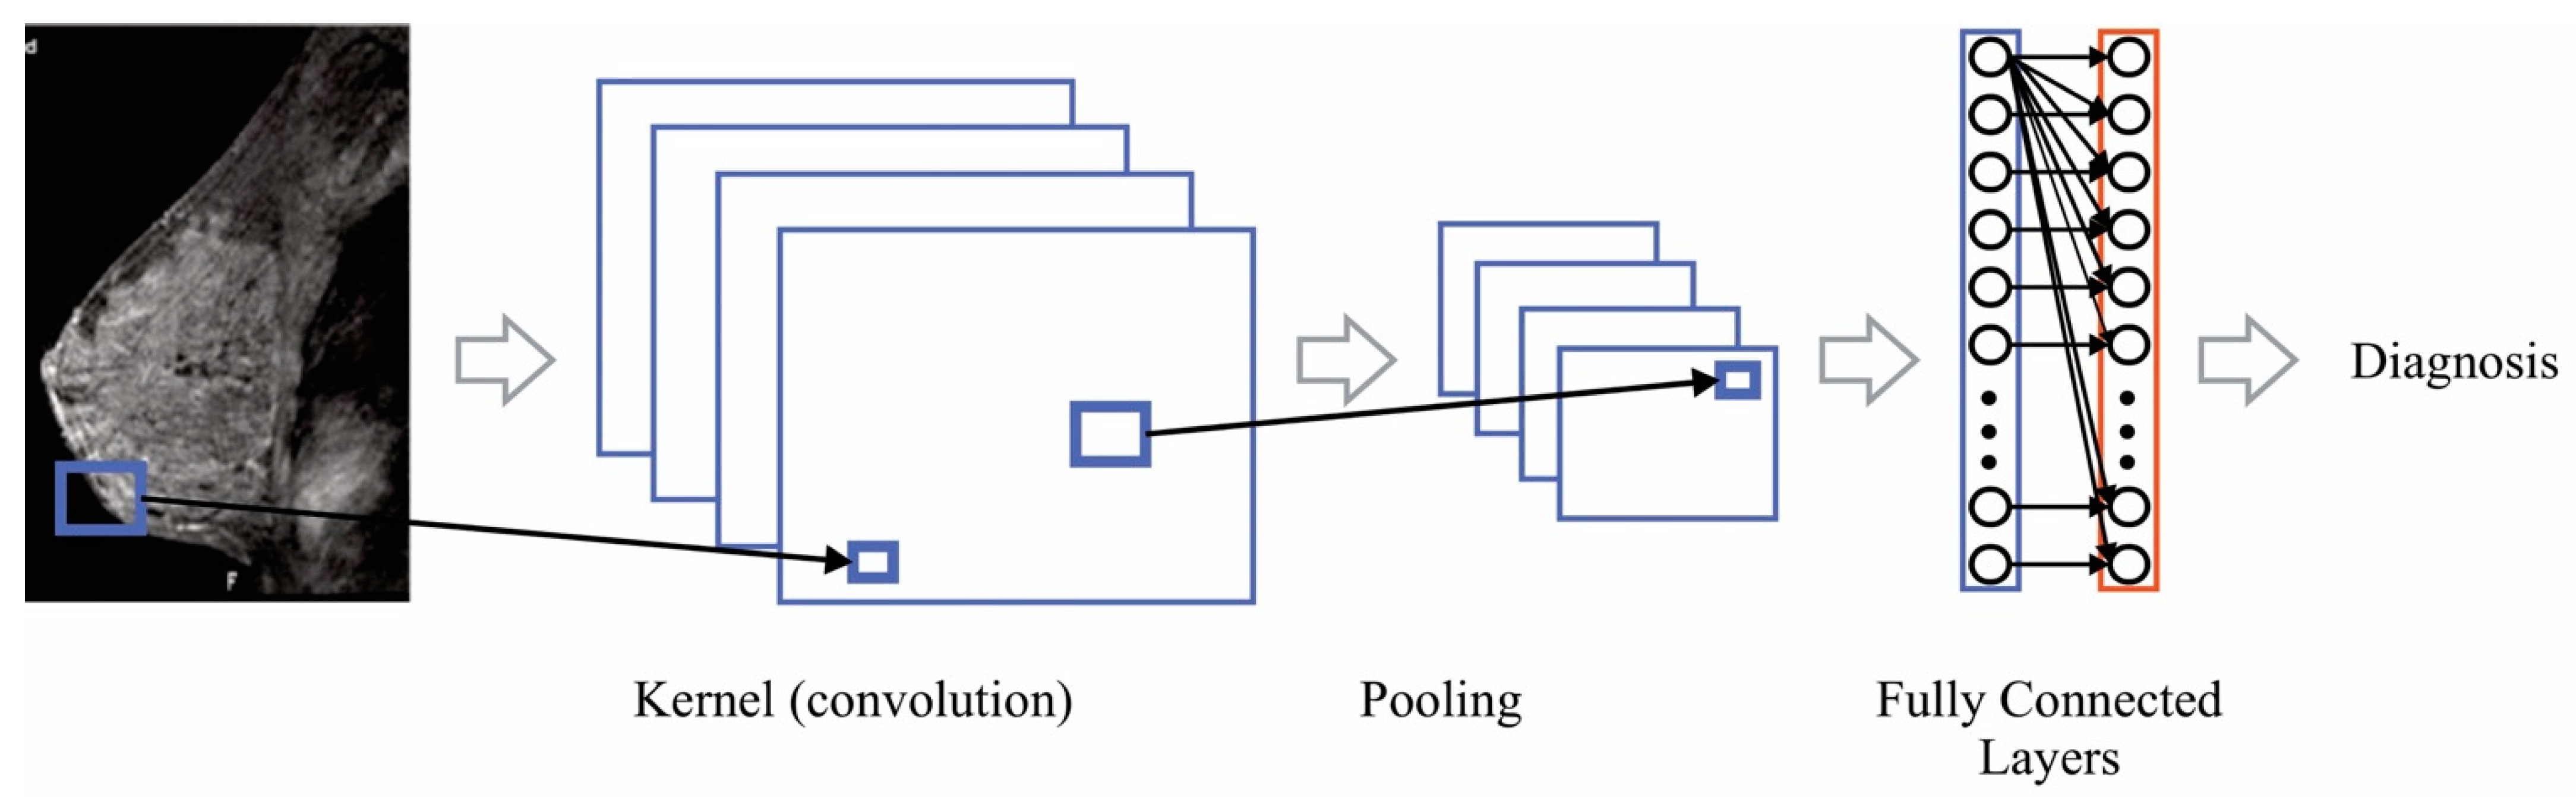
3.4. Artificial Intelligence-Based Classifiers
4. Recent Image Generation Techniques
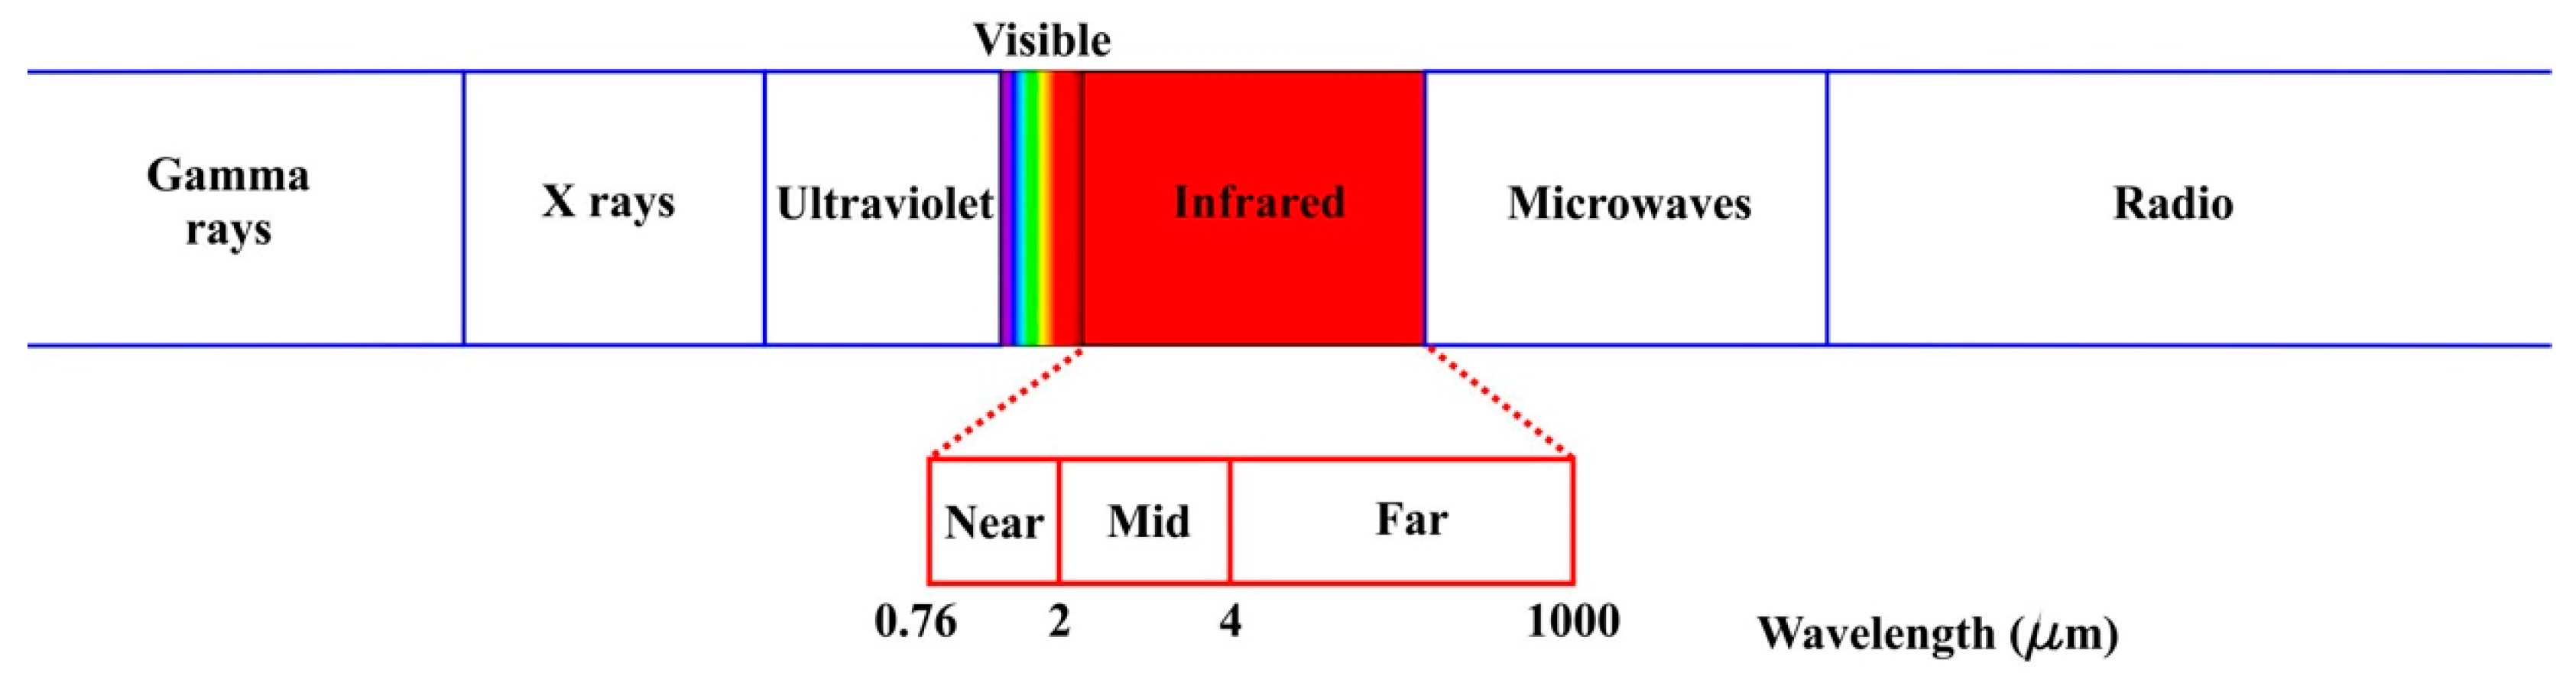
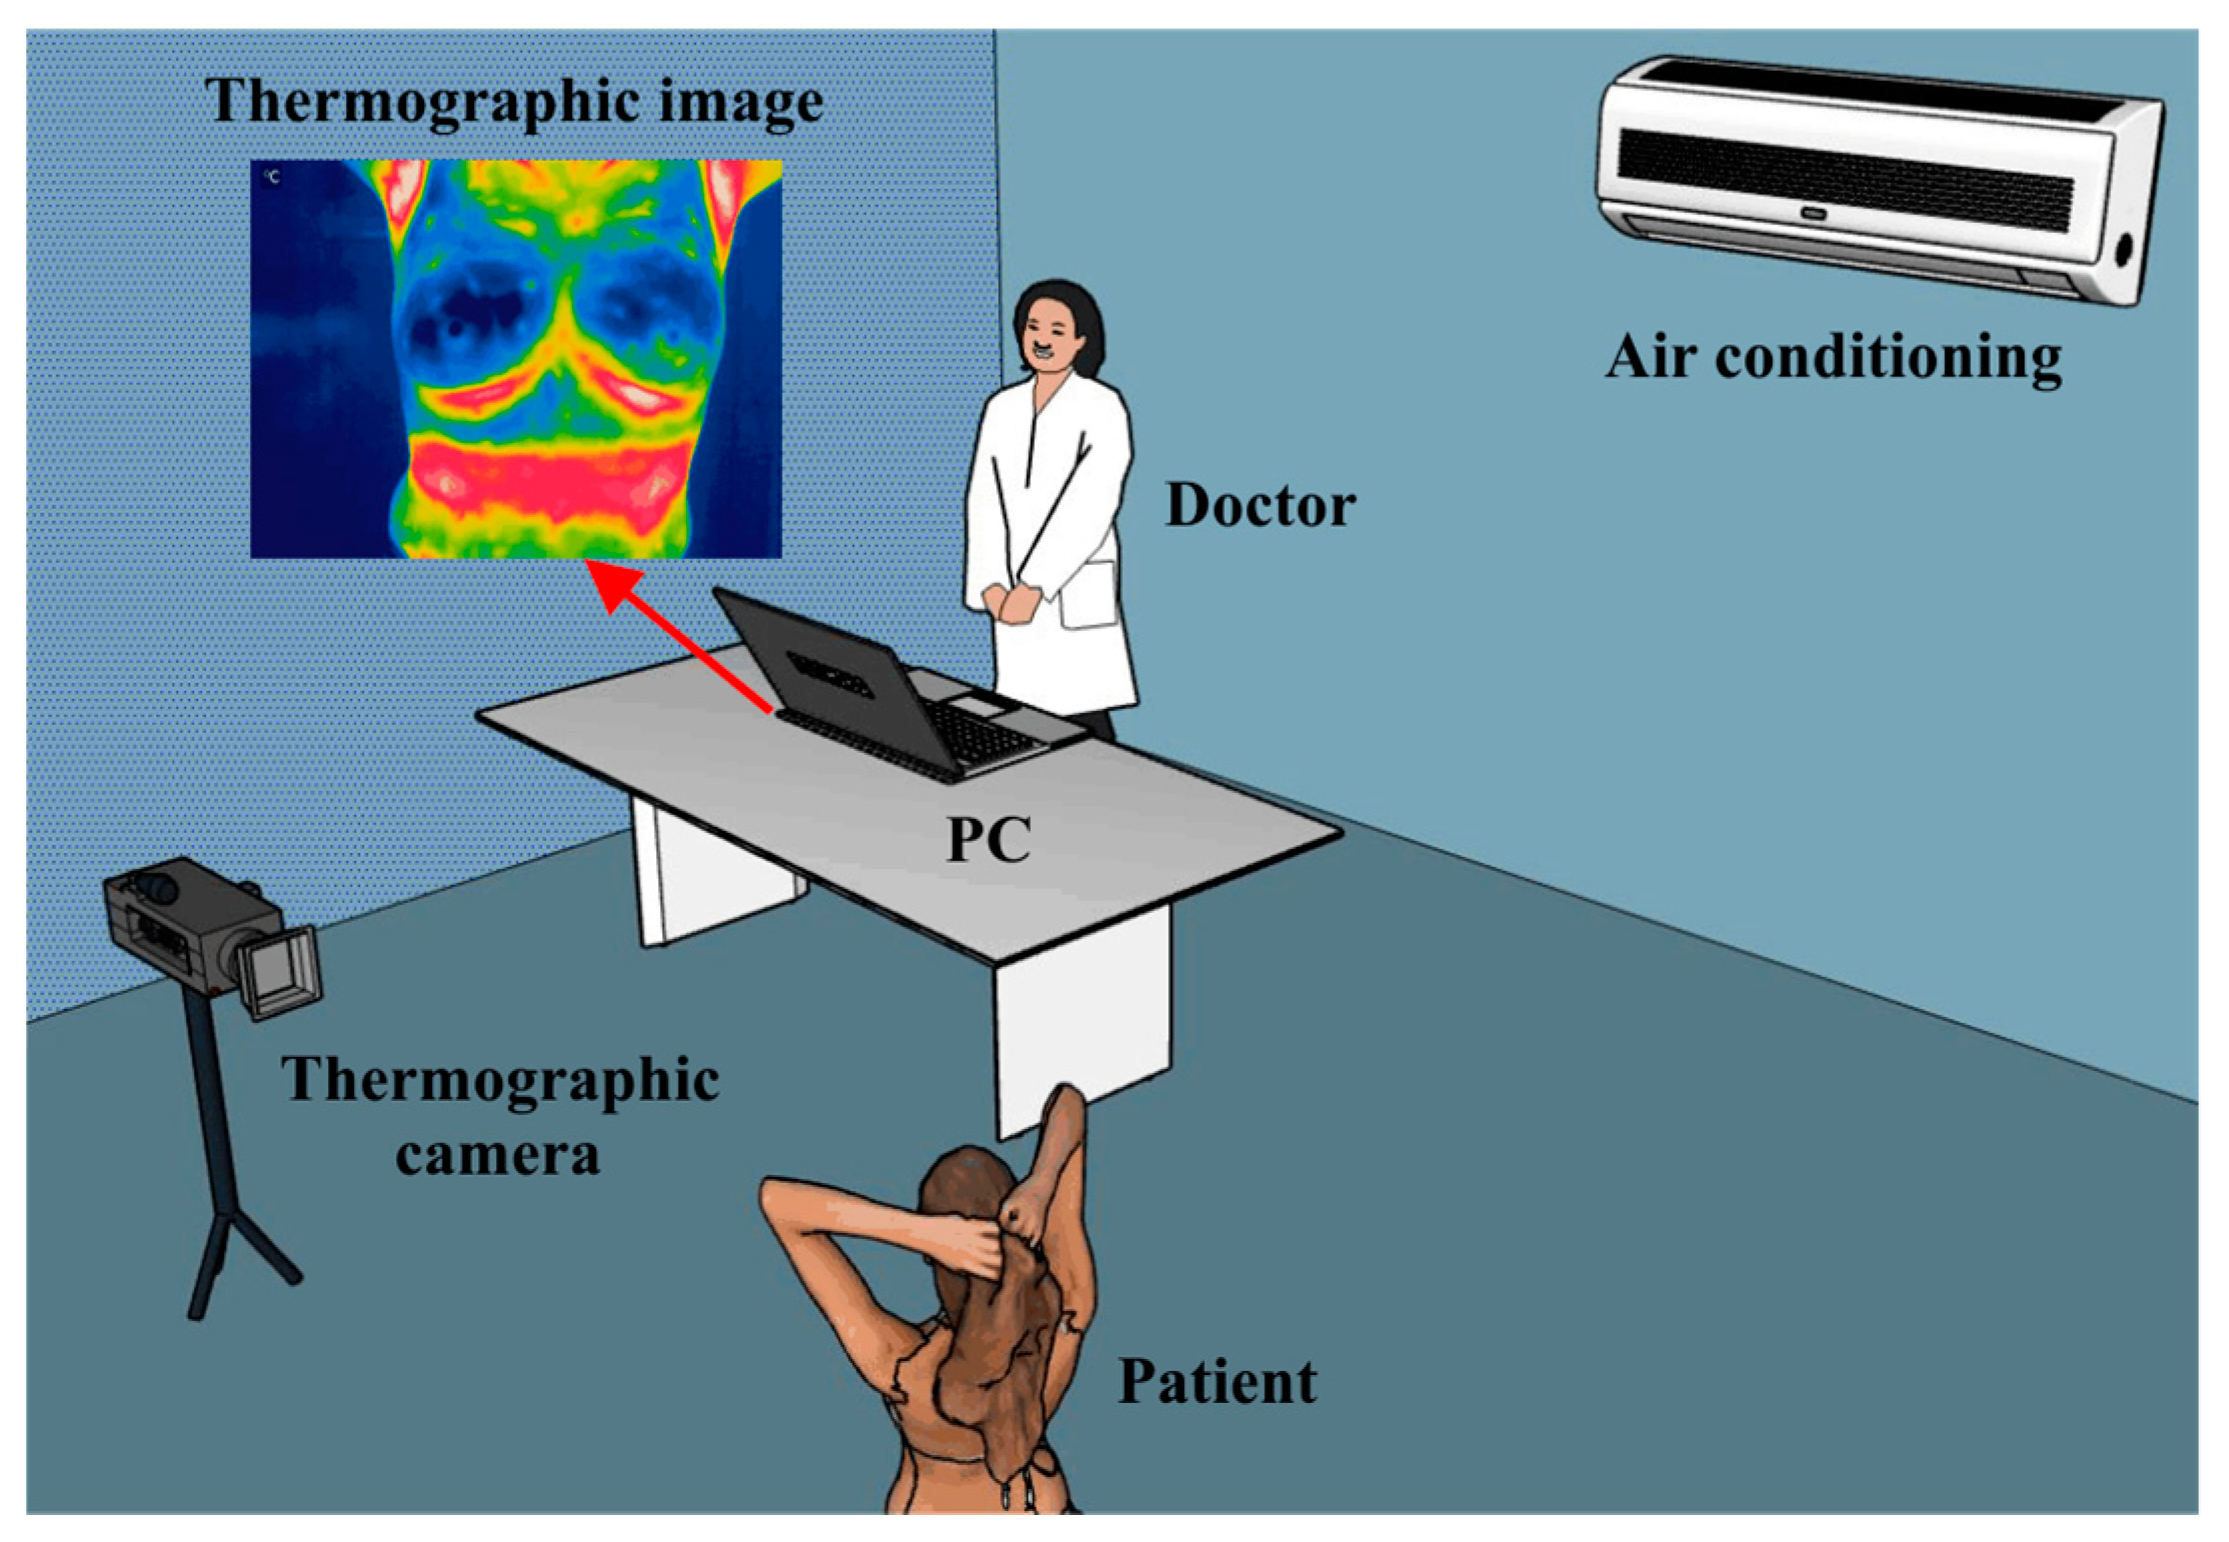
Infrared Thermography (IRT) Applied to Breast Cancer
- Individual factors: everything that has to do with the patient’s conditions, such as age, sex, height, medical history, among others. As well as the inclusion and exclusion criteria. An aspect of vital importance is the emissivity of humans, which is 0.98 [164].
- Technical factors: it has to do with everything related to the technology used during the study, such as the thermal imager (considering the distance from the lens to the patient), the protocol, the processing of the medical thermal images obtained, as well such as feature extraction and subsequent analysis.
- Environmental factors: room position (it should be located in the area of the lowest possible incidence of light), temperature, relative humidity of the space where the thermographic images are to be taken, as well as the patient’s air conditioning time.
5. Recent Classification Algorithms
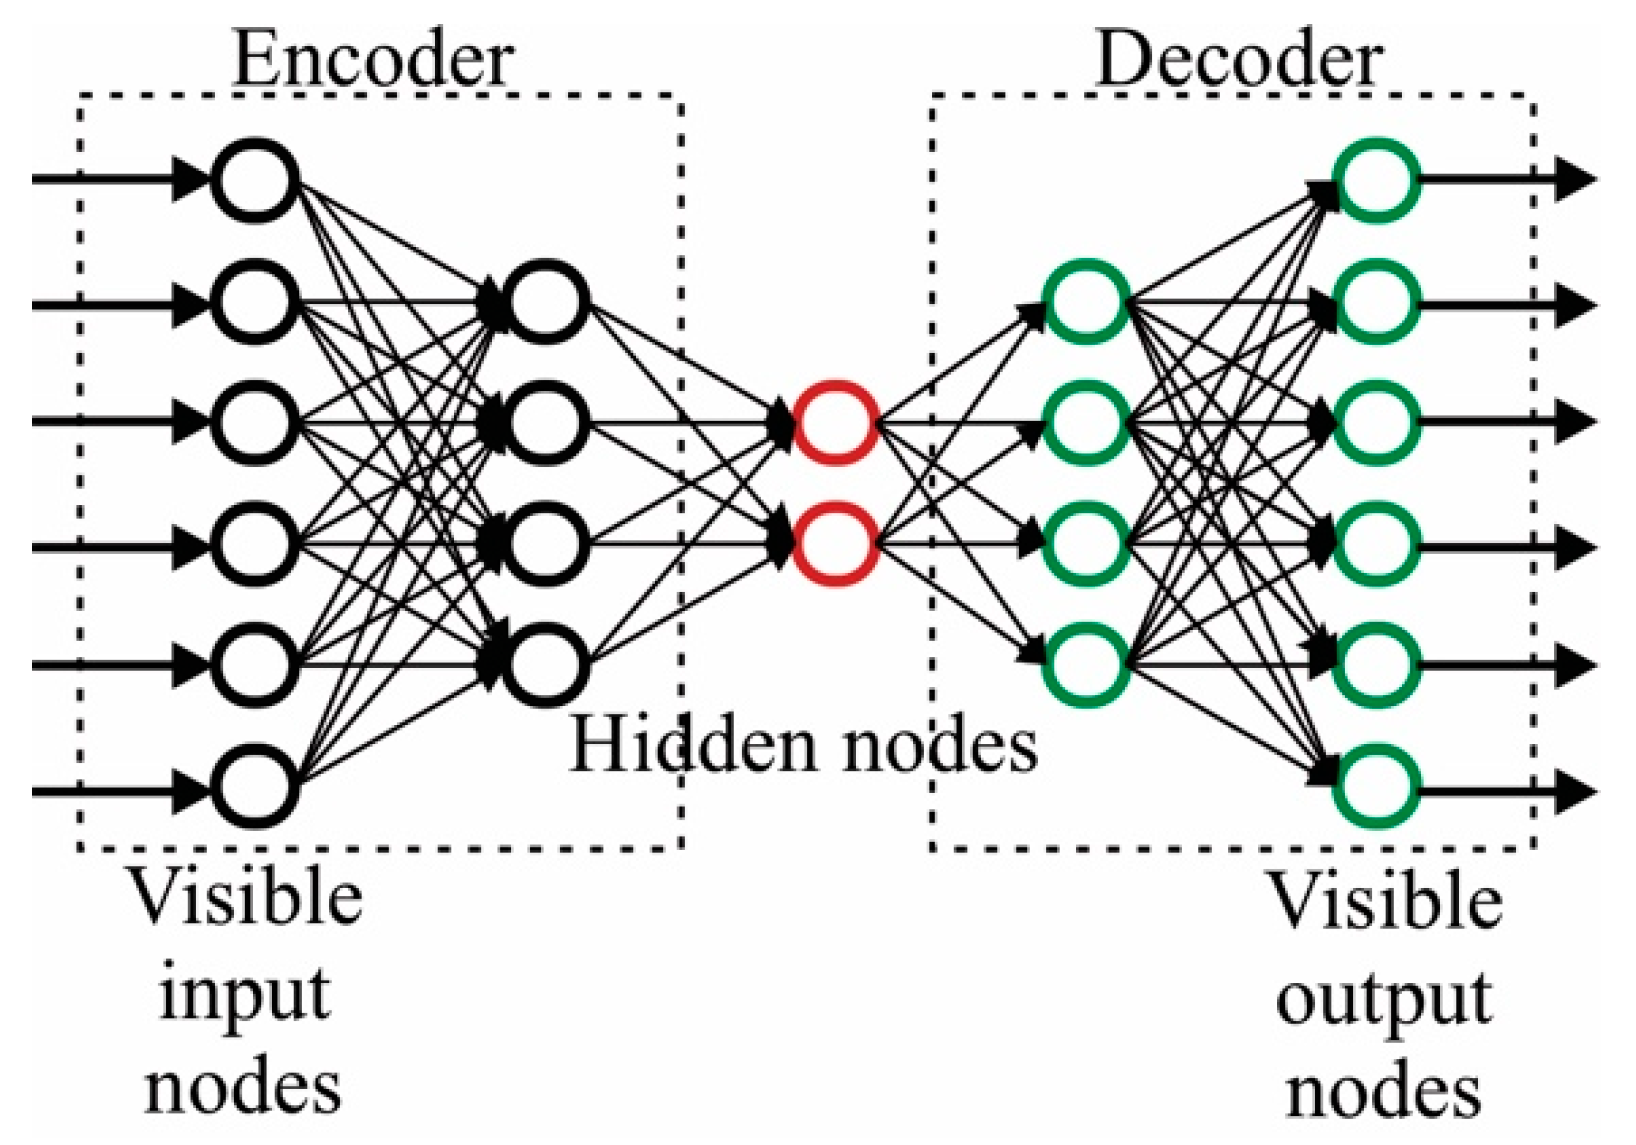
5.1. Autoencoders
5.2. Deep Belief Networks (DBF)
5.3. Ladder Networks
5.4. Deep Neural Network (DNN)-Based Algorithms
6. Concluding Remarks
Author Contributions
Funding
Institutional Review Board Statement
Informed Consent Statement
Data Availability Statement
Conflicts of Interest
References
- World Health Organization (WHO). Cáncer de Mama: Prevención y Control. Available online: https://www.who.int/topics/cancer/breastcancer/es/index1.html (accessed on 3 May 2022).
- Villa-Guillen, D.E.; Avila-Monteverde, E.; Gonzalez-Zepeda, J.H. Breast cancer risk and residential exposure to envi-ronmental hazards in Hermosillo, Sonora, Mexico [abstract]. In Proceedings of the 2019 San Antonio Breast Cancer Symposium, San Antonio, TX, USA, 10–14 December 2019; AACR: Philadelphia, PA, USA. [Google Scholar]
- Keith, B.; Simon, M.C. Tumor Angiogenesis. The Molecular Basis of Cancer, 4th ed.; Mendelsohn, J., Gray, J.W., Howley, P.M., Israel, M.A., Thompson, C.B., Eds.; Elsevier: Philadelphia, PA, USA, 2015; pp. 257–268. [Google Scholar]
- Semin, J.N.; Palm, D.; Smith, L.M.; Ruttle, S. Understanding breast cancer survivors’ financial burden and distress after financial assistance. Support. Care Cancer 2020, 28, 4241–4248. [Google Scholar] [CrossRef]
- Mann, R.M.; Cho, N.; Moy, L. Breast MRI: State of the Art. Radiology 2019, 292, 520–536. [Google Scholar] [CrossRef] [PubMed]
- Vobugari, N.; Raja, V.; Sethi, U.; Gandhi, K.; Raja, K.; Surani, S.R. Advancements in Oncology with Artificial Intelligence—A Review Article. Cancers 2022, 14, 1349. [Google Scholar] [CrossRef]
- Chougrad, H.; Zouaki, H.; Alheyane, O. Multi-label transfer learning for the early diagnosis of breast cancer. Neurocomputing 2020, 392, 168–180. [Google Scholar] [CrossRef]
- Le, E.P.V.; Wang, Y.; Huang, Y.; Hickman, S.; Gilbert, F. Artificial intelligence in breast imaging. Clin. Radiol. 2019, 74, 357–366. [Google Scholar] [CrossRef] [PubMed]
- Yassin, N.I.R.; Omran, S.; Houby, E.M.F.; Allam, H. Machine learning techniques for breast cancer computer aided diagnosis using different image modalities: A systematic review. Comput. Methods Programs Biomed. 2018, 156, 25–45. [Google Scholar] [CrossRef]
- Jochelson, M. Advanced Imaging Techniques for the Detection of Breast Cancer; American Society of Clinical Oncology Educational Book: Alexandria, VA, USA, 2012; pp. 65–69. [Google Scholar]
- Yaffe, M.J. AAPM tutorial. Physics of mammography: Image recording process. RadioGraphics 1990, 10, 341–363. [Google Scholar] [CrossRef] [Green Version]
- Pak, F.; Kanan, H.R.; Alikhassi, A. Breast cancer detection and classification in digital mammography based on Non-Subsampled Contourlet Transform (NSCT) and Super Resolution. Comput. Methods Programs Biomed. 2015, 122, 89–107. [Google Scholar] [CrossRef]
- Geweid, G.G.N.; Abdallah, M.A. A Novel Approach for Breast Cancer Investigation and Recognition Using M-Level Set-Based Optimization Functions. IEEE Access 2019, 7, 136343–136357. [Google Scholar] [CrossRef]
- Guzmán-Cabrera, R.; Guzmán-Sepúlveda, J.R.; Torres-Cisneros, M.; May-Arrioja, D.A.; Ruiz-Pinales, J.; Ibarra-Manzano, O.G.; Aviña-Cervantes, G.; Parada, A.G. Digital Image Processing Technique for Breast Cancer Detection. Int. J. Thermophys. 2012, 34, 1519–1531. [Google Scholar] [CrossRef]
- Avuti, S.K.; Bajaj, V.; Kumar, A.; Singh, G.K. A novel pectoral muscle segmentation from scanned mammograms using EMO algorithm. Biomed. Eng. Lett. 2019, 9, 481–496. [Google Scholar] [CrossRef]
- Vijayarajeswari, R.; Parthasarathy, P.; Vivekanandan, S.; Basha, A.A. Classification of mammogram for early detection of breast cancer using SVM classifier and Hough transform. Measurement 2019, 146, 800–805. [Google Scholar] [CrossRef]
- Rodríguez-Álvarez, M.X.; Tahoces, P.G.; Cadarso-Suárez, C.; Lado, M.J. Comparative study of ROC regression techniques—Applications for the computer-aided diagnostic system in breast cancer detection. Comput. Stat. Data Anal. 2011, 55, 888–902. [Google Scholar] [CrossRef]
- Cheng, H.D.; Shan, J.; Ju, W.; Guo, Y.; Zhang, L. Automated breast cancer detection and classification using ultrasound images: A survey. Pattern Recognit. 2010, 43, 299–317. [Google Scholar] [CrossRef] [Green Version]
- Ouyang, Y.; Tsui, P.-H.; Wu, S.; Wu, W.; Zhou, Z. Classification of Benign and Malignant Breast Tumors Using H-Scan Ultrasound Imaging. Diagnostics 2019, 9, 182. [Google Scholar] [CrossRef] [PubMed] [Green Version]
- Ouyang, Y.; Tsui, P.-H.; Wu, S.; Wu, W.; Zhou, Z. Breast cancer detection by B7-H3–targeted ultrasound molecular imaging. Cancer Res. 2015, 75, 2501–2509. [Google Scholar] [CrossRef] [Green Version]
- Athanasiou, A.; Tardivon, A.; Ollivier, L.; Thibault, F.; El Khoury, C.; Neuenschwander, S. How to optimize breast ultrasound. Eur. J. Radiol. 2009, 69, 6–13. [Google Scholar] [CrossRef]
- Mumin MRad, N.A.; Hamid MRad, M.T.R.; Ding Wong, J.H.; Rahmat MRad, K.; Hoong Ng, K. Magnetic Resonance Imaging Phenotypes of Breast Cancer Molecular Subtypes: A Systematic Review. Acad. Radiol. 2022, 29, S89–S106. [Google Scholar] [CrossRef]
- Han, C.; Zhang, A.; Kong, Y.; Yu, N.; Xie, T.; Dou, B.; Li, K.; Wang, Y.; Li, J.; Xu, K. Multifunctional iron oxide-carbon hybrid nanoparticles for targeted fluorescent/MR dual-modal imaging and detection of breast cancer cells. Anal. Chim. Acta 2019, 1067, 115–128. [Google Scholar] [CrossRef]
- Mango, V.L.; Morris, E.A.; Dershaw, D.D.; Abramson, A.; Fry, C.; Moskowitz, C.S.; Hughes, M.; Kaplan, J.; Jochelson, M.S. Abbreviated protocol for breast MRI: Are multiple sequences needed for cancer detection? Eur. J. Radiol. 2015, 84, 65–70. [Google Scholar] [CrossRef]
- Nikolova, N.K. Microwave Imaging for Breast Cancer. IEEE Microw. Mag. 2011, 12, 78–94. [Google Scholar] [CrossRef]
- Xu, M.; Thulasiraman, P.; Noghanian, S. Microwave tomography for breast cancer detection on Cell broadband engine processors. J. Parallel Distrib. Comput. 2021, 72, 1106–1116. [Google Scholar] [CrossRef]
- Grzegorczyk, T.M.; Meaney, P.M.; Kaufman, P.A.; di Florio-Alexander, R.M.; Paulsen, K.D. Fast 3-D Tomographic Microwave Imaging for Breast Cancer Detection. IEEE Trans. Med. Imaging 2012, 31, 1584–1592. [Google Scholar] [CrossRef] [PubMed] [Green Version]
- AlSawaftah, N.; El-Abed, S.; Dhou, S.; Zakaria, A. Microwave Imaging for Early Breast Cancer Detection: Current State, Challenges, and Future Directions. J. Imaging 2022, 8, 123. [Google Scholar] [CrossRef] [PubMed]
- Zerrad, F.-E.; Taouzari, M.; Makroum, E.M.; El Aoufi, J.; Islam, M.T.; Özkaner, V.; Abdulkarim, Y.I.; Karaaslan, M. Multilayered metamaterials array antenna based on artificial magnetic conductor’s structure for the application diagnostic breast cancer detection with microwave imaging. Med. Eng. Phys. 2022, 99, 103737. [Google Scholar] [CrossRef]
- Karabatak, M.; Ince, M.C. An expert system for detection of breast cancer based on association rules and neural network. Expert Syst. Appl. 2009, 36, 3465–3469. [Google Scholar] [CrossRef]
- Wang, P.; Hu, X.; Li, Y.; Liu, Q.; Zhu, X. Automatic cell nuclei segmentation and classification of breast cancer histopathology images. Signal Process. 2016, 122, 1–13. [Google Scholar] [CrossRef]
- Wahab, N.; Khan, A.; Lee, Y.S. Two-phase deep convolutional neural network for reducing class skewness in histopathological images based breast cancer detection. Comput. Biol. Med. 2017, 85, 86–97. [Google Scholar] [CrossRef]
- Fan, Y.; Wang, H.; Gemmeke, H.; Hopp, T.; Hesser, J. Model-data-driven image reconstruction with neural networks for ultrasound computed tomography breast imaging. Neurocomputing 2022, 467, 10–21. [Google Scholar] [CrossRef]
- Koh, J.; Yoon, Y.; Kim, S.; Han, K.; Kim, E.-K. Deep Learning for the Detection of Breast Cancers on Chest Computed Tomography. Clin. Breast Cancer 2021, 22, 26–31. [Google Scholar] [CrossRef]
- Zangheri, B.; Messa, C.; Picchio, M.; Gianolli, L.; Landoni, C.; Fazio, F. PET/CT and breast cancer. Euro. J. Nuclear Med. Mol. Imaging. 2004, 31, S135–S142. [Google Scholar] [CrossRef] [PubMed]
- Sollini, M.; Cozzi, L.; Ninatti, G.; Antunovic, L.; Cavinato, L.; Chiti, A.; Kirienko, M. PET/CT radiomics in breast cancer: Mind the step. Methods 2020, 188, 122–132. [Google Scholar] [CrossRef] [PubMed]
- Salaün, P.-Y.; Abgral, R.; Malard, O.; Querellou-Lefranc, S.; Quere, G.; Wartski, M.; Coriat, R.; Hindie, E.; Taieb, D.; Tabarin, A.; et al. Good clinical practice recommendations for the use of PET/CT in oncology. Eur. J. Nuclear Med. Mol. Imaging 2020, 47, 28–50. [Google Scholar] [CrossRef] [PubMed]
- Yi, A.; Jang, M.-J.; Yim, D.; Kwon, B.R.; Shin, S.U.; Chang, J.M. Addition of Screening Breast US to Digital Mammography and Digital Breast Tomosynthesis for Breast Cancer Screening in Women at Average Risk. Radiology 2021, 298, 568–575. [Google Scholar] [CrossRef]
- Spak, D.A.; Le-Petross, H.T. Screening Modalities for Women at Intermediate and High Risk for Breast Cancer. Curr. Breast Cancer Rep. 2019, 11, 111–116. [Google Scholar] [CrossRef]
- Lee, T.C.; Reyna, C.; Shaughnessy, E.; Lewis, J.D. Screening of populations at high risk for breast cancer. J. Surg. Oncol. 2019, 120, 820–830. [Google Scholar] [CrossRef]
- Shah, T.A.; Guraya, S.S. Breast cancer screening programs: Review of merits, demerits, and recent recommendations practiced across the world. J. Microsc. Ultrastruct. 2017, 5, 59–69. [Google Scholar] [CrossRef]
- Nguyen, D.L.; Myers, K.S.; Oluyemi, E.; Mullen, L.A.; Panigrahi, B.; Rossi, J.; Ambinder, E.B. BI-RADS 3 Assessment on MRI: A Lesion-Based Review for Breast Radiologists. J. Breast Imaging 2022, wbac032. [Google Scholar] [CrossRef]
- Daimiel Naranjo, I.; Gibbs, P.; Reiner, J.S.; Lo Gullo, R.; Thakur, S.B.; Jochelson, M.S.; Thakur, N.; Baltzer, P.A.T.; Helbich, T.H.; Pinker, K. Breast Lesion Classification with Multiparametric Breast MRI Using Radiomics and Machine Learning: A Comparison with Radiologists’ Performance. Cancers 2022, 14, 1743. [Google Scholar] [CrossRef]
- Shimauchi, A.; Jansen, S.A.; Abe, H.; Jaskowiak, N.; Schmidt, R.A.; Newstead, G.M. Breast Cancers Not Detected at MRI: Review of False-Negative Lesions. Am. J. Roentgenol. 2010, 194, 1674–1679. [Google Scholar] [CrossRef]
- Tasdemir, S.B.Y.; Tasdemir, K.; Aydin, Z. A review of mammographic region of interest classification. WIREs Data Min. Knowl. Discov. 2020, 10, 1357. [Google Scholar] [CrossRef]
- Sha, Z.; Hu, L.; Rouyendegh, B.D. Deep learning and optimization algorithms for automatic breast cancer detection. Int. J. Imaging Syst. Technol. 2020, 30, 495–506. [Google Scholar] [CrossRef]
- Wang, C.; Brentnall, A.R.; Mainprize, J.G.; Yaffe, M.; Cuzick, J.; Harvey, J.A. External validation of a mammographic texture marker for breast cancer risk in a case–control study. J. Med. Imaging 2020, 7, 014003. [Google Scholar] [CrossRef] [PubMed] [Green Version]
- Heidari, M.; Mirniaharikandehei, S.; Liu, W.; Hollingsworth, A.B.; Liu, H.; Zheng, B. Development and Assessment of a New Global Mammographic Image Feature Analysis Scheme to Predict Likelihood of Malignant Cases. IEEE Trans. Med. Imaging 2020, 39, 1235–1244. [Google Scholar] [CrossRef]
- Suresh, R.; Rao, A.N.; Reddy, B.E. Detection and classification of normal and abnormal patterns in mammograms using deep neural network. Concurr. Comput. Pract. Exp. 2018, 31, 5293. [Google Scholar] [CrossRef]
- Sapate, S.; Talbar, S.; Mahajan, A.; Sable, N.; Desai, S.; Thakur, M. Breast cancer diagnosis using abnormalities on ipsilateral views of digital mammograms. Biocybern. Biomed. Eng. 2020, 40, 290–305. [Google Scholar] [CrossRef]
- Pezeshki, H. Breast tumor segmentation in digital mammograms using spiculated regions. Biomed. Signal Process. Control 2022, 76, 103652. [Google Scholar] [CrossRef]
- Liu, Y.; Ren, L.; Cao, X.; Tong, Y. Breast tumors recognition based on edge feature extraction using support vector machine. Biomed. Signal Process. Control 2020, 58, 101825. [Google Scholar] [CrossRef]
- Liu, Y.; Ren, L.; Cao, X.; Tong, Y. Diffusion-Weighted MRI of Breast Cancer: Improved Lesion Visibility and Image Quality Using Synthetic b-Values. J. Magn. Reson. Imaging 2019, 50, 1754–1761. [Google Scholar]
- Almalki, Y.E.; Soomro, T.A.; Irfan, M.; Alduraibi, S.K.; Ali, A. Impact of Image Enhancement Module for Analysis of Mammogram Images for Diagnostics of Breast Cancer. Sensors 2022, 22, 1868. [Google Scholar] [CrossRef]
- Rani, V.M.K.; Dhenakaran, S.S. Classification of ultrasound breast cancer tumor images using neural learning and predicting the tumor growth rate. Multimed. Tools Appl. 2020, 79, 16967–16985. [Google Scholar] [CrossRef]
- Bria, A.; Karssemeijer, N.; Tortorella, F. Learning from unbalanced data: A cascade-based approach for detecting clustered microcalcifications. Med. Image Anal. 2014, 18, 241–252. [Google Scholar] [CrossRef] [PubMed]
- Shrivastava, N.; Bharti, J. Breast Tumor Detection in Digital Mammogram Based on Efficient Seed Region Growing Segmentation. IETE J. Res. 2020. [Google Scholar] [CrossRef]
- Singh, H.; Sharma, V.; Singh, D. Comparative analysis of proficiencies of various textures and geometric features in breast mass classification using k-nearest neighbor. Vis. Comput. Ind. Biomed. Art 2022, 5, 1–19. [Google Scholar] [CrossRef] [PubMed]
- Sasaki, M.; Tozaki, M.; Rodríguez-Ruiz, A.; Yotsumoto, D.; Ichiki, Y.; Terawaki, A.; Oosako, S.; Sagara, Y.; Sagara, Y. Artificial intelligence for breast cancer detection in mammography: Experience of use of the ScreenPoint Medical Transpara system in 310 Japanese women. Breast Cancer 2020, 27, 642–651. [Google Scholar] [CrossRef]
- Junior, G.B.; da Rocha, S.V.; de Almeida, J.D.S.; de Paiva, A.C.; Silva, A.C.; Gattass, M. Breast cancer detection in mammography using spatial diversity, geostatistics, and concave geometry. Multimed. Tools Appl. 2019, 78, 13005–13031. [Google Scholar] [CrossRef]
- Fanizzi, A.; Basile, T.M.A.; Losurdo, L.; Bellotti, R.; Bottigli, U.; Dentamaro, R.; Didonna, V.; Fausto, A.; Massafra, R.; Moschetta, M.; et al. A machine learning approach on multiscale texture analysis for breast microcalcification diagnosis. BMC Bioinform. 2020, 21, 1–11. [Google Scholar] [CrossRef] [Green Version]
- Green, C.A.; Goodsitt, M.M.; Lau, J.H.; Brock, K.K.; Davis, C.L.; Carson, P.L. Deformable Mapping Method to Relate Lesions in Dedicated Breast CT Images to Those in Automated Breast Ultrasound and Digital Breast Tomosynthesis Images. Ultrasound Med. Biol. 2020, 46, 750–765. [Google Scholar] [CrossRef]
- Padmavathy, T.V.; Vimalkumar, M.N.; Bhargava, D.S. Adaptive clustering based breast cancer detection with ANFIS classifier using mammographic images. Clust. Comput. 2019, 22, 13975–13984. [Google Scholar] [CrossRef]
- Raghavendra, U.; Gudigar, A.; Ciaccio, E.J.; Ng, K.H.; Chan, W.Y.; Rahmat, K.; Acharya, U.R. 2DSM vs FFDM: A computer aided diagnosis based comparative study for the early detection of breast cancer. Expert Syst. 2021, 38, e12474. [Google Scholar] [CrossRef]
- Wang, Z.; Li, M.; Wang, H.; Jiang, H.; Yao, Y.; Zhang, H.; Xin, J. Breast Cancer Detection Using Extreme Learning Machine Based on Feature Fusion with CNN Deep Features. IEEE Access 2019, 7, 105146–105158. [Google Scholar] [CrossRef]
- Yap, M.H.; Pons, G.; Marti, J.; Ganau, S.; Sentis, M.; Zwiggelaar, R.; Davison, A.K.; Marti, R. Automated Breast Ultrasound Lesions Detection Using Convolutional Neural Networks. IEEE J. Biomed. Health Inform. 2018, 22, 1218–1226. [Google Scholar] [CrossRef] [PubMed] [Green Version]
- Teare, P.; Fishman, M.; Benzaquen, O.; Toledano, E.; Elnekave, E. Malignancy Detection on Mammography Using Dual Deep Convolutional Neural Networks and Genetically Discovered False Color Input Enhancement. J. Digit. Imaging 2017, 30, 499–505. [Google Scholar] [CrossRef] [PubMed]
- Shen, L.; Margolies, L.R.; Rothstein, J.H.; Fluder, E.; McBride, R.; Sieh, W. Deep Learning to Improve Breast Cancer Detection on Screening Mammography. Sci. Rep. 2019, 9, 1–12. [Google Scholar] [CrossRef] [PubMed]
- Gamage, T.P.B.; Malcolm, D.T.K.; Talou, G.D.M.; Mîra, A.; Doyle, A.; Nielsen, P.M.F.; Nash, M.P. An automated computational biomechanics workflow for improving breast cancer diagnosis and treatment. Interface Focus 2019, 9, 20190034. [Google Scholar] [CrossRef] [Green Version]
- Bouron, C.; Mathie, C.; Seegers, V.; Morel, O.; Jézéquel, P.; Lasla, H.; Guillerminet, C.; Girault, S.; Lacombe, M.; Sher, A.; et al. Prognostic Value of Metabolic, Volumetric and Textural Parameters of Baseline [18F]FDG PET/CT in Early Triple-Negative Breast Cancer. Cancers 2022, 14, 637. [Google Scholar] [CrossRef]
- Mughal, B.; Sharif, M.; Muhammad, N. Bi-model processing for early detection of breast tumor in CAD system. Eur. Phys. J. Plus 2017, 132, 266. [Google Scholar] [CrossRef]
- Wang, S.; Rao, R.V.; Chen, P.; Zhang, Y.; Liu, A.; Wei, L. Abnormal Breast Detection in Mammogram Images by Feed-forward Neural Network Trained by Jaya Algorithm. Fundam. Inform. 2017, 151, 191–211. [Google Scholar] [CrossRef]
- Muduli, D.; Dash, R.; Majhi, B. Automated breast cancer detection in digital mammograms: A moth flame optimization based ELM approach. Biomed. Signal Process. Control 2020, 59, 101912. [Google Scholar] [CrossRef]
- Shiji, T.P.; Remya, S.; Lakshmanan, R.; Pratab, T.; Thomas, V. Evolutionary intelligence for breast lesion detection in ultrasound images: A wavelet modulus maxima and SVM based approach. J. Intell. Fuzzy Syst. 2020, 38, 6279–6290. [Google Scholar] [CrossRef]
- Chakraborty, J.; Midya, A.; Rabidas, R. Computer-aided detection and diagnosis of mammographic masses using multi-resolution analysis of oriented tissue patterns. Expert Syst. Appl. 2018, 99, 168–179. [Google Scholar] [CrossRef]
- Jara-Maldonado, M.; Alarcon-Aquino, V.; Rosas-Romero, R. A new machine learning model based on the broad learning system and wavelets. Eng. Appl. Artif. Intell. 2022, 112, 104886. [Google Scholar] [CrossRef]
- Hajiabadi, H.; Babaiyan, V.; Zabihzadeh, D.; Hajiabadi, M. Combination of loss functions for robust breast cancer prediction. Comput. Electr. Eng. 2020, 84, 106624. [Google Scholar] [CrossRef]
- Eltrass, A.S.; Salama, M.S. Fully automated scheme for computer-aided detection and breast cancer diagnosis using digitised mammograms. IET Image Process. 2020, 14, 495–505. [Google Scholar] [CrossRef]
- Parekh, V.S.; Jacobs, M.A. Multiparametric radiomics methods for breast cancer tissue characterization using radiological imaging. Breast Cancer Res. Treat. 2020, 180, 407–421. [Google Scholar] [CrossRef] [Green Version]
- Wang, C.; Brentnall, A.R.; Cuzick, J.; Harkness, E.F.; Evans, D.G.; Astley, S. A novel and fully automated mammographic texture analysis for risk prediction: Results from two case-control studies. Breast Cancer Res. 2017, 19, 114. [Google Scholar] [CrossRef] [Green Version]
- Bajaj, V.; Pawar, M.; Meena, V.K.; Kumar, M.; Sengur, A.; Guo, Y. Computer-aided diagnosis of breast cancer using bi-dimensional empirical mode decomposition. Neural Comput. Appl. 2019, 31, 3307–3315. [Google Scholar] [CrossRef]
- Li, Z.; Yu, L.; Wang, X.; Yu, H.; Gao, Y.; Ren, Y.; Wang, G.; Zhou, X. Diagnostic Performance of Mammographic Texture Analysis in the Differential Diagnosis of Benign and Malignant Breast Tumors. Clin. Breast Cancer 2018, 18, e621–e627. [Google Scholar] [CrossRef]
- Huang, Q.; Huang, Y.; Luo, Y.; Yuan, F.; Li, X. Segmentation of breast ultrasound image with semantic classification of superpixels. Med. Image Anal. 2020, 61, 101657. [Google Scholar] [CrossRef]
- Bressan, R.S.; Bugatti, P.H.; Saito, P.T. Breast cancer diagnosis through active learning in content-based image retrieval. Neurocomputing 2019, 357, 1–10. [Google Scholar] [CrossRef]
- Suradi, S.H.; Abdullah, K.A.; Isa, N.A.M. Improvement of image enhancement for mammogram images using Fuzzy Anisotropic Diffusion Histogram Equalisation Contrast Adaptive Limited (FADHECAL). Comput. Methods Biomech. Biomed. Eng. Imaging Vis. 2022, 10, 67–75. [Google Scholar] [CrossRef]
- Al-Antari, M.A.; Al-Masni, M.; Park, S.-U.; Park, J.; Metwally, M.K.; Kadah, Y.M.; Han, S.-M.; Kim, T.-S. An Automatic Computer-Aided Diagnosis System for Breast Cancer in Digital Mammograms via Deep Belief Network. J. Med. Biol. Eng. 2018, 38, 443–456. [Google Scholar] [CrossRef]
- Zhang, Q.; Peng, Y.; Liu, W.; Bai, J.; Zheng, J.; Yang, X.; Zhou, L. Radiomics Based on Multimodal MRI for the Differential Diagnosis of Benign and Malignant Breast Lesions. J. Magn. Reson. Imaging 2020, 52, 596–607. [Google Scholar] [CrossRef]
- Dhouibi, M.; Ben Salem, A.K.; Saidi, A.; Ben Saoud, S. Accelerating Deep Neural Networks implementation: A survey. IET Comput. Digit. Tech. 2021, 15, 79–96. [Google Scholar] [CrossRef]
- Xu, Y.; Wang, Y.; Yuan, J.; Cheng, Q.; Wang, X.; Carson, P.L. Medical breast ultrasound image segmentation by machine learning. Ultrasonics 2019, 91, 1–9. [Google Scholar] [CrossRef] [PubMed]
- Arora, R.; Rai, P.K.; Raman, B. Deep feature–based automatic classification of mammograms. Med. Biol. Eng. Comput. 2020, 58, 1199–1211. [Google Scholar] [CrossRef] [PubMed]
- Gao, F.; Wu, T.; Li, J.; Zheng, B.; Ruan, L.; Shang, D.; Patel, B. SD-CNN: A shallow-deep CNN for improved breast cancer diagnosis. Comput. Med. Imaging Graph. 2018, 70, 53–62. [Google Scholar] [CrossRef] [Green Version]
- Romeo, V.; Clauser, P.; Rasul, S.; Kapetas, P.; Gibbs, P.; Baltzer, P.A.T.; Hacker, M.; Woitek, R.; Helbich, T.H.; Pinker, K. AI-enhanced simultaneous multiparametric 18F-FDG PET/MRI for accurate breast cancer diagnosis. Eur. J. Pediatr. 2022, 49, 596–608. [Google Scholar] [CrossRef]
- Tsochatzidis, L.; Koutla, P.; Costaridou, L.; Pratikakis, I. Integrating segmentation information into CNN for breast cancer diagnosis of mammographic masses. Compt. Meth. Prog. Biomed. 2021, 200, 105913. [Google Scholar] [CrossRef]
- Toğaçar, M.; Ergen, B.; Cömert, Z. Application of breast cancer diagnosis based on a combination of convolutional neural networks, ridge regression and linear discriminant analysis using invasive breast cancer images processed with autoencoders. Med. Hypotheses 2020, 135, 109503. [Google Scholar] [CrossRef]
- Singh, V.K.; Rashwan, H.A.; Romani, S.; Akram, F.; Pandey, N.; Sarker, M.K.; Saleh, A.; Arenas, M.; Arquez, M.; Puig, D.; et al. Breast tumor segmentation and shape classification in mammograms using generative adversarial and convolutional neural network. Expert Syst. Appl. 2020, 139, 112855. [Google Scholar] [CrossRef]
- Khan, S.; Islam, N.; Jan, Z.; Din, I.U.; Rodrigues, J.J.P.C. A novel deep learning based framework for the detection and classification of breast cancer using transfer learning. Pattern Recognit. Lett. 2019, 125, 1–6. [Google Scholar] [CrossRef]
- Li, J.-B.; Yu, Y.; Yang, Z.-M.; Tang, L.-L. Breast Tissue Image Classification Based on Semi-supervised Locality Discriminant Projection with Kernels. J. Med. Syst. 2012, 36, 2779–2786. [Google Scholar] [CrossRef] [PubMed]
- Algehyne, E.A.; Jibril, M.L.; Algehainy, N.A.; Alamri, O.A.; Alzahrani, A.K. Fuzzy Neural Network Expert System with an Improved Gini Index Random Forest-Based Feature Importance Measure Algorithm for Early Diagnosis of Breast Cancer in Saudi Arabia. Big Data Cogn. Comput. 2022, 6, 13. [Google Scholar] [CrossRef]
- Akhbardeh, A.; Jacobs, M.A. Comparative analysis of nonlinear dimensionality reduction techniques for breast MRI segmentation. Med. Phys. 2012, 39, 2275–2289. [Google Scholar] [CrossRef] [PubMed] [Green Version]
- Ragab, M.; Albukhari, A.; Alyami, J.; Mansour, R.F. Ensemble Deep-Learning-Enabled Clinical Decision Support System for Breast Cancer Diagnosis and Classification on Ultrasound Images. Biology 2022, 11, 439. [Google Scholar] [CrossRef]
- Jabeen, K.; Khan, M.A.; Alhaisoni, M.; Tariq, U.; Zhang, Y.-D.; Hamza, A.; Mickus, A.; Damaševičius, R. Breast Cancer Classification from Ultrasound Images Using Probability-Based Optimal Deep Learning Feature Fusion. Sensors 2022, 22, 807. [Google Scholar] [CrossRef]
- Bacha, S.; Taouali, O. A novel machine learning approach for breast cancer diagnosis. Measurement 2021, 187, 110233. [Google Scholar] [CrossRef]
- Mert, A.; Kılıç, N.; Akan, A. An improved hybrid feature reduction for increased breast cancer diagnostic performance. Biomed. Eng. Lett. 2015, 4, 285–291. [Google Scholar] [CrossRef]
- Zheng, B.; Yoon, S.W.; Lam, S.S. Breast cancer diagnosis based on feature extraction using a hybrid of K-means and support vector machine algorithms. Expert Syst. Appl. 2014, 41, 1476–1482. [Google Scholar] [CrossRef]
- Sun, W.; Tseng, T.-L.; Zhang, J.; Qian, W. Enhancing deep convolutional neural network scheme for breast cancer diagnosis with unlabeled data. Comput. Med. Imaging Graph. 2017, 57, 4–9. [Google Scholar] [CrossRef] [PubMed] [Green Version]
- Sharif, M.I.; Li, J.P.; Naz, J.; Rashid, I. A comprehensive review on multi-organs tumor detection based on machine learning. Pattern Recognit. Lett. 2020, 131, 30–37. [Google Scholar] [CrossRef]
- Shehab, M.; Abualigah, L.; Shambour, Q.; Abu-Hashem, M.A.; Shambour, M.K.Y.; Alsalibi, A.I.; Gandomi, A.H. Machine learning in medical applications: A review of state-of-the-art methods. Comput. Biol. Med. 2022, 145, 105458. [Google Scholar] [CrossRef] [PubMed]
- Hicks, S.A.; Strümke, I.; Thambawita, V.; Hammou, M.; Riegler, M.A.; Halvorsen, P.; Parasa, S. On evaluation metrics for medical applications of artificial intelligence. Sci. Rep. 2022, 12, 5979. [Google Scholar] [CrossRef]
- van Engelen, J.E.; Hoos, H.H. A survey on semi-supervised learning. Mach. Learn. 2019, 109, 373–440. [Google Scholar] [CrossRef] [Green Version]
- Dubey, A.K.; Gupta, U.; Jain, S. Analysis of k-means clustering approach on the breast cancer Wisconsin dataset. Int. J. Comput. Assist. Radiol. Surg. 2016, 11, 2033–2047. [Google Scholar] [CrossRef] [PubMed]
- Hernández-Capistrán, J.; Martínez-Carballido, J.F.; Rosas-Romero, R. False Positive Reduction by an Annular Model as a Set of Few Features for Microcalcification Detection to Assist Early Diagnosis of Breast Cancer. J. Med. Syst. 2018, 42, 134. [Google Scholar] [CrossRef]
- Onan, A. A fuzzy-rough nearest neighbor classifier combined with consistency-based subset evaluation and instance selection for automated diagnosis of breast cancer. Expert Syst. Appl. 2015, 42, 6844–6852. [Google Scholar] [CrossRef]
- Hosseinpour, M.; Ghaemi, S.; Khanmohammadi, S.; Daneshvar, S. A hybrid high-order type-2 FCM improved random forest classification method for breast cancer risk assessment. Appl. Math. Comput. 2022, 424. [Google Scholar] [CrossRef]
- Sadad, T.; Munir, A.; Saba, T.; Hussain, A. Fuzzy C-means and region growing based classification of tumor from mammograms using hybrid texture feature. J. Comput. Sci. 2018, 29, 34–45. [Google Scholar] [CrossRef]
- Saberi, H.; Rahai, A.; Hatami, F. A fast and efficient clustering based fuzzy time series algorithm (FEFTS) for regression and classification. Appl. Soft Comput. 2017, 61, 1088–1097. [Google Scholar] [CrossRef]
- Thani, I.; Kasbe, T. Expert system based on fuzzy rules for diagnosing breast cancer. Health Technol. 2022, 12, 473–489. [Google Scholar] [CrossRef]
- Nguyen, T.-L.; Kavuri, S.; Park, S.-Y.; Lee, M. Attentive Hierarchical ANFIS with interpretability for cancer diagnostic. Expert Syst. Appl. 2022, 201, 117099. [Google Scholar] [CrossRef]
- Zhang, Q.; Xiao, Y.; Suo, J.; Shi, J.; Yu, J.; Guo, Y.; Wang, Y.; Zheng, H. Sonoelastomics for Breast Tumor Classification: A Radiomics Approach with Clustering-Based Feature Selection on Sonoelastography. Ultrasound Med. Biol. 2017, 43, 1058–1069. [Google Scholar] [CrossRef] [PubMed] [Green Version]
- Indra, P.; Manikandan, M. Multilevel Tetrolet transform based breast cancer classifier and diagnosis system for healthcare applications. J. Ambient Intell. Humaniz. Comput. 2020, 12, 3969–3978. [Google Scholar] [CrossRef]
- Shan, J.; Alam, S.K.; Garra, B.; Zhang, Y.; Ahmed, T. Computer-Aided Diagnosis for Breast Ultrasound Using Computerized BI-RADS Features and Machine Learning Methods. Ultrasound Med. Biol. 2016, 42, 980–988. [Google Scholar] [CrossRef]
- Abdel-Nasser, M.; Melendez, J.; Moreno, A.; Omer, O.A.; Puig, D. Breast tumor classification in ultrasound images using texture analysis and super-resolution methods. Eng. Appl. Artif. Intell. 2017, 59, 84–92. [Google Scholar] [CrossRef]
- Muramatsu, C.; Hara, T.; Endo, T.; Fujita, H. Breast mass classification on mammograms using radial local ternary patterns. Comput. Biol. Med. 2016, 72, 43–53. [Google Scholar] [CrossRef]
- Alam, Z.; Rahman, M.S. A Random Forest based predictor for medical data classification using feature ranking. Inform. Med. Unlocked 2019, 15, 100180. [Google Scholar] [CrossRef]
- Wu, J.-X.; Chen, P.-Y.; Lin, C.-H.; Chen, S.; Shung, K.K. Breast Benign and Malignant Tumors Rapidly Screening by ARFI-VTI Elastography and Random Decision Forests Based Classifier. IEEE Access 2020, 8, 54019–54034. [Google Scholar] [CrossRef]
- Lu, W.; Li, Z.; Chu, J. A novel computer-aided diagnosis system for breast MRI based on feature selection and ensemble learning. Comput. Biol. Med. 2017, 83, 157–165. [Google Scholar] [CrossRef] [PubMed]
- Huang, Q.; Chen, Y.; Liu, L.; Tao, D.; Li, X. On Combining Biclustering Mining and AdaBoost for Breast Tumor Classification. IEEE Trans. Knowl. Data Eng. 2019, 32, 728–738. [Google Scholar] [CrossRef]
- Vamvakas, A.; Tsivaka, D.; Logothetis, A.; Vassiou, K.; Tsougos, I. Breast Cancer Classification on Multiparametric MRI—Increased Performance of Boosting Ensemble Methods. Technol. Cancer Res. Treat. 2022, 21. [Google Scholar] [CrossRef]
- Sharma, S.; Khanna, P. Computer-Aided Diagnosis of Malignant Mammograms using Zernike Moments and SVM. J. Digit. Imaging 2015, 28, 77–90. [Google Scholar] [CrossRef]
- Agossou, C.; Atchadé, M.N.; Djibril, A.M.; Kurisheva, S.V. Support Vector Machine, Naive Bayes Classification, and Mathematical Modeling for Public Health Decision-Making: A Case Study of Breast Cancer in Benin. SN Comput. Sci. 2022, 3, 1–19. [Google Scholar] [CrossRef]
- Alshutbi, M.; Li, Z.; Alrifaey, M.; Ahmadipour, M.; Murtadha Othman, M. A hybrid classifier based on support vector machine and Jaya algorithm for breast cancer classification. Neural Compt. App. 2022, 1–13. [Google Scholar] [CrossRef]
- Samma, H.; Lahasan, B. Optimized Two-Stage Ensemble Model for Mammography Mass Recognition. IRBM 2020, 41, 195–204. [Google Scholar] [CrossRef]
- Wu, W.; Li, B.; Mercan, E.; Mehta, S.; Bartlett, J.; Weaver, D.L.; Elmore, J.G.; Shapiro, L.G. MLCD: A Unified Software Package for Cancer Diagnosis. JCO Clin. Cancer Inform. 2020, 4, 290–298. [Google Scholar] [CrossRef]
- Badr, E.; Almotairi, S.; Salam, M.A.; Ahmed, H. New Sequential and Parallel Support Vector Machine with Grey Wolf Optimizer for Breast Cancer Diagnosis. Alex. Eng. J. 2022, 61, 2520–2534. [Google Scholar] [CrossRef]
- Mendelson, E.B. Artificial Intelligence in Breast Imaging: Potentials and Limitations. Am. J. Roentgenol. 2019, 212, 293–299. [Google Scholar] [CrossRef]
- Amato, F.; López, A.; Mendez, E.P.; Vanhara, P.; Hampl, A.; Havel, J. Artificial neural networks in medical diagnosis. J. Appl. Biomed. 2013, 11, 47–58. [Google Scholar] [CrossRef]
- Beura, S.; Majhi, B.; Dash, R. Mammogram classification using two dimensional discrete wavelet transform and gray-level co-occurrence matrix for detection of breast cancer. Neurocomputing 2015, 154, 1–14. [Google Scholar] [CrossRef]
- Mohammed, M.A.; Al-Khateeb, B.; Rashid, A.N.; Ibrahim, D.A.; Ghani, M.K.A.; Mostafa, S.A. Neural network and multi-fractal dimension features for breast cancer classification from ultrasound images. Comput. Electr. Eng. 2018, 70, 871–882. [Google Scholar] [CrossRef]
- Gallego-Ortiz, C.; Martel, A.L. A graph-based lesion characterization and deep embedding approach for improved computer-aided diagnosis of nonmass breast MRI lesions. Med. Image Anal. 2019, 51, 116–124. [Google Scholar] [CrossRef] [PubMed]
- Danala, G.; Patel, B.; Aghaei, F.; Heidari, M.; Li, J.; Wu, T.; Zheng, B. Classification of Breast Masses Using a Computer-Aided Diagnosis Scheme of Contrast Enhanced Digital Mammograms. Ann. Biomed. Eng. 2018, 46, 1419–1431. [Google Scholar] [CrossRef] [PubMed]
- Punitha, S.; Amuthan, A.; Joseph, K.S. Enhanced Monarchy Butterfly Optimization Technique for effective breast cancer diagnosis. J. Med. Syst. 2019, 43, 206. [Google Scholar] [CrossRef]
- Alshayeji, M.H.; Ellethy, H.; Abed, S.; Gupta, R. Computer-aided detection of breast cancer on the Wisconsin dataset: An artificial neural networks approach. Biomed. Signal Process. Control 2022, 71, 103141. [Google Scholar] [CrossRef]
- Rezaeipanah, A.; Ahmadi, G. Breast Cancer Diagnosis Using Multi-Stage Weight Adjustment In The MLP Neural Network. Comput. J. 2022, 65, 788–804. [Google Scholar] [CrossRef]
- Ting, F.F.; Tan, Y.J.; Sim, K.S. Convolutional neural network improvement for breast cancer classification. Expert Syst. Appl. 2019, 120, 103–115. [Google Scholar] [CrossRef]
- Yousefi, M.; Krzyżak, A.; Suen, C.Y. Mass detection in digital breast tomosynthesis data using convolutional neural networks and multiple instance learning. Comput. Biol. Med. 2018, 96, 283–293. [Google Scholar] [CrossRef]
- Wu, N.; Phang, J.; Park, J.; Shen, Y.; Huang, Z.; Zorin, M.; Jastrzebski, S.; Fevry, T.; Katsnelson, J.; Kim, E.; et al. Deep Neural Networks Improve Radiologists’ Performance in Breast Cancer Screening. IEEE Trans. Med. Imaging 2019, 39, 1184–1194. [Google Scholar] [CrossRef] [PubMed] [Green Version]
- AlBalawi, U.; Manimurugan, S.; Varatharajan, R. Classification of breast cancer mammogram images using convolution neural network. Concurr. Comput. Pract. Exp. 2022, 34, e3803. [Google Scholar] [CrossRef]
- Inan, M.S.K.; Alam, F.I.; Hasan, R. Deep integrated pipeline of segmentation guided classification of breast cancer from ultrasound images. Biomed. Signal Process. Control 2022, 75, 103553. [Google Scholar] [CrossRef]
- Feizi, A. A gated convolutional neural network for classification of breast lesions in ultrasound images. Soft Comput. 2022, 26, 5241–5250. [Google Scholar] [CrossRef]
- Ribli, D.; Horváth, A.; Unger, Z.; Pollner, P.; Csabai, I. Detecting and classifying lesions in mammograms with Deep Learning. Sci. Rep. 2018, 8, 4165–4167. [Google Scholar] [CrossRef] [Green Version]
- Liu, K.; Kang, G.; Zhang, N.; Hou, B. Breast Cancer Classification Based on Fully-Connected Layer First Convolutional Neural Networks. IEEE Access 2018, 6, 23722–23732. [Google Scholar] [CrossRef]
- Zhang, Y.-D.; Pan, C.; Chen, X.; Wang, F. Abnormal breast identification by nine-layer convolutional neural network with parametric rectified linear unit and rank-based stochastic pooling. J. Comput. Sci. 2018, 27, 57–68. [Google Scholar] [CrossRef]
- Oyetade, I.S.; Ayeni, J.O.; Ogunde, A.O.; Oguntunde, B.O.; Olowookere, T.A. Hybridized Deep Convolutional Neural Network and Fuzzy Support Vector Machines for Breast Cancer Detection. SN Comput. Sci. 2022, 3, 58. [Google Scholar] [CrossRef]
- Takahashi, K.; Fujioka, T.; Oyama, J.; Mori, M.; Yamaga, E.; Yashima, Y.; Imokawa, T.; Hayashi, A.; Kujiraoka, Y.; Tsuchiya, J.; et al. Deep Learning Using Multiple Degrees of Maximum-Intensity Projection for PET/CT Image Classification in Breast Cancer. Tomography 2022, 8, 131–141. [Google Scholar] [CrossRef]
- Muduli, D.; Dash, R.; Majhi, B. Automated diagnosis of breast cancer using multi-modal datasets: A deep convolution neural network based approach. Biomed. Signal Process. Control 2021, 71, 102825. [Google Scholar] [CrossRef]
- Ayana, G.; Park, J.; Jeong, J.-W.; Choe, S.-W. A Novel Multistage Transfer Learning for Ultrasound Breast Cancer Image Classification. Diagnostics 2022, 12, 135. [Google Scholar] [CrossRef] [PubMed]
- Dey, S.; Roychoudhury, R.; Malakar, S.; Sarkar, R. Screening of breast cancer from thermogram images by edge detection aided deep transfer learning model. Multimed. Tools Appl. 2022, 81, 9331–9349. [Google Scholar] [CrossRef] [PubMed]
- Ring, E. The historical development of temperature measurement in medicine. Infrared Phys. Technol. 2007, 49, 297–301. [Google Scholar] [CrossRef]
- Ng, E.Y.K.; Kee, E.C. Advanced integrated technique in breast cancer thermography. J. Med. Eng. Technol. 2008, 32, 103–114. [Google Scholar] [CrossRef] [PubMed]
- Lahiri, B.; Bagavathiappan, S.; Jayakumar, T.; Philip, J. Medical applications of infrared thermography: A review. Infrared Phys. Technol. 2012, 55, 221–235. [Google Scholar] [CrossRef]
- Singh, D.; Singh, A.K. Role of image thermography in early breast cancer detection- Past, present and future. Comput. Methods Programs Biomed. 2020, 183, 105074. [Google Scholar] [CrossRef]
- Baic, A.; Plaza, D.; Lange, B.; Michalecki Stanek, A.; Kowalczyk, A.; Ślosarek, K.; Cholewka, A. Long-Term Skin Temperature Changes after Breast Cancer Radiotherapy. Int. J. Environ. Res. Public Health 2022, 19, 6891. [Google Scholar] [CrossRef]
- Fernández-Cuevas, I.; Marins, J.C.B.; Lastras, J.A.; Carmona, P.M.G.; Cano, S.P.; García-Concepción, M.Á.; Sillero-Quintana, M. Classification of factors influencing the use of infrared thermography in humans: A review. Infrared Phys. Technol. 2015, 71, 28–55. [Google Scholar] [CrossRef]
- Ioannou, S.; Gallese, V.; Merla, A. Thermal infrared imaging in psychophysiology: Potentialities and limits. Psychophysiology 2014, 51, 951–963. [Google Scholar] [CrossRef] [Green Version]
- Bernard, V.; Staffa, E.; Mornstein, V.; Bourek, A. Infrared camera assessment of skin surface temperature—Effect of emissivity. Phys. Med. 2013, 29, 583–591. [Google Scholar] [CrossRef] [Green Version]
- Ekici, S.; Jawzal, H. Breast cancer diagnosis using thermography and convolutional neural networks. Med. Hypotheses 2019, 137, 109542. [Google Scholar] [CrossRef]
- AlFayez, F.; El-Soud, M.W.A.; Gaber, T. Thermogram Breast Cancer Detection: A Comparative Study of Two Machine Learning Techniques. Appl. Sci. 2019, 10, 551. [Google Scholar] [CrossRef] [Green Version]
- Gogoi, U.R.; Majumdar, G.; Bhowmik, M.K.; Ghosh, A.K. Evaluating the efficiency of infrared breast thermography for early breast cancer risk prediction in asymptomatic population. Infrared Phys. Technol. 2019, 99, 201–211. [Google Scholar] [CrossRef]
- Saxena, A.; Ng, E.; Raman, V.; Hamli, M.S.B.M.; Moderhak, M.; Kolacz, S.; Jankau, J. Infrared (IR) thermography-based quantitative parameters to predict the risk of post-operative cancerous breast resection flap necrosis. Infrared Phys. Technol. 2019, 103, 103063. [Google Scholar] [CrossRef]
- Tello-Mijares, S.; Woo, F.; Flores, F. Breast Cancer Identification via Thermography Image Segmentation with a Gradient Vector Flow and a Convolutional Neural Network. J. Health Eng. 2019, 2019, 1–13. [Google Scholar] [CrossRef] [Green Version]
- Garduño-Ramón, M.A.; Vega-Mancilla, S.G.; Morales-Henández, L.A.; Osornio-Rios, R.A. Supportive Noninvasive Tool for the Diagnosis of Breast Cancer Using a Thermographic Camera as Sensor. Sensors 2017, 17, 497. [Google Scholar] [CrossRef] [Green Version]
- Raghavendra, U.; Acharya, U.R.; Ng, E.Y.K.; Tan, J.-H.; Gudigar, A. An integrated index for breast cancer identification using histogram of oriented gradient and kernel locality preserving projection features extracted from thermograms. Quant. Infrared Thermogr. J. 2016, 13, 195–209. [Google Scholar] [CrossRef]
- Lashkari, A.; Pak, F.; Firouzmand, M. Full Intelligent Cancer Classification of Thermal Breast Images to Assist Physician in Clinical Diagnostic Applications. J. Med. Signals Sens. 2016, 6, 12–24. [Google Scholar] [CrossRef]
- Francis, S.V.; Sasikala, M.; Saranya, S. Detection of Breast Abnormality from Thermograms Using Curvelet Transform Based Feature Extraction. J. Med. Syst. 2014, 38, 1–9. [Google Scholar] [CrossRef]
- Milosevic, M.; Jankovic, D.; Peulic, A. Thermography based breast cancer detection using texture features and minimum variance quantization. EXCLI J. 2014, 13, 1204. [Google Scholar] [CrossRef]
- Araújo, M.C.; Lima, R.C.; de Souza, R.M. Interval symbolic feature extraction for thermography breast cancer detection. Expert Syst. Appl. 2014, 41, 6728–6737. [Google Scholar] [CrossRef]
- Gonzalez-Hernandez, J.-L.; Recinella, A.N.; Kandlikar, S.G.; Dabydeen, D.; Medeiros, L.; Phatak, P. Technology, application and potential of dynamic breast thermography for the detection of breast cancer. Int. J. Heat Mass Transf. 2018, 131, 558–573. [Google Scholar] [CrossRef]
- Silva, L.F.; Santos, A.A.S.; Bravo, R.S.; Silva, A.C.; Muchaluat-Saade, D.C.; Conci, A. Hybrid analysis for indicating patients with breast cancer using temperature time series. Comput. Methods Programs Biomed. 2016, 130, 142–153. [Google Scholar] [CrossRef]
- Saniei, E.; Setayeshi, S.; Akbari, M.E.; Navid, M. A vascular network matching in dynamic thermography for breast cancer detection. Quant. Infrared Thermogr. J. 2015, 12, 1–13. [Google Scholar] [CrossRef]
- Kumar, A.; Bi, L.; Kim, J.; Feng, D.D. Machine learning in medical imaging. In Biomedical Information Technology; Feng, D.D., Ed.; Academic Press: Cambridge, MA, USA, 2020; pp. 167–196. [Google Scholar] [CrossRef]
- Nayak, D.R.; Dash, R.; Majhi, B.; Pachori, R.B.; Zhang, Y. A deep stacked random vector functional link network autoencoder for diagnosis of brain abnormalities and breast cancer. Biomed. Signal Process. Control 2020, 58, 101860. [Google Scholar] [CrossRef]
- Kadam, V.J.; Jadhav, S.M.; Vijayakumar, K. Breast Cancer Diagnosis Using Feature Ensemble Learning Based on Stacked Sparse Autoencoders and Softmax Regression. J. Med. Syst. 2019, 43, 263. [Google Scholar] [CrossRef]
- Zhang, E.; Seiler, S.; Chen, M.; Lu, W.; Gu, X. BIRADS features-oriented semi-supervised deep learning for breast ultrasound computer-aided diagnosis. Phys. Med. Biol. 2020, 65, 125005. [Google Scholar] [CrossRef] [Green Version]
- Zhang, H.; Guo, W.; Zhang, S.; Lu, H.; Zhao, X. Unsupervised Deep Anomaly Detection for Medical Images Using an Improved Adversarial Autoencoder. J. Digit. Imaging 2022, 35, 153–161. [Google Scholar] [CrossRef]
- Movahedi, F.; Coyle, J.L.; Sejdic, E. Deep Belief Networks for Electroencephalography: A Review of Recent Contributions and Future Outlooks. IEEE J. Biomed. Health Inform. 2017, 22, 642–652. [Google Scholar] [CrossRef]
- Le Roux, N.; Bengio, Y. Representational Power of Restricted Boltzmann Machines and Deep Belief Networks. Neural Comput. 2007, 20, 1631–1649. [Google Scholar] [CrossRef]
- Ahmad, M.; Ai, D.; Xie, G.; Qadri, S.F.; Song, H.; Huang, Y.; Wang, Y.; Yang, J. Deep Belief Network Modeling for Automatic Liver Segmentation. IEEE Access 2019, 7, 20585–20595. [Google Scholar] [CrossRef]
- Kaur, M.; Singh, D. Fusion of medical images using deep belief networks. Clust. Comput. 2019, 23, 1439–1453. [Google Scholar] [CrossRef]
- Zhao, Z.; Zhao, J.; Song, K.; Hussain, A.; Du, Q.; Dong, Y.; Liu, J.; Yang, X. Joint DBN and Fuzzy C-Means unsupervised deep clustering for lung cancer patient stratification. Eng. Appl. Artif. Intell. 2020, 91, 103571. [Google Scholar] [CrossRef]
- Rasmus, A.; Berglund, M.; Honkala, M.; Valpola, H.; Raiko, T. Semi-supervised learning with ladder networks. In Proceedings of the 28th International Conference on Neural Information Processing Systems—Volume 2 (NIPS’15); MIT Press: Cambridge, MA, USA, 2015; pp. 3546–3554. [Google Scholar]
- Zahoor, S.; Shoaib, U.; Lali, I.U. Breast Cancer Mammograms Classification Using Deep Neural Network and Entropy-Controlled Whale Optimization Algorithm. Diagnostics 2022, 12, 557. [Google Scholar] [CrossRef]
- Jagtap, A.D.; Kawaguchi, K.; Karniadakis, G.E. Adaptive activation functions accelerate convergence in deep and physics-informed neural networks. J. Comput. Phys. 2020, 404, 109136. [Google Scholar] [CrossRef] [Green Version]
- Jagtap, A.D.; Shin, Y.; Kawaguchi, K.; Karniadakis, G.E. Deep Kronecker neural networks: A general framework for neural networks with adaptive activation functions. Neurocomputing 2022, 468, 165–180. [Google Scholar] [CrossRef]
- Zhang, J.; Wang, G.; Ren, J.; Yang, Z.; Li, D.; Cui, Y.; Yang, X. Multiparametric MRI-based radiomics nomogram for preoperative prediction of lymphovascular invasion and clinical outcomes in patients with breast invasive ductal carcinoma. Eur. Radiol. 2022, 32, 4079–4089. [Google Scholar] [CrossRef] [PubMed]
- Schaffter, T.; Buist, D.S.M.; Lee, C.I.; Nikulin, Y.; Ribli, D.; Guan, Y.; Lotter, W.; Jie, Z.; Du, H.; Wang, S.; et al. Evaluation of Combined Artificial Intelligence and Radiologist Assessment to Interpret Screening Mammograms. JAMA Netw. Open 2020, 3, e200265. [Google Scholar] [CrossRef] [Green Version]
- Grimm, L.J.; Mazurowski, M.A. Breast Cancer Radiogenomics: Current Status and Future Directions. Acad. Radiol. 2020, 27, 39–46. [Google Scholar] [CrossRef] [Green Version]


| Imagining Technique | Advantages | Disadvantages | Recommended Population | Some Types of Cancer Detected | Sensitivity and/or Specificity |
|---|---|---|---|---|---|
| Mammography | 1. Equipment is widely available worldwide. 2. Methods, such as tomosynthesis, can improve the specificity and sensibility of the technique with patients that have dense breasts [10] | 1. The rate of both false positive and false negatives increases since there is no possibility to determine if the masses are benign 2. The procedure used to obtain the images could be bothersome. 3. Dense breasts or young patients are not indicated to use this imaging technique. | Women whose age is greater than 40 years, have low-dense breast and an average risk of contracting the disease. | 1. Ductal Carcinoma in Situ 2. Invasive Breast Cancer. | Sensitivity up to 85%. |
| Ultrasound | 1. Can be used in young patients or have dense breast. 2. The equipment used is available in most of the hospitals | 1. Calcifications could not be detected. 2. Sensitivity depends on the operator ability to interpret the images 3. False-positivity rate is an issue. | Women with heterogeneously or extremely dense breast tissue [38,39]. Women that are pregnant or lactating [40]. | 1. Ductal Carcinoma in Situ. 2. Invasive ductal carcinoma | Sensitivity ranging between 40–75% in younger high-risk women [40]. |
| Magnetic Resonance Imaging | 1. Effective for detecting suspicious masses in high-risk population [10]. 2. The breast tissue density is no longer an issue [38,39,40]. 3. Multifocal lesions can be detected [10,41] | 1. Equipment is only available in specialized hospitals. 2. Expensive 3. False positive findings are an important concern [41] | 1. Women that may carry mutation in ATM, BRCA1, BRCA2, CHEK2, PALB2, PTEN, TP53 genes. 2. Women that had radiation therapy in the chest zone during the childhood. | 1. Ductal in situ carcinomas 2. Invasive ductal carcinomas. 3. Invasive lobular carcinomas 4. Invasive mammary carcinomas with mixed ductal and lobular features [24] | Sensitivity ranging from 83 to 100% [42,43,44]. |
| Type of Classifier | Classifier | Advantages | Disadvantages | Number of Images | Performance Metrics |
|---|---|---|---|---|---|
| Unsupervised | K-means |
|
| ||
| Hierarchical Clustering |
|
|
|
| |
| Supervised | Decision Trees |
|
|
| |
| Random Forest |
|
|
|
| |
| AdaBoost |
|
|
| ||
| Support Vector Machines |
|
|
| ||
| Artificial Neural Networks |
|
|
| ||
| Convolutional Neural Networks |
|
|
|
| Authors | Number of Patients | IR System | Image Processing and Classification Algorithms | Accuracy (%) | Room Temperature (°C) | Acclimation Time (min) | |
|---|---|---|---|---|---|---|---|
| Features | Classification | ||||||
| Ekici and Jawzal [165] | 140 | FLIR SC-620 | Bio-data, image analysis, and image statistics | CNNs optimized by Bayes algorithm | 98.95 | 17–24 | 15 |
| AlFayez et al. [166] | Public dataset DMR-IR | Geometrical and textural features | Extreme Learning Machine (ELM) and Multilayer Perceptron (MLP) | ELM—100 MLP—82.2 | Public dataset DMR-IR | ||
| Rani et al. [167] | 60 | FLIR T650SC | Temperature and intensity | SVM with Radial basis function kernel | 83.22 | 20–24 | 15 |
| Saxena et al. [168] | 32 | FLIR A320 | ROI thermal | Cut-off value | 88 | 22 ± 0.5 | Not specified |
| Tello-Mijares [169] | 63 | FLIR SC-620 | Shape, colour, texture, and left and right breast relation | CNN | 100 | 20–22 | 15 |
| Garduño-Ramón et al. [170] | 454 | FLIR A300 | Temperature | Difference of temperature | 79.60 | 18–22 | 15 |
| Raghavendra et al. [171] | 50 | Thermo TVS200 | Student’s t-test based feature selection algorithm | Decision Tree | 98 | 20–22 | 15 |
| Lashkari et al. [172] | 67 | Thermoteknix VisIR 640 | 23 features, including statistical, morphological, frequency domain, histogram and Gray Level Co-occurrence Matrix | Adaboost, SVM, kNN, Naive, PNN | 85.33 and 87.42 | 18–23 | ice test: 20 min |
| Francis et al. [173] | 22 | med2000™ IRIS | Statistical and texture features are extracted from thermograms in the curvelet domain | SVM | 90.91 | 25 | 15 |
| Milosevic et al. [174] | 40 images | VARIOSCAN 3021 ST | Texture measures derived from the Gray Level Co-occurrence Matrix | K-Nearest Neighbor | 92.5 | 20–23 | Few minutes |
| Araujo et al. [175] | 50 | FLIR S45 | Thermal interval for each breast | Linear discriminant classifier, minimum distance classifier, and Parzen window | - | 24–28 | At least 10 min |
Publisher’s Note: MDPI stays neutral with regard to jurisdictional claims in published maps and institutional affiliations. |
© 2022 by the authors. Licensee MDPI, Basel, Switzerland. This article is an open access article distributed under the terms and conditions of the Creative Commons Attribution (CC BY) license (https://creativecommons.org/licenses/by/4.0/).
Share and Cite
Basurto-Hurtado, J.A.; Cruz-Albarran, I.A.; Toledano-Ayala, M.; Ibarra-Manzano, M.A.; Morales-Hernandez, L.A.; Perez-Ramirez, C.A. Diagnostic Strategies for Breast Cancer Detection: From Image Generation to Classification Strategies Using Artificial Intelligence Algorithms. Cancers 2022, 14, 3442. https://doi.org/10.3390/cancers14143442
Basurto-Hurtado JA, Cruz-Albarran IA, Toledano-Ayala M, Ibarra-Manzano MA, Morales-Hernandez LA, Perez-Ramirez CA. Diagnostic Strategies for Breast Cancer Detection: From Image Generation to Classification Strategies Using Artificial Intelligence Algorithms. Cancers. 2022; 14(14):3442. https://doi.org/10.3390/cancers14143442
Chicago/Turabian StyleBasurto-Hurtado, Jesus A., Irving A. Cruz-Albarran, Manuel Toledano-Ayala, Mario Alberto Ibarra-Manzano, Luis A. Morales-Hernandez, and Carlos A. Perez-Ramirez. 2022. "Diagnostic Strategies for Breast Cancer Detection: From Image Generation to Classification Strategies Using Artificial Intelligence Algorithms" Cancers 14, no. 14: 3442. https://doi.org/10.3390/cancers14143442