
LncRNA-Associated Genetic Etiologies Are Shared between Type 2 Diabetes and Cancers in the UAE Population

Abstract
:Simple Summary
Abstract

1. Introduction
2. Methods
2.1. Information Sources and Search Strategy
2.2. Eligibility Criteria
2.3. Data Collection and SNP Annotation
3. Results
3.1. Customized Annotation Pipeline SNPs Selection
3.2. Characteristics of SNPs Associated with T2D and Cancer
3.2.1. rs1495741
3.2.2. rs1061810
3.2.3. rs2521501
3.2.4. rs8042680
3.2.5. rs7526425
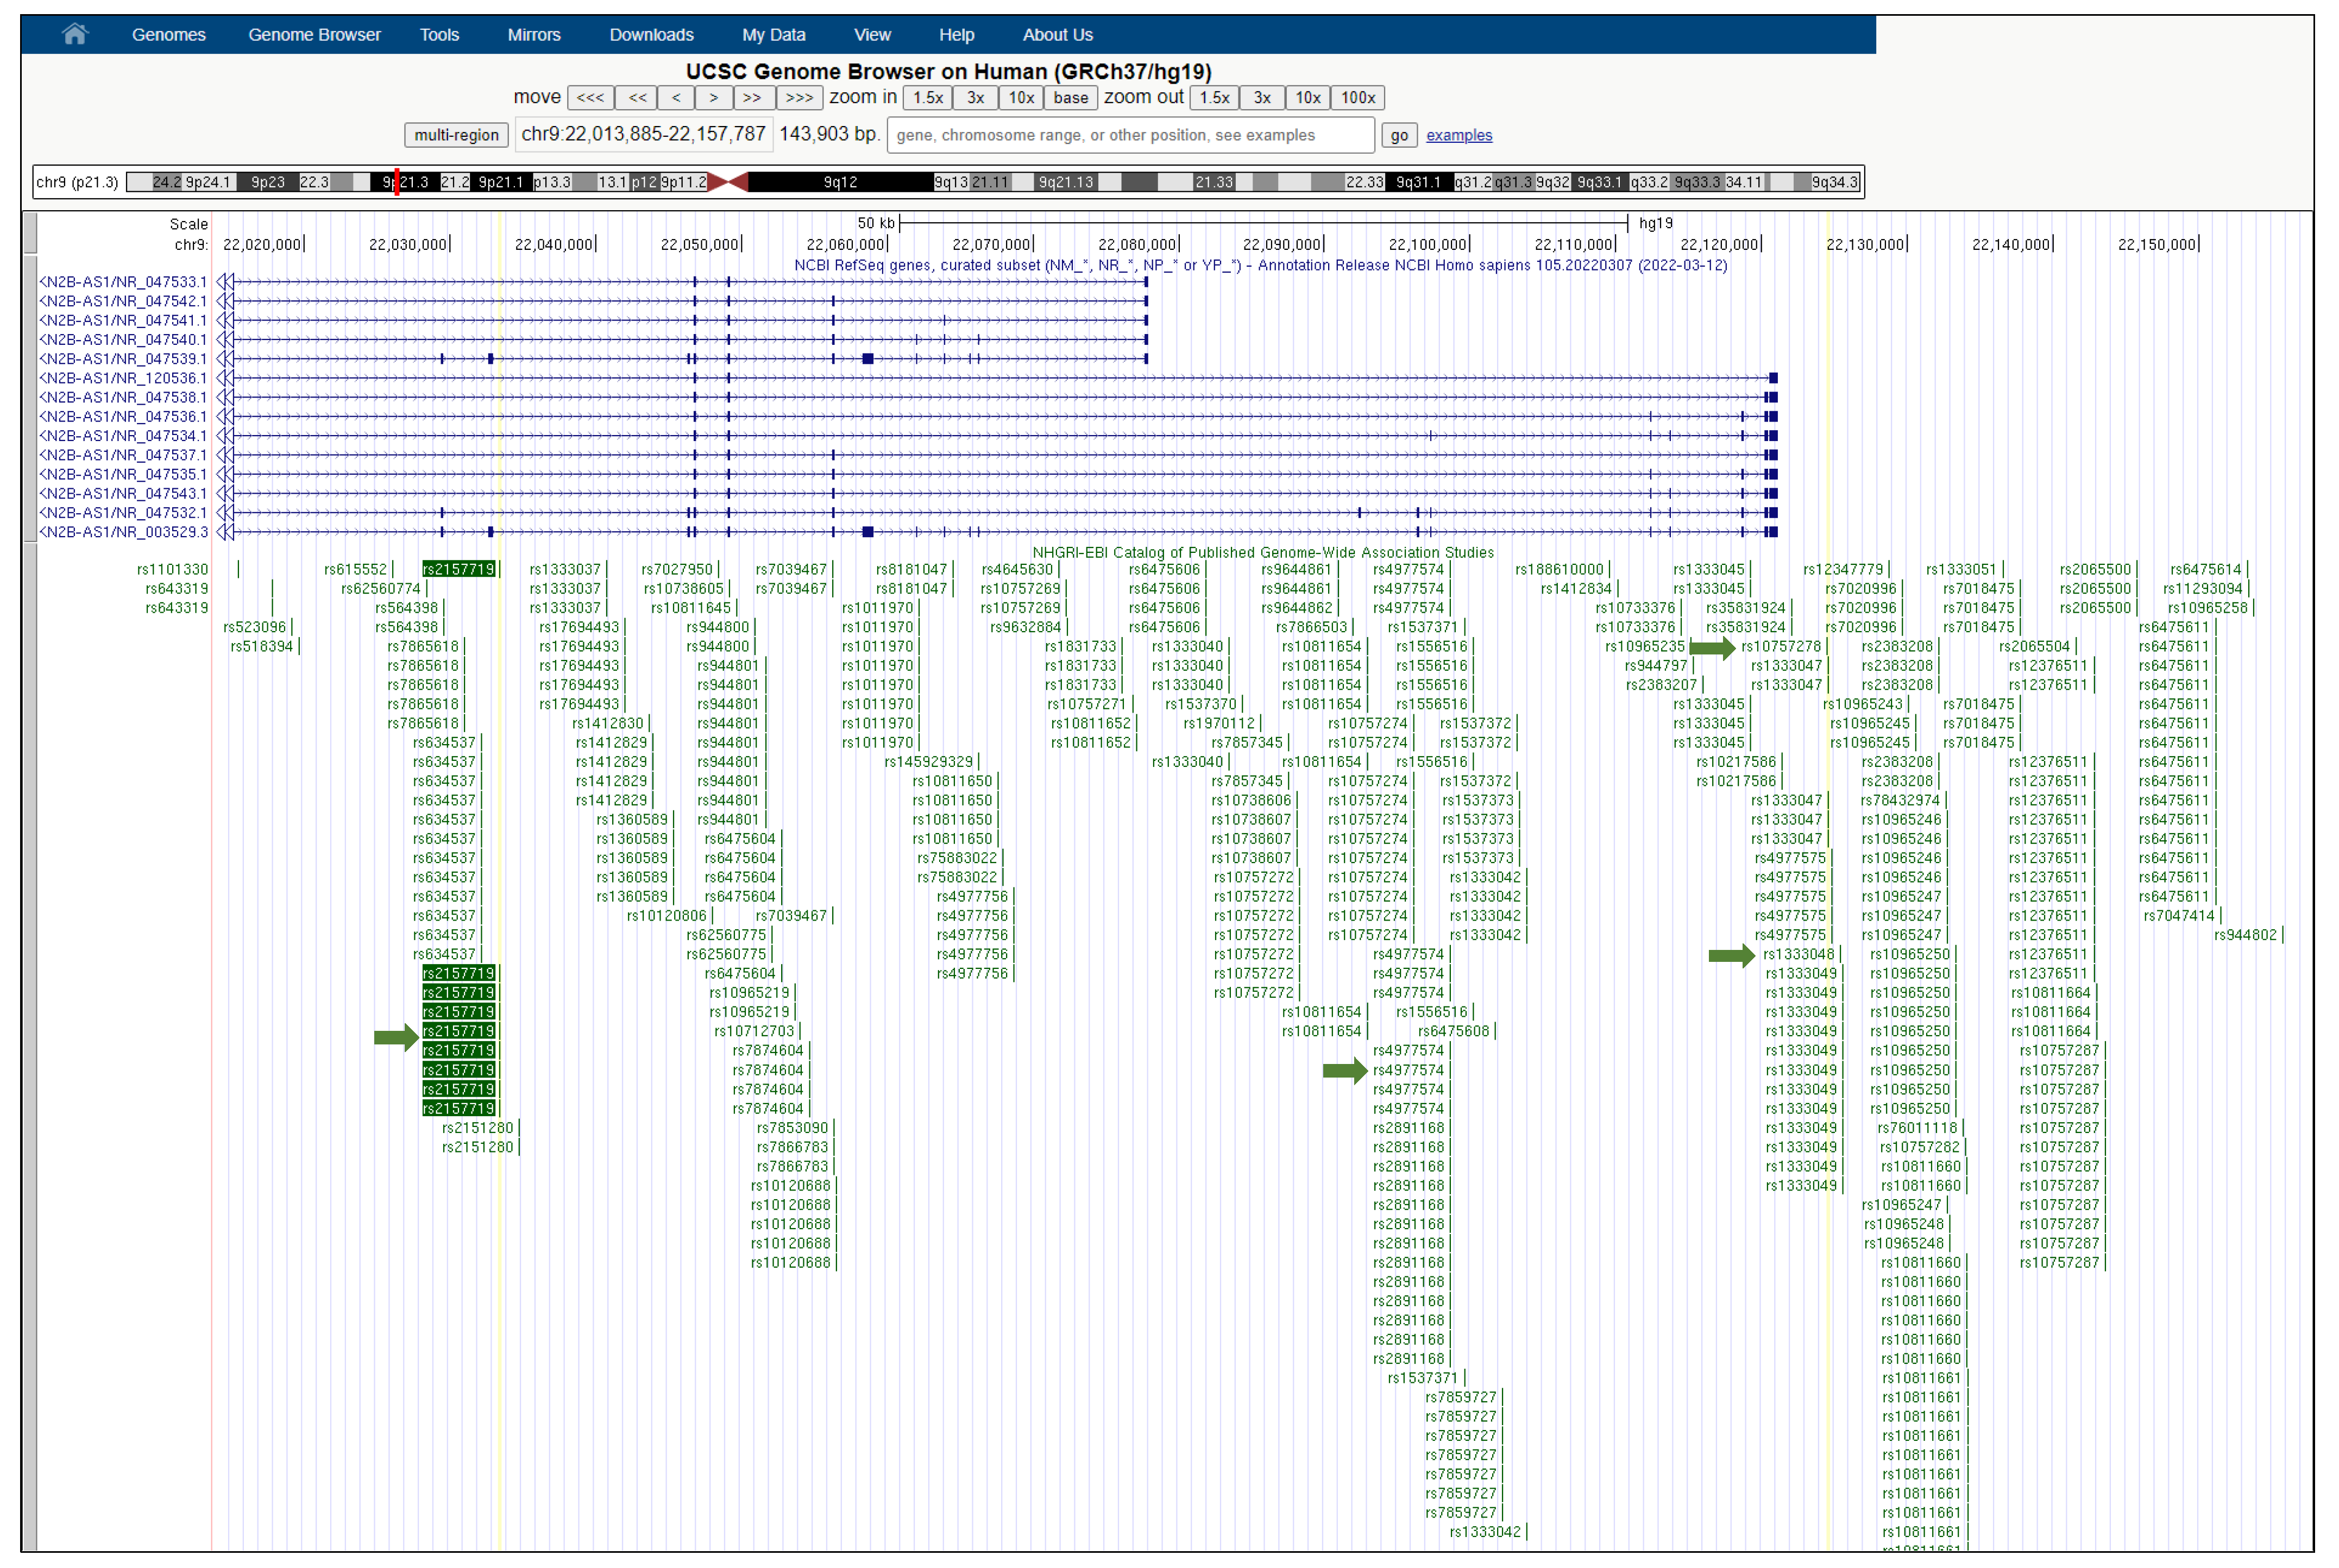
3.2.6. rs2157719
4. Discussion
5. Conclusions
Supplementary Materials
Author Contributions
Funding
Institutional Review Board Statement
Informed Consent Statement
Data Availability Statement
Conflicts of Interest
References
- Gregory, T.R. Synergy between sequence and size in large-scale genomics. Nat. Rev. Genet. 2005, 6, 699–708. [Google Scholar] [CrossRef] [PubMed]
- Consortium, E.P. An integrated encyclopedia of DNA elements in the human genome. Nature 2012, 489, 57. [Google Scholar] [CrossRef] [PubMed]
- Derrien, T.; Guigó, R.; Johnson, R. The long non-coding RNAs: A new (p) layer in the “dark matter”. Front. Genet. 2012, 2, 107. [Google Scholar] [CrossRef] [PubMed] [Green Version]
- Abugessaisa, I.; Ramilowski, J.A.; Lizio, M.; Severin, J.; Hasegawa, A.; Harshbarger, J.; Kondo, A.; Noguchi, S.; Yip, C.W.; Ooi, J.L.C. FANTOM enters 20th year: Expansion of transcriptomic atlases and functional annotation of non-coding RNAs. Nucleic Acids Res. 2021, 49, D892–D898. [Google Scholar] [CrossRef]
- Jain, S.; Thakkar, N.; Chhatai, J.; Pal Bhadra, M.; Bhadra, U. Long non-coding RNA: Functional agent for disease traits. RNA Biol. 2017, 14, 522–535. [Google Scholar] [CrossRef]
- Schmitz, S.U.; Grote, P.; Herrmann, B.G. Mechanisms of long noncoding RNA function in development and disease. Cell. Mol. Life Sci. 2016, 73, 2491–2509. [Google Scholar] [CrossRef] [Green Version]
- Esteller, M. Non-coding RNAs in human disease. Nat. Rev. Genet. 2011, 12, 861–874. [Google Scholar] [CrossRef]
- DiStefano, J.K. The emerging role of long noncoding RNAs in human disease. Dis. Gene Identif. 2018, 1706, 91–110. [Google Scholar]
- Manolio, T.A.; Collins, F.S.; Cox, N.J.; Goldstein, D.B.; Hindorff, L.A.; Hunter, D.J.; McCarthy, M.I.; Ramos, E.M.; Cardon, L.R.; Chakravarti, A. Finding the missing heritability of complex diseases. Nature 2009, 461, 747–753. [Google Scholar] [CrossRef] [Green Version]
- Sparber, P.; Filatova, A.; Khantemirova, M.; Skoblov, M. The role of long non-coding RNAs in the pathogenesis of hereditary diseases. BMC Med. Genom. 2019, 12, 63–78. [Google Scholar] [CrossRef] [Green Version]
- Consortium, G.P. A global reference for human genetic variation. Nature 2015, 526, 68. [Google Scholar] [CrossRef] [PubMed] [Green Version]
- Maurano, M.T.; Humbert, R.; Rynes, E.; Thurman, R.E.; Haugen, E.; Wang, H.; Reynolds, A.P.; Sandstrom, R.; Qu, H.; Brody, J. Systematic localization of common disease-associated variation in regulatory DNA. Science 2012, 337, 1190–1195. [Google Scholar] [CrossRef] [PubMed] [Green Version]
- Giral, H.; Landmesser, U.; Kratzer, A. Into the wild: GWAS exploration of non-coding RNAs. Front. Cardiovasc. Med. 2018, 5, 181. [Google Scholar] [CrossRef] [PubMed]
- Edwards, S.L.; Beesley, J.; French, J.D.; Dunning, A.M. Beyond GWASs: Illuminating the dark road from association to function. Am. J. Hum. Genet. 2013, 93, 779–797. [Google Scholar] [CrossRef] [Green Version]
- Wang, M.; Yang, Y.; Liao, Z. Diabetes and cancer: Epidemiological and biological links. World J. Diabetes 2020, 11, 227. [Google Scholar] [CrossRef]
- Giovannucci, E.; Harlan, D.M.; Archer, M.C.; Bergenstal, R.M.; Gapstur, S.M.; Habel, L.A.; Pollak, M.; Regensteiner, J.G.; Yee, D. Diabetes and cancer: A consensus report. Diabetes Care 2010, 33, 1674–1685. [Google Scholar] [CrossRef] [Green Version]
- Radwan, H.; Hasan, H.; Ballout, R.A.; Rizk, R. The epidemiology of cancer in the United Arab Emirates: A systematic review. Medicine 2018, 97, e13618. [Google Scholar] [CrossRef]
- Hachim, M.Y.; Aljaibeji, H.; Hamoudi, R.A.; Hachim, I.Y.; Elemam, N.M.; Mohammed, A.K.; Salehi, A.; Taneera, J.; Sulaiman, N. An integrative phenotype–genotype approach using phenotypic characteristics from the UAE national diabetes study identifies HSD17B12 as a candidate gene for obesity and type 2 diabetes. Genes 2020, 11, 461. [Google Scholar] [CrossRef] [Green Version]
- Osman, W.; Hassoun, A.; Jelinek, H.F.; Almahmeed, W.; Afandi, B.; Tay, G.K.; Alsafar, H. Genetics of type 2 diabetes and coronary artery disease and their associations with twelve cardiometabolic traits in the United Arab Emirates population. Gene 2020, 750, 144722. [Google Scholar] [CrossRef]
- Lee, B.T.; Barber, G.P.; Benet-Pagès, A.; Casper, J.; Clawson, H.; Diekhans, M.; Fischer, C.; Gonzalez, J.N.; Hinrichs, A.S.; Lee, C.M. The UCSC Genome Browser database: 2022 update. Nucleic Acids Res. 2022, 50, D1115–D1122. [Google Scholar] [CrossRef]
- Abugessaisa, I.; Shimoji, H.; Sahin, S.; Kondo, A.; Harshbarger, J.; Lizio, M.; Hayashizaki, Y.; Carninci, P.; Forrest, A.; Kasukawa, T. FANTOM5 transcriptome catalog of cellular states based on Semantic MediaWiki. Database 2016, 2016. [Google Scholar] [CrossRef] [PubMed]
- Karolchik, D.; Baertsch, R.; Diekhans, M.; Furey, T.S.; Hinrichs, A.; Lu, Y.; Roskin, K.M.; Schwartz, M.; Sugnet, C.W.; Thomas, D.J. The UCSC genome browser database. Nucleic Acids Res. 2003, 31, 51–54. [Google Scholar] [CrossRef] [PubMed]
- Platt, A.; Vilhjálmsson, B.J.; Nordborg, M. Conditions under which genome-wide association studies will be positively misleading. Genetics 2010, 186, 1045–1052. [Google Scholar] [CrossRef] [PubMed] [Green Version]
- Manning, A.K.; Goustin, A.S.; Kleinbrink, E.L.; Thepsuwan, P.; Cai, J.; Ju, D.; Leong, A.; Udler, M.S.; Brown, J.B.; Goodarzi, M.O. A long non-coding RNA, LOC157273, is an effector transcript at the chromosome 8p23. 1-PPP1R3B metabolic traits and type 2 diabetes risk locus. Front. Genet. 2020, 11, 615. [Google Scholar] [CrossRef] [PubMed]
- Llovet, J.; Kelley, R.; Villanueva, A.; Singal, A.; Pikarsky, E.; Roayaie, S.; Lencioni, R.; Koike, K.; Zucman-Rossi, J.; Finn, R. Hepatocellular carcinoma nature reviews. Dis. Primers 2021, 7, 6. [Google Scholar] [CrossRef] [PubMed]
- Liu, C.; Cui, W.; Cong, L.; Wang, L.; Ruan, X.; Jia, J.; Liu, Y.; Jia, X.; Zhang, X. Association between NAT2 polymorphisms and lung cancer susceptibility. Medicine 2015, 94, e1947. [Google Scholar] [CrossRef] [PubMed]
- Matejcic, M.; Vogelsang, M.; Wang, Y.; Parker, I.M. NAT1 and NAT2 genetic polymorphisms and environmental exposure as risk factors for oesophageal squamous cell carcinoma: A case-control study. BMC Cancer 2015, 15, 150. [Google Scholar]
- Zou, Y.; Dong, S.; Xu, S.; Gong, Q.; Chen, J. Genetic polymorphisms of NAT2 and risk of acute myeloid leukemia: A case-control study. Medicine 2017, 96, e7499. [Google Scholar] [CrossRef]
- Kocabaş, N.A.; Şardaş, S.; Cholerton, S.; Daly, A.K.; Karakaya, A.E. N-acetyltransferase (NAT2) polymorphism and breast cancer susceptibility: A lack of association in a case-control study of Turkish population. Int. J. Toxicol. 2004, 23, 25–31. [Google Scholar] [CrossRef]
- Nagasaki, S.; Suzuki, T.; Miki, Y.; Akahira, J.-i.; Kitada, K.; Ishida, T.; Handa, H.; Ohuchi, N.; Sasano, H. 17β-Hydroxysteroid dehydrogenase type 12 in human breast carcinoma: A prognostic factor via potential regulation of fatty acid synthesis. Cancer Res. 2009, 69, 1392–1399. [Google Scholar] [CrossRef] [Green Version]
- Szajnik, M.; Szczepanski, M.J.; Elishaev, E.; Visus, C.; Lenzner, D.; Zabel, M.; Glura, M.; DeLeo, A.B.; Whiteside, T.L. 17β hydroxysteroid dehydrogenase type 12 (HSD17B12) is a marker of poor prognosis in ovarian carcinoma. Gynecol. Oncol. 2012, 127, 587–594. [Google Scholar] [CrossRef] [PubMed] [Green Version]
- Dai, W.; Liu, H.; Xu, X.; Ge, J.; Luo, S.; Zhu, D.; Amos, C.I.; Fang, S.; Lee, J.E.; Li, X. Genetic variants in ELOVL2 and HSD17B12 predict melanoma-specific survival. Int. J. Cancer 2019, 145, 2619–2628. [Google Scholar] [CrossRef] [PubMed] [Green Version]
- O’Leary, N.A.; Wright, M.W.; Brister, J.R.; Ciufo, S.; Haddad, D.; McVeigh, R.; Rajput, B.; Robbertse, B.; Smith-White, B.; Ako-Adjei, D. Reference sequence (RefSeq) database at NCBI: Current status, taxonomic expansion, and functional annotation. Nucleic Acids Res. 2016, 44, D733–D745. [Google Scholar] [CrossRef] [PubMed] [Green Version]
- Zhao, Y.; Wang, Z.; Wang, Q.; Sun, L.; Li, M.; Ren, C.; Xue, H.; Li, Z.; Zhang, K.; Hao, D. Overexpression of FES might inhibit cell proliferation, migration, and invasion of osteosarcoma cells. Cancer Cell Int. 2020, 20, 102. [Google Scholar] [CrossRef] [Green Version]
- Samudh, N.; Shrilall, C.; Arbuthnot, P.; Bloom, K.; Ely, A. Diversity of Dysregulated Long Non-Coding RNAs in HBV-Related Hepatocellular Carcinoma. Front. Immunol. 2022, 13, 129. [Google Scholar] [CrossRef]
- Khan, F.H.; Pandian, V.; Ramraj, S.K.; Aravindan, S.; Natarajan, M.; Azadi, S.; Herman, T.S.; Aravindan, N. RD3 loss dictates high-risk aggressive neuroblastoma and poor clinical outcomes. Oncotarget 2015, 6, 36522. [Google Scholar] [CrossRef] [Green Version]
- Xia, L.; Zhang, W.; Gao, L. Clinical and prognostic effects of CDKN2A, CDKN2B and CDH13 promoter methylation in ovarian cancer: A study using meta-analysis and TCGA data. Biomarkers 2019, 24, 700–711. [Google Scholar] [CrossRef]
- Goldstein, A.M.; Chan, M.; Harland, M.; Gillanders, E.M.; Hayward, N.K.; Avril, M.-F.; Azizi, E.; Bianchi-Scarra, G.; Bishop, D.T.; Bressac-de Paillerets, B. High-risk melanoma susceptibility genes and pancreatic cancer, neural system tumors, and uveal melanoma across GenoMEL. Cancer Res. 2006, 66, 9818–9828. [Google Scholar] [CrossRef] [Green Version]
- Chen, W.S.; Bindra, R.S.; Mo, A.; Hayman, T.; Husain, Z.; Contessa, J.N.; Gaffney, S.G.; Townsend, J.P.; Yu, J.B. CDKN2A copy number loss is an independent prognostic factor in HPV-negative head and neck squamous cell carcinoma. Front. Oncol. 2018, 8, 95. [Google Scholar] [CrossRef] [Green Version]
- Zhao, R.; Choi, B.Y.; Lee, M.-H.; Bode, A.M.; Dong, Z. Implications of genetic and epigenetic alterations of CDKN2A (p16INK4a) in cancer. EBioMedicine 2016, 8, 30–39. [Google Scholar] [CrossRef] [Green Version]
- Butcher, N.; Boukouvala, S.; Sim, E.; Minchin, R. Pharmacogenetics of the arylamine N-acetyltransferases. Pharm. J. 2002, 2, 30–42. [Google Scholar] [CrossRef] [PubMed] [Green Version]
- Sim, E.; Abuhammad, A.; Ryan, A. Arylamine N-acetyltransferases: From drug metabolism and pharmacogenetics to drug discovery. Br. J. Pharmacol. 2014, 171, 2705–2725. [Google Scholar] [CrossRef] [PubMed]
- Knowles, J.W.; Xie, W.; Zhang, Z.; Chennemsetty, I.; Assimes, T.L.; Paananen, J.; Hansson, O.; Pankow, J.; Goodarzi, M.O.; Carcamo-Orive, I. Identification and validation of N-acetyltransferase 2 as an insulin sensitivity gene. J. Clin. Investig. 2015, 125, 1739–1751. [Google Scholar] [CrossRef] [PubMed]
- Tarao, K.; Nozaki, A.; Ikeda, T.; Sato, A.; Komatsu, H.; Komatsu, T.; Taguri, M.; Tanaka, K. Real impact of liver cirrhosis on the development of hepatocellular carcinoma in various liver diseases—Meta-analytic assessment. Cancer Med. 2019, 8, 1054–1065. [Google Scholar] [CrossRef] [Green Version]
- Wang, C.; Wang, X.; Gong, G.; Ben, Q.; Qiu, W.; Chen, Y.; Li, G.; Wang, L. Increased risk of hepatocellular carcinoma in patients with diabetes mellitus: A systematic review and meta-analysis of cohort studies. Int. J. Cancer 2012, 130, 1639–1648. [Google Scholar] [CrossRef]
- Engström, P.G.; Suzuki, H.; Ninomiya, N.; Akalin, A.; Sessa, L.; Lavorgna, G.; Brozzi, A.; Luzi, L.; Tan, S.L.; Yang, L. Complex loci in human and mouse genomes. PLoS Genet. 2006, 2, e47. [Google Scholar] [CrossRef] [PubMed] [Green Version]
- Dai, X.; Xiang, L.; Li, T.; Bai, Z. Cancer hallmarks, biomarkers and breast cancer molecular subtypes. J. Cancer 2016, 7, 1281. [Google Scholar] [CrossRef] [Green Version]
- Lin, C.-Y.; Kleinbrink, E.L.; Dachet, F.; Cai, J.; Ju, D.; Goldstone, A.; Wood, E.J.; Liu, K.; Jia, H.; Goustin, A.-S. Primate-specific oestrogen-responsive long non-coding RNAs regulate proliferation and viability of human breast cancer cells. Open Biol. 2016, 6, 150262. [Google Scholar] [CrossRef] [Green Version]
- Koundouros, N.; Poulogiannis, G. Reprogramming of fatty acid metabolism in cancer. Br. J. Cancer 2020, 122, 4–22. [Google Scholar] [CrossRef] [Green Version]
- Mahajan, A.; Taliun, D.; Thurner, M.; Robertson, N.R.; Torres, J.M.; Rayner, N.W.; Payne, A.J.; Steinthorsdottir, V.; Scott, R.A.; Grarup, N. Fine-mapping type 2 diabetes loci to single-variant resolution using high-density imputation and islet-specific epigenome maps. Nat. Genet. 2018, 50, 1505–1513. [Google Scholar] [CrossRef] [Green Version]
- Scott, R.A.; Scott, L.J.; Mägi, R.; Marullo, L.; Gaulton, K.J.; Kaakinen, M.; Pervjakova, N.; Pers, T.H.; Johnson, A.D.; Eicher, J.D. An expanded genome-wide association study of type 2 diabetes in Europeans. Diabetes 2017, 66, 2888–2902. [Google Scholar] [CrossRef] [PubMed] [Green Version]
- Khatib, A.-M.; Sfaxi, F. FURIN (furin (paired basic amino acid cleaving enzyme)). Atlas Genet. Oncol. 2012, 638. [Google Scholar] [CrossRef] [Green Version]
- Johnson, B.A.; Xie, X.; Kalveram, B.; Lokugamage, K.G.; Muruato, A.; Zou, J.; Zhang, X.; Juelich, T.; Smith, J.K.; Zhang, L. Furin cleavage site is key to SARS-CoV-2 pathogenesis. BioRxiv 2020. Available online: https://www.biorxiv.org/content/10.1101/2020.08.26.268854v1 (accessed on 1 January 2020).
- He, Z.; Khatib, A.-M.; Creemers, J.W. The proprotein convertase furin in cancer: More than an oncogene. Oncogene 2022, 41, 1252–1262. [Google Scholar] [CrossRef]
- Liu, X.; Li, Y.; Meng, L.; Liu, X.-Y.; Peng, A.; Chen, Y.; Liu, C.; Chen, H.; Sun, S.; Miao, X. Reducing protein regulator of cytokinesis 1 as a prospective therapy for hepatocellular carcinoma. Cell Death Dis. 2018, 9, 534. [Google Scholar] [CrossRef] [Green Version]
- Cai, Y.; Kirschke, C.P.; Huang, L. SLC30A family expression in the pancreatic islets of humans and mice: Cellular localization in the β-cells. J. Mol. Histol. 2018, 49, 133–145. [Google Scholar] [CrossRef]
- Chang, J.; Yu, Y.; Fang, Z.; He, H.; Wang, D.; Teng, J.; Yang, L. Long non-coding RNA CDKN2B-AS1 regulates high glucose-induced human mesangial cell injury via regulating the miR-15b-5p/WNT2B axis. Diabetol. Metab. Syndr. 2020, 12, 109. [Google Scholar] [CrossRef]
- Zhang, Z.; Gu, M.; Gu, Z.; Lou, Y.-R. Role of Long Non-Coding RNA Polymorphisms in Cancer Chemotherapeutic Response. J. Pers. Med. 2021, 11, 513. [Google Scholar] [CrossRef]
- Nie, F.-q.; Sun, M.; Yang, J.-s.; Xie, M.; Xu, T.-p.; Xia, R.; Liu, Y.-w.; Liu, X.-h.; Zhang, E.-b.; Lu, K.-h. Long noncoding RNA ANRIL promotes non–small cell lung cancer cell proliferation and inhibits apoptosis by silencing KLF2 and P21 expression. Mol. Cancer Ther. 2015, 14, 268–277. [Google Scholar] [CrossRef] [Green Version]
- Lin, L.; Gu, Z.-T.; Chen, W.-H.; Cao, K.-J. Increased expression of the long non-coding RNA ANRIL promotes lung cancer cell metastasis and correlates with poor prognosis. Diagn. Pathol. 2015, 10, 14. [Google Scholar] [CrossRef] [Green Version]
- Huang, X.; Zhang, W.; Shao, Z. Association between long non-coding RNA polymorphisms and cancer risk: A meta-analysis. Biosci. Rep. 2018, 38, BSR20180365. [Google Scholar] [CrossRef] [PubMed] [Green Version]
- Gong, W.-j.; Peng, J.-b.; Yin, J.-y.; Li, X.-p.; Zheng, W.; Xiao, L.; Tan, L.-m.; Xiao, D.; Chen, Y.-x.; Li, X. Association between well-characterized lung cancer lncRNA polymorphisms and platinum-based chemotherapy toxicity in Chinese patients with lung cancer. Acta Pharmacol. Sin. 2017, 38, 581–590. [Google Scholar] [CrossRef] [PubMed]
- Volkogon, A.; Harbuzova, V.Y.; Ataman, A. Analysis of ANRIL gene polymorphism rs4977574 association with kidney cancer development in Ukrainian population. Med. Perspect. 2020, 25, 60–65. [Google Scholar] [CrossRef]
- Pasquale, L.R.; Loomis, S.J.; Kang, J.H.; Yaspan, B.L.; Abdrabou, W.; Budenz, D.L.; Chen, T.C.; DelBono, E.; Friedman, D.S.; Gaasterland, D. CDKN2B-AS1 genotype–glaucoma feature correlations in primary open-angle glaucoma patients from the United States. Am. J. Ophthalmol. 2013, 155, 342–353.e5. [Google Scholar] [CrossRef] [PubMed] [Green Version]
- Thakur, N.; Kupani, M.; Mannan, R.; Pruthi, A.; Mehrotra, S. Genetic association between CDKN2B/CDKN2B-AS1 gene polymorphisms with primary glaucoma in a North Indian cohort: An original study and an updated meta-analysis. BMC Med. Genom. 2021, 14, 1. [Google Scholar] [CrossRef] [PubMed]
- Chen, Y.D.; Zhang, N.; Qiu, X.G.; Yuan, J.; Yang, M. LncRNA CDKN2BAS rs2157719 genetic variant contributes to medulloblastoma predisposition. J. Gene Med. 2018, 20, e3000. [Google Scholar] [CrossRef] [PubMed]
- Dahlin, A.M.; Wibom, C.; Andersson, U.; Hougaard, D.M.; Bybjerg-Grauholm, J.; Deltour, I.; Hultman, C.M.; Kähler, A.K.; Karlsson, R.; Hjalmars, U. Genetic variants in the 9p21. 3 locus associated with glioma risk in children, adolescents, and young adults: A case–control study. Cancer Epidemiol. Prev. Biomark. 2019, 28, 1252–1258. [Google Scholar] [CrossRef] [Green Version]
- Tam, V.; Patel, N.; Turcotte, M.; Bossé, Y.; Paré, G.; Meyre, D. Benefits and limitations of genome-wide association studies. Nat. Rev. Genet. 2019, 20, 467–484. [Google Scholar] [CrossRef]
- Frayling, T. Genome-wide association studies: The good, the bad and the ugly. Clin. Med. 2014, 14, 428. [Google Scholar] [CrossRef]
- van den Berg, B.H.; McCarthy, F.M.; Lamont, S.J.; Burgess, S.C. Re-annotation is an essential step in systems biology modeling of functional genomics data. PLoS ONE 2010, 5, e10642. [Google Scholar] [CrossRef]
- Vincent, E.E.; Yaghootkar, H. Using genetics to decipher the link between type 2 diabetes and cancer: Shared aetiology or downstream consequence? Diabetologia 2020, 63, 1706–1717. [Google Scholar] [CrossRef] [PubMed]
- Ma, C.; Gu, L.; Yang, M.; Zhang, Z.; Zeng, S.; Song, R.; Xu, C.; Sun, Y. rs1495741 as a tag single nucleotide polymorphism of N-acetyltransferase 2 acetylator phenotype associates bladder cancer risk and interacts with smoking: A systematic review and meta-analysis. Medicine 2016, 95, e4417. [Google Scholar] [CrossRef] [PubMed]
- Ahmad, S.; Mora, S.; Ridker, P.M.; Hu, F.B.; Chasman, D.I. Gene-based elevated triglycerides and type 2 diabetes mellitus risk in the women’s genome health study. Arterioscler. Thromb. Vasc. Biol. 2019, 39, 97–106. [Google Scholar] [CrossRef] [PubMed] [Green Version]
- Chamorro, J.G.; Castagnino, J.P.; Musella, R.M.; Nogueras, M.; Frías, A.; Visca, M.; Aidar, O.; Costa, L.; de Larrañaga, G.F. tagSNP rs1495741 as a useful molecular marker to predict antituberculosis drug-induced hepatotoxicity. Pharm. Genom. 2016, 26, 357–361. [Google Scholar] [CrossRef]
- Wu, H.; Wang, X.; Zhang, L.; Mo, N.; Lv, Z. Association between N-acetyltransferase 2 polymorphism and bladder cancer risk: Results from studies of the past decade and a meta-analysis. Clin. Genitourin. Cancer 2016, 14, 122–129. [Google Scholar] [CrossRef]
- Al-Shaqha, W.M.; Alkharfy, K.M.; Al-Daghri, N.M.; Mohammed, A.K. N-acetyltransferase 1 and 2 polymorphisms and risk of diabetes mellitus type 2 in a Saudi population. Ann. Saudi Med. 2015, 35, 214–221. [Google Scholar] [CrossRef] [Green Version]
- Jin, L.; Zheng, D.; Bhandari, A.; Chen, D.; Xia, E.; Guan, Y.; Wen, J.; Wang, O. PSD3 is an oncogene that promotes proliferation, migration, invasion, and G1/S transition while inhibits apoptotic in papillary thyroid cancer. J. Cancer 2021, 12, 5413. [Google Scholar] [CrossRef]
- Gong, S.; Xu, C.; Wang, L.; Liu, Y.; Owusu, D.; Bailey, B.A.; Li, Y.; Wang, K. Genetic association analysis of polymorphisms in PSD3 gene with obesity, type 2 diabetes, and HDL cholesterol. Diabetes Res. Clin. Pract. 2017, 126, 105–114. [Google Scholar] [CrossRef]
- Song, C.; Qi, Y.; Zhang, J.; Guo, C.; Yuan, C. CDKN2B-AS1: An indispensable long non-coding RNA in multiple diseases. Curr. Pharm. Des. 2020, 26, 5335–5346. [Google Scholar] [CrossRef]
- Chennamsetty, I.; Coronado, M.; Contrepois, K.; Keller, M.P.; Carcamo-Orive, I.; Sandin, J.; Fajardo, G.; Whittle, A.J.; Fathzadeh, M.; Snyder, M. Nat1 deficiency is associated with mitochondrial dysfunction and exercise intolerance in mice. Cell Rep. 2016, 17, 527–540. [Google Scholar] [CrossRef] [Green Version]
- Fernandez, C.; Rysä, J.; Almgren, P.; Nilsson, J.; Engström, G.; Orho-Melander, M.; Ruskoaho, H.; Melander, O. Plasma levels of the proprotein convertase furin and incidence of diabetes and mortality. J. Intern. Med. 2018, 284, 377–387. [Google Scholar] [CrossRef] [PubMed] [Green Version]
- Adu-Agyeiwaah, Y.; Grant, M.B.; Obukhov, A.G. The potential role of osteopontin and furin in worsening disease outcomes in COVID-19 patients with pre-existing diabetes. Cells 2020, 9, 2528. [Google Scholar] [CrossRef] [PubMed]
- Ryu, M.-S.; Lichten, L.A.; Liuzzi, J.P.; Cousins, R.J. Zinc transporters ZnT1 (Slc30a1), Zip8 (Slc39a8), and Zip10 (Slc39a10) in mouse red blood cells are differentially regulated during erythroid development and by dietary zinc deficiency. J. Nutr. 2008, 138, 2076–2083. [Google Scholar] [CrossRef] [PubMed] [Green Version]
- Yamasaki, S.; Sakata-Sogawa, K.; Hasegawa, A.; Suzuki, T.; Kabu, K.; Sato, E.; Kurosaki, T.; Yamashita, S.; Tokunaga, M.; Nishida, K. Zinc is a novel intracellular second messenger. J. Cell Biol. 2007, 177, 637–645. [Google Scholar] [CrossRef] [Green Version]
- Norouzi, S.; Adulcikas, J.; Sohal, S.S.; Myers, S. Zinc transporters and insulin resistance: Therapeutic implications for type 2 diabetes and metabolic disease. J. Biomed. Sci. 2017, 24, 87. [Google Scholar] [CrossRef] [Green Version]
- Cotrozzi, G.; Relli, P.; Buzzelli, G. Role of the liver in the regulation of glucose metabolism in diabetes and chronic liver disease. Ann. Ital. Med. Interna Organo Uff. Della Soc. Ital. Med. Interna 1997, 12, 84–91. [Google Scholar]
- Damase, T.R.; Sukhovershin, R.; Boada, C.; Taraballi, F.; Pettigrew, R.I.; Cooke, J.P. The limitless future of RNA therapeutics. Front. Bioeng. Biotechnol. 2021, 9, 161. [Google Scholar] [CrossRef]
- Feng, R.; Patil, S.; Zhao, X.; Miao, Z.; Qian, A. RNA Therapeutics-Research and Clinical Advancements. Front. Mol. Biosci. 2021, 8, 913. [Google Scholar] [CrossRef]
- Gaulton, K.J.; Ferreira, T.; Lee, Y.; Raimondo, A.; Mägi, R.; Reschen, M.E.; Mahajan, A.; Locke, A.; William Rayner, N.; Robertson, N. Genetic fine mapping and genomic annotation defines causal mechanisms at type 2 diabetes susceptibility loci. Nat. Genet. 2015, 47, 1415–1425. [Google Scholar] [CrossRef]


| SNP ID | Chromosomal Region | Nearest Gene | Nearby Genes | Type of Cancer | References |
|---|---|---|---|---|---|
| rs1495741 | 8p22 | NAT2 | NAT2, PSD3 | HCC, LC, ESCC, AML, BC | [25,26,27,28,29] |
| rs1061810 | 11p11.2 | HSD17B12 | HSD17B12, AC087521.2, AC087521.4 | BC, OC, MM | [30,31,32] |
| rs2521501 | 15q26.1 | FES | FURIN, FES | APL, SARC | [33,34] |
| rs8042680 | 15q26.1 | PRC1, PRC1-AS1 | PRC1, PRC1-AS1 | HCC | [35] |
| rs7526425 | 1q32.3 | RD3 | AC105275.1, SLC30A1, RD3 | APL, NB | [36] |
| rs2157719 | 9p21.3 | CDKN2B | CDKN2A, CDKN2B | OC, PC, MM, HNSCC | [37,38,39,40] |
Publisher’s Note: MDPI stays neutral with regard to jurisdictional claims in published maps and institutional affiliations. |
© 2022 by the authors. Licensee MDPI, Basel, Switzerland. This article is an open access article distributed under the terms and conditions of the Creative Commons Attribution (CC BY) license (https://creativecommons.org/licenses/by/4.0/).
Share and Cite
Giordo, R.; Gulsha, R.; Kalla, S.; Calin, G.A.; Lipovich, L. LncRNA-Associated Genetic Etiologies Are Shared between Type 2 Diabetes and Cancers in the UAE Population. Cancers 2022, 14, 3313. https://doi.org/10.3390/cancers14143313
Giordo R, Gulsha R, Kalla S, Calin GA, Lipovich L. LncRNA-Associated Genetic Etiologies Are Shared between Type 2 Diabetes and Cancers in the UAE Population. Cancers. 2022; 14(14):3313. https://doi.org/10.3390/cancers14143313
Chicago/Turabian StyleGiordo, Roberta, Rida Gulsha, Sarah Kalla, George A. Calin, and Leonard Lipovich. 2022. "LncRNA-Associated Genetic Etiologies Are Shared between Type 2 Diabetes and Cancers in the UAE Population" Cancers 14, no. 14: 3313. https://doi.org/10.3390/cancers14143313