
Prognostic and Predictive Role of Body Composition in Metastatic Neuroendocrine Tumor Patients Treated with Everolimus: A Real-World Data Analysis

 , , , , , , , , , add
Show full author list
, , , , , , , , , add
Show full author list
Abstract
:Simple Summary
Abstract
1. Introduction
2. Patients and Methods
2.1. Population
2.2. Calculation of Body Composition Indexes
2.3. Statistical Analysis
2.4. Statement of Ethics
3. Results
3.1. Patient Characteristics
3.2. Correlation between Body Composition and Outcome
3.3. Correlation between Body Composition and Toxicity
4. Discussion
5. Conclusions
Author Contributions
Funding
Institutional Review Board Statement
Informed Consent Statement
Data Availability Statement
Acknowledgments
Conflicts of Interest
References
- Dasari, A.; Shen, C.; Halperin, D.M.; Zhao, B.; Zhou, S.; Xu, Y.; Shih, T.; Yao, J.C. Trends in the Incidence, Prevalence, and Survival Outcomes in Patients with Neuroendocrine Tumors in the United States. JAMA Oncol. 2017, 3, 1335–1342. [Google Scholar] [CrossRef] [PubMed]
- Halfdanarson, T.R.; Strosberg, J.R.; Tang, L.; Bellizzi, A.M.; Bergsland, E.K.; O’Dorisio, T.M.; Halperin, D.M.; Fishbein, L.; Eads, J.; Hope, T.A.; et al. The North American Neuroendocrine Tumor Society Consensus Guidelines for Surveillance and Medical Management of Pancreatic Neuroendocrine Tumors. Pancreas 2020, 49, 863–881. [Google Scholar] [CrossRef] [PubMed]
- Araujo-Castro, M.; Pascual-Corrales, E.; Molina-Cerrillo, J.; Mata, N.M.; Alonso-Gordoa, T. Bronchial Carcinoids: From Molecular Background to Treatment Approach. Cancers 2022, 14, 520. [Google Scholar] [CrossRef] [PubMed]
- O’Toole, D.; Kianmanesh, R.; Caplin, M. ENETS 2016 Consensus Guidelines for the Management of Patients with Digestive Neuroendocrine Tumors: An Update. Neuroendocrinology 2016, 103, 117–118. [Google Scholar] [CrossRef]
- Bongiovanni, A.; Liverani, C.; Recine, F.; Fausti, V.; Mercatali, L.; Vagheggini, A.; Spadazzi, C.; Miserocchi, G.; Cocchi, C.; Di Menna, G.; et al. Phase-II Trials of Pazopanib in Metastatic Neuroendocrine Neoplasia (mNEN): A Systematic Review and Meta-Analysis. Front. Oncol. 2020, 10, 414. [Google Scholar] [CrossRef] [PubMed]
- Guertin, D.A.; Sabatini, D.M. Defining the Role of mTOR in Cancer. Cancer Cell 2007, 12, 9–22. [Google Scholar] [CrossRef] [Green Version]
- Saxton, R.A.; Sabatini, D.M. mTOR Signaling in Growth, Metabolism, and Disease. Cell 2017, 168, 960–976, Erratum in: Cell 2017, 169, 361–371. [Google Scholar] [CrossRef] [Green Version]
- Dann, S.G.; Selvaraj, A.; Thomas, G. mTOR Complex1–S6K1 signaling: At the crossroads of obesity, diabetes and cancer. Trends Mol. Med. 2007, 13, 252–259. [Google Scholar] [CrossRef]
- Cheng, H.; Walls, M.; Baxi, S.M.; Yin, M.-J. Targeting the mTOR pathway in tumor malignancy. Curr. Cancer Drug Targets 2013, 13, 267–277. [Google Scholar] [CrossRef]
- Qiu, H.-Y.; Wang, P.-F.; Zhang, M. A patent review of mTOR inhibitors for cancer therapy (2011–2020). Expert Opin. Ther. Pat. 2021, 31, 965–975. [Google Scholar] [CrossRef]
- Zaytseva, Y.Y.; Valentino, J.D.; Gulhati, P.; Evers, B.M. mTOR inhibitors in cancer therapy. Cancer Lett. 2012, 319, 1–7. [Google Scholar] [CrossRef] [PubMed]
- Lee, L.; Ito, T.; Jensen, R.T. Everolimus in the treatment of neuroendocrine tumors: Efficacy, side-effects, resistance, and factors affecting its place in the treatment sequence. Expert Opin. Pharmacother. 2018, 19, 909–928. [Google Scholar] [CrossRef] [PubMed]
- Zatelli, M.C.; Minoia, M.; Martini, C.; Tagliati, F.; Ambrosio, M.R.; Schiavon, M.; Buratto, M.; Calabrese, F.; Gentilin, E.; Cavallesco, G.; et al. Everolimus as a new potential antiproliferative agent in aggressive human bronchial carcinoids. Endocr.-Relat. Cancer 2010, 17, 719–729. [Google Scholar] [CrossRef]
- Di Nicolantonio, F.; Arena, S.; Tabernero, J.; Grosso, S.; Molinari, F.; Macarulla, T.; Russo, M.; Cancelliere, C.; Zecchin, D.; Mazzucchelli, L.; et al. Deregulation of the PI3K and KRAS signaling pathways in human cancer cells determines their response to everolimus. J. Clin. Investig. 2010, 120, 2858–2866. [Google Scholar] [CrossRef] [PubMed] [Green Version]
- Meric-Bernstam, F.; Akcakanat, A.; Chen, H.; Do, K.-A.; Sangai, T.; Adkins, F.; Gonzalez-Angulo, A.M.; Rashid, A.; Crosby, K.; Dong, M.; et al. PIK3CA/PTEN Mutations and Akt Activation as Markers of Sensitivity to Allosteric mTOR Inhibitors. Clin. Cancer Res. 2012, 18, 1777–1789. [Google Scholar] [CrossRef] [PubMed] [Green Version]
- Guba, M.; Von Breitenbuch, P.; Steinbauer, M.; Koehl, G.; Flegel, S.; Hornung, M.; Bruns, C.J.; Zuelke, C.; Farkas, S.; Anthuber, M.; et al. Rapamycin inhibits primary and metastatic tumor growth by antiangiogenesis: Involvement of vascular endothelial growth factor. Nat. Med. 2002, 8, 128–135. [Google Scholar] [CrossRef]
- Vergès, B.; Walter, T.; Cariou, B. Endocrine side effects of anti-cancer drugs: Effects of anti-cancer targeted therapies on lipid and glucose metabolism. Eur. J. Endocrinol. 2014, 170, R43–R55. [Google Scholar] [CrossRef] [Green Version]
- Mao, Z.; Zhang, W. Role of mTOR in Glucose and Lipid Metabolism. Int. J. Mol. Sci. 2018, 19, 2043. [Google Scholar] [CrossRef] [Green Version]
- Park, J.; Scherer, P.E. Adipocyte-derived endotrophin promotes malignant tumor progression. J. Clin. Investig. 2012, 122, 4243–4256. [Google Scholar] [CrossRef] [Green Version]
- Bentzinger, C.F.; Romanino, K.; Cloëtta, D.; Lin, S.; Mascarenhas, J.B.; Oliveri, F.; Xia, J.; Casanova, E.; Costa, C.F.; Brink, M.; et al. Skeletal Muscle-Specific Ablation of raptor, but Not of rictor, Causes Metabolic Changes and Results in Muscle Dystrophy. Cell Metab. 2008, 8, 411–424. [Google Scholar] [CrossRef] [Green Version]
- Antoun, S.; Birdsell, L.; Sawyer, M.B.; Venner, P.; Escudier, B.; Baracos, V.E. Association of Skeletal Muscle Wasting with Treatment with Sorafenib in Patients with Advanced Renal Cell Carcinoma: Results From a Placebo-Controlled Study. J. Clin. Oncol. 2010, 28, 1054–1060. [Google Scholar] [CrossRef]
- Martin, L.; Birdsell, L.; MacDonald, N.; Reiman, T.; Clandinin, M.T.; McCargar, L.J.; Murphy, R.; Ghosh, S.; Sawyer, M.B.; Baracos, V.E. Cancer Cachexia in the Age of Obesity: Skeletal Muscle Depletion Is a Powerful Prognostic Factor, Independent of Body Mass Index. J. Clin. Oncol. 2013, 31, 1539–1547. [Google Scholar] [CrossRef]
- Herrera-Martínez, Y.; Teomiro, C.A.; Idougourram, S.L.; Puertas, M.J.M.; Continente, A.C.; Blanch, R.S.; Castaño, J.P.; Moreno, M.G.; Gahete, M.D.; Luque, R.M.; et al. Sarcopenia and Ghrelin System in the Clinical Outcome and Prognosis of Gastroenteropancreatic Neuroendocrine Neoplasms. Cancers 2021, 14, 111. [Google Scholar] [CrossRef] [PubMed]
- Baumgartner, R.N. Body Composition in Healthy Aging. Ann. N. Y. Acad. Sci. 2000, 904, 437–448. [Google Scholar] [CrossRef] [PubMed]
- Prado, C.M.; Lieffers, J.R.; McCargar, L.J.; Reiman, T.; Sawyer, M.B.; Martin, L.; Baracos, V.E. Prevalence and clinical implications of sarcopenic obesity in patients with solid tumours of the respiratory and gastrointestinal tracts: A population-based study. Lancet Oncol. 2008, 9, 629–635. [Google Scholar] [CrossRef]
- Aubrey, J.; Esfandiari, N.; Baracos, V.E.; Buteau, F.A.; Frenette, J.; Putman, C.T.; Mazurak, V.C. Measurement of skeletal muscle radiation attenuation and basis of its biological variation. Acta Physiol. 2014, 210, 489–497. [Google Scholar] [CrossRef] [Green Version]
- Lee, C.S.; Won, D.D.; Oh, S.N.; Lee, Y.S.; Lee, I.K.; Kim, I.-H.; Choi, M.H.; Oh, S.T. Prognostic role of pre-sarcopenia and body composition with long-term outcomes in obstructive colorectal cancer: A retrospective cohort study. World J. Surg. Oncol. 2020, 18, 230. [Google Scholar] [CrossRef]
- Caplin, M.E.; Pavel, M.; Phan, A.T.; Ćwikła, J.B.; Sedláčková, E.; Thanh, X.-M.T.; Wolin, E.M.; Ruszniewski, P. CLARINET Investigators Lanreotide autogel/depot in advanced enteropancreatic neuroendocrine tumours: Final results of the CLARINET open-label extension study. Endocrine 2020, 71, 502–513. [Google Scholar] [CrossRef]
- National Cancer Institute. Common Terminology Criteria for Adverse Future Events. Common Terminology Criteria for Adverse Events v5.0 (CTCAE). Cancer Therapy Evaluation Program. 2017. Available online: http://ctep.cancer.gov (accessed on 27 November 2017).
- Eisenhauer, E.A.; Therasse, P.; Bogaerts, J.; Schwartz, L.H.; Sargent, D.; Ford, R.; Dancey, J.; Arbuck, S.; Gwyther, S.; Mooney, M.; et al. New response evaluation criteria in solid tumours: Revised RECIST guideline (version 1.1). Eur. J. Cancer 2009, 45, 228–247. [Google Scholar] [CrossRef]
- Ma, D.; Chow, V.; Popuri, K.; Beg, M.F. Comprehensive Validation of Automated Whole Body Skeletal Muscle, Adipose Tissue, and Bone Segmentation from 3D CT images for Body Composition Analysis: Towards Extended Body Composition. arXiv 2021, arXiv:2106.00652. Submitted on 1 Jun 2021 (v1), last revised 27 Jul 2021 (this version, v3). Available online: https://arxiv.org/abs/2106.00652 (accessed on 23 February 2022).
- Barrea, L.; Muscogiuri, G.; Modica, R.; Altieri, B.; Pugliese, G.; Minotta, R.; Faggiano, A.; Colao, A.; Savastano, S. Cardio-Metabolic Indices and Metabolic Syndrome as Predictors of Clinical Severity of Gastroenteropancreatic Neuroendocrine Tumors. Front. Endocrinol. 2021, 12, 649496. [Google Scholar] [CrossRef]
- Yoon, M.-S. mTOR as a Key Regulator in Maintaining Skeletal Muscle Mass. Front. Physiol. 2017, 8, 788. [Google Scholar] [CrossRef] [PubMed] [Green Version]
- Guertin, D.A.; Stevens, D.M.; Thoreen, C.C.; Burds, A.A.; Kalaany, N.Y.; Moffat, J.; Brown, M.; Fitzgerald, K.J.; Sabatini, D.M. Ablation in Mice of the mTORC Components raptor, rictor, or mLST8 Reveals that mTORC2 Is Required for Signaling to Akt-FOXO and PKCα, but Not S6K1. Dev. Cell 2006, 11, 859–871. [Google Scholar] [CrossRef] [PubMed] [Green Version]
- Robert, F.; Mills, J.R.; Agenor, A.; Wang, D.; DiMarco, S.; Cencic, R.; Tremblay, M.L.; Gallouzi, I.E.; Hekimi, S.; Wing, S.S.; et al. Targeting Protein Synthesis in a Myc/mTOR-Driven Model of Anorexia-Cachexia Syndrome Delays Its Onset and Prolongs Survival. Cancer Res. 2012, 72, 747–756. [Google Scholar] [CrossRef] [PubMed] [Green Version]
- Hatakeyama, S.; Summermatter, S.; Jourdain, M.; Melly, S.; Minetti, G.C.; Lach-Trifilieff, E. ActRII blockade protects mice from cancer cachexia and prolongs survival in the presence of anti-cancer treatments. Skelet. Muscle 2016, 6, 26. [Google Scholar] [CrossRef] [PubMed] [Green Version]
- Gyawali, B.; Shimokata, T.; Honda, K.; Kondoh, C.; Hayashi, N.; Yoshino, Y.; Sassa, N.; Nakano, Y.; Gotoh, M.; Ando, Y. Muscle wasting associated with the long-term use of mTOR inhibitors. Mol. Clin. Oncol. 2016, 5, 641–646. [Google Scholar] [CrossRef] [Green Version]
- Auclin, E.; Bourillon, C.; De Maio, E.; By, M.A.; Seddik, S.; Fournier, L.; Auvray, M.; Dautruche, A.; Vano, Y.-A.; Thibault, C.; et al. Prediction of Everolimus Toxicity and Prognostic Value of Skeletal Muscle Index in Patients with Metastatic Renal Cell Carcinoma. Clin. Genitourin. Cancer 2017, 15, 350–355. [Google Scholar] [CrossRef]
- Rosen, E.D.; Spiegelman, B.M. What We Talk About When We Talk About Fat. Cell 2014, 156, 20–44. [Google Scholar] [CrossRef] [Green Version]
- McMillan, A.C.; White, M.D. Induction of thermogenesis in brown and beige adipose tissues: Molecular markers, mild cold exposure and novel therapies. Curr. Opin. Endocrinol. Diabetes Obes. 2015, 22, 347–352. [Google Scholar] [CrossRef]
- Chi, M.; Chen, J.; Ye, Y.; Tseng, H.-Y.; Lai, F.; Tay, K.; Jin, L.; Guo, S.; Jiang, C.; Zhang, X. Adipocytes Contribute to Resistance of Human Melanoma Cells to Chemotherapy and Targeted Therapy. Curr. Med. Chem. 2014, 21, 1255–1267. [Google Scholar] [CrossRef]
- Wang, R.; Hu, W. Asprosin promotes β-cell apoptosis by inhibiting the autophagy of β-cell via AMPK-mTOR pathway. J. Cell. Physiol. 2020, 236, 215–221. [Google Scholar] [CrossRef]
- Bartucci, M.; Svensson, S.; Ricci-Vitiani, L.; Dattilo, R.; Biffoni, M.; Signore, M.; Ferla, R.; De Maria, R.; Surmacz, E. Obesity hormone leptin induces growth and interferes with the cytotoxic effects of 5-fluorouracil in colorectal tumor stem cells. Endocr.-Relat. Cancer 2010, 17, 823–833. [Google Scholar] [CrossRef] [PubMed] [Green Version]
- Zhao, H.; Li, T.; Wang, K.; Zhao, F.; Chen, J.; Xu, G.; Zhao, J.; Li, T.; Chen, L.; Li, L.; et al. AMPK-mediated activation of MCU stimulates mitochondrial Ca2+ entry to promote mitotic progression. Nat. Cell Biol. 2019, 21, 476–486. [Google Scholar] [CrossRef] [PubMed]
- Cai, H.; Dong, L.Q.; Liu, F. Recent Advances in Adipose mTOR Signaling and Function: Therapeutic Prospects. Trends Pharmacol. Sci. 2015, 37, 303–317. [Google Scholar] [CrossRef] [Green Version]
- Fang, Y.; Westbrook, R.; Hill, C.; Boparai, R.K.; Arum, O.; Spong, A.; Wang, F.; Javors, M.A.; Chen, J.; Sun, L.Y.; et al. Duration of Rapamycin Treatment Has Differential Effects on Metabolism in Mice. Cell Metab. 2013, 17, 456–462. [Google Scholar] [CrossRef] [PubMed] [Green Version]


| Characteristics | Median (Range) |
|---|---|
| Age at treatment | 55.3 (24.6–70.2) |
| N (%) | |
| Gender | |
| Male | 15 (50.0) |
| Female | 15 (50.0) |
| Site of disease | |
| Pancreas | 9 (30) |
| Gastrointestinal (GI) | 12 (40) |
| Lung | 6 (20) |
| Other | 2 (6.7) |
| Unknown | 1 (3.3) |
| Ki67 | |
| ≤10 | 18 (60) |
| >10 | 10 (33.3) |
| Unknown | 2 (6.7) |
| Grading | |
| 1 | 6 (20.0) |
| 2 | 21 (70.0) |
| Unknown | 3 (10) |
| Surgery of primitive | |
| Not done | 11 (36.7) |
| Done | 19 (63.3) |
| Comorbidity | |
| None | 9 (30.0) |
| Only cardiovascular | 8 (26.7) |
| Cardiovascular + Other (endocrine or metabolic) | 8 (26.7) |
| Other | 5 (16.7) |
| Previous treatments | |
| Somatostatin analogues (SSAs) | 27 (90) |
| Peptide Receptor Radionuclide Therapy (PRRT) Chemotherapy Other (anti-VEGF agents) | 25 (83.3) 16 (53.3) 2 (6.7) |
| Pre therapy BMI | |
| BMI ≤ 18.49 | 8 (26.7) |
| BMI > 18.49 and ≤ 24.99 | 18 (60.0) |
| BMI > 24.99 | 4 (13.3) |
| Body Composition | Median (Range) for SD + PR Subgroup (n = 20) | Median (Range) for PD Subgroup (n = 10) | p-Value |
|---|---|---|---|
| SMI | 42.5 (32.8–64.9) | 39.2 (31.0–46.6) | 0.186 |
| VATI | 40.2 (3.9–108.5) | 7.4 (2.8–76.8) | 0.015 |
| SATI | 66.6 (13.4–154.2) | 41.3 (14.2–103.4) | 0.086 |
| TATI | 122.4 (17.4–214.1) | 49.2 (17.0–136.4) | 0.027 |
| Variation of Body Composition from Pre Therapy to Post Therapy | SD + PR Subgroup (n = 20) (%) | PD Subgroup (n = 10) (%) | p-Value |
|---|---|---|---|
| SMI variation | |||
| Increase | 9 (45.0) | 0 (0.0) | 0.011 |
| Decrease | 11 (55.0) | 10 (100.0) | |
| VATI variation | |||
| Increase | 9 (45.0) | 3 (30.0) | 0.429 |
| Decrease | 11 (55.0) | 7 (70.0) | |
| SATI variation | |||
| Increase | 2 (10.0) | 1 (10.0) | |
| Decrease | 18 (90.0) | 9 (90.0) | 1.000 |
| TATI variation | |||
| Increase | 0 (0.0) | 1 (10.0) | 0.150 |
| Decrease | 20 (100.0) | 9 (90.0) |
| Variables | N. pts | N. Events | Median PFS (95%CI) | p-Value | |
|---|---|---|---|---|---|
| Total | 30 | 23 | 8.9 (3.4–13.7) | - | |
| Age at treatment | <55 years | 14 | 12 | 7.1 (2.7–13.5) | 0.695 |
| ≥55 years | 16 | 11 | 9.2 (3.2–17.3) | ||
| Gender | Male | 15 | 11 | 9.1 (3.2–13.7) | 0.875 |
| Female | 15 | 12 | 8.9 (2.8–28.4) | ||
| Site of disease | Pancreas | 9 | 7 | ||
| Gastro-intestinal | 12 | 8 | |||
| Lung | 6 | 5 | |||
| Other | 2 | 2 | |||
| Previous surgery | No | 11 | 8 | 8.9 (2.8–41.69 | 0.262 |
| Yes | 19 | 15 | 6.6 (3.1–14.2) | ||
| Ki-67 | Ki67 ≤ 10 | 18 | 13 | 10.6 (2.8–14.3) | 0.251 |
| Ki67 > 10 | 10 | 8 | 7.1 (3.2–10.1) | ||
| Grading | G1 | 5 | 5 | 10.1 (3.2-NE) | 0.206 |
| G2 | 19 | 12 | 13.7 (3.2–41.6) | ||
| BMI | ≤18.49 | 8 | 7 | 3.2 (0.9–6.7) | 0.011 # |
| >18.49 and ≤24.99 | 18 | 14 | 10.1 (3.7–28.4) | ||
| >24.99 | 4 | 2 | - | ||
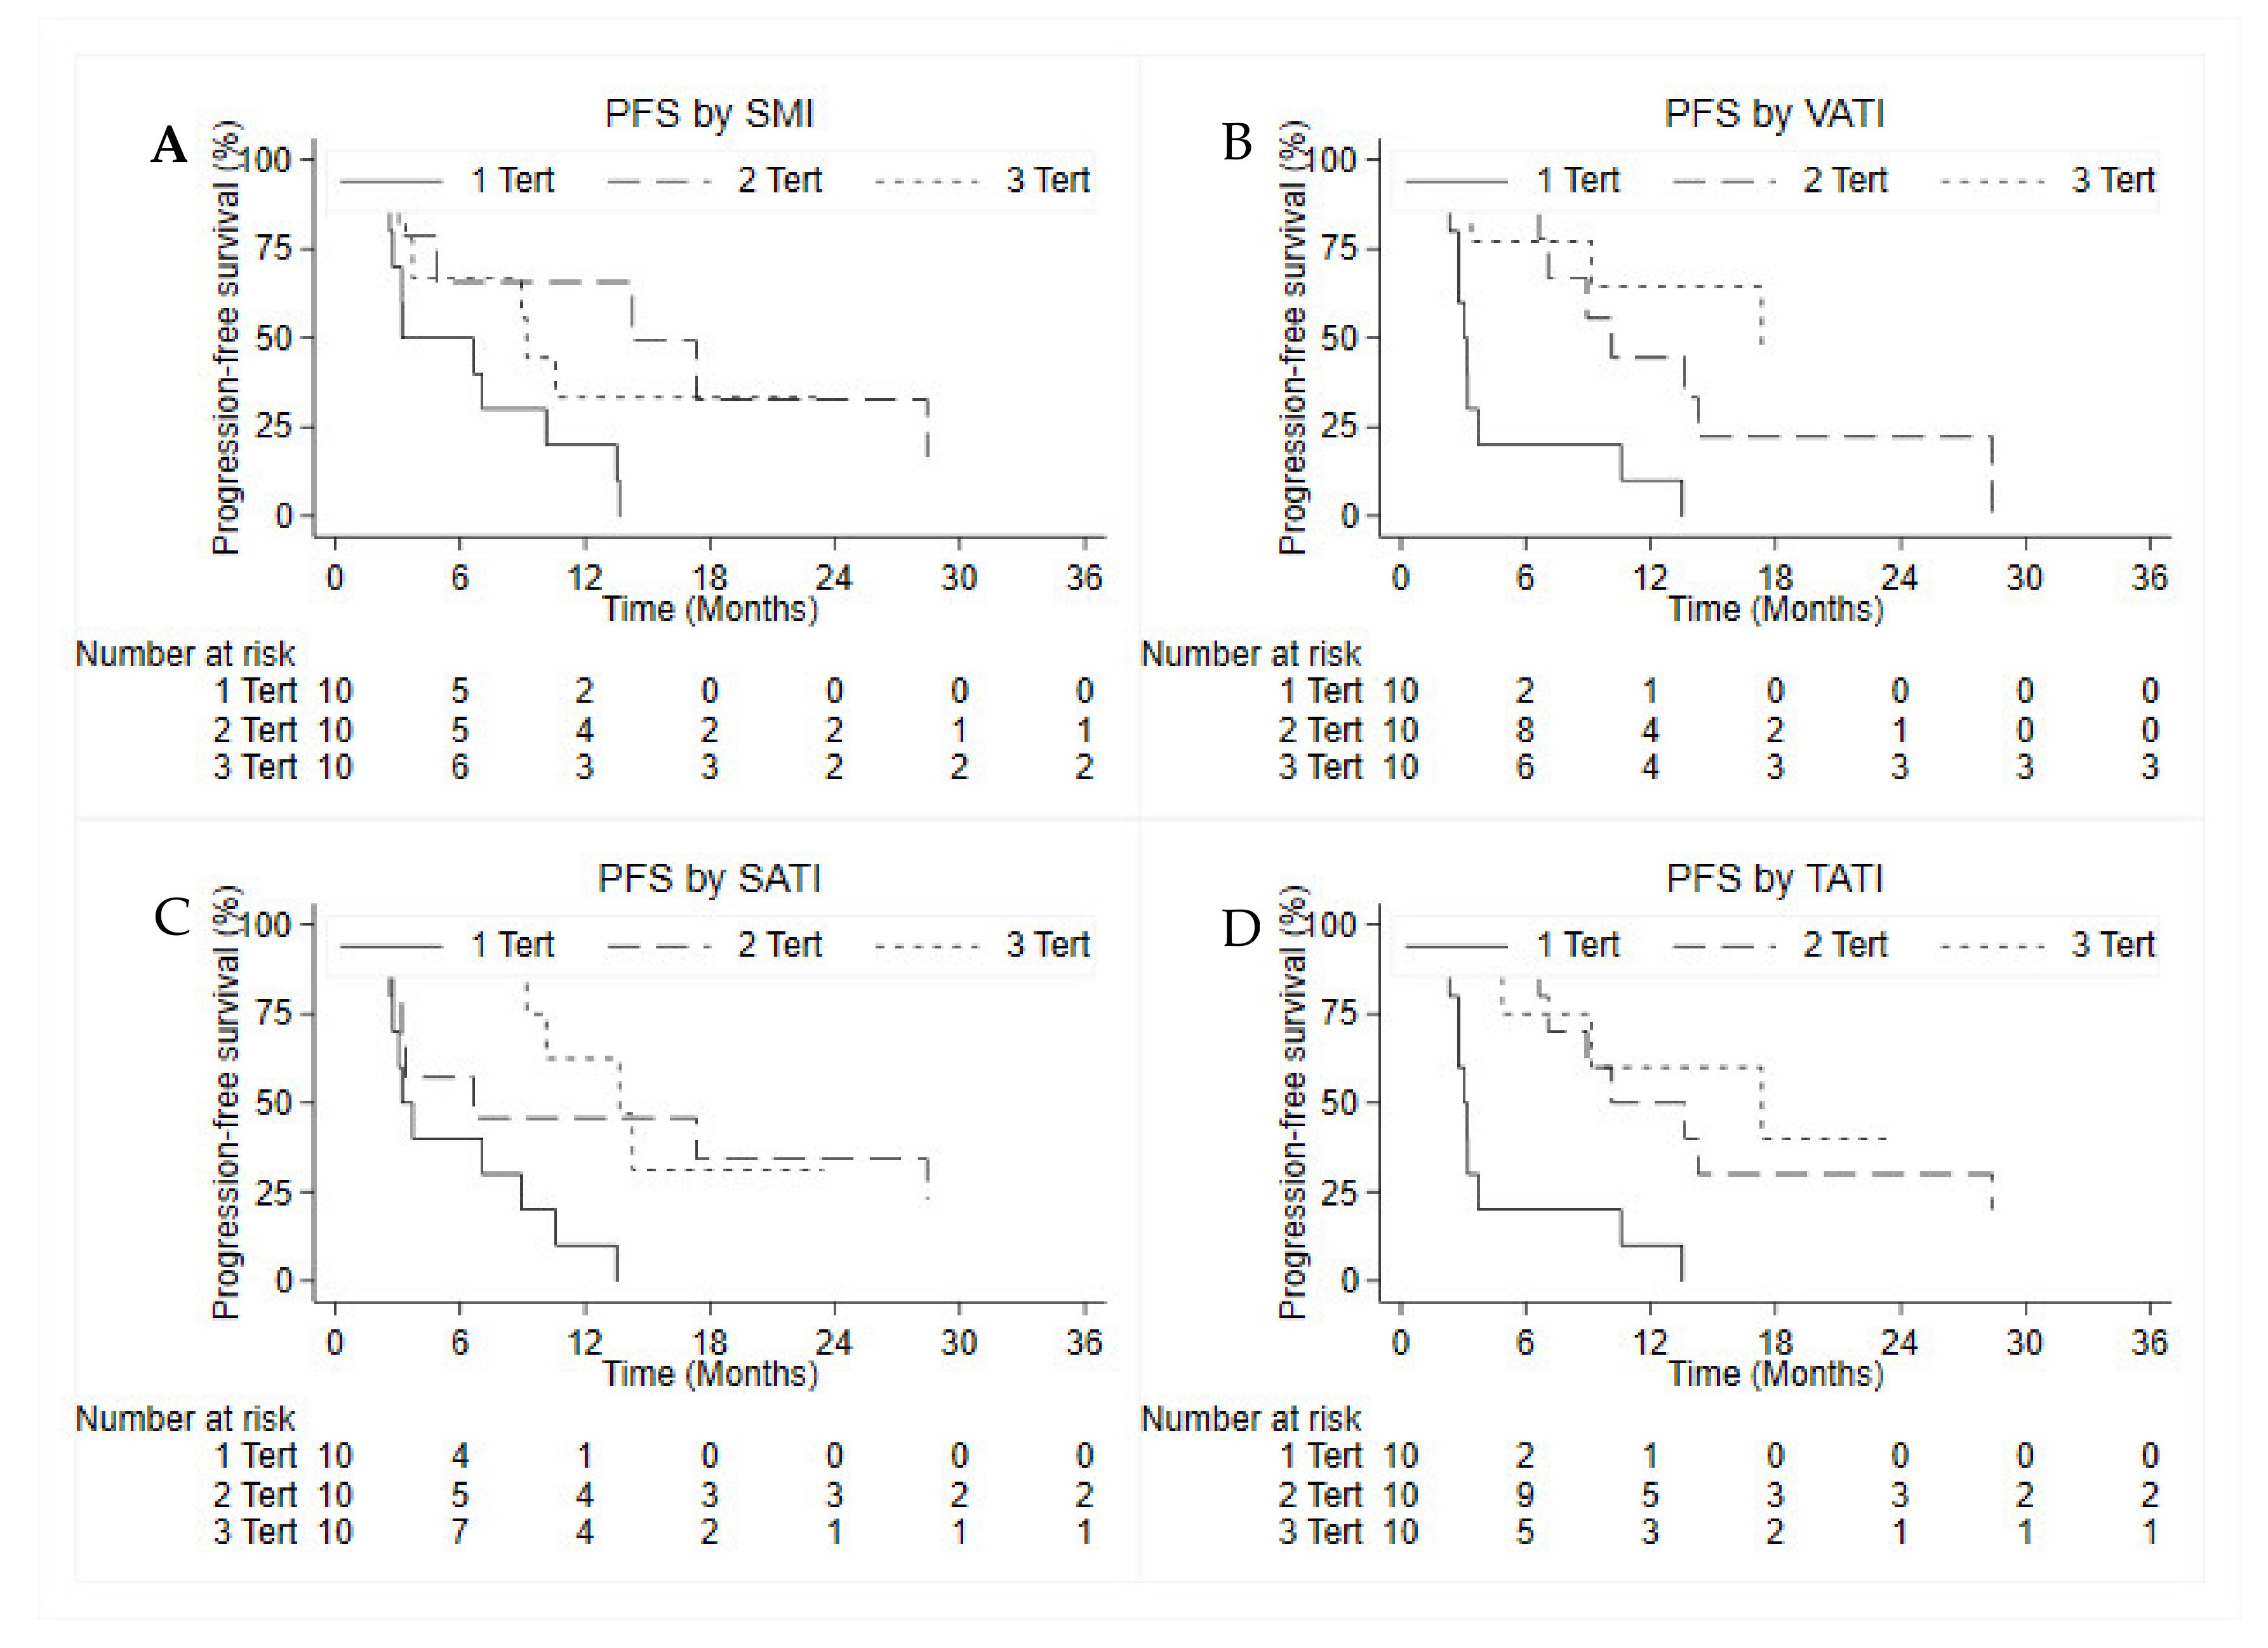
| SMI | 1 tertile | 10 | 10 | 3.2 (0.9–10.1) | 0.039 |
| 2 tertile | 10 | 6 | 14.2 (2.3-NE) | ||
| 3 tertile | 10 | 7 | 9.1 (2.7-NE) | ||
| VATI | 1 tertile | 10 | 10 | 3.1 (0.8–3.7) | <0.001 |
| 2 tertile | 10 | 8 | 10.1 (4.9-NE) | ||
| 3 tertile | 10 | 5 | 17.3 (2.6-NE) | ||
| SATI | 1 tertile | 10 | 10 | 3.2 (2.3–8.9) | 0.014 |
| 2 tertile | 10 | 7 | 6.6 (0.9-NE) | ||
| 3 tertile | 10 | 6 | 13.6 (4.8-NE) | ||
| TATI | 1 tertile | 10 | 10 | 3.1 (0.9–3.7) | <0.001 |
| 2 tertile | 10 | 8 | 10.1 (3.4–28.4) | ||
| 3 tertile | 10 | 5 | 17.3 (2.6-NE) | ||
| Toxicity | G1 | G2 | G3 | G4 |
|---|---|---|---|---|
| Mucositis | 2 (6.7) | 4 (13.3) | 5 (16.7) | 0 (0.0) |
| Pulmonary toxicity | 1 (3.3) | 5 (16.7) | 0 (0.0) | 0 (0.0) |
| Hypercreatininemia | 2 (6.7) | 1 (3.3) | 0 (0.0) | 0 (0.0) |
| Thrombocytopenia | 2 (6.7) | 4 (13.3) | 1 (3.3) | 0 (0.0) |
| Skin toxicity | 4 (13.3) | 4 (13.3) | 1 (3.3) | 0 (0.0) |
| Fatigue | 1 (3.0) | 6 (20.0) | 1 (3.3) | 0 (0.0) |
| Hyperglycemia | 5 (16.7) | 3 (10.0) | 0 (0.0) | 0 (0.0) |
| Neutropenia | 3 (10.0) | 4 (13.3) | 0 (0.0) | 0 (0.0) |
| Liver toxicity | 3 (10.0) | 1 (3.3) | 3 (10.0) | 0 (0.0) |
| Hypertriglyceridemia | 2 (6.7) | 2 (6.7) | 0 (0.0) | 0 (0.0) |
| Gastrointestinal toxicity | 4 (13.3) | 3 (10.0) | 1 (3.3) | 0 (0.0) |
| Tertiles of Body Composition | No Tox or G1–G2 | G3 | p-Value | |
|---|---|---|---|---|
| SMI | 1 tertile | 8 (40.0) | 2 (20.0) | 0.549 |
| 2 tertile | 6 (30.0) | 4 (40.0) | ||
| 3 tertile | 6 (30.0) | 4 (40.0) | ||
| VATI | 1 tertile | 8 (40.0) | 2 (20.0) | 0.549 |
| 2 tertile | 6 (30.0) | 4 (40.0) | ||
| 3 tertile | 6 (30.0) | 4 (40.0) | ||
| SATI | 1 tertile | 10 (50.0) | 0 (0.0) | 0.024 |
| 2 tertile | 5 (25.0) | 5 (50.0) | ||
| 3 tertile | 5 (25.0) | 5 (50.0) | ||
| TATI | 1 tertile | 8 (40.0) | 2 (20.0) | 0.350 |
| 2 tertile | 7 (35.0) | 3 (30.0) | ||
| 3 tertile | 5 (25.0) | 5 (50.0) | ||
Publisher’s Note: MDPI stays neutral with regard to jurisdictional claims in published maps and institutional affiliations. |
© 2022 by the authors. Licensee MDPI, Basel, Switzerland. This article is an open access article distributed under the terms and conditions of the Creative Commons Attribution (CC BY) license (https://creativecommons.org/licenses/by/4.0/).
Share and Cite
Ranallo, N.; Iamurri, A.P.; Foca, F.; Liverani, C.; De Vita, A.; Mercatali, L.; Calabrese, C.; Spadazzi, C.; Fabbri, C.; Cavaliere, D.; et al. Prognostic and Predictive Role of Body Composition in Metastatic Neuroendocrine Tumor Patients Treated with Everolimus: A Real-World Data Analysis. Cancers 2022, 14, 3231. https://doi.org/10.3390/cancers14133231
Ranallo N, Iamurri AP, Foca F, Liverani C, De Vita A, Mercatali L, Calabrese C, Spadazzi C, Fabbri C, Cavaliere D, et al. Prognostic and Predictive Role of Body Composition in Metastatic Neuroendocrine Tumor Patients Treated with Everolimus: A Real-World Data Analysis. Cancers. 2022; 14(13):3231. https://doi.org/10.3390/cancers14133231
Chicago/Turabian StyleRanallo, Nicoletta, Andrea Prochoswski Iamurri, Flavia Foca, Chiara Liverani, Alessandro De Vita, Laura Mercatali, Chiara Calabrese, Chiara Spadazzi, Carlo Fabbri, Davide Cavaliere, and et al. 2022. "Prognostic and Predictive Role of Body Composition in Metastatic Neuroendocrine Tumor Patients Treated with Everolimus: A Real-World Data Analysis" Cancers 14, no. 13: 3231. https://doi.org/10.3390/cancers14133231