
Mitochondrial Dysfunction and the Glycolytic Switch Induced by Caveolin-1 Phosphorylation Promote Cancer Cell Migration, Invasion, and Metastasis

 , and
, and
Abstract
:Simple Summary
Abstract
1. Introduction
2. Materials and Methods
2.1. Materials
2.2. Cell Culture
2.3. Oxygen Consumption
2.4. Glycolytic Capacity
2.5. Mitochondrial Respiratory Activity
2.6. ROS Determination by Flow Cytometry
2.7. Migration and Invasion Assays
2.8. Lactate Production
2.9. Western Blotting
2.10. PTP1B Activity
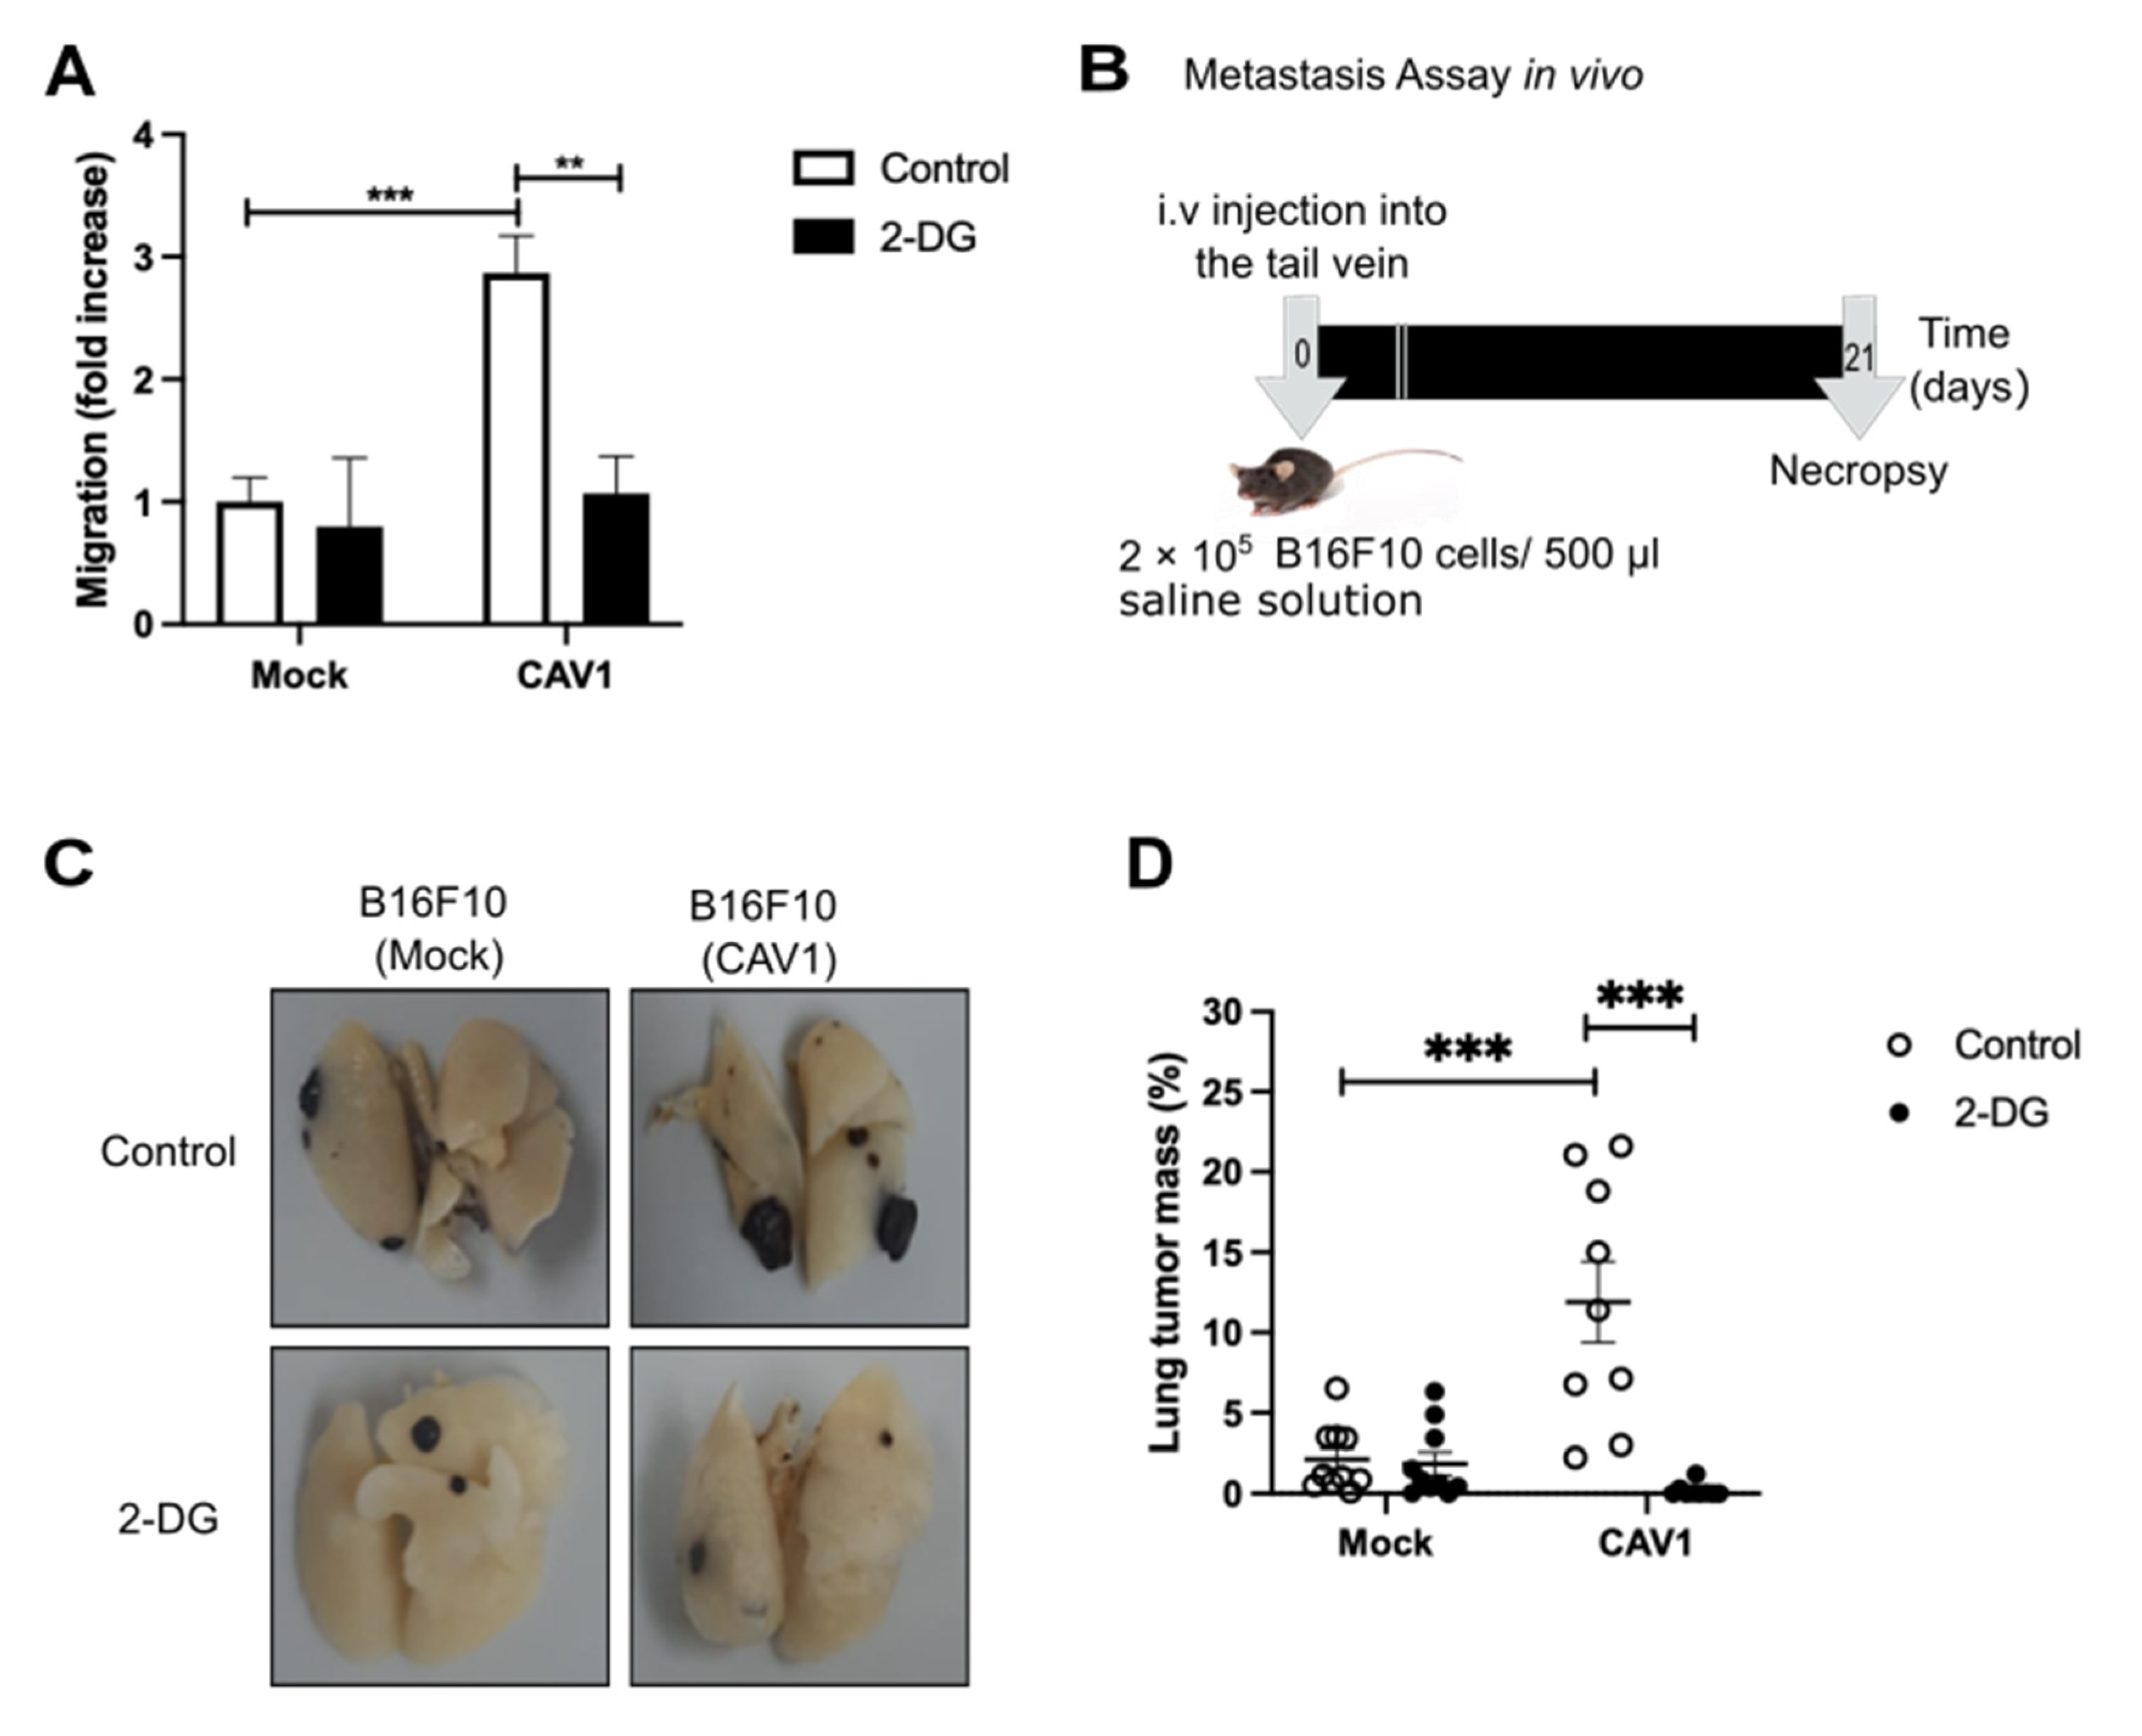
2.11. In Vivo Experimental Metastasis Assay
2.12. Statistical Analysis
3. Results
3.1. Caveolin-1 Expression Decreases Oxygen Consumption and Increases the Glycolysis Rate in Metastatic Cancer Cell Lines
3.2. Caveolin-1 Expression Diminishes Oxygen Consumption by Blocking the Mitochondrial Complex IV in B16F10 Cells
3.3. Caveolin-1 Expression Increased Cell Migration and Invasion in a Manner Dependent on ROS Production
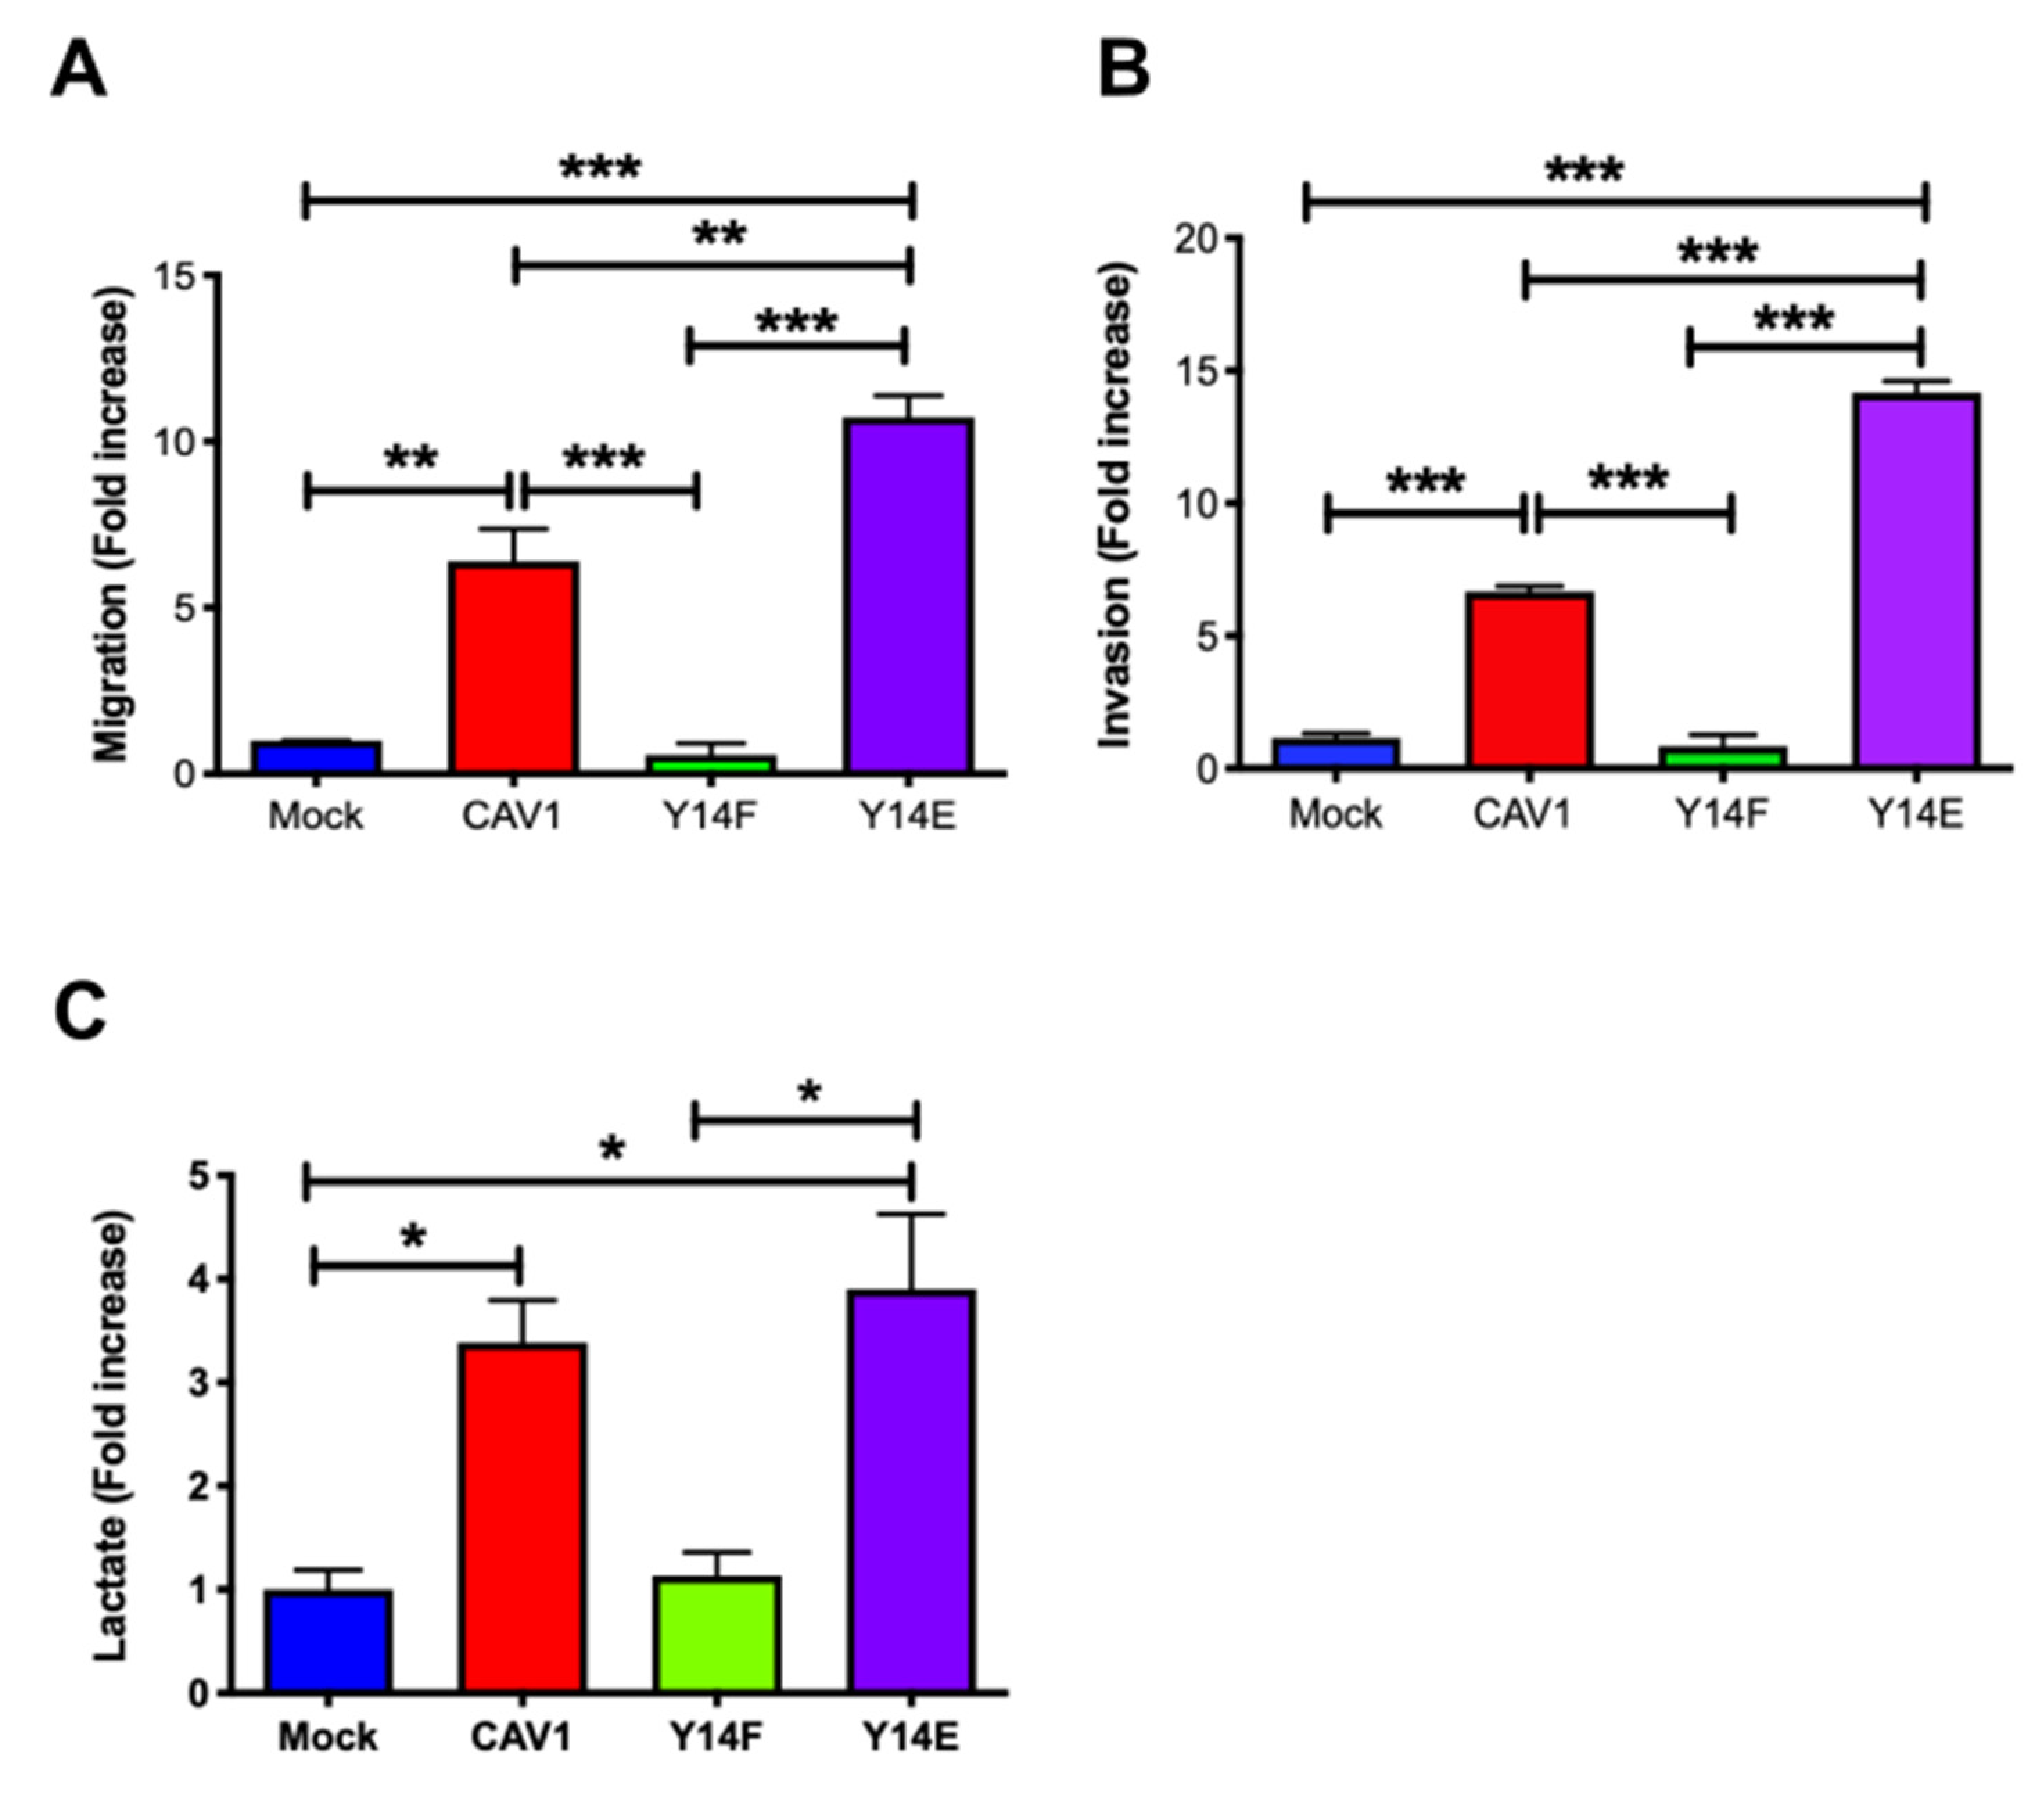
3.4. Phosphorylation on Tyrosine 14 Is Necessary for Maintenance of the Metabolic Phenotype Induced by the Expression of Caveolin-1
3.5. Caveolin-1-Increased Lactate Release Is Inhibited by the Treatment of Metastatic Cancer Cells with Antioxidants
3.6. Inhibition of PTP1B Activity Enhances Cell Migration, Invasion, and Lactate Production by Increasing CAV1 Phosphorylation
3.7. Caveolin-1 Induced Metastasis in a Glycolytic Switch-Dependent Manner
4. Discussion
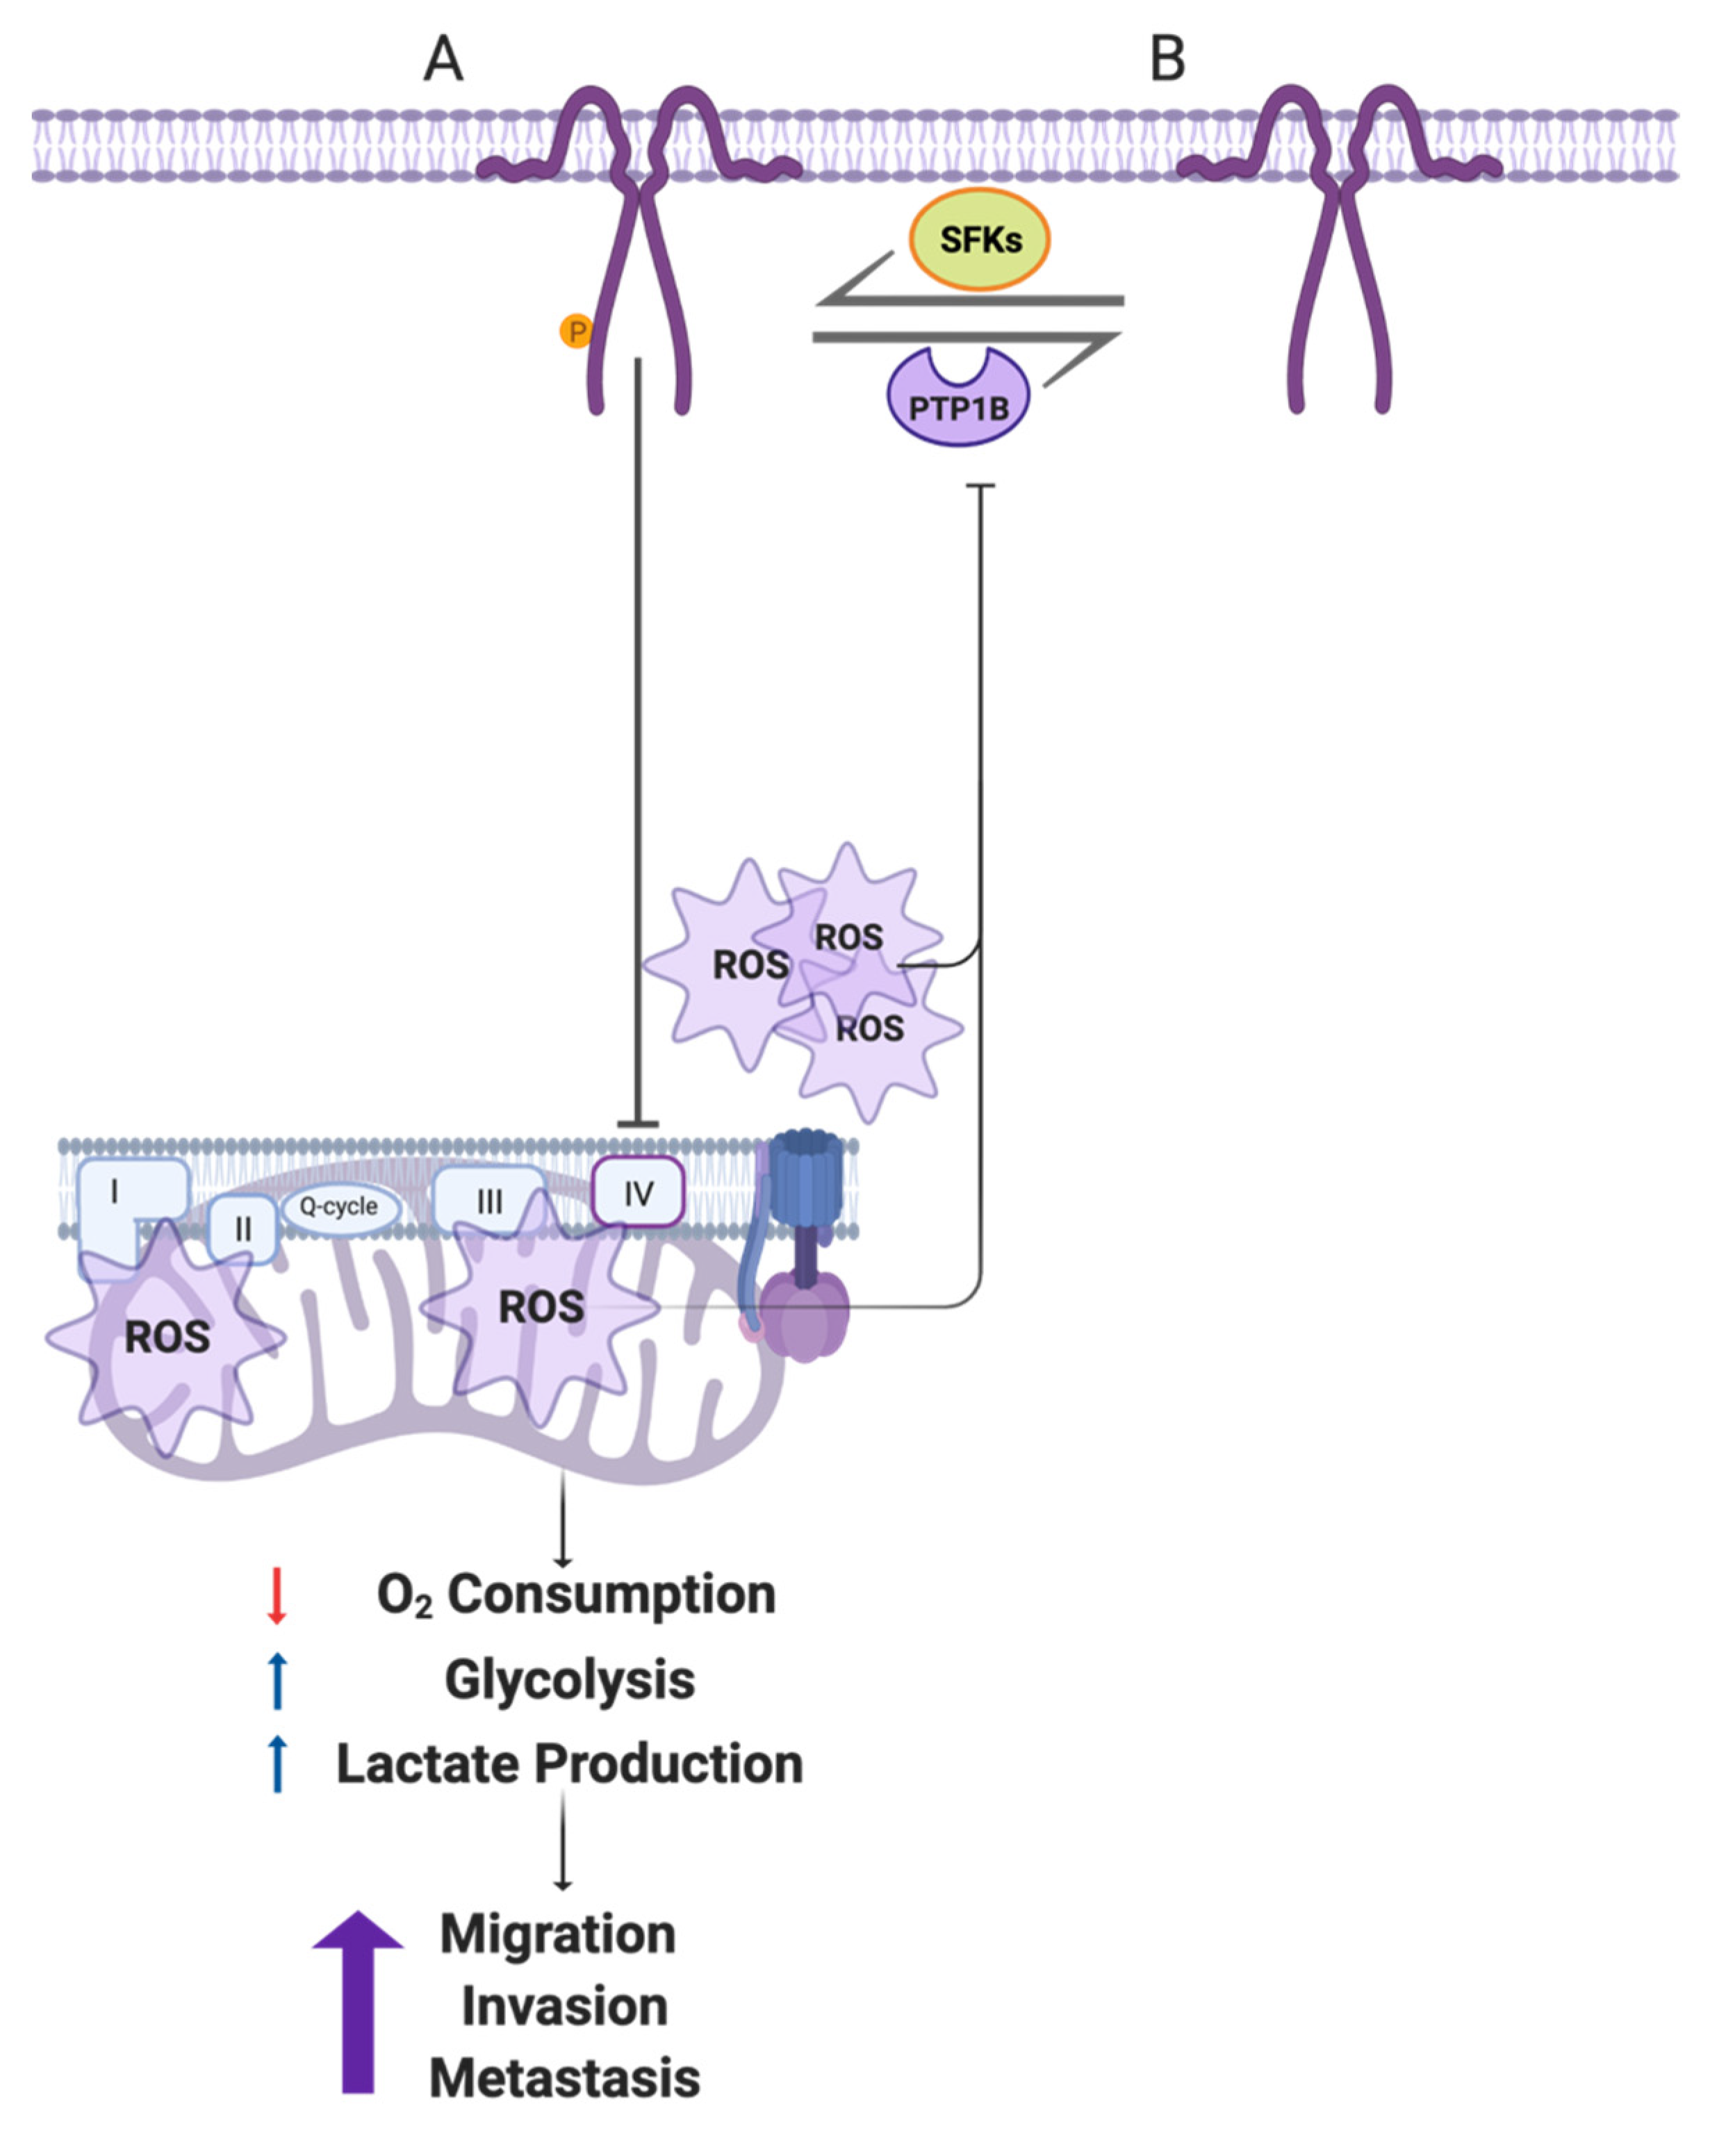
5. Conclusions
Supplementary Materials
Author Contributions
Funding
Institutional Review Board Statement
Informed Consent Statement
Data Availability Statement
Conflicts of Interest
References
- Hanahan, D.; Weinberg, R.A. Hallmarks of cancer: The next generation. Cell 2011, 144, 646–674. [Google Scholar] [CrossRef] [PubMed] [Green Version]
- Baenke, F.; Peck, B.; Miess, H.; Schulze, A. Hooked on fat: The role of lipid synthesis in cancer metabolism and tumour development. Dis. Model. Mech. 2013, 6, 1353–1363. [Google Scholar] [CrossRef] [PubMed] [Green Version]
- Warburg, O. On respiratory impairment in cancer cells. Science 1956, 124, 269–270. [Google Scholar] [CrossRef] [PubMed]
- Warburg, O. On the origin of cancer cells. Science 1956, 123, 309–314. [Google Scholar] [CrossRef]
- DeBerardinis, R.J.; Lum, J.J.; Hatzivassiliou, G.; Thompson, C.B. The biology of cancer: Metabolic reprogramming fuels cell growth and proliferation. Cell Metab. 2008, 7, 11–20. [Google Scholar] [CrossRef] [Green Version]
- Jones, R.G.; Thompson, C.B. Tumor suppressors and cell metabolism: A recipe for cancer growth. Genes Dev. 2009, 23, 537–548. [Google Scholar] [CrossRef] [Green Version]
- Han, T.; Kang, D.; Ji, D.; Wang, X.; Zhan, W.; Fu, M.; Xin, H.B.; Wang, J.B. How does cancer cell metabolism affect tumor migration and invasion? Cell Adh. Migr. 2013, 7, 395–403. [Google Scholar] [CrossRef] [Green Version]
- Gatenby, R.A.; Gawlinski, E.T. The glycolytic phenotype in carcinogenesis and tumor invasion: Insights through mathematical models. Cancer Res. 2003, 63, 3847–3854. [Google Scholar]
- Williams, T.M.; Lisanti, M.P. The Caveolin genes: From cell biology to medicine. Ann. Med. 2004, 36, 584–595. [Google Scholar] [CrossRef]
- Lardner, A. The effects of extracellular pH on immune function. J. Leukoc. Biol. 2001, 69, 522–530. [Google Scholar]
- Chen, D.; Che, G. Value of caveolin-1 in cancer progression and prognosis: Emphasis on cancer-associated fibroblasts, human cancer cells and mechanism of caveolin-1 expression (Review). Oncol. Lett. 2014, 8, 1409–1421. [Google Scholar] [CrossRef] [PubMed] [Green Version]
- Jiang, E.; Xu, Z.; Wang, M.; Yan, T.; Huang, C.; Zhou, X.; Liu, Q.; Wang, L.; Chen, Y.; Wang, H.; et al. Tumoral microvesicle-activated glycometabolic reprogramming in fibroblasts promotes the progression of oral squamous cell carcinoma. FASEB J. 2019, 33, 5690–5703. [Google Scholar] [CrossRef] [PubMed]
- Martinez-Outschoorn, U.; Sotgia, F.; Lisanti, M.P. Tumor microenvironment and metabolic synergy in breast cancers: Critical importance of mitochondrial fuels and function. Semin. Oncol. 2014, 41, 195–216. [Google Scholar] [CrossRef] [PubMed]
- Pavlides, S.; Tsirigos, A.; Vera, I.; Flomenberg, N.; Frank, P.G.; Casimiro, M.C.; Wang, C.; Fortina, P.; Addya, S.; Pestell, R.G.; et al. Loss of stromal caveolin-1 leads to oxidative stress, mimics hypoxia and drives inflammation in the tumor microenvironment, conferring the “reverse Warburg effect”: A transcriptional informatics analysis with validation. Cell Cycle 2010, 9, 2201–2219. [Google Scholar] [CrossRef] [Green Version]
- Ha, T.K.; Her, N.G.; Lee, M.G.; Ryu, B.K.; Lee, J.H.; Han, J.; Jeong, S.I.; Kang, M.J.; Kim, N.H.; Kim, H.J.; et al. Caveolin-1 increases aerobic glycolysis in colorectal cancers by stimulating HMGA1-mediated GLUT3 transcription. Cancer Res. 2012, 72, 4097–4109. [Google Scholar] [CrossRef] [Green Version]
- Tahir, S.A.; Yang, G.; Goltsov, A.; Song, K.D.; Ren, C.; Wang, J.; Chang, W.; Thompson, T.C. Caveolin-1-LRP6 signaling module stimulates aerobic glycolysis in prostate cancer. Cancer Res. 2013, 73, 1900–1911. [Google Scholar] [CrossRef] [Green Version]
- Li, S.; Seitz, R.; Lisanti, M.P. Phosphorylation of caveolin by src tyrosine kinases. The alpha-isoform of caveolin is selectively phosphorylated by v-Src in vivo. J. Biol. Chem. 1996, 271, 3863–3868. [Google Scholar] [CrossRef] [Green Version]
- Cao, H.; Courchesne, W.E.; Mastick, C.C. A phosphotyrosine-dependent protein interaction screen reveals a role for phosphorylation of caveolin-1 on tyrosine 14: Recruitment of C-terminal Src kinase. J. Biol. Chem. 2002, 277, 8771–8774. [Google Scholar] [CrossRef] [Green Version]
- Cao, H.; Sanguinetti, A.R.; Mastick, C.C. Oxidative stress activates both Src-kinases and their negative regulator Csk and induces phosphorylation of two targeting proteins for Csk: Caveolin-1 and paxillin. Exp. Cell Res. 2004, 294, 159–171. [Google Scholar] [CrossRef]
- Volonte, D.; Galbiati, F.; Pestell, R.G.; Lisanti, M.P. Cellular stress induces the tyrosine phosphorylation of caveolin-1 (Tyr(14)) via activation of p38 mitogen-activated protein kinase and c-Src kinase. Evidence for caveolae, the actin cytoskeleton, and focal adhesions as mechanical sensors of osmotic stress. J. Biol. Chem. 2001, 276, 8094–8103. [Google Scholar] [CrossRef] [Green Version]
- Mastick, C.C.; Brady, M.J.; Saltiel, A.R. Insulin stimulates the tyrosine phosphorylation of caveolin. J. Cell Biol. 1995, 129, 1523–1531. [Google Scholar] [CrossRef] [PubMed]
- Mastick, C.C.; Saltiel, A.R. Insulin-stimulated tyrosine phosphorylation of caveolin is specific for the differentiated adipocyte phenotype in 3T3-L1 cells. J. Biol. Chem. 1997, 272, 20706–20714. [Google Scholar] [CrossRef] [PubMed] [Green Version]
- Kimura, A.; Mora, S.; Shigematsu, S.; Pessin, J.E.; Saltiel, A.R. The insulin receptor catalyzes the tyrosine phosphorylation of caveolin-1. J. Biol. Chem. 2002, 277, 30153–30158. [Google Scholar] [CrossRef] [PubMed] [Green Version]
- Rizzo, V.; Morton, C.; DePaola, N.; Schnitzer, J.E.; Davies, P.F. Recruitment of endothelial caveolae into mechanotransduction pathways by flow conditioning in vitro. Am. J. Physiol. Heart Circ. Physiol. 2003, 285, H1720–H1729. [Google Scholar] [CrossRef] [Green Version]
- Jo, A.; Park, H.; Lee, S.H.; Ahn, S.H.; Kim, H.J.; Park, E.M.; Choi, Y.H. SHP-2 binds to caveolin-1 and regulates Src activity via competitive inhibition of CSK in response to H2O2 in astrocytes. PLoS ONE 2014, 9, e91582. [Google Scholar] [CrossRef] [PubMed] [Green Version]
- Wong, T.H.; Dickson, F.H.; Timmins, L.R.; Nabi, I.R. Tyrosine phosphorylation of tumor cell caveolin-1: Impact on cancer progression. Cancer Metastasis Rev. 2020, 39, 455–469. [Google Scholar] [CrossRef]
- Parat, M.O.; Anand-Apte, B.; Fox, P.L. Differential caveolin-1 polarization in endothelial cells during migration in two and three dimensions. Mol. Biol. Cell 2003, 14, 3156–3168. [Google Scholar] [CrossRef]
- Del Pozo, M.A.; Balasubramanian, N.; Alderson, N.B.; Kiosses, W.B.; Grande-Garcia, A.; Anderson, R.G.; Schwartz, M.A. Phospho-caveolin-1 mediates integrin-regulated membrane domain internalization. Nat. Cell Biol. 2005, 7, 901–908. [Google Scholar] [CrossRef] [Green Version]
- Grande-Garcia, A.; Echarri, A.; de Rooij, J.; Alderson, N.B.; Waterman-Storer, C.M.; Valdivielso, J.M.; del Pozo, M.A. Caveolin-1 regulates cell polarization and directional migration through Src kinase and Rho GTPases. J. Cell Biol. 2007, 177, 683–694. [Google Scholar] [CrossRef] [Green Version]
- Goetz, J.G.; Joshi, B.; Lajoie, P.; Strugnell, S.S.; Scudamore, T.; Kojic, L.D.; Nabi, I.R. Concerted regulation of focal adhesion dynamics by galectin-3 and tyrosine-phosphorylated caveolin-1. J. Cell Biol. 2008, 180, 1261–1275. [Google Scholar] [CrossRef] [Green Version]
- Urra, H.; Torres, V.A.; Ortiz, R.J.; Lobos, L.; Diaz, M.I.; Diaz, N.; Hartel, S.; Leyton, L.; Quest, A.F. Caveolin-1-enhanced motility and focal adhesion turnover require tyrosine-14 but not accumulation to the rear in metastatic cancer cells. PLoS ONE 2012, 7, e33085. [Google Scholar] [CrossRef] [PubMed] [Green Version]
- Diaz-Valdivia, N.I.; Diaz, J.; Contreras, P.; Campos, A.; Rojas-Celis, V.; Burgos-Ravanal, R.A.; Lobos-Gonzalez, L.; Torres, V.A.; Perez, V.I.; Frei, B.; et al. The non-receptor tyrosine phosphatase type 14 blocks caveolin-1-enhanced cancer cell metastasis. Oncogene 2020, 39, 3693–3709. [Google Scholar] [CrossRef] [PubMed] [Green Version]
- Lee, H.; Xie, L.; Luo, Y.; Lee, S.Y.; Lawrence, D.S.; Wang, X.B.; Sotgia, F.; Lisanti, M.P.; Zhang, Z.Y. Identification of phosphocaveolin-1 as a novel protein tyrosine phosphatase 1B substrate. Biochemistry 2006, 45, 234–240. [Google Scholar] [CrossRef] [PubMed]
- Martinez-Meza, S.; Diaz, J.; Sandoval-Borquez, A.; Valenzuela-Valderrama, M.; Diaz-Valdivia, N.; Rojas-Celis, V.; Contreras, P.; Huilcaman, R.; Ocaranza, M.P.; Chiong, M.; et al. AT2 Receptor Mediated Activation of the Tyrosine Phosphatase PTP1B Blocks Caveolin-1 Enhanced Migration, Invasion and Metastasis of Cancer Cells. Cancers 2019, 11, 1299. [Google Scholar] [CrossRef] [Green Version]
- Bender, F.C.; Reymond, M.A.; Bron, C.; Quest, A.F. Caveolin-1 levels are down-regulated in human colon tumors, and ectopic expression of caveolin-1 in colon carcinoma cell lines reduces cell tumorigenicity. Cancer Res. 2000, 60, 5870–5878. [Google Scholar]
- Torres, V.A.; Tapia, J.C.; Rodriguez, D.A.; Lladser, A.; Arredondo, C.; Leyton, L.; Quest, A.F. E-cadherin is required for caveolin-1-mediated down-regulation of the inhibitor of apoptosis protein survivin via reduced beta-catenin-Tcf/Lef-dependent transcription. Mol. Cell Biol. 2007, 27, 7703–7717. [Google Scholar] [CrossRef] [Green Version]
- Diaz, J.; Mendoza, P.; Ortiz, R.; Diaz, N.; Leyton, L.; Stupack, D.; Quest, A.F.; Torres, V.A. Rab5 is required in metastatic cancer cells for Caveolin-1-enhanced Rac1 activation, migration and invasion. J. Cell Sci. 2014, 127, 2401–2406. [Google Scholar] [CrossRef] [Green Version]
- Lobos-Gonzalez, L.; Aguilar, L.; Diaz, J.; Diaz, N.; Urra, H.; Torres, V.A.; Silva, V.; Fitzpatrick, C.; Lladser, A.; Hoek, K.S.; et al. E-cadherin determines Caveolin-1 tumor suppression or metastasis enhancing function in melanoma cells. Pigment. Cell Melanoma Res. 2013, 26, 555–570. [Google Scholar] [CrossRef] [Green Version]
- Diaz-Valdivia, N.I.; Calderon, C.C.; Diaz, J.E.; Lobos-Gonzalez, L.; Sepulveda, H.; Ortiz, R.J.; Martinez, S.; Silva, V.; Maldonado, H.J.; Silva, P.; et al. Anti-neoplastic drugs increase caveolin-1-dependent migration, invasion and metastasis of cancer cells. Oncotarget 2017, 8, 111943–111965. [Google Scholar] [CrossRef] [Green Version]
- Vander Heiden, M.G.; Cantley, L.C.; Thompson, C.B. Understanding the Warburg effect: The metabolic requirements of cell proliferation. Science 2009, 324, 1029–1033. [Google Scholar] [CrossRef] [Green Version]
- Ortiz, R.; Diaz, J.; Diaz, N.; Lobos-Gonzalez, L.; Cardenas, A.; Contreras, P.; Diaz, M.I.; Otte, E.; Cooper-White, J.; Torres, V.; et al. Extracellular matrix-specific Caveolin-1 phosphorylation on tyrosine 14 is linked to augmented melanoma metastasis but not tumorigenesis. Oncotarget 2016, 7, 40571–40593. [Google Scholar] [CrossRef] [PubMed] [Green Version]
- Simon, L.; Campos, A.; Leyton, L.; Quest, A.F.G. Caveolin-1 function at the plasma membrane and in intracellular compartments in cancer. Cancer Metastasis Rev. 2020, 39, 435–453. [Google Scholar] [CrossRef] [PubMed]
- Liang, W.; Hao, Z.; Han, J.L.; Zhu, D.J.; Jin, Z.F.; Xie, W.L. CAV-1 contributes to bladder cancer progression by inducing epithelial-to-mesenchymal transition. Urol. Oncol. 2014, 32, 855–863. [Google Scholar] [CrossRef] [PubMed]
- Yu, H.; Shen, H.; Zhang, Y.; Zhong, F.; Liu, Y.; Qin, L.; Yang, P. CAV1 promotes HCC cell progression and metastasis through Wnt/beta-catenin pathway. PLoS ONE 2014, 9, e106451. [Google Scholar] [CrossRef] [Green Version]
- Roca, H.; Hernandez, J.; Weidner, S.; McEachin, R.C.; Fuller, D.; Sud, S.; Schumann, T.; Wilkinson, J.E.; Zaslavsky, A.; Li, H.; et al. Transcription factors OVOL1 and OVOL2 induce the mesenchymal to epithelial transition in human cancer. PLoS ONE 2013, 8, e76773. [Google Scholar] [CrossRef] [PubMed]
- Shiraishi, T.; Verdone, J.E.; Huang, J.; Kahlert, U.D.; Hernandez, J.R.; Torga, G.; Zarif, J.C.; Epstein, T.; Gatenby, R.; McCartney, A.; et al. Glycolysis is the primary bioenergetic pathway for cell motility and cytoskeletal remodeling in human prostate and breast cancer cells. Oncotarget 2015, 6, 130–143. [Google Scholar] [CrossRef] [Green Version]
- Joshi, B.; Pawling, J.; Shankar, J.; Pacholczyk, K.; Kim, Y.; Tran, W.; Meng, F.; Rahman, A.M.A.; Foster, L.J.; Leong, H.S.; et al. Caveolin-1 Y14 phosphorylation suppresses tumor growth while promoting invasion. Oncotarget 2019, 10, 6668–6677. [Google Scholar] [CrossRef] [Green Version]
- Li, W.P.; Liu, P.; Pilcher, B.K.; Anderson, R.G. Cell-specific targeting of caveolin-1 to caveolae, secretory vesicles, cytoplasm or mitochondria. J. Cell Sci. 2001, 114, 1397–1408. [Google Scholar] [CrossRef]
- Bravo-Sagua, R.; Parra, V.; Ortiz-Sandoval, C.; Navarro-Marquez, M.; Rodriguez, A.E.; Diaz-Valdivia, N.; Sanhueza, C.; Lopez-Crisosto, C.; Tahbaz, N.; Rothermel, B.A.; et al. Caveolin-1 impairs PKA-DRP1-mediated remodelling of ER-mitochondria communication during the early phase of ER stress. Cell Death Differ. 2019, 26, 1195–1212. [Google Scholar] [CrossRef] [Green Version]
- Sala-Vila, A.; Navarro-Lerida, I.; Sanchez-Alvarez, M.; Bosch, M.; Calvo, C.; Lopez, J.A.; Calvo, E.; Ferguson, C.; Giacomello, M.; Serafini, A.; et al. Interplay between hepatic mitochondria-associated membranes, lipid metabolism and caveolin-1 in mice. Sci. Rep. 2016, 6, 27351. [Google Scholar] [CrossRef] [Green Version]
- Yu, D.M.; Jung, S.H.; An, H.T.; Lee, S.; Hong, J.; Park, J.S.; Lee, H.; Lee, H.; Bahn, M.S.; Lee, H.C.; et al. Caveolin-1 deficiency induces premature senescence with mitochondrial dysfunction. Aging Cell 2017, 16, 773–784. [Google Scholar] [CrossRef] [PubMed]
- Fridolfsson, H.N.; Kawaraguchi, Y.; Ali, S.S.; Panneerselvam, M.; Niesman, I.R.; Finley, J.C.; Kellerhals, S.E.; Migita, M.Y.; Okada, H.; Moreno, A.L.; et al. Mitochondria-localized caveolin in adaptation to cellular stress and injury. FASEB J. 2012, 26, 4637–4649. [Google Scholar] [CrossRef] [PubMed] [Green Version]
- Jiang, Y.; Krantz, S.; Qin, X.; Li, S.; Gunasekara, H.; Kim, Y.M.; Zimnicka, A.; Bae, M.; Ma, K.; Toth, P.T.; et al. Caveolin-1 controls mitochondrial damage and ROS production by regulating fission-fusion dynamics and mitophagy. Redox. Biol. 2022, 52, 102304. [Google Scholar] [CrossRef] [PubMed]
- Schell, J.C.; Olson, K.A.; Jiang, L.; Hawkins, A.J.; Van Vranken, J.G.; Xie, J.; Egnatchik, R.A.; Earl, E.G.; DeBerardinis, R.J.; Rutter, J. A role for the mitochondrial pyruvate carrier as a repressor of the Warburg effect and colon cancer cell growth. Mol. Cell 2014, 56, 400–413. [Google Scholar] [CrossRef] [PubMed] [Green Version]
- Jiang, S.; Wang, Y.; Luo, L.; Shi, F.; Zou, J.; Lin, H.; Ying, Y.; Luo, Y.; Zhan, Z.; Liu, P.; et al. AMP-activated protein kinase regulates cancer cell growth and metabolism via nuclear and mitochondria events. J. Cell Mol. Med. 2019, 23, 3951–3961. [Google Scholar] [CrossRef] [PubMed] [Green Version]
- Schworer, S.; Vardhana, S.A.; Thompson, C.B. Cancer Metabolism Drives a Stromal Regenerative Response. Cell Metab. 2019, 29, 576–591. [Google Scholar] [CrossRef] [Green Version]
- Rattigan, Y.I.; Patel, B.B.; Ackerstaff, E.; Sukenick, G.; Koutcher, J.A.; Glod, J.W.; Banerjee, D. Lactate is a mediator of metabolic cooperation between stromal carcinoma associated fibroblasts and glycolytic tumor cells in the tumor microenvironment. Exp. Cell Res. 2012, 318, 326–335. [Google Scholar] [CrossRef] [Green Version]
- Patel, B.B.; Ackerstaff, E.; Serganova, I.S.; Kerrigan, J.E.; Blasberg, R.G.; Koutcher, J.A.; Banerjee, D. Tumor stroma interaction is mediated by monocarboxylate metabolism. Exp. Cell Res. 2017, 352, 20–33. [Google Scholar] [CrossRef] [Green Version]
- Brand, A.; Singer, K.; Koehl, G.E.; Kolitzus, M.; Schoenhammer, G.; Thiel, A.; Matos, C.; Bruss, C.; Klobuch, S.; Peter, K.; et al. LDHA-Associated Lactic Acid Production Blunts Tumor Immunosurveillance by T and NK Cells. Cell Metab. 2016, 24, 657–671. [Google Scholar] [CrossRef] [Green Version]
- Colegio, O.R.; Chu, N.Q.; Szabo, A.L.; Chu, T.; Rhebergen, A.M.; Jairam, V.; Cyrus, N.; Brokowski, C.E.; Eisenbarth, S.C.; Phillips, G.M.; et al. Functional polarization of tumour-associated macrophages by tumour-derived lactic acid. Nature 2014, 513, 559–563. [Google Scholar] [CrossRef]
- Constant, J.S.; Feng, J.J.; Zabel, D.D.; Yuan, H.; Suh, D.Y.; Scheuenstuhl, H.; Hunt, T.K.; Hussain, M.Z. Lactate elicits vascular endothelial growth factor from macrophages: A possible alternative to hypoxia. Wound Repair Regen. 2000, 8, 353–360. [Google Scholar] [CrossRef] [PubMed]
- Prasad, S.; Gupta, S.C.; Tyagi, A.K. Reactive oxygen species (ROS) and cancer: Role of antioxidative nutraceuticals. Cancer Lett. 2017, 387, 95–105. [Google Scholar] [CrossRef] [PubMed]
- Salsman, S.J.; Hensley, K.; Floyd, R.A. Sensitivity of protein tyrosine phosphatase activity to the redox environment, cytochrome C, and microperoxidase. Antioxid. Redox Signal. 2005, 7, 1078–1088. [Google Scholar] [CrossRef] [PubMed]
- Feng, X.; Wang, P.; Liu, Q.; Zhang, T.; Mai, B.; Wang, X. Glycolytic inhibitors 2-deoxyglucose and 3-bromopyruvate synergize with photodynamic therapy respectively to inhibit cell migration. J. Bioenerg. Biomembr. 2015, 47, 189–197. [Google Scholar] [CrossRef]
- Zhang, T.; Zhu, X.; Wu, H.; Jiang, K.; Zhao, G.; Shaukat, A.; Deng, G.; Qiu, C. Targeting the ROS/PI3K/AKT/HIF-1alpha/HK2 axis of breast cancer cells: Combined administration of Polydatin and 2-Deoxy-d-glucose. J. Cell Mol. Med. 2019, 23, 3711–3723. [Google Scholar] [CrossRef]


| Reagent | MAS 3 × Media Concentration |
|---|---|
| Mannitol | 660 mM |
| Saccharose | 210 mM |
| KH2PO4 | 30 mM |
| HEPES | 6 mM |
| EGTA | 3 mM |
| Fatty Acid Free BSA | 0.6% (m/v) |
Publisher’s Note: MDPI stays neutral with regard to jurisdictional claims in published maps and institutional affiliations. |
© 2022 by the authors. Licensee MDPI, Basel, Switzerland. This article is an open access article distributed under the terms and conditions of the Creative Commons Attribution (CC BY) license (https://creativecommons.org/licenses/by/4.0/).
Share and Cite
Díaz-Valdivia, N.; Simón, L.; Díaz, J.; Martinez-Meza, S.; Contreras, P.; Burgos-Ravanal, R.; Pérez, V.I.; Frei, B.; Leyton, L.; Quest, A.F.G. Mitochondrial Dysfunction and the Glycolytic Switch Induced by Caveolin-1 Phosphorylation Promote Cancer Cell Migration, Invasion, and Metastasis. Cancers 2022, 14, 2862. https://doi.org/10.3390/cancers14122862
Díaz-Valdivia N, Simón L, Díaz J, Martinez-Meza S, Contreras P, Burgos-Ravanal R, Pérez VI, Frei B, Leyton L, Quest AFG. Mitochondrial Dysfunction and the Glycolytic Switch Induced by Caveolin-1 Phosphorylation Promote Cancer Cell Migration, Invasion, and Metastasis. Cancers. 2022; 14(12):2862. https://doi.org/10.3390/cancers14122862
Chicago/Turabian StyleDíaz-Valdivia, Natalia, Layla Simón, Jorge Díaz, Samuel Martinez-Meza, Pamela Contreras, Renato Burgos-Ravanal, Viviana I. Pérez, Balz Frei, Lisette Leyton, and Andrew F. G. Quest. 2022. "Mitochondrial Dysfunction and the Glycolytic Switch Induced by Caveolin-1 Phosphorylation Promote Cancer Cell Migration, Invasion, and Metastasis" Cancers 14, no. 12: 2862. https://doi.org/10.3390/cancers14122862