
Delta-Radiomics Predicts Response to First-Line Oxaliplatin-Based Chemotherapy in Colorectal Cancer Patients with Liver Metastases

 ,
, 
 , , , , , , , , ,
  and
and
Abstract
:Simple Summary
Abstract
1. Introduction
2. Materials and Methods
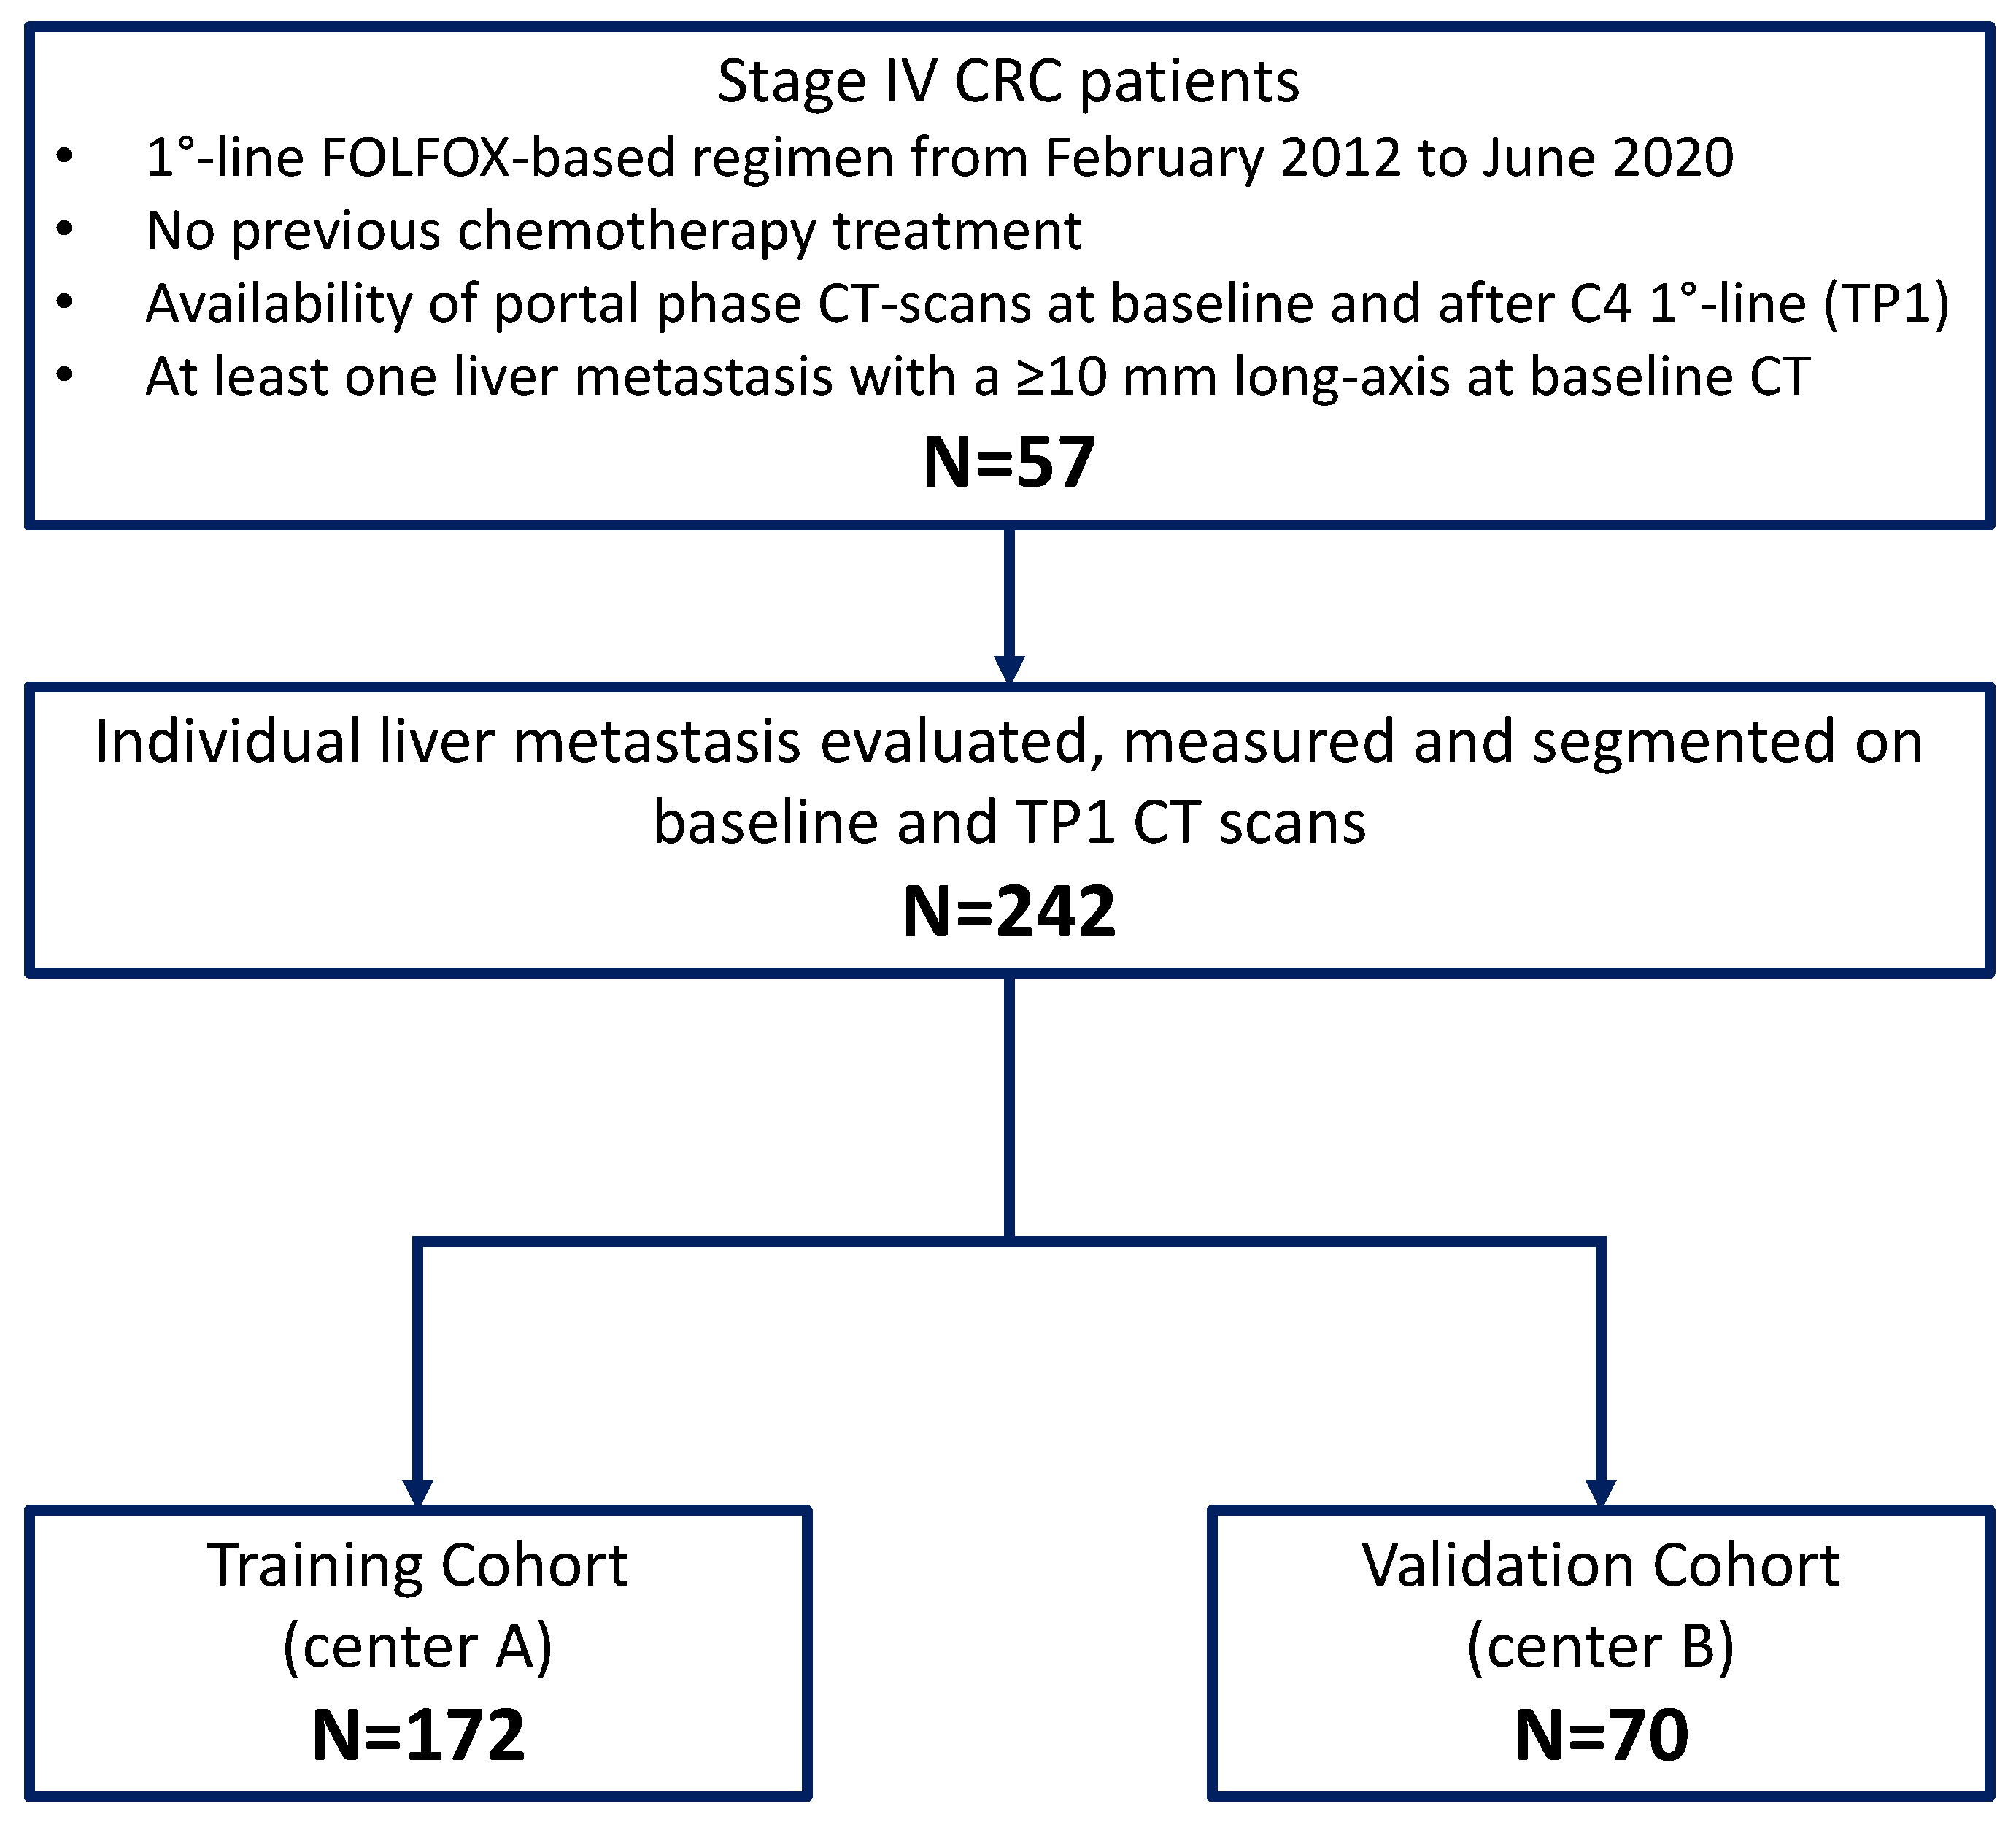
2.1. Study Design and Patients
2.2. CT Equipment and Protocols
2.3. Reference Standard
2.4. Features Extraction
2.5. Feature Selection and Radiomics Model Development
2.6. Statistical Analysis
3. Results
4. Discussion
5. Conclusions
Supplementary Materials
Author Contributions
Funding
Institutional Review Board Statement
Informed Consent Statement
Data Availability Statement
Conflicts of Interest
References
- Siegel, R.L.; Miller, K.D.; Fuchs, H.E.; Jemal, A. Cancer Statistics, 2021. CA Cancer J. Clin. 2021, 71, 7–33. [Google Scholar] [CrossRef] [PubMed]
- Müller, M.F.; Ibrahim, A.E.K.; Arends, M.J. Molecular pathological classification of colorectal cancer. Virchows Arch. 2016, 469, 125–134. [Google Scholar] [CrossRef] [Green Version]
- Adam, R.; Kitano, Y. Multidisciplinary approach of liver metastases from colorectal cancer. Ann. Gastroenterol. Surg. 2019, 3, 50–56. [Google Scholar] [CrossRef]
- Modest, D.P.; Pant, S.; Sartore-Bianchi, A. Treatment sequencing in metastatic colorectal cancer. Eur. J. Cancer 2019, 109, 70–83. [Google Scholar] [CrossRef]
- de Gramont, A.; Figer, A.; Seymour, M.; Homerin, M.; Hmissi, A.; Cassidy, J.; Boni, C.; Cortes-Funes, H.; Cervantes, A.; Freyer, G.; et al. Leucovorin and fluorouracil with or without oxaliplatin as first-line treatment in advanced colorectal cancer. J. Clin. Oncol. 2000, 18, 2938–2947. [Google Scholar] [CrossRef] [PubMed]
- Douillard, J.Y.; Siena, S.; Cassidy, J.; Tabernero, J.; Burkes, R.; Barugel, M.; Humblet, Y.; Bodoky, G.; Cunningham, D.; Jassem, J.; et al. Final results from PRIME: Randomized phase III study of panitumumab with FOLFOX4 for first-line treatment of metastatic colorectal cancer. Ann. Oncol. 2014, 25, 1346–1355. [Google Scholar] [CrossRef]
- Bokemeyer, C.; Bondarenko, I.; Makhson, A.; Hartmann, J.T.; Aparicio, J.; De Braud, F.; Donea, S.; Ludwig, H.; Schuch, G.; Stroh, C.; et al. Fluorouracil, leucovorin, and oxaliplatin with and without cetuximab in the first-line treatment of metastatic colorectal cancer. J. Clin. Oncol. 2009, 27, 663–671. [Google Scholar] [CrossRef] [Green Version]
- Tournigand, C.; André, T.; Achille, E.; Lledo, G.; Flesh, M.; Mery-Mignard, D.; Quinaux, E.; Couteau, C.; Buyse, M.; Ganem, G.; et al. FOLFIRI followed by FOLFOX6 or the reverse sequence in advanced colorectal cancer: A randomized GERCOR study. J. Clin. Oncol. 2004, 22, 229–237. [Google Scholar] [CrossRef] [Green Version]
- Zhou, J.; Li, Q.; Cao, Y. Spatiotemporal heterogeneity across metastases and organ-specific response informs drug efficacy and patient survival in colorectal cancer. Cancer Res. 2021, 81, 2522–2533. [Google Scholar] [CrossRef] [PubMed]
- Taieb, J.; Jung, A.; Sartore-Bianchi, A.; Peeters, M.; Seligmann, J.; Zaanan, A.; Burdon, P.; Montagut, C.; Laurent-Puig, P. The Evolving Biomarker Landscape for Treatment Selection in Metastatic Colorectal Cancer. Drugs 2019, 79, 1375–1394. [Google Scholar] [CrossRef] [Green Version]
- Kim, H.S.; Do, S.I.; Noh, B.J.; Jeong, Y.I.; Park, S.J.; Kim, Y.W. Expression of phosphorylated extracellular signal-regulated kinase at the invasive front of hepatic colorectal metastasis. Oncol. Lett. 2015, 9, 1261–1265. [Google Scholar] [CrossRef] [PubMed] [Green Version]
- Siravegna, G.; Lazzari, L.; Crisafulli, G.; Sartore-Bianchi, A.; Mussolin, B.; Cassingena, A.; Martino, C.; Lanman, R.B.; Nagy, R.J.; Fairclough, S.; et al. Radiologic and Genomic Evolution of Individual Metastases during HER2 Blockade in Colorectal Cancer. Cancer Cell 2018, 34, 148–162.e7. [Google Scholar] [CrossRef] [PubMed] [Green Version]
- Siravegna, G.; Mussolin, B.; Buscarino, M.; Corti, G.; Cassingena, A.; Crisafulli, G.; Ponzetti, A.; Cremolini, C.; Amatu, A.; Lauricella, C.; et al. Clonal evolution and resistance to EGFR blockade in the blood of colorectal cancer patients. Nat. Med. 2015, 21, 795–801. [Google Scholar] [CrossRef] [Green Version]
- Russo, M.; Siravegna, G.; Blaszkowsky, L.S.; Corti, G.; Crisafulli, G.; Ahronian, L.G.; Mussolin, B.; Kwak, E.L.; Buscarino, M.; Lazzari, L.; et al. Tumor heterogeneity and Lesion-Specific response to targeted therapy in colorectal cancer. Cancer Discov. 2016, 6, 147–153. [Google Scholar] [CrossRef] [Green Version]
- Sartore-Bianchi, A.; Pietrantonio, F.; Lonardi, S.; Mussolin, B.; Rua, F.; Fenocchio, E.; Amatu, A.; Corallo, S.; Manai, C.; Tosi, F.; et al. Phase II study of anti-EGFR rechallenge therapy with panitumumab driven by circulating tumor DNA molecular selection in metastatic colorectal cancer: The CHRONOS trial. J. Clin. Oncol. 2021, 39, 3506. [Google Scholar] [CrossRef]
- Nakanishi, R.; Oki, E.; Hasuda, H.; Sano, E.; Miyashita, Y.; Sakai, A.; Koga, N.; Kuriyama, N.; Nonaka, K.; Fujimoto, Y.; et al. Radiomics Texture Analysis for the Identification of Colorectal Liver Metastases Sensitive to First-Line Oxaliplatin-Based Chemotherapy. Ann. Surg. Oncol. 2021, 28, 2975–2985. [Google Scholar] [CrossRef]
- Ahn, S.J.; Kim, J.H.; Park, S.J.; Han, J.K. Prediction of the therapeutic response after FOLFOX and FOLFIRI treatment for patients with liver metastasis from colorectal cancer using computerized CT texture analysis. Eur. J. Radiol. 2016, 85, 1867–1874. [Google Scholar] [CrossRef]
- Lubner, M.G.; Stabo, N.; Lubner, S.J.; del Rio, A.M.; Song, C.; Halberg, R.B.; Pickhardt, P.J. CT textural analysis of hepatic metastatic colorectal cancer: Pre-treatment tumor heterogeneity correlates with pathology and clinical outcomes. Abdom. Imaging 2015, 40, 2331–2337. [Google Scholar] [CrossRef]
- Defeudis, A.; De Mattia, C.; Rizzetto, F.; Calderoni, F.; Mazzetti, S.; Torresin, A.; Vanzulli, A.; Regge, D.; Giannini, V. Standardization of CT radiomics features for multi-center analysis: Impact of software settings and parameters. Phys. Med. Biol. 2020, 65, 195012. [Google Scholar] [CrossRef]
- Rizzetto, F.; Calderoni, F.; De Mattia, C.; Defeudis, A.; Giannini, V.; Mazzetti, S.; Vassallo, L.; Ghezzi, S.; Sartore-Bianchi, A.; Marsoni, S.; et al. Impact of inter-reader contouring variability on textural radiomics of colorectal liver metastases. Eur. Radiol. Exp. 2020, 4, 62. [Google Scholar] [CrossRef] [PubMed]
- Nardone, V.; Reginelli, A.; Guida, C.; Belfiore, M.P.; Biondi, M.; Mormile, M.; Banci Buonamici, F.; Di Giorgio, E.; Spadafora, M.; Tini, P.; et al. Delta-radiomics increases multicentre reproducibility: A phantom study. Med. Oncol. 2020, 37, 38. [Google Scholar] [CrossRef]
- Dercle, L.; Lu, L.; Schwartz, L.H.; Qian, M.; Tejpar, S.; Eggleton, P.; Zhao, B.; Piessevaux, H. Radiomics response signature for identification of metastatic colorectal cancer sensitive to therapies targeting EGFR pathway. J. Natl. Cancer Inst. 2020, 112, 902–912. [Google Scholar] [CrossRef]
- Dohan, A.; Gallix, B.; Guiu, B.; Le Malicot, K.; Reinhold, C.; Soyer, P.; Bennouna, J.; Ghiringhelli, F.; Barbier, E.; Boige, V.; et al. Early evaluation using a radiomic signature of unresectable hepatic metastases to predict outcome in patients with colorectal cancer treated with FOLFIRI and bevacizumab. Gut 2020, 69, 531–539. [Google Scholar] [CrossRef]
- Eisenhauer, E.A.; Therasse, P.; Bogaerts, J.; Schwartz, L.H.; Sargent, D.; Ford, R.; Dancey, J.; Arbuck, S.; Gwyther, S.; Mooney, M.; et al. New response evaluation criteria in solid tumours: Revised RECIST guideline (version 1.1). Eur. J. Cancer 2009, 45, 228–247. [Google Scholar] [CrossRef]
- Yip, S.S.F.; Aerts, H.J.W.L. Applications and limitations of radiomics. Phys. Med. Biol. 2016, 61, R150–R166. [Google Scholar] [CrossRef] [PubMed] [Green Version]
- Zwanenburg, A.; Leger, S.; Agolli, L.; Pilz, K.; Troost, E.G.C.; Richter, C.; Löck, S. Assessing robustness of radiomic features by image perturbation. Sci. Rep. 2019, 9, 614. [Google Scholar] [CrossRef] [Green Version]
- Van Griethuysen, J.J.M.; Fedorov, A.; Parmar, C.; Hosny, A.; Aucoin, N.; Narayan, V.; Beets-Tan, R.G.H.; Fillion-Robin, J.C.; Pieper, S.; Aerts, H.J.W.L. Computational radiomics system to decode the radiographic phenotype. Cancer Res. 2017, 77, e104–e107. [Google Scholar] [CrossRef] [PubMed] [Green Version]
- Hatt, M.; Vallieres, M.; Visvikis, D.; Zwanenburg, A. IBSI: An international community radiomics standardization initiative. J. Nucl. Med. 2018, 59, 287. Available online: https://jnm.snmjournals.org/content/59/supplement_1/287 (accessed on 29 December 2021).
- Rosati, S.; Gianfreda, C.M.; Balestra, G.; Martincich, L.; Giannini, V.; Regge, D. Correlation based Feature Selection impact on the classification of breast cancer patients response to neoadjuvant chemotherapy. In Proceedings of the MeMeA 2018—2018 IEEE International Symposium on Medical Measurements and Applications, Rome, Italy, 2 February 2018; IEEE: Piscataway, NJ, USA, 2018; pp. 1–5. [Google Scholar]
- Yu, L.; Liu, H. Feature Selection for High-Dimensional Data: A Fast Correlation-Based Filter Solution. In Proceedings of the Twentieth International Conference on Machine Learning, Washington, DC, USA, 21–24 August 2003; Volume 2, pp. 856–863. [Google Scholar]
- Klaassen, R.; Larue, R.T.H.M.; Mearadji, B.; van der Woude, S.O.; Stoker, J.; Lambin, P.; van Laarhoven, H.W.M. Feasibility of CT radiomics to predict treatment response of individual liver metastases in esophagogastric cancer patients. PLoS ONE 2018, 13, e0207362. [Google Scholar] [CrossRef] [PubMed] [Green Version]
- Giannini, V.; Rosati, S.; Defeudis, A.; Balestra, G.; Vassallo, L.; Cappello, G.; Mazzetti, S.; De Mattia, C.; Rizzetto, F.; Torresin, A.; et al. Radiomics predicts response of individual HER2-amplified colorectal cancer liver metastases in patients treated with HER2-targeted therapy. Int. J. Cancer 2020, 147, 3215–3223. [Google Scholar] [CrossRef]
- Kniep, H.C.; Madesta, F.; Schneider, T.; Hanning, U.; Schönfeld, M.H.; Schön, G.; Fiehler, J.; Gauer, T.; Werner, R.; Gellissen, S. Radiomics of brain MRI: Utility in prediction of metastatic tumor type. Radiology 2019, 290, 479–487. [Google Scholar] [CrossRef]
- Michiels, S.; Saad, E.D.; Buyse, M. Progression-Free Survival as a Surrogate for Overall Survival in Clinical Trials of Targeted Therapy in Advanced Solid Tumors. Drugs 2017, 77, 713–719. [Google Scholar] [CrossRef] [PubMed]
- Staal, F.C.R.; van der Reijd, D.J.; Taghavi, M.; Lambregts, D.M.J.; Beets-Tan, R.G.H.; Maas, M. Radiomics for the Prediction of Treatment Outcome and Survival in Patients With Colorectal Cancer: A Systematic Review. Clin. Colorectal Cancer 2021, 20, 52–71. [Google Scholar] [CrossRef] [PubMed]
- Buch, K.; Li, B.; Qureshi, M.M.; Kuno, H.; Anderson, S.W.; Sakai, O. Quantitative assessment of variation in CT parameters on texture features: Pilot study using a nonanatomic phantom. Am. J. Neuroradiol. 2017, 38, 981–985. [Google Scholar] [CrossRef] [PubMed] [Green Version]
- Panic, J.; Defeudis, A.; Mazzetti, S.; Rosati, S.; Giannetto, G.; Vassallo, L.; Regge, D.; Balestra, G.; Giannini, V. A Convolutional Neural Network based system for Colorectal cancer segmentation on MRI images. In Proceedings of the Annual International Conference of the IEEE Engineering in Medicine and Biology Society, EMBS, Montreal, QC, Canada, 20–24 July 2020; pp. 1675–1678. [Google Scholar]
- Sammour, T.; Bedrikovetski, S. Radiomics for Diagnosing Lateral Pelvic Lymph Nodes in Rectal Cancer: Artificial Intelligence Enabling Precision Medicine? Ann. Surg. Oncol. 2020, 27, 4082–4083. [Google Scholar] [CrossRef] [PubMed]
- Cho, Y.S.; Cho, K.; Park, C.J.; Chung, M.J.; Kim, J.H.; Kim, K.; Kim, Y.K.; Kim, H.J.; Ko, J.W.; Cho, B.H.; et al. Automated measurement of hydrops ratio from MRI in patients with Ménière’s disease using CNN-based segmentation. Sci. Rep. 2020, 10, 7003. [Google Scholar] [CrossRef] [PubMed]
- Papadimitroulas, P.; Brocki, L.; Christopher Chung, N.; Marchadour, W.; Vermet, F.; Gaubert, L.; Eleftheriadis, V.; Plachouris, D.; Visvikis, D.; Kagadis, G.C.; et al. Artificial intelligence: Deep learning in oncological radiomics and challenges of interpretability and data harmonization. Phys. Med. 2021, 83, 108–121. [Google Scholar] [CrossRef]


| ACC % | SE % | SP % | PPV % | NPV % | |
|---|---|---|---|---|---|
| (95% CI) | (95% CI) | (95% CI) | (95% CI) | (95% CI) | |
| [Rate] | [Rate] | [Rate] | [Rate] | [Rate] | |
| Train | 97 | 99 | 94 | 95 | 99 |
| (89–100) | (94–99) | (85–98) | (89–98) | (91–100) | |
| [166/172] | [94/95] | [72/77] | [94/99] | [72/73] | |
| Validation | 86 | 85 | 92 | 90 | 87 |
| (81–92) | (68–95) | (78–98) | (76–96) | (75–94) | |
| [62/70] | [28/33] | [34/37] | [28/31] | [34/39] | |
| Lesion RECIST | 84 | 100 | 67 | 77 | 100 |
| (79–87) | (97–100) | (57–75) | (72–81) | (79–88) | |
| [202/242] | [128/128] | [76/114] | [128/166] | [76/76] |
| PZ | LES | REAL CLASS | Baseline Diameter (mm) | TP1 Diameter (mm) | Last FU Diameter (mm) | Time of FU |
|---|---|---|---|---|---|---|
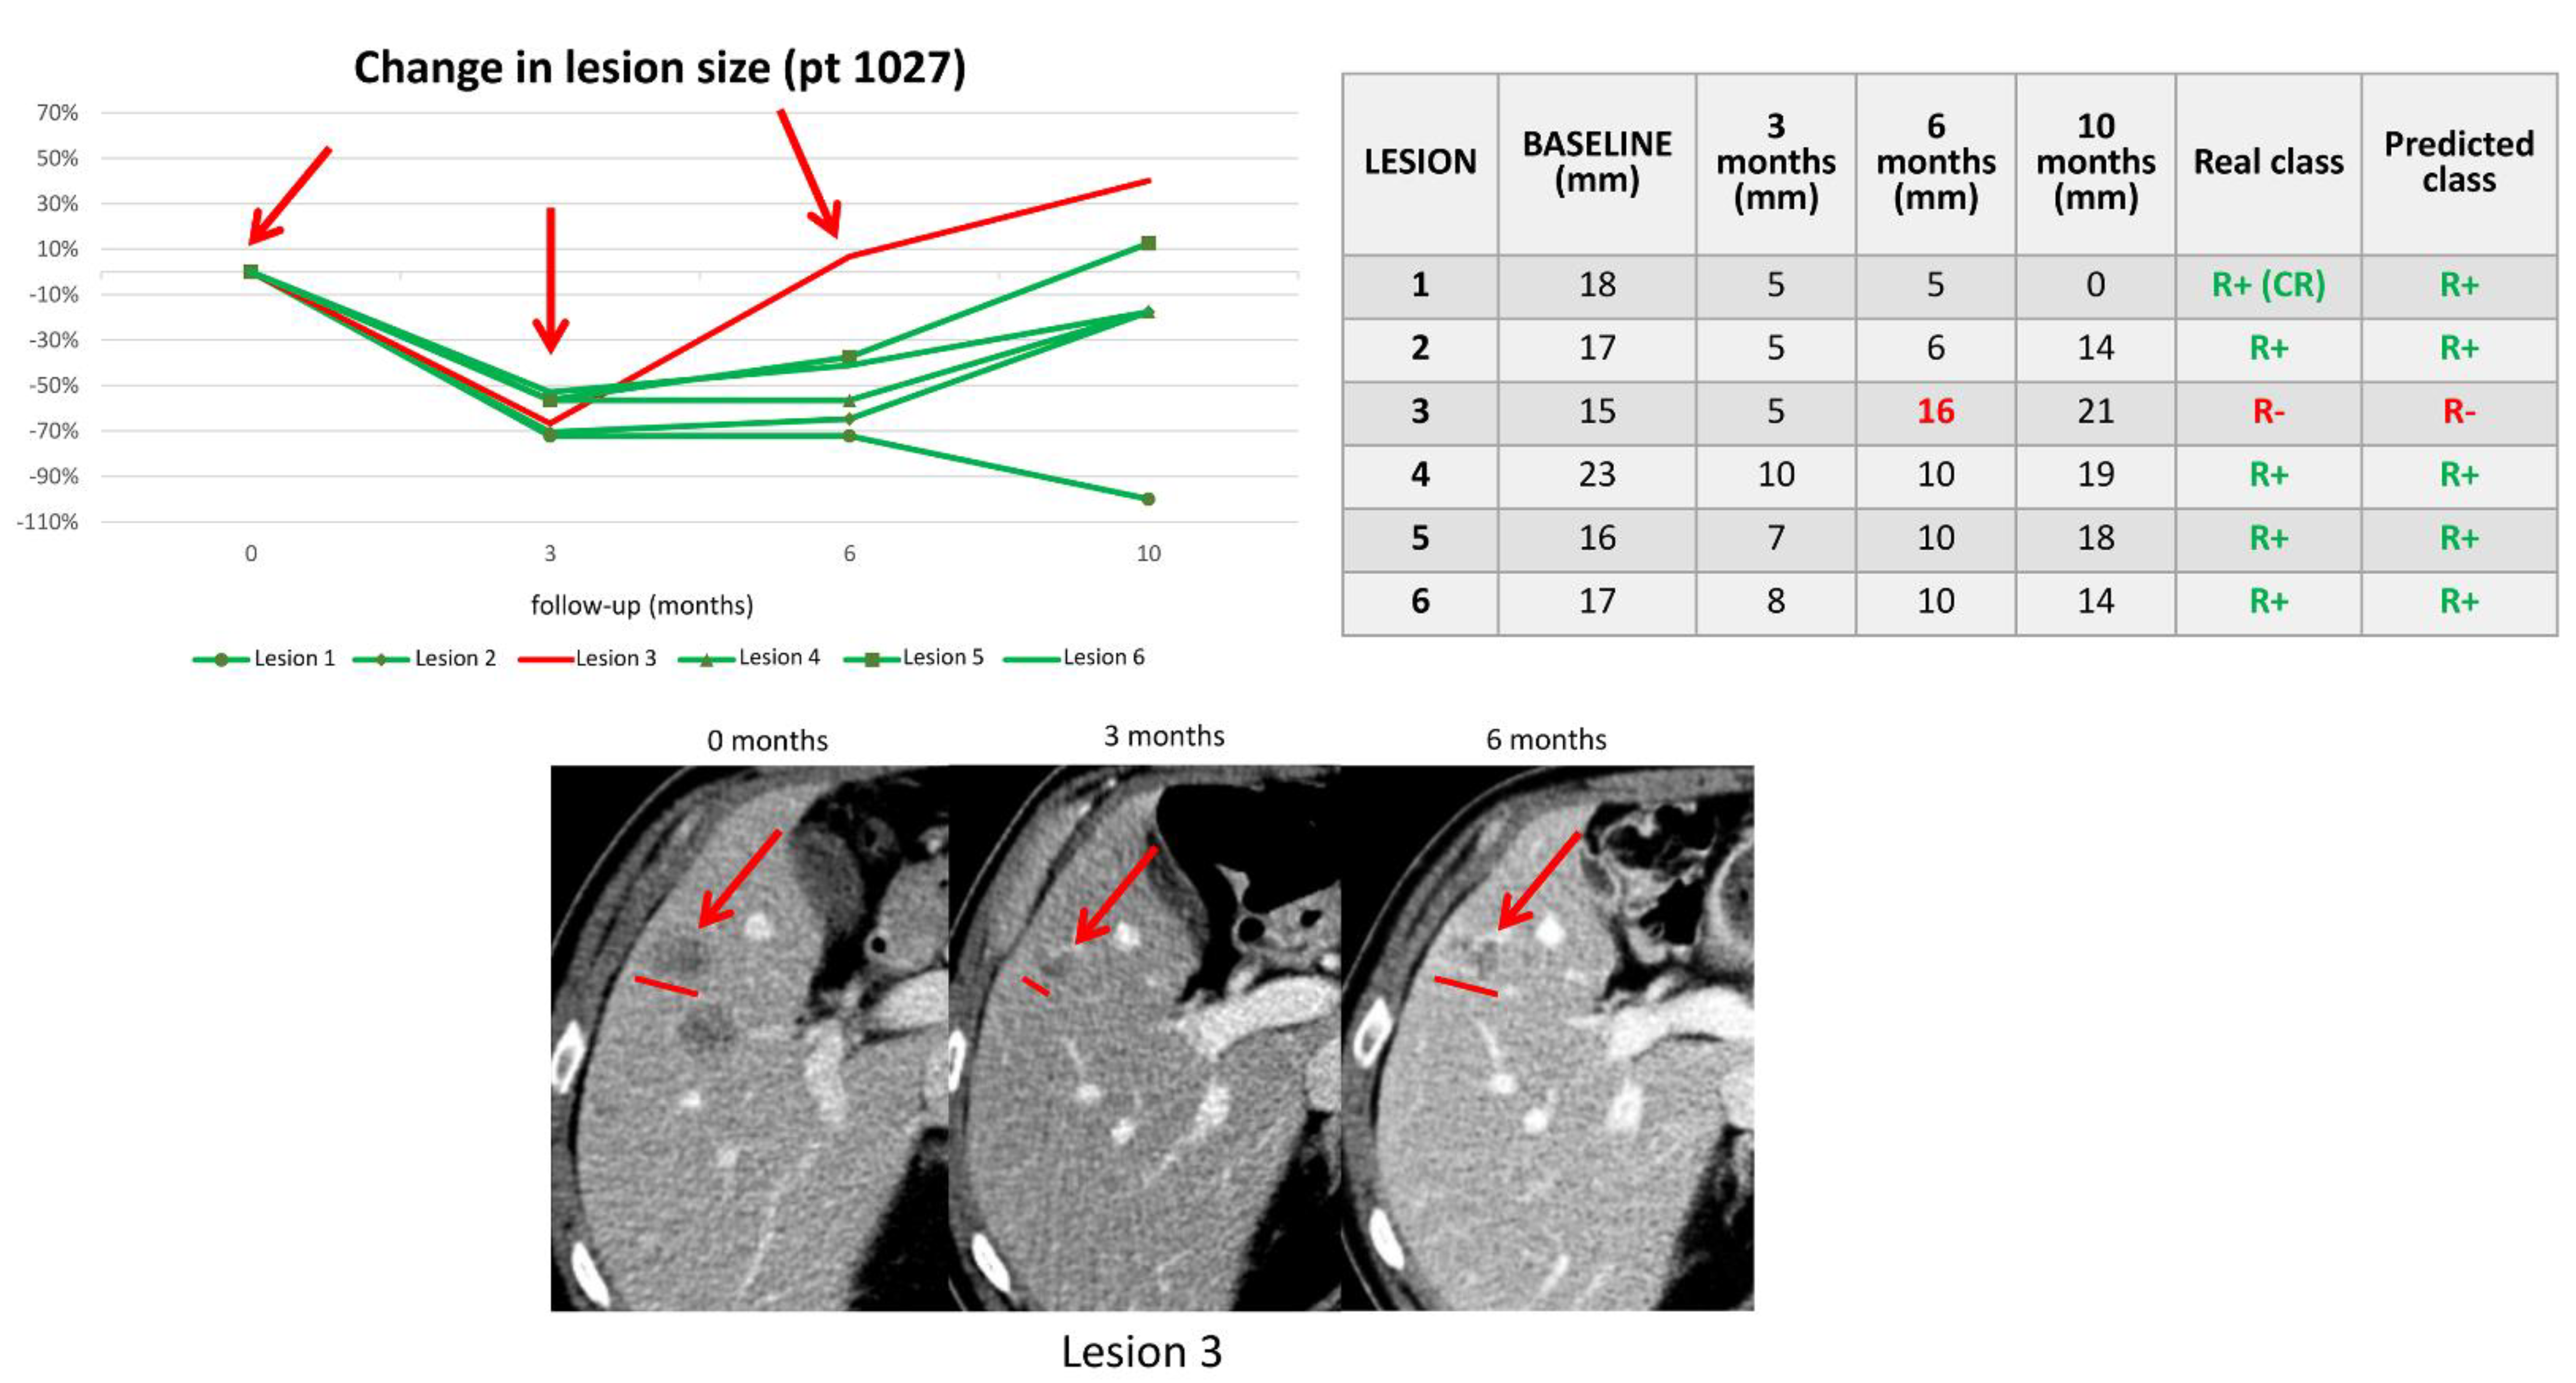
| 1010 | 7 | R− | 33 | 10 | 33 | 6 months |
| 10 | R− | 33 | 13 | 33 | 6 months | |
| 1017 | 2 | R− | 44 | 28 | 32 | 6 months |
| 4 | R+ | 14 | 13 | 0 | CR | |
| 1001 | 1 | R+ | 11 | 6 | 0 | CR |
| 1015 | 4 | R+ | 28 | 18 | 12 | 9 months |
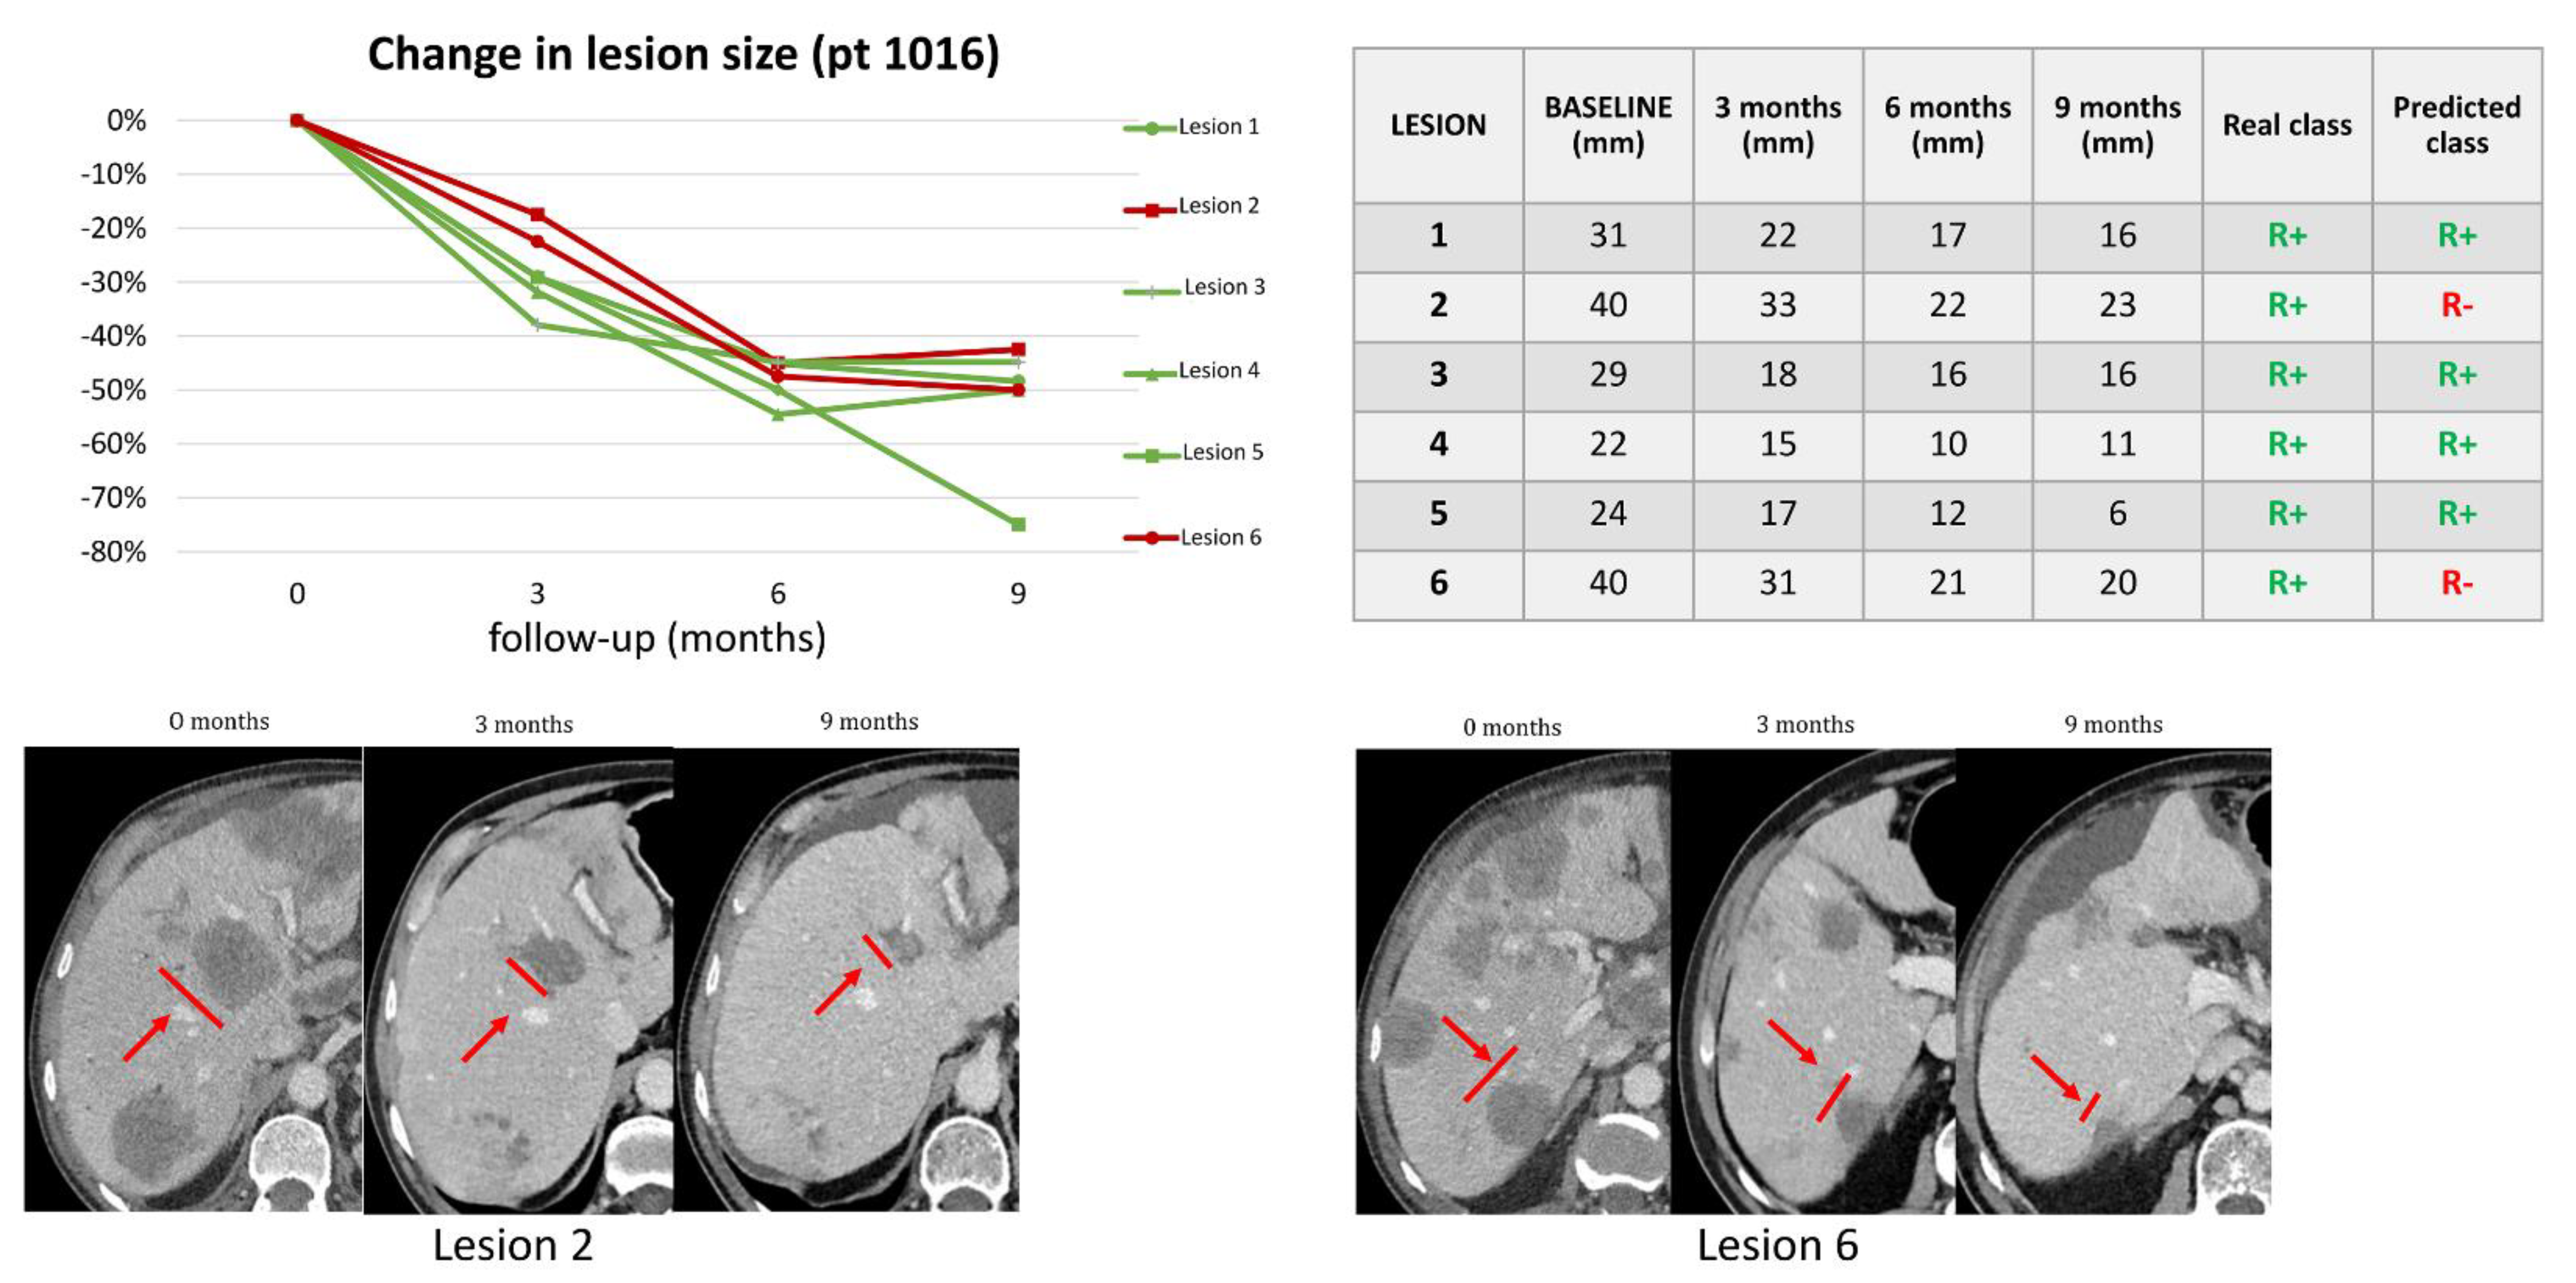
| 1016 | 2 | R+ | 40 | 33 | 23 | 9 months |
| 6 | R+ | 40 | 31 | 20 | 9 months |
Publisher’s Note: MDPI stays neutral with regard to jurisdictional claims in published maps and institutional affiliations. |
© 2022 by the authors. Licensee MDPI, Basel, Switzerland. This article is an open access article distributed under the terms and conditions of the Creative Commons Attribution (CC BY) license (https://creativecommons.org/licenses/by/4.0/).
Share and Cite
Giannini, V.; Pusceddu, L.; Defeudis, A.; Nicoletti, G.; Cappello, G.; Mazzetti, S.; Sartore-Bianchi, A.; Siena, S.; Vanzulli, A.; Rizzetto, F.; et al. Delta-Radiomics Predicts Response to First-Line Oxaliplatin-Based Chemotherapy in Colorectal Cancer Patients with Liver Metastases. Cancers 2022, 14, 241. https://doi.org/10.3390/cancers14010241
Giannini V, Pusceddu L, Defeudis A, Nicoletti G, Cappello G, Mazzetti S, Sartore-Bianchi A, Siena S, Vanzulli A, Rizzetto F, et al. Delta-Radiomics Predicts Response to First-Line Oxaliplatin-Based Chemotherapy in Colorectal Cancer Patients with Liver Metastases. Cancers. 2022; 14(1):241. https://doi.org/10.3390/cancers14010241
Chicago/Turabian StyleGiannini, Valentina, Laura Pusceddu, Arianna Defeudis, Giulia Nicoletti, Giovanni Cappello, Simone Mazzetti, Andrea Sartore-Bianchi, Salvatore Siena, Angelo Vanzulli, Francesco Rizzetto, and et al. 2022. "Delta-Radiomics Predicts Response to First-Line Oxaliplatin-Based Chemotherapy in Colorectal Cancer Patients with Liver Metastases" Cancers 14, no. 1: 241. https://doi.org/10.3390/cancers14010241