
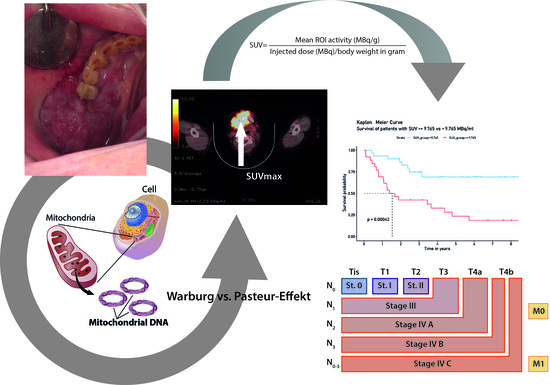
Implications of Standardized Uptake Values of Oral Squamous Cell Carcinoma in PET-CT on Prognosis, Tumor Characteristics and Mitochondrial DNA Heteroplasmy

 ,
,  , , , and
Abstract
:Simple Summary
Abstract
1. Introduction
2. Material and Methods
2.1. Study Population
2.2. Diagnostic Confirmation
2.3. Determination of Standardized Uptake Values
2.4. Sequencing of the Entire mtDNA via NGS
3. Statistics
4. Results
4.1. Patient Characteristics
4.2. Correlation of Clinical Parameters
4.3. MtDNA Mutational Profile in High vs. Low SUVmax Groups
5. Discussion
6. Conclusions
Author Contributions
Funding
Institutional Review Board Statement
Informed Consent Statement
Data Availability Statement
Conflicts of Interest
References
- Arbeitsgemeinschaft Der Wissenschaftlichen Medizinischen Fachgesellschaften (AWMF). Ständige Kommission Leitlinien. Diagnostik Und Therapie Des Mundhölenkarzinoms. 2015. Available online: Https://www.Leitlinienprogramm-Onkologie.de/Fileadmin/User_upload/Downloads/Leitlinien/Mundhoehlenkarzinom/S3-Mundhoehlenkarzinom-OL-Langversion_.Pdf (accessed on 13 May 2019).
- Cancer, 3rd ed.; Gelband, H.; Jha, P.; Sankaranarayanan, R.; Horton, S.; World Bank (Eds.) The World Bank: Washington, DC, USA, 2015; ISBN 978-1-4648-0349-9. [Google Scholar]
- Radoï, L.; Paget-Bailly, S.; Cyr, D.; Papadopoulos, A.; Guida, F.; Schmaus, A.; Cénée, S.; Menvielle, G.; Carton, M.; Lapôtre-Ledoux, B.; et al. Tobacco Smoking, Alcohol Drinking and Risk of Oral Cavity Cancer by Subsite: Results of a French Population-Based Case-Control Study, the ICARE Study. Eur. J. Cancer. Prev. 2013, 22, 268–276. [Google Scholar] [CrossRef]
- Johnson, N.W.; Warnakulasuriya, S.; Gupta, P.C.; Dimba, E.; Chindia, M.; Otoh, E.C.; Sankaranarayanan, R.; Califano, J.; Kowalski, L. Global Oral Health Inequalities in Incidence and Outcomes for Oral Cancer: Causes and Solutions. Adv. Dent. Res. 2011, 23, 237–246. [Google Scholar] [CrossRef] [Green Version]
- Johnson, N. Tobacco Use and Oral Cancer: A Global Perspective. J. Dent. Educ. 2001, 65, 328–339. [Google Scholar] [CrossRef] [PubMed]
- National Cancer Institute SEER Cancer Statistics Review, 1975–2005. 2019. Available online: Https://Seer.Cancer.Gov/Csr/1975_2005/ (accessed on 13 May 2019).
- Listl, S.; Jansen, L.; Stenzinger, A.; Freier, K.; Emrich, K.; Holleczek, B.; Katalinic, A.; Gondos, A.; Brenner, H. Survival of Patients with Oral Cavity Cancer in Germany. PLoS ONE 2013, 8, e53415. [Google Scholar] [CrossRef]
- Mund-Kiefer-Gesichtschirurgie, 4th ed.; Schwenzer, N.; Bacher, M. (Eds.) Thieme: Stuttgart, Germany, 2011; ISBN 978-3-13-593504-1. [Google Scholar]
- Fernandez-de-Cossio-Diaz, J.; Vazquez, A. Limits of Aerobic Metabolism in Cancer Cells. Sci. Rep. 2017, 7, 13488. [Google Scholar] [CrossRef] [PubMed] [Green Version]
- Warburg, O. On the Origin of Cancer Cells. Science 1956, 123, 309–314. [Google Scholar] [CrossRef]
- Vaupel, P.; Multhoff, G. Revisiting the Warburg Effect: Historical Dogma versus Current Understanding. J. Physiol. 2021, 599, 1745–1757. [Google Scholar] [CrossRef]
- Tan, A.S.; Baty, J.W.; Dong, L.-F.; Bezawork-Geleta, A.; Endaya, B.; Goodwin, J.; Bajzikova, M.; Kovarova, J.; Peterka, M.; Yan, B.; et al. Mitochondrial Genome Acquisition Restores Respiratory Function and Tumorigenic Potential of Cancer Cells without Mitochondrial DNA. Cell Metab. 2015, 21, 81–94. [Google Scholar] [CrossRef] [Green Version]
- Lu, J.; Tan, M.; Cai, Q. The Warburg Effect in Tumor Progression: Mitochondrial Oxidative Metabolism as an Anti-Metastasis Mechanism. Cancer Lett. 2015, 356, 156–164. [Google Scholar] [CrossRef] [Green Version]
- Christen, P.; Jaussi, R.; Benoit, R. Biochemie und Molekularbiologie: Eine Einführung in 40 Lerneinheiten, 1st ed.; Christen, P., Jaussi, R., Benoit, R., Eds.; Springer: Berlin, Germany, 2016; ISBN 978-3-662-46430-4. [Google Scholar]
- Anderson, S.; Bankier, A.T.; Barrell, B.G.; de Bruijn, M.H.L.; Coulson, A.R.; Drouin, J.; Eperon, I.C.; Nierlich, D.P.; Roe, B.A.; Sanger, F.; et al. Sequence and Organization of the Human Mitochondrial Genome. Nature 1981, 290, 457–465. [Google Scholar] [CrossRef]
- Schöpf, B.; Weissensteiner, H.; Schäfer, G.; Fazzini, F.; Charoentong, P.; Naschberger, A.; Rupp, B.; Fendt, L.; Bukur, V.; Giese, I.; et al. OXPHOS Remodeling in High-Grade Prostate Cancer Involves MtDNA Mutations and Increased Succinate Oxidation. Nat. Commun. 2020, 11, 1487. [Google Scholar] [CrossRef] [Green Version]
- Petros, J.A.; Baumann, A.K.; Ruiz-Pesini, E.; Amin, M.B.; Sun, C.Q.; Hall, J.; Lim, S.; Issa, M.M.; Flanders, W.D.; Hosseini, S.H.; et al. MtDNA Mutations Increase Tumorigenicity in Prostate Cancer. Proc. Natl. Acad. Sci. USA 2005, 102, 719–724. [Google Scholar] [CrossRef] [Green Version]
- Garcia-Heredia, J.M.; Carnero, A. Decoding Warburg’s Hypothesis: Tumor-Related Mutations in the Mitochondrial Respiratory Chain. Oncotarget 2015, 6, 41582–41599. [Google Scholar] [CrossRef] [Green Version]
- Bussard, K.M.; Siracusa, L.D. Understanding Mitochondrial Polymorphisms in Cancer. Cancer Res. 2017, 77, 6051–6059. [Google Scholar] [CrossRef] [Green Version]
- Fendt, L.; Niederstätter, H.; Huber, G.; Zelger, B.; Dünser, M.; Seifarth, C.; Röck, A.; Schäfer, G.; Klocker, H.; Parson, W. Accumulation of Mutations over the Entire Mitochondrial Genome of Breast Cancer Cells Obtained by Tissue Microdissection. Breast Cancer Res. Treat. 2011, 128, 327–336. [Google Scholar] [CrossRef]
- Kloss-Brandstätter, A.; Schäfer, G.; Erhart, G.; Hüttenhofer, A.; Coassin, S.; Seifarth, C.; Summerer, M.; Bektic, J.; Klocker, H.; Kronenberg, F. Somatic Mutations throughout the Entire Mitochondrial Genome Are Associated with Elevated PSA Levels in Prostate Cancer Patients. Am. J. Hum. Genet. 2010, 87, 802–812. [Google Scholar] [CrossRef] [Green Version]
- Uzawa, K.; Baba, T.; Uchida, F.; Yamatoji, M.; Kasamatsu, A.; Sakamoto, Y.; Ogawara, K.; Shiiba, M.; Bukawa, H.; Tanzawa, H. Circulating Tumor-Derived Mutant Mitochondrial DNA: A Predictive Biomarker of Clinical Prognosis in Human Squamous Cell Carcinoma. Oncotarget 2012, 3, 670–677. [Google Scholar] [CrossRef] [Green Version]
- Lai, C.-H.; Huang, S.-F.; Liao, C.-T.; Chen, I.-H.; Wang, H.-M.; Hsieh, L.-L. Clinical Significance in Oral Cavity Squamous Cell Carcinoma of Pathogenic Somatic Mitochondrial Mutations. PLoS ONE 2013, 8, e65578. [Google Scholar] [CrossRef]
- Krebsregister Tirol. Available online: https://www.iet.at/page.cfm?vpath=register/tumorregister (accessed on 13 May 2019).
- WHO Classification of Head and Neck Tumours, 4th ed.; El-Naggar, A.K.; Chan, J.K.C.; Grandis, J.R.; Takata, T.; Slootweg, P.J. (Eds.) World Health Organization classification of Tumours; International Agency for Research on Cancer: Lyon, France, 2017; ISBN 978-92-832-2438-9. [Google Scholar]
- Bryant, A.S.; Cerfolio, R.J.; Klemm, K.M.; Ojha, B. Maximum Standard Uptake Value of Mediastinal Lymph Nodes on Integrated FDG-PET-CT Predicts Pathology in Patients with Non-Small Cell Lung Cancer. Ann. Thorac. Surg. 2006, 82, 417–423. [Google Scholar] [CrossRef] [PubMed]
- Fendt, L.; Fazzini, F.; Weissensteiner, H.; Bruckmoser, E.; Schönherr, S.; Schäfer, G.; Losso, J.L.; Streiter, G.A.; Lamina, C.; Rasse, M.; et al. Profiling of Mitochondrial DNA Heteroplasmy in a Prospective Oral Squamous Cell Carcinoma Study. Cancers 2020, 12, 1933. [Google Scholar] [CrossRef]
- Weissensteiner, H.; Forer, L.; Fuchsberger, C.; Schöpf, B.; Kloss-Brandstätter, A.; Specht, G.; Kronenberg, F.; Schönherr, S. MtDNA-Server: Next-Generation Sequencing Data Analysis of Human Mitochondrial DNA in the Cloud. Nucleic Acids Res. 2016, 44, W64–W69. [Google Scholar] [CrossRef]
- Fazzini, F.; Fendt, L.; Schönherr, S.; Forer, L.; Schöpf, B.; Streiter, G.; Losso, J.L.; Kloss-Brandstätter, A.; Kronenberg, F.; Weissensteiner, H. Analyzing Low-Level MtDNA Heteroplasmy—Pitfalls and Challenges from Bench to Benchmarking. Int. J. Mol. Sci. 2021, 22, 935. [Google Scholar] [CrossRef]
- Li, B.; Krishnan, V.G.; Mort, M.E.; Xin, F.; Kamati, K.K.; Cooper, D.N.; Mooney, S.D.; Radivojac, P. Automated Inference of Molecular Mechanisms of Disease from Amino Acid Substitutions. Bioinformatics 2009, 25, 2744–2750. [Google Scholar] [CrossRef] [Green Version]
- Fortin, A.; Couture, C.; Doucet, R.; Albert, M.; Allard, J.; Tetu, B. Does Histologic Grade Have a Role in the Management of Head and Neck Cancers? JCO 2001, 19, 4107–4116. [Google Scholar] [CrossRef]
- Carinci, F.; Pelucchi, S.; Farina, A.; De Franciscis, G.; Calearo, C. Extension as a Prognostic Factor in Oropharyngeal Cancer: Largest Mucosal Dimension Compared with Number of (Sub)Sites Involved. Br. J. Oral Maxillofac. Surg. 1998, 36, 440–445. [Google Scholar] [CrossRef]
- Tankéré, F.; Camproux, A.; Barry, B.; Guedon, C.; Depondt, J.; Gehanno, P. Prognostic Value of Lymph Node Involvement in Oral Cancers: A Study of 137 Cases. Laryngoscope 2000, 110, 2061–2065. [Google Scholar] [CrossRef] [PubMed]
- Tonchev, K.; Vladimirov, B.; Department of Maxillofacial Surgery, Medical University–Plovdiv, Bulgaria. Survival Rates in Oral Cancer Patients–A 10-Year Retrospective Study. J. IMAB Annu. Proc. Sci. Pap. 2016, 22, 1385–1388. [Google Scholar] [CrossRef] [Green Version]
- Zheng, D.; Niu, L.; Liu, W.; Zheng, C.; Yan, R.; Gong, L.; Dong, Z.; Li, K.; Fei, J. Correlation Analysis between the SUVmax of FDG-PET/CT and Clinicopathological Characteristics in Oral Squamous Cell Carcinoma. Dentomaxillofacial Radiol. 2019, 48, 20180416. [Google Scholar] [CrossRef]
- Hofele, C.; Freier, K.; Thiele, O.C.; Haberkorn, U.; Buchmann, I. High 2-[18F]Fluoro-2-Deoxy-d-Glucose (18FDG) Uptake Measured by Positron Emission Tomography Is Associated with Reduced Overall Survival in Patients with Oral Squamous Cell Carcinoma. Oral Oncol. 2009, 45, 963–967. [Google Scholar] [CrossRef] [PubMed]
- Shih, C.-C.; Lee, T.-S.; Tsuang, F.-Y.; Lin, P.-L.; Cheng, Y.-J.; Cheng, H.-L.; Wu, C.-Y. Pretreatment Serum Lactate Level as a Prognostic Biomarker in Patients Undergoing Supratentorial Primary Brain Tumor Resection. Oncotarget 2017, 8, 63715–63723. [Google Scholar] [CrossRef] [PubMed] [Green Version]
- Vander Heiden, M.G.; Cantley, L.C.; Thompson, C.B. Understanding the Warburg Effect: The Metabolic Requirements of Cell Proliferation. Science 2009, 324, 1029–1033. [Google Scholar] [CrossRef] [Green Version]
- Colen, C.B.; Shen, Y.; Ghoddoussi, F.; Yu, P.; Francis, T.B.; Koch, B.J.; Monterey, M.D.; Galloway, M.P.; Sloan, A.E.; Mathupala, S.P. Metabolic Targeting of Lactate Efflux by Malignant Glioma Inhibits Invasiveness and Induces Necrosis: An in Vivo Study. Neoplasia 2011, 13, 620–632. [Google Scholar] [CrossRef] [Green Version]
- Sonveaux, P.; Végran, F.; Schroeder, T.; Wergin, M.C.; Verrax, J.; Rabbani, Z.N.; De Saedeleer, C.J.; Kennedy, K.M.; Diepart, C.; Jordan, B.F.; et al. Targeting Lactate-Fueled Respiration Selectively Kills Hypoxic Tumor Cells in Mice. J. Clin. Investig. 2008, 118, 3930–3942. [Google Scholar] [CrossRef] [PubMed] [Green Version]
- Warburg, O. The Metabolism of Carcinoma Cells. J. Cancer Res. 1925, 9, 148–163. [Google Scholar] [CrossRef] [Green Version]
- van der Waal, I. Atlas of Oral Diseases: A Guide for Daily Practice, 1. Auflage.; Springer: Amsterdam, The Netherlands, 2015; ISBN 978-3-662-48122-6. [Google Scholar]
- Neena, D.; Siddharth, S.; Keyuri, P.; Munira, J. Histological Grading of Oral Cancer: A Comparison of Different Systems and Their Relation to Lymph Node Metastasis. Nat. J. Commun. Med. 2011, 2, 136–142. [Google Scholar]
- Berghmans, T.; Dusart, M.; Paesmans, M.; Hossein-Foucher, C.; Buvat, I.; Castaigne, C.; Scherpereel, A.; Mascaux, C.; Moreau, M.; Roelandts, M.; et al. Primary Tumor Standardized Uptake Value (SUVmax) Measured on Fluorodeoxyglucose Positron Emission Tomography (FDG-PET) Is of Prognostic Value for Survival in Non-Small Cell Lung Cancer (NSCLC): A Systematic Review and Meta-Analysis (MA) by the European Lung Cancer Working Party for the IASLC Lung Cancer Staging Project. J. Thorac. Oncol. 2008, 3, 6–12. [Google Scholar] [CrossRef]
- Komek, H.; Altindag, S.; Can, C.; Aguloglu, N.; Morcali, H.; Kepenek, F.; Karaoglan, H. The Effect on Survival and Mortality of the Highest SUVmax Value on Metastatic Foci in Postoperative Kidney Tumors. Niger. J. Clin. Pract. 2018, 21, 163. [Google Scholar] [CrossRef] [PubMed]
- Diao, W.; Tian, F.; Jia, Z. The Prognostic Value of SUVmax Measuring on Primary Lesion and ALN by 18F-FDG PET or PET/CT in Patients with Breast Cancer. Eur. J. Radiol. 2018, 105, 1–7. [Google Scholar] [CrossRef]
- Bharadwaj, S.; Venkatraghavan, L.; Mariappan, R.; Ebinu, J.; Meng, Y. Serum Lactate as a Potential Biomarker of Malignancy in Primary Adult Brain Tumours. J. Clin. Neurosci. 2015, 22, 1625–1627. [Google Scholar] [CrossRef]
- Kim, J.W.; Oh, J.S.; Roh, J.-L.; Kim, J.S.; Choi, S.-H.; Nam, S.Y.; Kim, S.Y. Prognostic Significance of Standardized Uptake Value and Metabolic Tumour Volume on 18F-FDG PET/CT in Oropharyngeal Squamous Cell Carcinoma. Eur. J. Nucl. Med. Mol. Imaging 2015, 42, 1353–1361. [Google Scholar] [CrossRef]
- Zhang, B.; Geng, J.; Nie, F.; Li, X. Primary Tumor Standardized Uptake Value Predicts Survival in Head and Neck Squamous Cell Carcinoma. Oncol. Res. Treat. 2015, 38, 45–48. [Google Scholar] [CrossRef]
- Ryu, I.S.; Kim, J.S.; Roh, J.-L.; Cho, K.-J.; Choi, S.-H.; Nam, S.Y.; Kim, S.Y. Prognostic Significance of Preoperative Metabolic Tumour Volume and Total Lesion Glycolysis Measured by 18F-FDG PET/CT in Squamous Cell Carcinoma of the Oral Cavity. Eur. J. Nucl. Med. Mol. Imaging 2014, 41, 452–461. [Google Scholar] [CrossRef]
- Spanier, G.; Weidt, D.; Hellwig, D.; Meier, J.K.H.; Reichert, T.E.; Grosse, J. Total Lesion Glycolysis in Oral Squamous Cell Carcinoma as a Biomarker Derived from Pre-Operative FDG PET/CT Outperforms Established Prognostic Factors in a Newly Developed Multivariate Prediction Model. Oncotarget 2021, 12, 37–48. [Google Scholar] [CrossRef]
- Stalder, S.A.; Schumann, P.; Lanzer, M.; Hüllner, M.W.; Rupp, N.J.; Broglie, M.A.; Morand, G.B. Value of SUVmax for the Prediction of Bone Invasion in Oral Squamous Cell Carcinoma. Biology 2020, 9, 23. [Google Scholar] [CrossRef] [Green Version]
- Fane, M.; Weeraratna, A.T. How the Ageing Microenvironment Influences Tumour Progression. Nat. Rev. Cancer. 2020, 20, 89–106. [Google Scholar] [CrossRef]
- Yuan, Y.; Ju, Y.S.; Kim, Y.; Li, J.; Wang, Y.; Yoon, C.J.; Yang, Y.; Martincorena, I.; Creighton, C.J.; Weinstein, J.N.; et al. Comprehensive Molecular Characterization of Mitochondrial Genomes in Human Cancers. Nat. Genet. 2020, 52, 342–352. [Google Scholar] [CrossRef] [Green Version]
- Hopkins, J.F.; Sabelnykova, V.Y.; Weischenfeldt, J.; Simon, R.; Aguiar, J.A.; Alkallas, R.; Heisler, L.E.; Zhang, J.; Watson, J.D.; Chua, M.L.K.; et al. Mitochondrial Mutations Drive Prostate Cancer Aggression. Nat. Commun. 2017, 8, 656. [Google Scholar] [CrossRef]
- Rossignol, R.; Faustin, B.; Rocher, C.; Malgat, M.; Mazat, J.-P.; Letellier, T. Mitochondrial Threshold Effects. Biochem. J. 2003, 370, 751–762. [Google Scholar] [CrossRef] [Green Version]
- Pascale, R.M.; Calvisi, D.F.; Simile, M.M.; Feo, C.F.; Feo, F. The Warburg Effect 97 Years after Its Discovery. Cancers 2020, 12, 2819. [Google Scholar] [CrossRef]
- Dong, L.-F.; Kovarova, J.; Bajzikova, M.; Bezawork-Geleta, A.; Svec, D.; Endaya, B.; Sachaphibulkij, K.; Coelho, A.R.; Sebkova, N.; Ruzickova, A.; et al. Horizontal Transfer of Whole Mitochondria Restores Tumorigenic Potential in Mitochondrial DNA-Deficient Cancer Cells. eLife 2017, 6, 22187. [Google Scholar] [CrossRef] [Green Version]
- Shen, B.; Huang, T.; Sun, Y.; Jin, Z.; Li, X.-F. Revisit 18F-Fluorodeoxyglucose Oncology Positron Emission Tomography: “Systems Molecular Imaging” of Glucose Metabolism. Oncotarget 2017, 8, 43536–43542. [Google Scholar] [CrossRef] [PubMed] [Green Version]


| Variable | Variable Characteristics | UICC | Grading | SUVmax | Bone Infiltration |
|---|---|---|---|---|---|
| UICC | Correlation coefficient | 1.000 | 0.572 | 0.390 | 0.531 |
| Sig. (bilateral) | 0.000 | 0.003 | 0.000 | ||
| Cases | 57 | 57 | 56 | 51 | |
| Grading | Correlation coefficient | 0.572 | 1.000 | 0.294 | 0.264 |
| Sig. (bilateral) | 0.000 | 0.028 | 0.61 | ||
| Cases | 57 | 57 | 56 | 51 | |
| SUVmax | Correlation coefficient | 0.390 | 0.294 | 1.000 | 0.382 |
| Sig. (bilateral) | 0.003 | 0.028 | 0.006 | ||
| Cases | 56 | 56 | 56 | 51 | |
| Bone Infiltration | Correlation coefficient | 0.531 | 0.264 | 0.382 | 1.000 |
| Sig. (bilateral) | 0.000 | 0.061 | 0.006 | ||
| Cases | 51 | 51 | 51 | 51 |
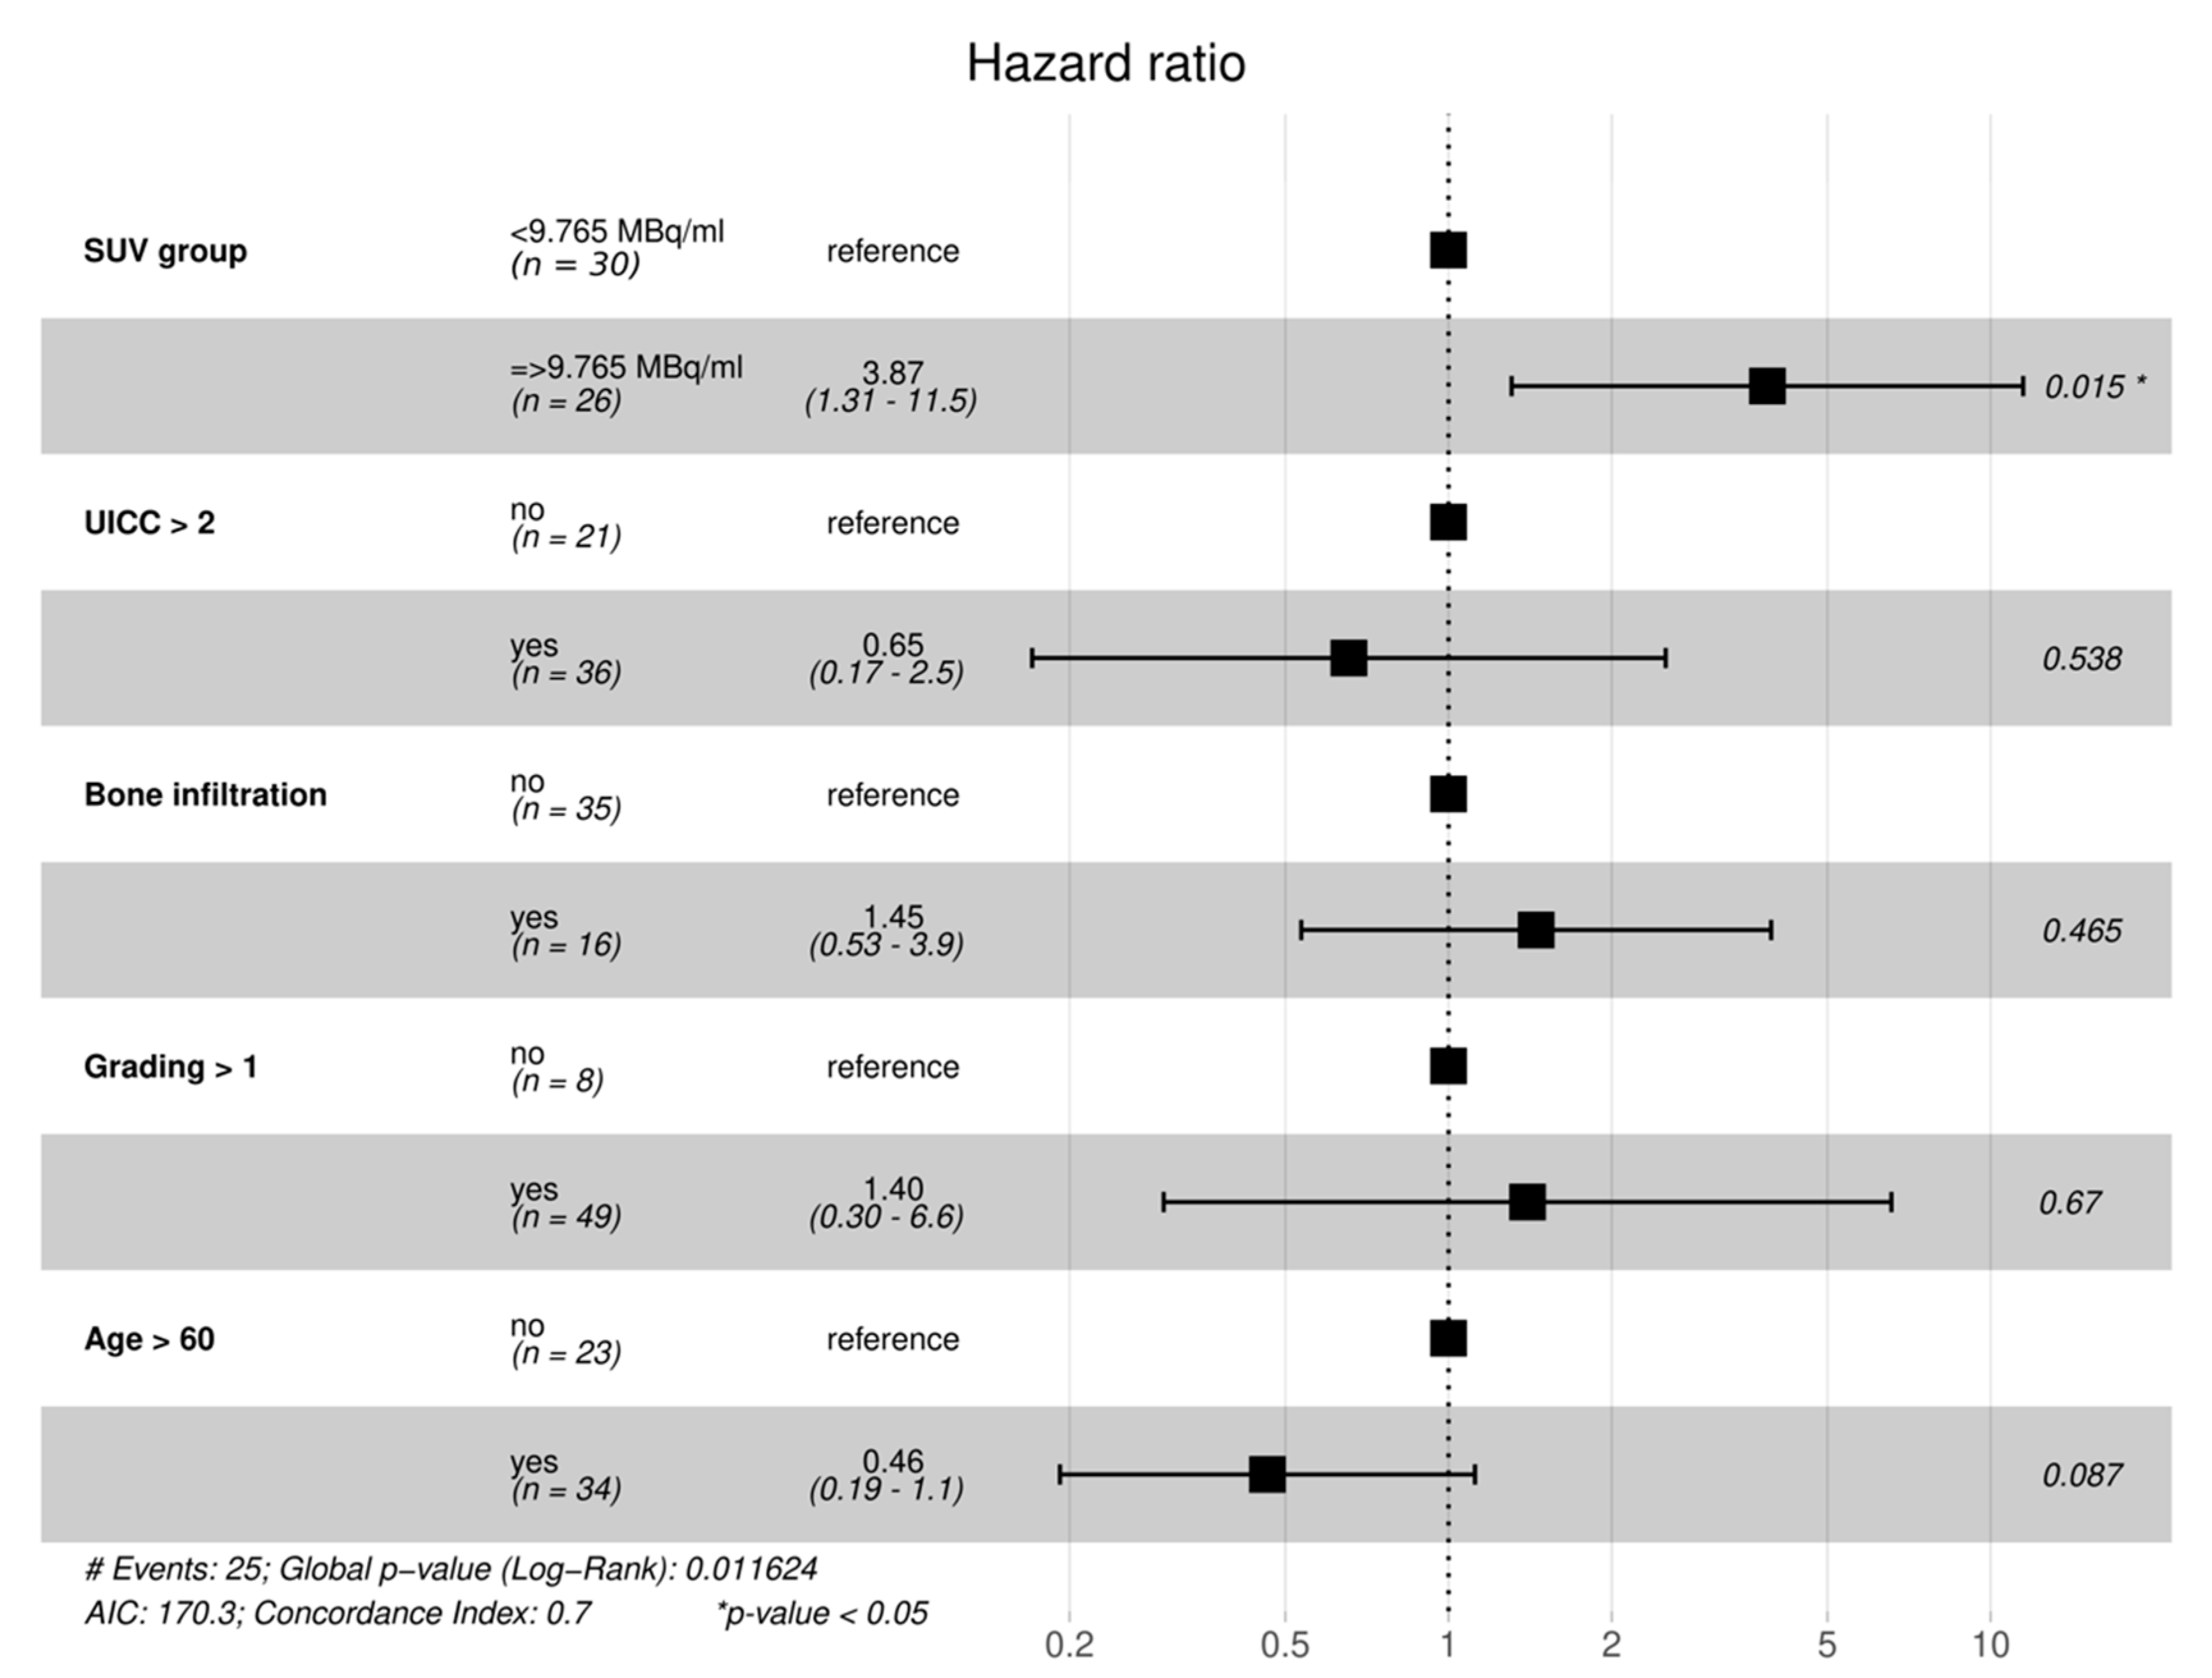
| VARIABLE | HR (95% CI) | p-VALUE |
|---|---|---|
| HIGH SUVMAX | 4.0 (1.7–9) | 0.0011 |
| AGE ≥ 60 | 0.44 (0.21–0.94) | 0.033 |
| BONE_INFILTRATION | 2.2 (1–5) | 0.051 |
| UICC ≥ 3 | 2.1 (0.91–5) | 0.08 |
| GRADING ≥ 2 | 1.6 (0.49–5.4) | 0.43 |
| FEMALE GENDER | 0.98 (0.46–2.1) | 0.95 |
Publisher’s Note: MDPI stays neutral with regard to jurisdictional claims in published maps and institutional affiliations. |
© 2021 by the authors. Licensee MDPI, Basel, Switzerland. This article is an open access article distributed under the terms and conditions of the Creative Commons Attribution (CC BY) license (https://creativecommons.org/licenses/by/4.0/).
Share and Cite
Latzko, L.; Schöpf, B.; Weissensteiner, H.; Fazzini, F.; Fendt, L.; Steiner, E.; Bruckmoser, E.; Schäfer, G.; Moncayo, R.-C.; Klocker, H.; et al. Implications of Standardized Uptake Values of Oral Squamous Cell Carcinoma in PET-CT on Prognosis, Tumor Characteristics and Mitochondrial DNA Heteroplasmy. Cancers 2021, 13, 2273. https://doi.org/10.3390/cancers13092273
Latzko L, Schöpf B, Weissensteiner H, Fazzini F, Fendt L, Steiner E, Bruckmoser E, Schäfer G, Moncayo R-C, Klocker H, et al. Implications of Standardized Uptake Values of Oral Squamous Cell Carcinoma in PET-CT on Prognosis, Tumor Characteristics and Mitochondrial DNA Heteroplasmy. Cancers. 2021; 13(9):2273. https://doi.org/10.3390/cancers13092273
Chicago/Turabian StyleLatzko, Lukas, Bernd Schöpf, Hansi Weissensteiner, Federica Fazzini, Liane Fendt, Eberhard Steiner, Emanuel Bruckmoser, Georg Schäfer, Roy-Cesar Moncayo, Helmut Klocker, and et al. 2021. "Implications of Standardized Uptake Values of Oral Squamous Cell Carcinoma in PET-CT on Prognosis, Tumor Characteristics and Mitochondrial DNA Heteroplasmy" Cancers 13, no. 9: 2273. https://doi.org/10.3390/cancers13092273