
Integration of Urinary EN2 Protein & Cell-Free RNA Data in the Development of a Multivariable Risk Model for the Detection of Prostate Cancer Prior to Biopsy

 ,
,  and
and
Abstract
:Simple Summary
Abstract
1. Introduction
2. Materials and Methods
2.1. Patient Population and Characteristics
2.2. Sample Processing and Analysis
2.3. Statistical Analysis
2.4. Feature Selection
2.5. Comparator Models
2.6. Model Construction
2.7. Statistical Evaluation of Models
3. Results
3.1. The ExoGrail Development Cohort
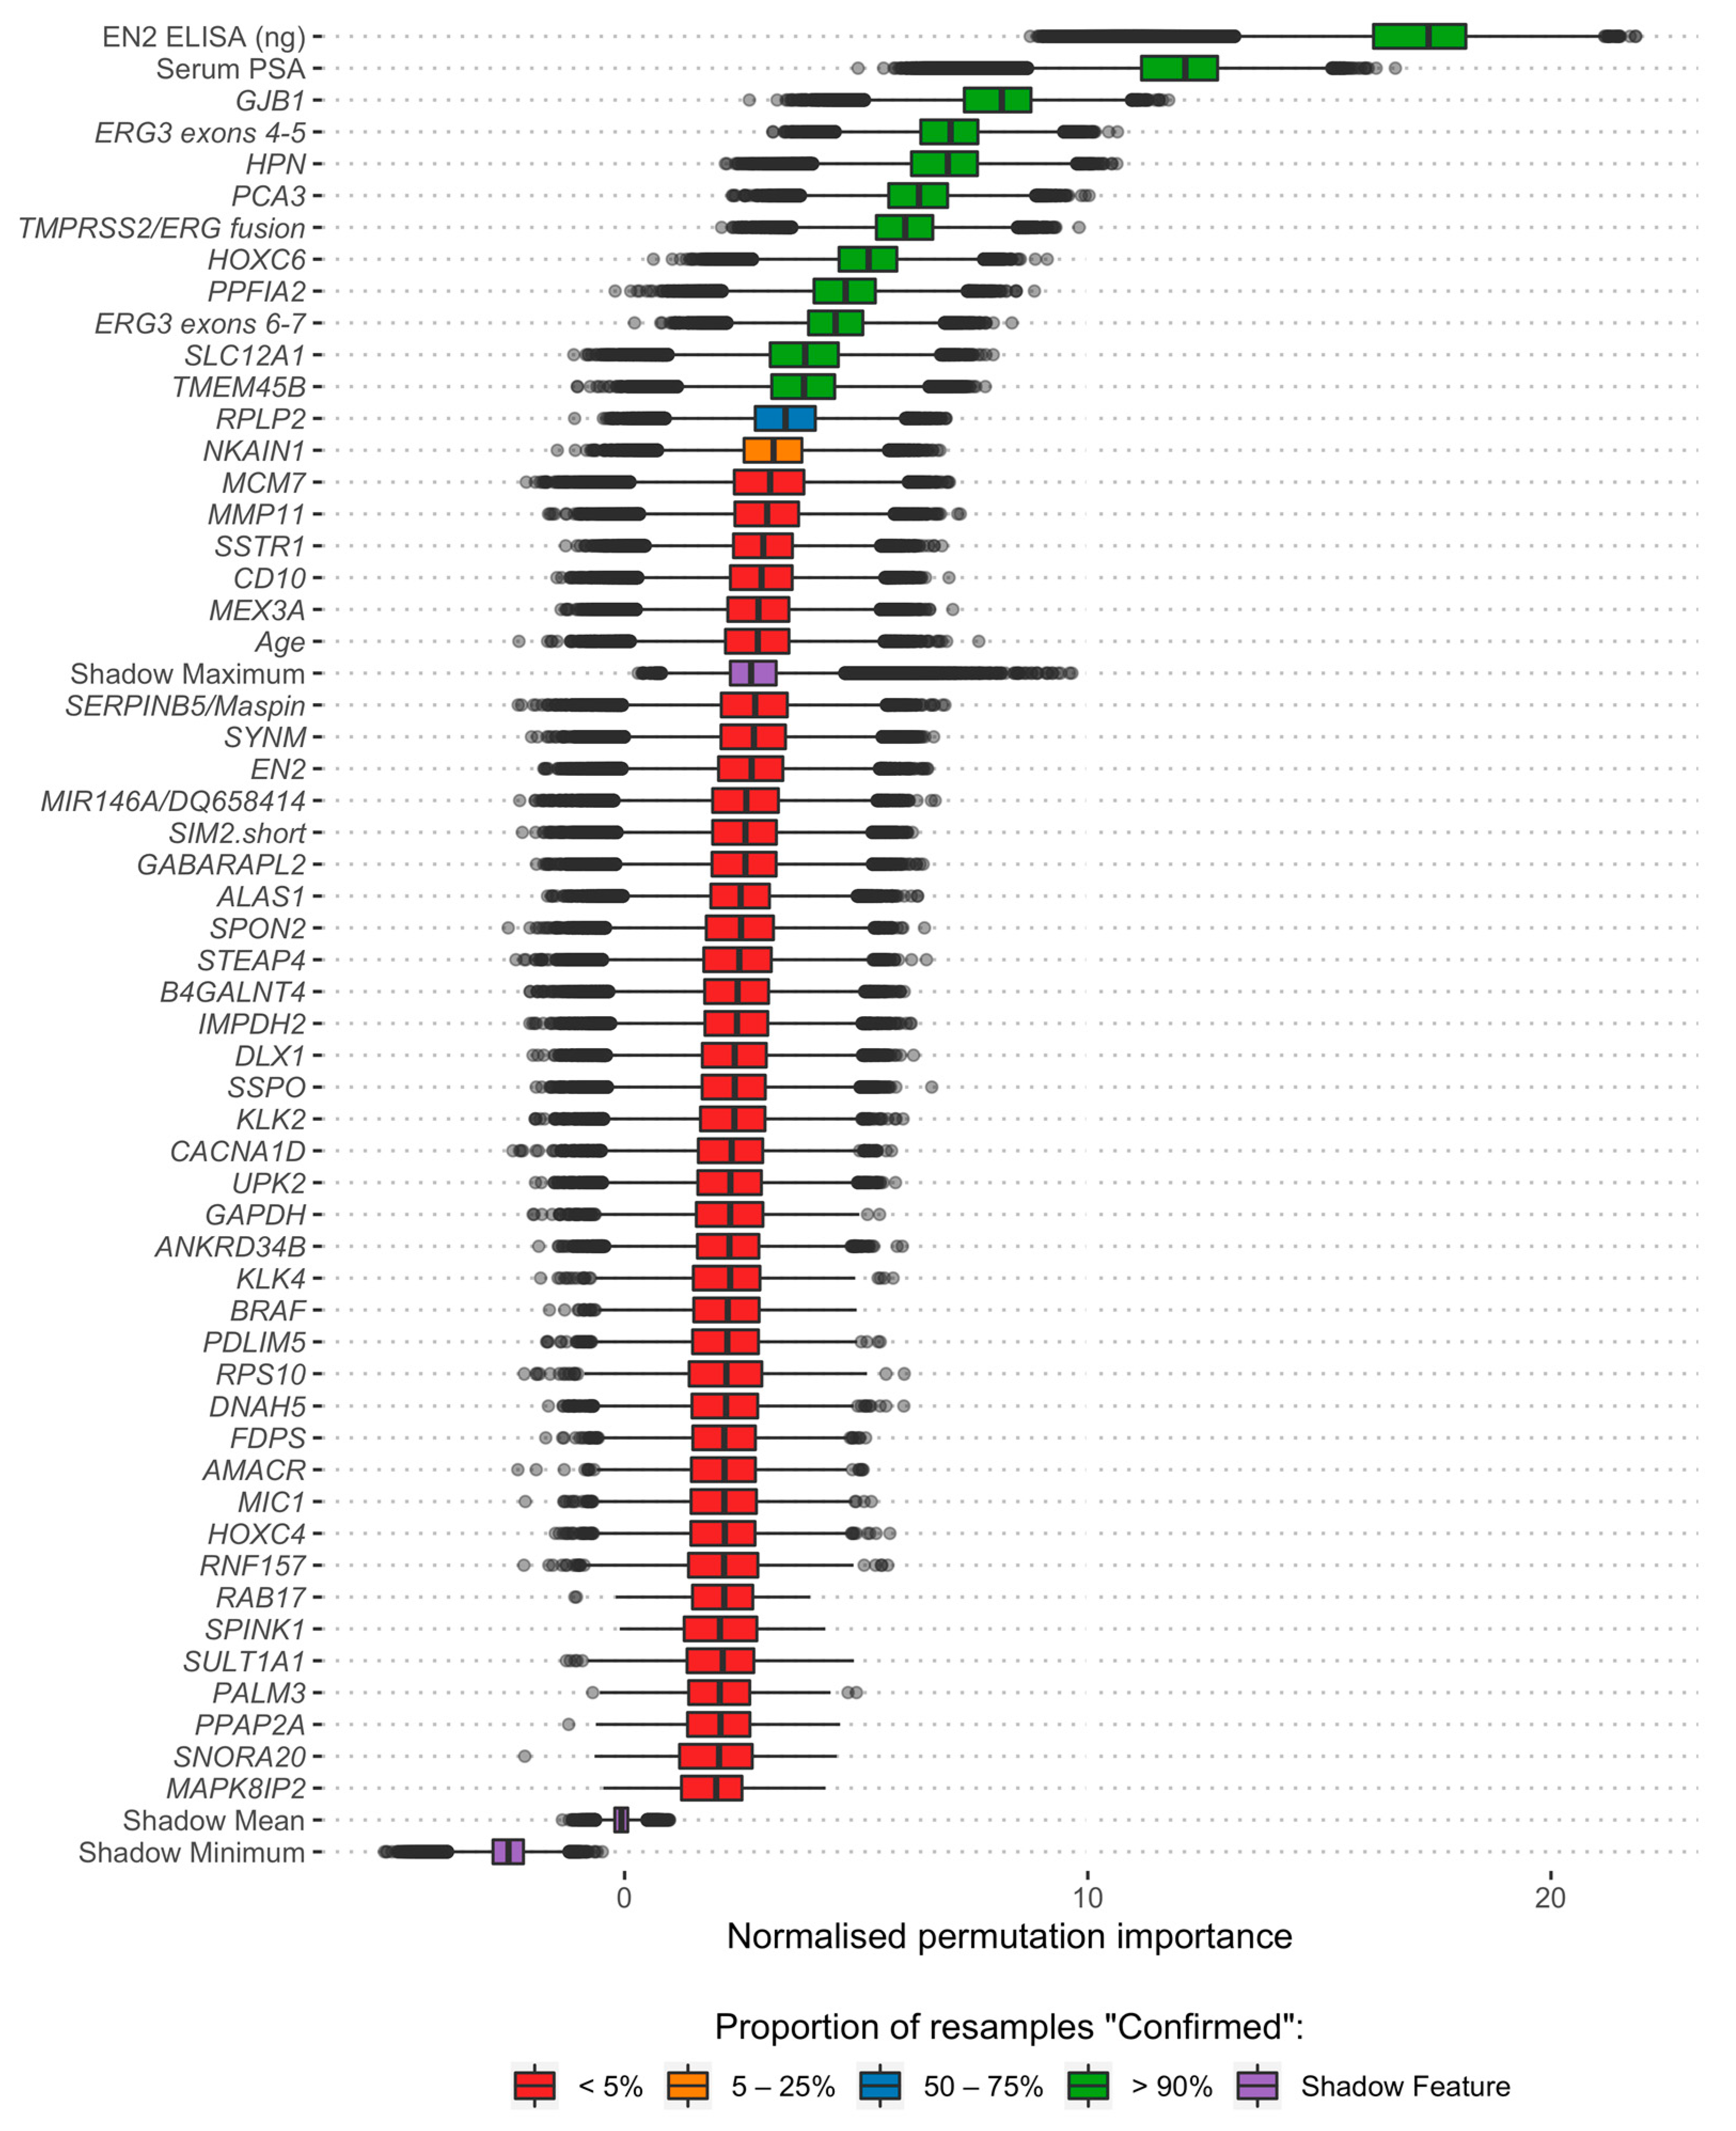
3.2. Feature Selection and Model Development
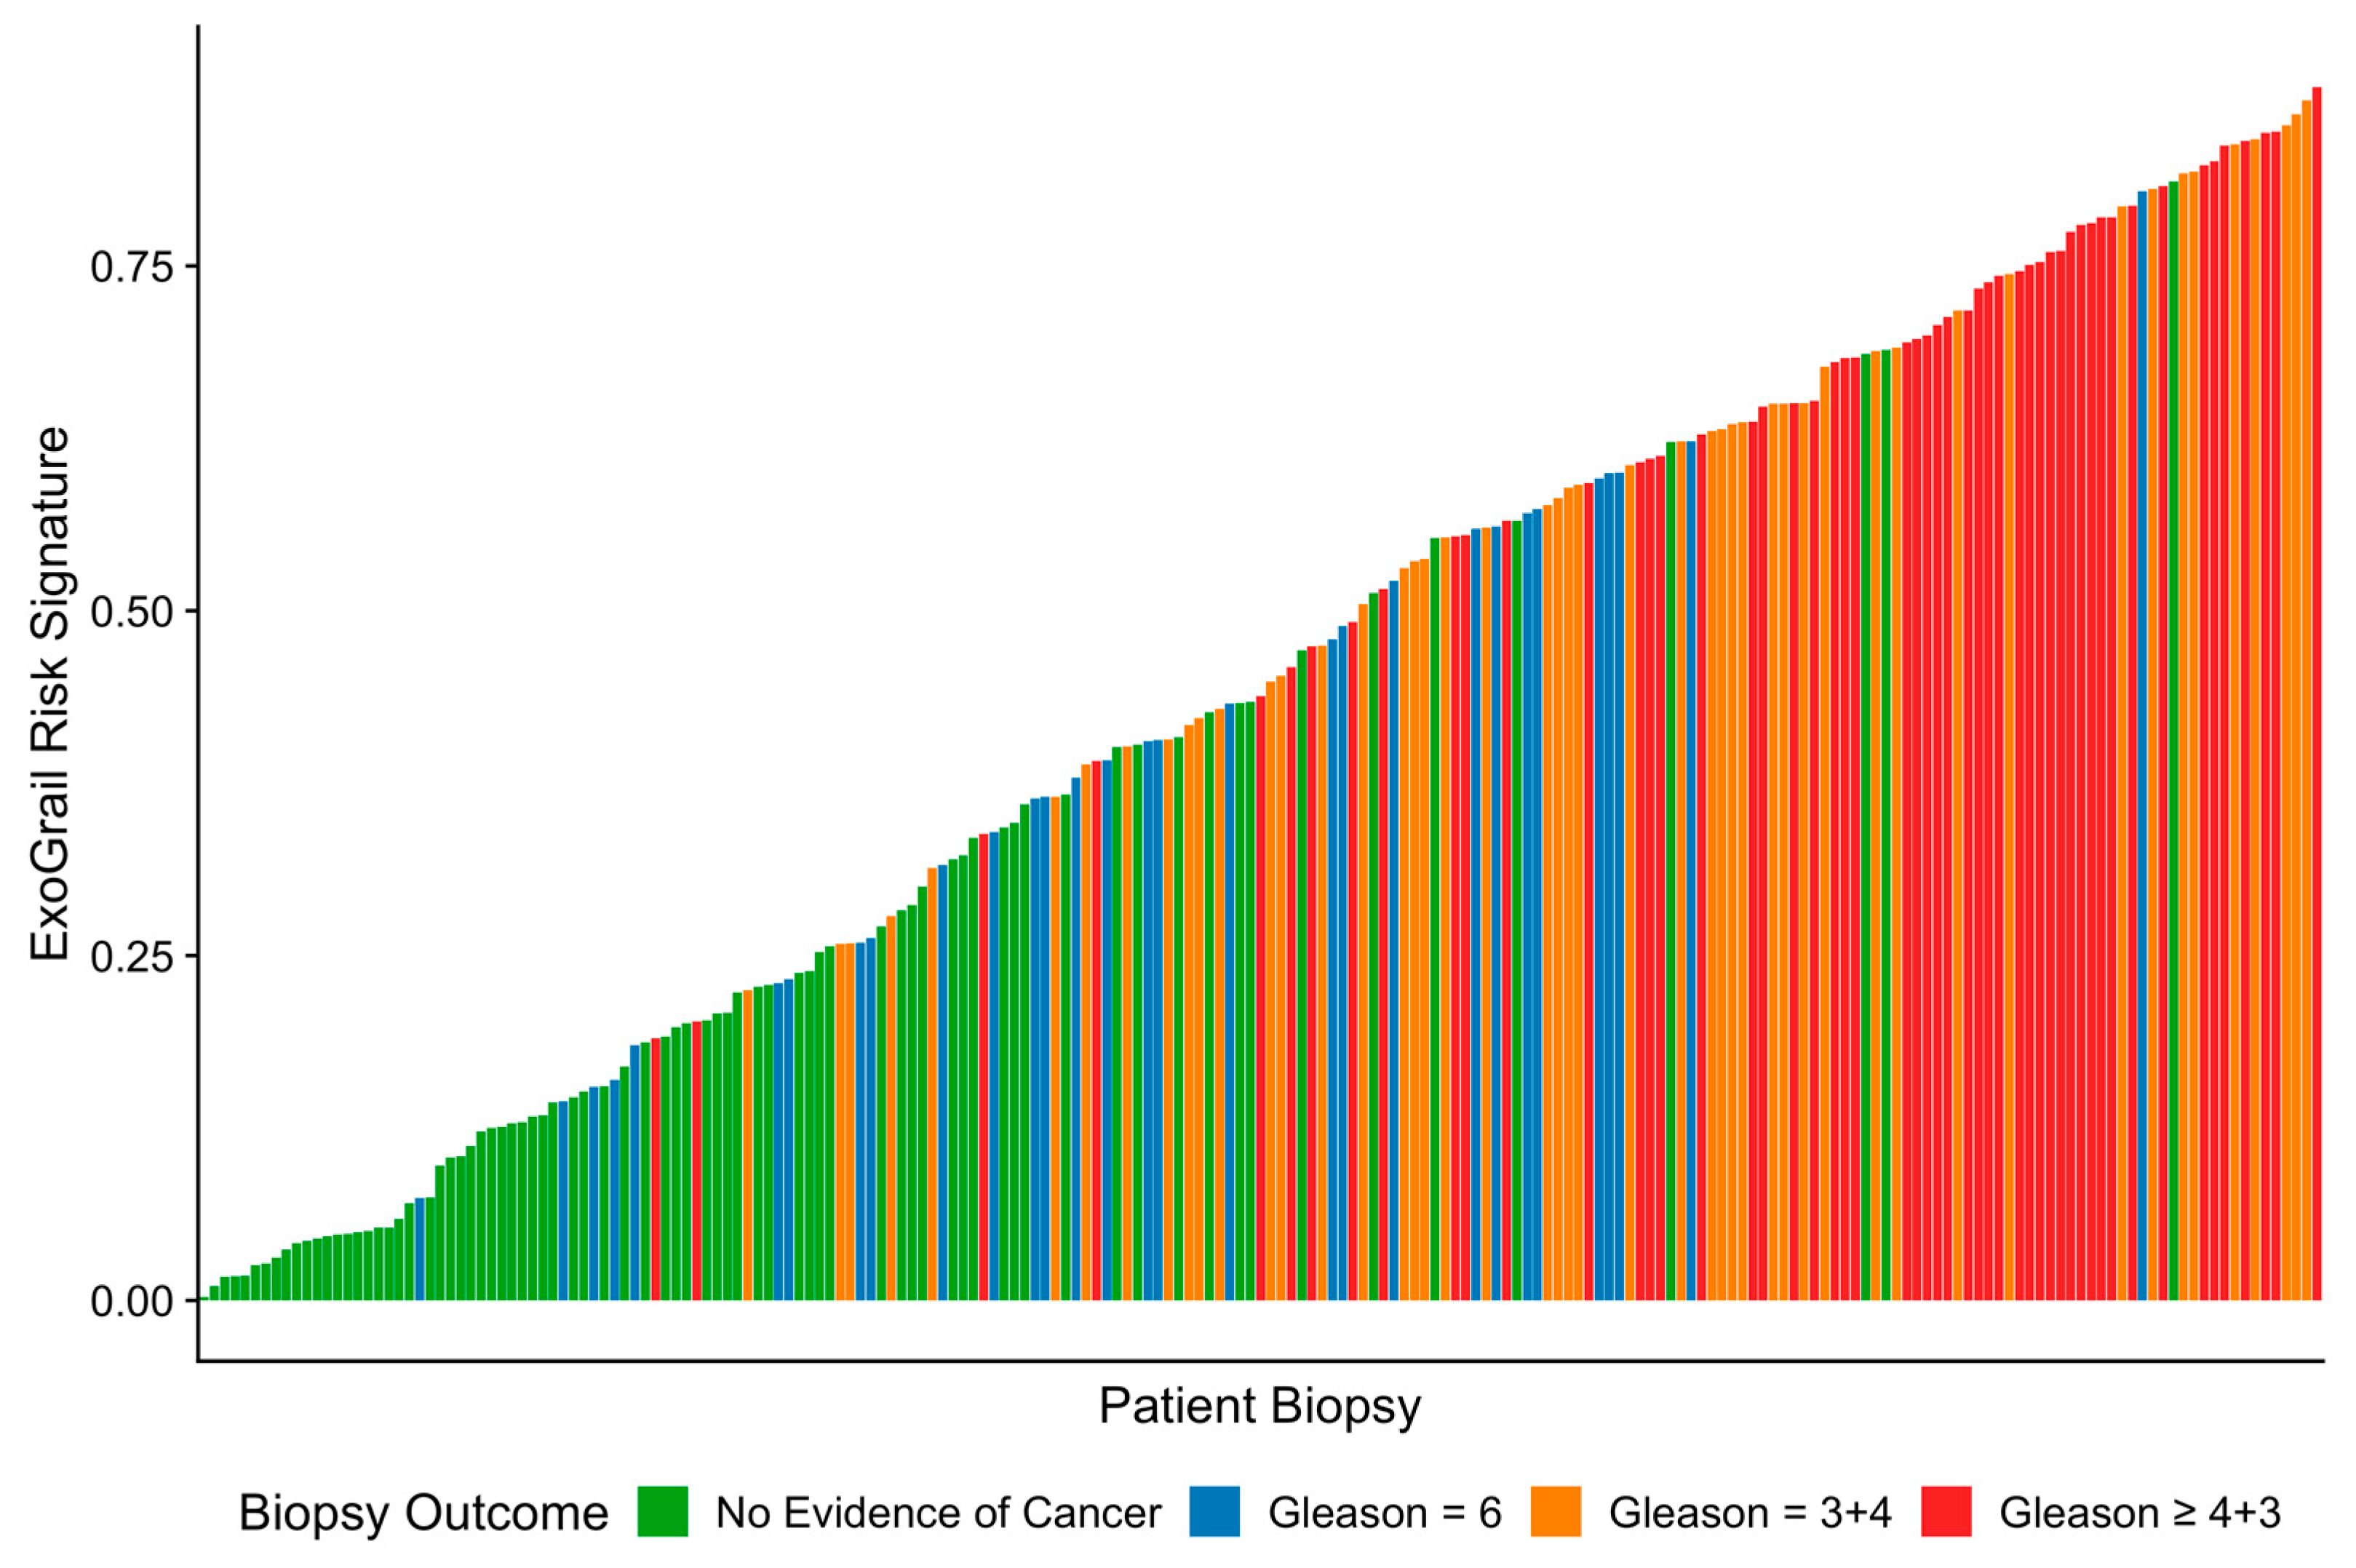
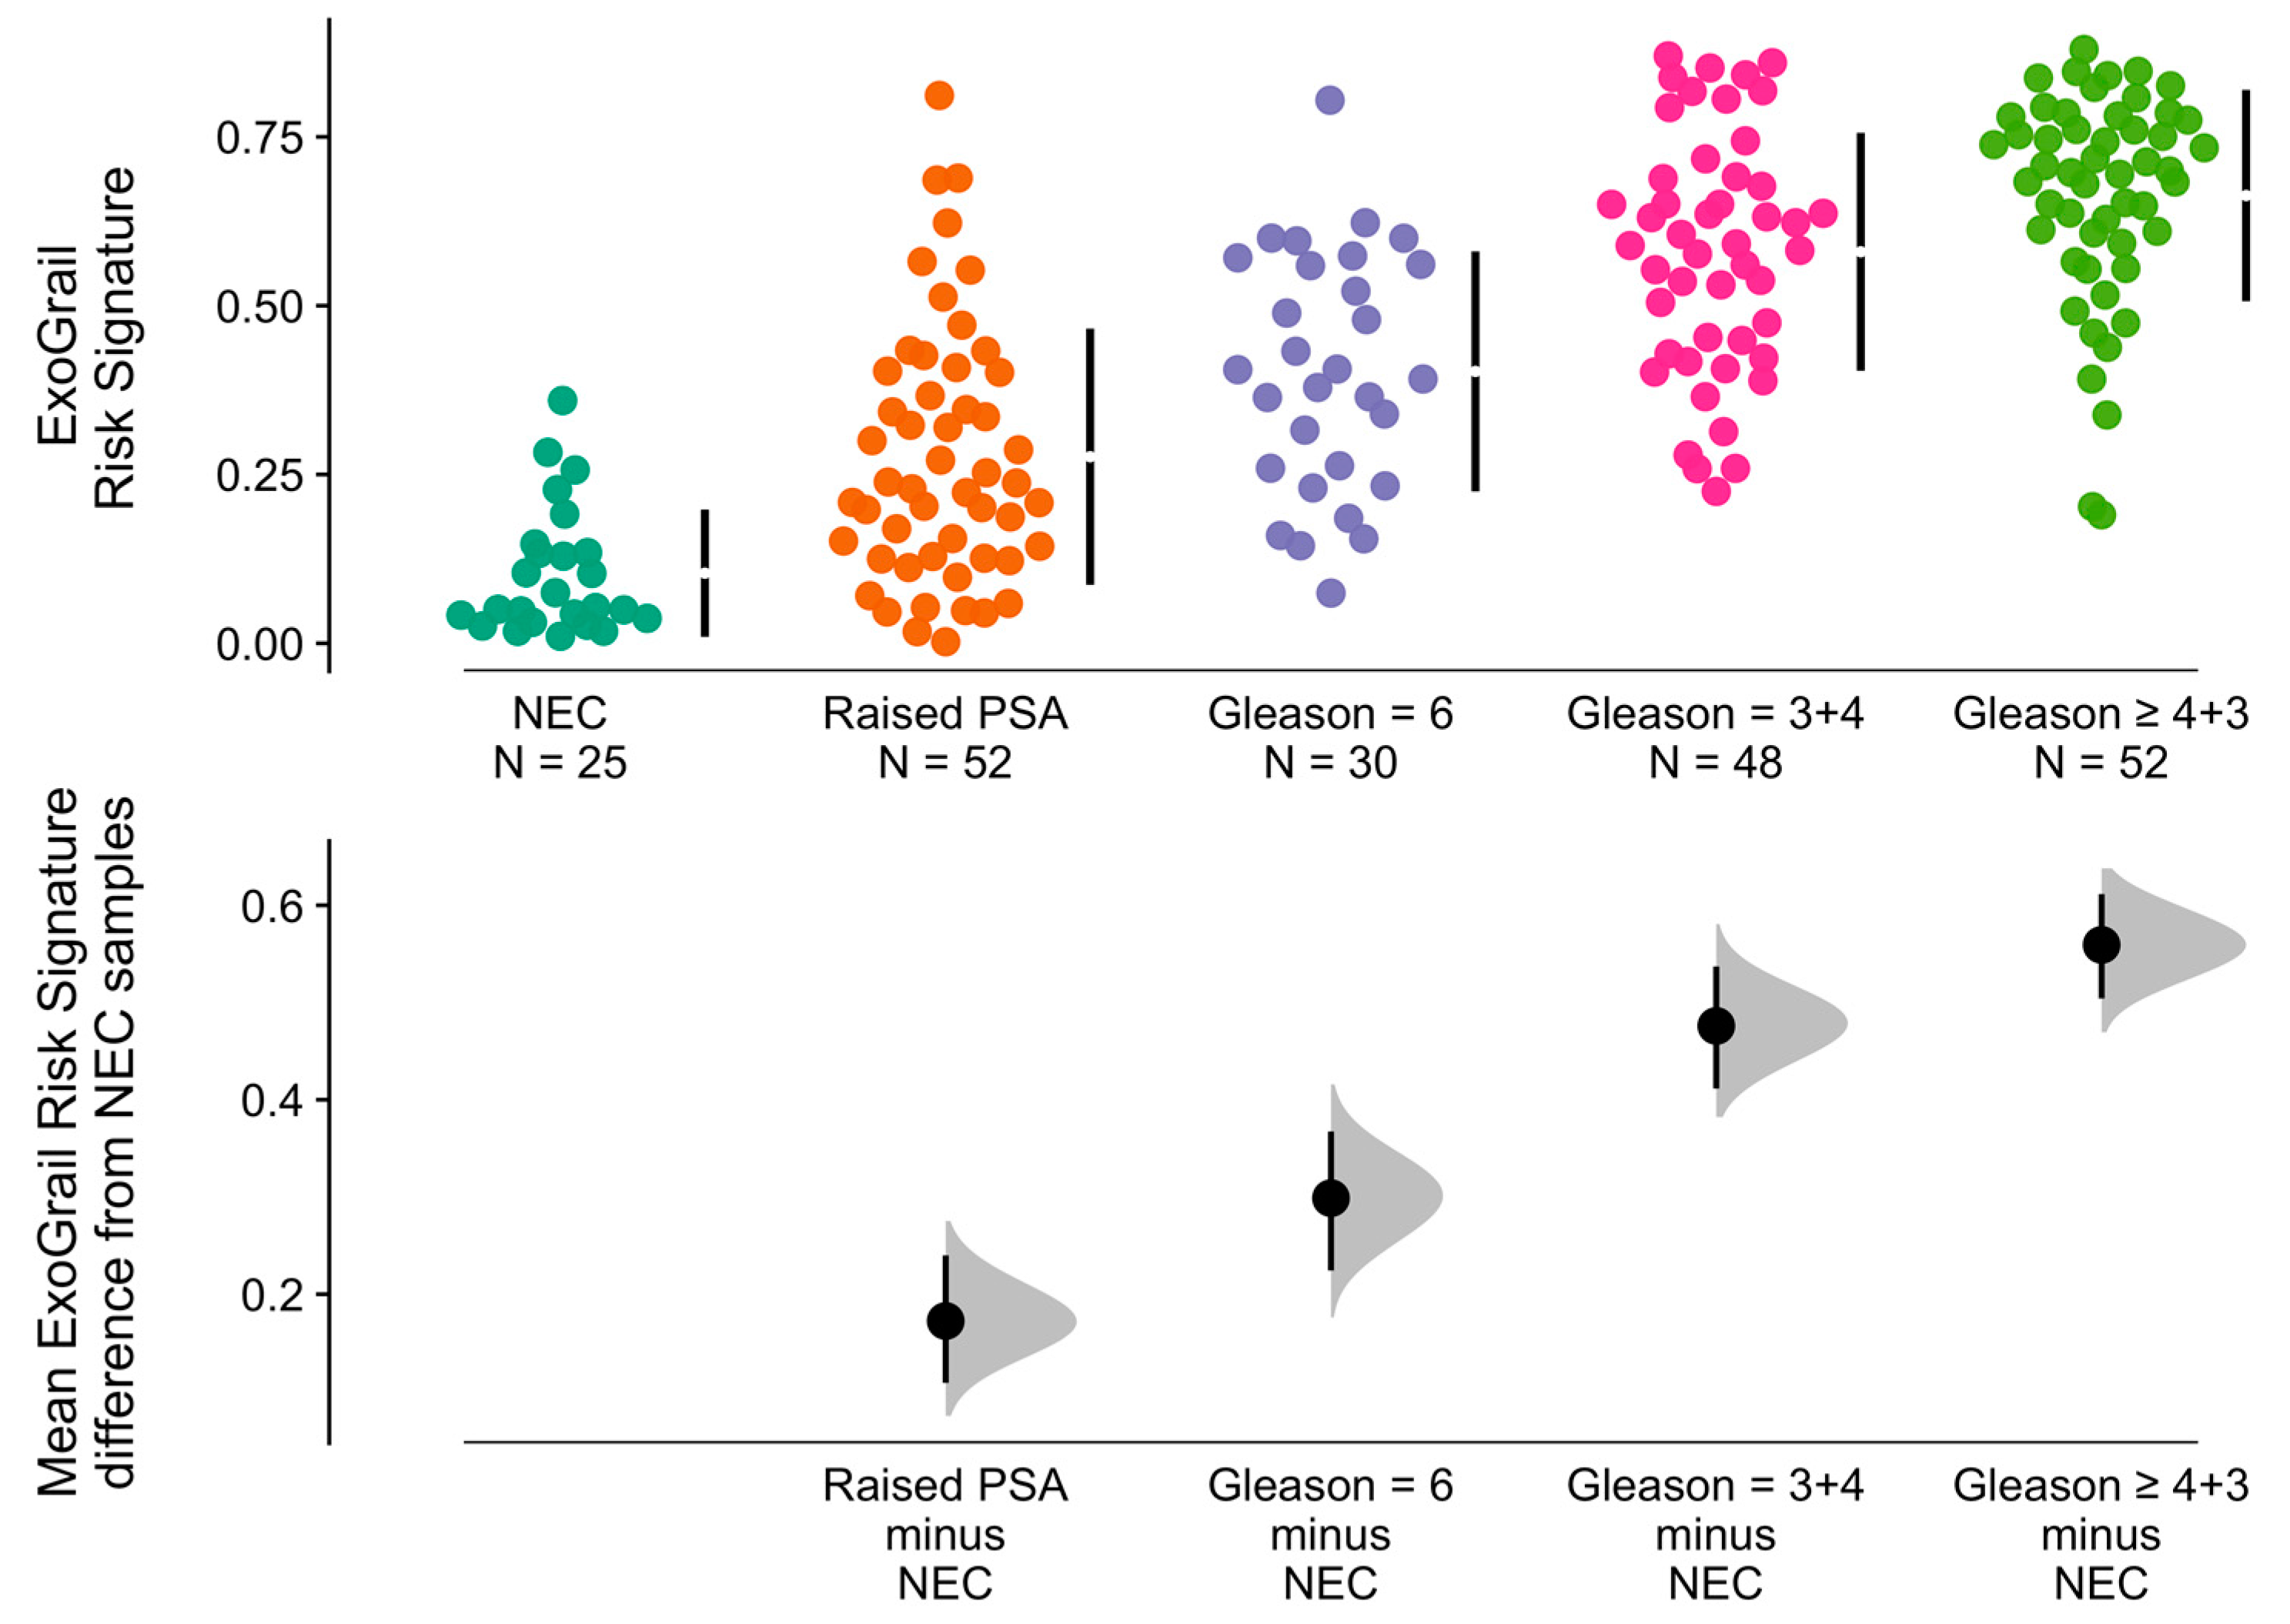
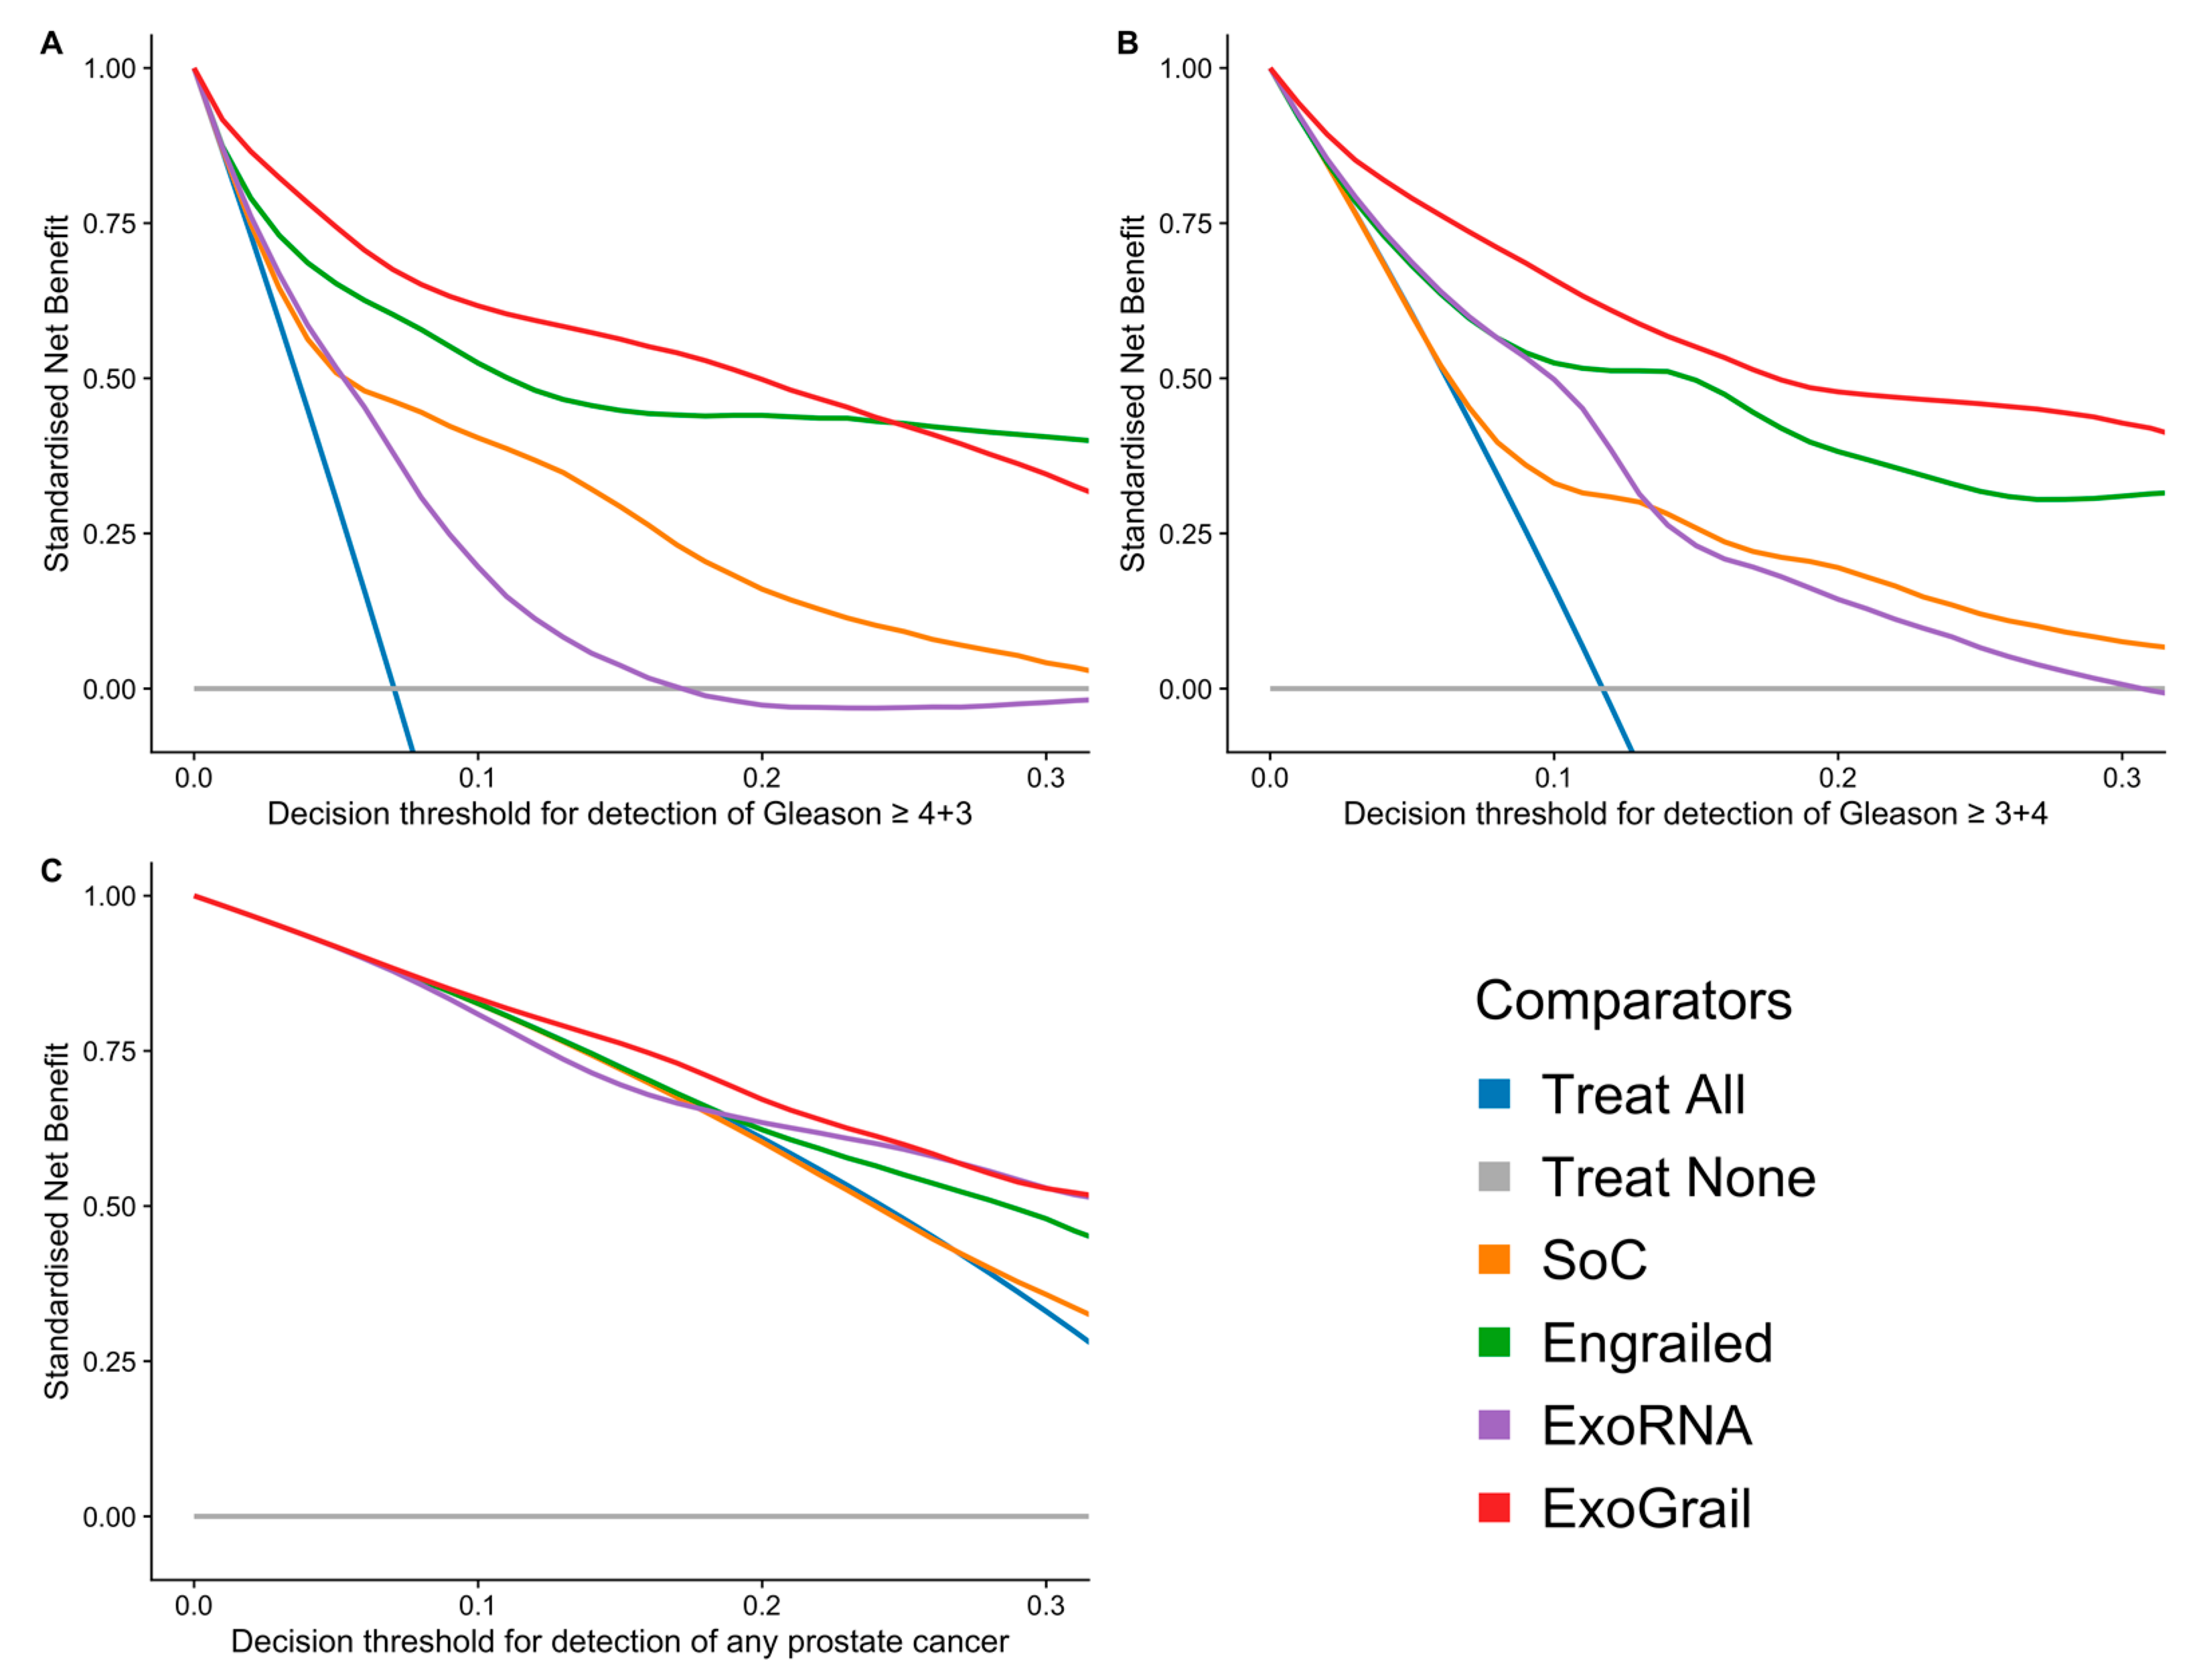
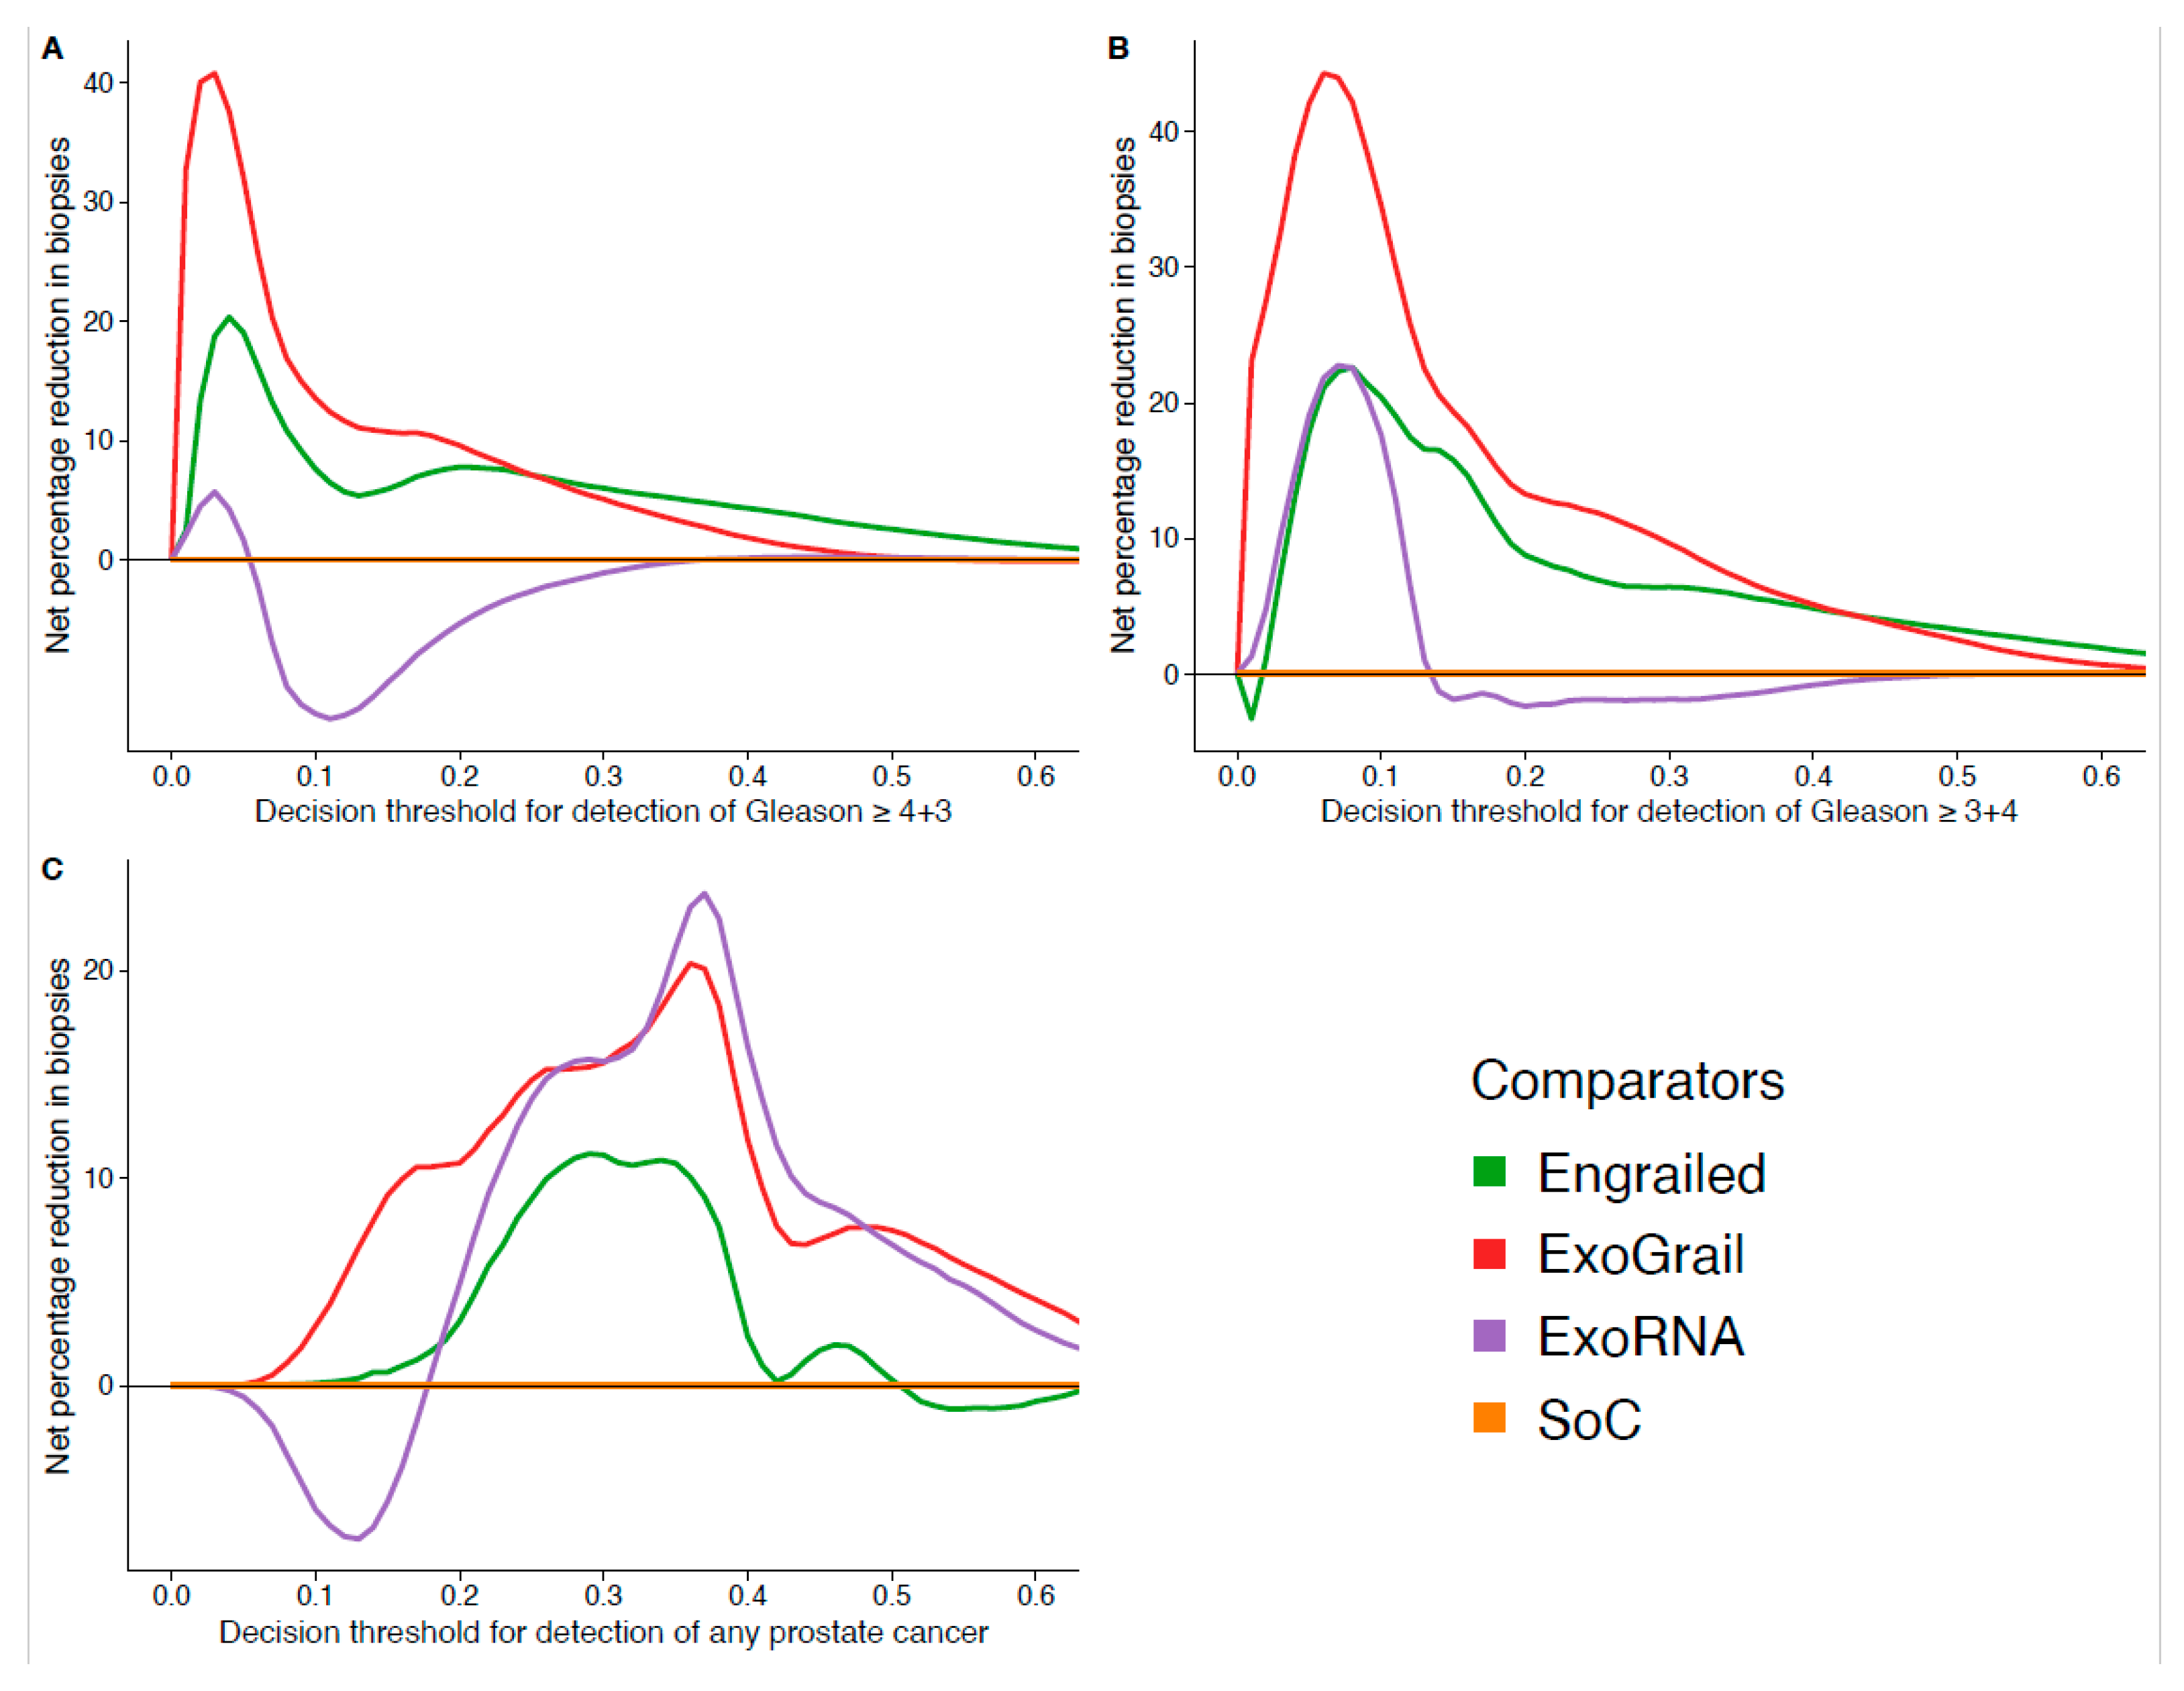
3.3. ExoGrail Predictive Ability
4. Discussion
5. Conclusions
6. Patents
Supplementary Materials
Author Contributions
Funding
Institutional Review Board Statement
Informed Consent Statement
Data Availability Statement
Acknowledgments
Conflicts of Interest
References
- Cancer Research UK Prostate Cancer Incidence Statistics. 2019. Available online: http://www.cancerresearchuk.org/health-professional/cancer-statistics/statistics-by-cancer-type/prostate-cancer/incidence (accessed on 29 June 2019).
- Loeb, S.; Bjurlin, M.A.; Nicholson, J.; Tammela, T.L.; Penson, D.F.; Carter, H.B.; Carroll, P.; Etzioni, R. Overdiagnosis and Overtreatment of Prostate Cancer. Eur. Urol. 2014, 65, 1046–1055. [Google Scholar] [CrossRef] [Green Version]
- Sanda, M.G.; Cadeddu, J.A.; Kirkby, E.; Chen, R.C.; Crispino, T.; Fontanarosa, J.; Freedland, S.J.; Greene, K.; Klotz, L.H.; Makarov, D.V.; et al. Clinically Localized Prostate Cancer: AUA/ASTRO/SUO Guideline. Part I: Risk Stratification, Shared Decision Making, and Care Options. J. Urol. 2018, 199, 683–690. [Google Scholar] [CrossRef]
- Cornford, P.; Bellmunt, J.; Bolla, M.; Briers, E.; De Santis, M.; Gross, T.; Henry, A.M.; Joniau, S.; Lam, T.B.; Mason, M.D.; et al. EAU-ESTRO-SIOG Guidelines on Prostate Cancer. Part II: Treatment of Relapsing, Metastatic, and Castration-Resistant Prostate Cancer. Eur. Urol. 2017, 71, 630–642. [Google Scholar] [CrossRef]
- National Institute for Health and Care Excellence. Prostate Cancer: Diagnosis and Management (Update); NICE: London, UK, 2015. [Google Scholar]
- Ahmed, H.U.; Bosaily, A.E.-S.; Brown, L.C.; Gabe, R.; Kaplan, R.; Parmar, M.K.; Collaco-Moraes, Y.; Ward, K.; Hindley, R.G.; Freeman, A.; et al. Diagnostic accuracy of multi-parametric MRI and TRUS biopsy in prostate cancer (PROMIS): A paired validating confirmatory study. Lancet 2017, 389, 815–822. [Google Scholar] [CrossRef] [Green Version]
- Pepe, P.; Pennisi, M. Gleason score stratification according to age at diagnosis in 1028 men. Współczesna Onkol. 2015, 19, 471–473. [Google Scholar] [CrossRef] [Green Version]
- Sonn, G.A.; Fan, R.E.; Ghanouni, P.; Wang, N.N.; Brooks, J.D.; Loening, A.M.; Daniel, B.L.; To’O, K.J.; Thong, A.E.; Leppert, J.T. Prostate Magnetic Resonance Imaging Interpretation Varies Substantially Across Radiologists. Eur. Urol. Focus 2019, 5, 592–599. [Google Scholar] [CrossRef] [PubMed] [Green Version]
- Walz, J. The “PROMIS” of Magnetic Resonance Imaging Cost Effectiveness in Prostate Cancer Diagnosis? Eur. Urol. 2018, 73, 31–32. [Google Scholar] [CrossRef] [PubMed]
- Moschini, M.; Spahn, M.; Mattei, A.; Cheville, J.; Karnes, R.J. Incorporation of tissue-based genomic biomarkers into localized prostate cancer clinics. BMC Med. 2016, 14, 67. [Google Scholar] [CrossRef] [PubMed] [Green Version]
- Luca, B.-A.; Brewer, D.S.; Edwards, D.R.; Edwards, S.; Whitaker, H.C.; Merson, S.; Dennis, N.; Cooper, R.A.; Hazell, S.; Warren, A.Y.; et al. DESNT: A Poor Prognosis Category of Human Prostate Cancer. Eur. Urol. Focus 2018, 4, 842–850. [Google Scholar] [CrossRef] [Green Version]
- Knezevic, D.; Goddard, A.D.; Natraj, N.; Cherbavaz, D.B.; Clark-Langone, K.M.; Snable, J.; Watson, D.; Falzarano, S.M.; Magi-Galluzzi, C.; Klein, E.A.; et al. Analytical validation of the Oncotype DX prostate cancer assay—A clinical RT-PCR assay optimized for prostate needle biopsies. BMC Genom. 2013, 14, 690. [Google Scholar] [CrossRef] [PubMed] [Green Version]
- Cuzick, J.; Berney, D.M.; Fisher, G.J.; Mesher, D.; Moller, H.; Reid, J.; Perry, M.B.A.; Park, J.; Younus, A.; on behalf of the Transatlantic Prostate Group; et al. Prognostic value of a cell cycle progression signature for prostate cancer death in a conservatively managed needle biopsy cohort. Br. J. Cancer 2012, 106, 1095–1099. [Google Scholar] [CrossRef] [Green Version]
- Luca, B.-A.; Moulton, V.; Ellis, C.; Edwards, D.R.; Campbell, C.; Cooper, R.A.; Clark, J.; Brewer, D.S.; Cooper, C.S. A novel stratification framework for predicting outcome in patients with prostate cancer. Br. J. Cancer 2020, 122, 1467–1476. [Google Scholar] [CrossRef] [PubMed] [Green Version]
- Cooperberg, M.R.; Davicioni, E.; Crisan, A.; Jenkins, R.B.; Ghadessi, M.; Karnes, R.J. Combined Value of Validated Clinical and Genomic Risk Stratification Tools for Predicting Prostate Cancer Mortality in a High-risk Prostatectomy Cohort. Eur. Urol. 2015, 67, 326–333. [Google Scholar] [CrossRef] [PubMed] [Green Version]
- Eklund, M.; Nordström, T.; Aly, M.; Adolfsson, J.; Wiklund, P.; Brandberg, Y.; Thompson, J.; Wiklund, F.; Lindberg, J.; Presti, J.C.; et al. The Stockholm-3 (STHLM3) Model can Improve Prostate Cancer Diagnostics in Men Aged 50–69 yr Compared with Current Prostate Cancer Testing. Eur. Urol. Focus 2018, 4, 707–710. [Google Scholar] [CrossRef] [PubMed]
- Tosoian, J.J.; Carter, H.B.; Lepor, A.; Loeb, S. Active surveillance for prostate cancer: Current evidence and contemporary state of practice. Nat. Rev. Urol. 2016, 13, 205–215. [Google Scholar] [CrossRef] [PubMed] [Green Version]
- Frick, J.; Aulitzky, W. Physiology of the prostate. Infection 1991, 19 (Suppl. 3), S115–S118. [Google Scholar] [CrossRef] [PubMed]
- Morgan, R.; Boxall, A.; Bhatt, A.; Bailey, M.; Hindley, R.; Langley, S.; Whitaker, H.C.; Neal, D.E.; Ismail, M.; Whitaker, H.; et al. Engrailed-2 (EN2): A Tumor Specific Urinary Biomarker for the Early Diagnosis of Prostate Cancer. Clin. Cancer Res. 2011, 17, 1090–1098. [Google Scholar] [CrossRef] [Green Version]
- Van Neste, L.; Hendriks, R.J.; Dijkstra, S.; Trooskens, G.; Cornel, E.B.; Jannink, S.A.; de Jong, H.; Hessels, D.; Smit, F.P.; Melchers, W.J.; et al. Detection of High-grade Prostate Cancer Using a Urinary Molecular Biomarker–Based Risk Score. Eur. Urol. 2016, 70, 740–748. [Google Scholar] [CrossRef] [PubMed]
- McKiernan, J.; Donovan, M.J.; O’Neill, V.; Bentink, S.; Noerholm, M.; Belzer, S.; Skog, J.; Kattan, M.W.; Partin, A.; Andriole, G.; et al. A Novel Urine Exosome Gene Expression Assay to Predict High-grade Prostate Cancer at Initial Biopsy. JAMA Oncol. 2016, 2, 882–889. [Google Scholar] [CrossRef] [PubMed] [Green Version]
- Haese, A.; Trooskens, G.; Steyaert, S.; Hessels, D.; Brawer, M.; Vlaeminck-Guillem, V.; Ruffion, A.; Tilki, D.; Schalken, J.; Groskopf, J.; et al. Multicenter Optimization and Validation of a 2-Gene mRNA Urine Test for Detection of Clinically Significant Prostate Cancer before Initial Prostate Biopsy. J. Urol. 2019, 202, 256–263. [Google Scholar] [CrossRef]
- Connell, S.P.; O’Reilly, E.; Tuzova, A.; Webb, M.; Hurst, R.; Mills, R.; Zhao, F.; Bapat, B.; Cooper, C.S.; Perry, A.S.; et al. Development of a multivariable risk model integrating urinary cell DNA methylation and cell-free RNA data for the detection of significant prostate cancer. Prostate 2020, 80, 547–558. [Google Scholar] [CrossRef] [PubMed]
- Morgan, R. Engrailed: Complexity and economy of a multi-functional transcription factor. FEBS Lett. 2006, 580, 2531–2533. [Google Scholar] [CrossRef] [Green Version]
- Punia, N.; Primon, M.; Simpson, G.R.; Pandha, H.S.; Morgan, R. Membrane insertion and secretion of the Engrailed-2 (EN2) transcription factor by prostate cancer cells may induce antiviral activity in the stroma. Sci. Rep. 2019, 9, 5138. [Google Scholar] [CrossRef] [PubMed]
- Pandha, H.; Sorensen, K.D.; Orntoft, T.F.; Langley, S.; Hoyer, S.; Borre, M.; Morgan, R. Urinary engrailed-2 (EN2) levels predict tumour volume in men undergoing radical prostatectomy for prostate cancer. BJU Int. 2012, 110, E287–E292. [Google Scholar] [CrossRef] [PubMed]
- Elamin, A.A.; Klunkelfuß, S.; Kämpfer, S.; Oehlmann, W.; Stehr, M.; Smith, C.; Simpson, G.R.; Morgan, R.; Pandha, H.; Singh, M. A Specific Blood Signature Reveals Higher Levels of S100A12: A Potential Bladder Cancer Diagnostic Biomarker Along with Urinary Engrailed-2 Protein Detection. Front. Oncol. 2020, 9, 1484. [Google Scholar] [CrossRef]
- Stark, J.R.; Perner, S.; Stampfer, M.J.; Sinnott, J.A.; Finn, S.; Eisenstein, A.S.; Ma, J.; Fiorentino, M.; Kurth, T.; Loda, M.; et al. Gleason Score and Lethal Prostate Cancer: Does 3 + 4 = 4 + 3? J. Clin. Oncol. 2009, 27, 3459–3464. [Google Scholar] [CrossRef]
- Collins, G.S.; Reitsma, J.B.; Altman, D.G.; Moons, K.G. Transparent Reporting of a Multivariable Prediction Model for Individual Prognosis or Diagnosis (TRIPOD): The TRIPOD Statement. Eur. Urol. 2015, 67, 1142–1151. [Google Scholar] [CrossRef] [Green Version]
- R Core Team. R: A Language and Environment for Statistical Computing; R Core Team: Vienna, Austria, 2019. [Google Scholar]
- UEA Cancer Genetic GitHub Repository. Available online: https://github.com/UEA-Cancer-Genetics-Lab/ExoGrail (accessed on 21 April 2021).
- Guyon, I.; Elisseeff, A. An Introduction to Variable and Feature Selection. J. Mach. Learn. Res. 2003, 3, 1157–1182. [Google Scholar]
- Kursa, M.B.; Rudnicki, W.R. Feature Selection with theBorutaPackage. J. Stat. Softw. 2010, 36, 1–13. [Google Scholar] [CrossRef] [Green Version]
- Breiman, L. Random Forests. Mach. Learn. 2001, 45, 5–32. [Google Scholar] [CrossRef] [Green Version]
- Liaw, A.; Wiener, M. Classification and Regression by randomForest. R News 2002, 2, 18–22. [Google Scholar]
- Robin, X.A.; Turck, N.; Hainard, A.; Tiberti, N.; Lisacek, F.; Sanchez, J.-C.; Muller, M.J. pROC: An open-source package for R and S+ to analyze and compare ROC curves. BMC Bioinform. 2011, 12, 77. [Google Scholar] [CrossRef] [PubMed]
- Wickham, H. ggplot2: Elegant Graphics for Data Analysis; Springer: New York, NY, USA, 2016; ISBN 978-3-319-24277-4. [Google Scholar]
- Greenwell, B.M. Pdp: An r Package for Constructing Partial Dependence Plots. R J. 2017, 9, 421–436. [Google Scholar] [CrossRef] [Green Version]
- Ho, J.; Tumkaya, T.; Aryal, S.; Choi, H.; Claridge-Chang, A. Moving beyond P values: Data analysis with estimation graphics. Nat. Methods 2019, 16, 565–566. [Google Scholar] [CrossRef] [PubMed]
- Vickers, A.J.; Elkin, E.B. Decision Curve Analysis: A Novel Method for Evaluating Prediction Models. Med. Decis. Mak. 2006, 26, 565–574. [Google Scholar] [CrossRef] [PubMed] [Green Version]
- Brown, M. rmda: Risk Model Decision Analysis; Fred Hutchinson Cancer Research Center: Seattle, WA, USA, 2018. [Google Scholar]
- Kerr, K.F.; Brown, M.D.; Zhu, K.; Janes, H. Assessing the Clinical Impact of Risk Prediction Models with Decision Curves: Guidance for Correct Interpretation and Appropriate Use. J. Clin. Oncol. 2016, 34, 2534–2540. [Google Scholar] [CrossRef] [Green Version]
- Martin, R.M.; Donovan, J.L.; Turner, E.L.; Metcalfe, C.; Young, G.J.; Walsh, E.I.; Lane, J.A.; Noble, S.; Oliver, S.E.; Evans, S.; et al. Effect of a Low-Intensity PSA-Based Screening Intervention on Prostate Cancer Mortality: The CAP randomized clinical trial. JAMA 2018, 319, 883–895. [Google Scholar] [CrossRef] [Green Version]
- Lane, J.A.; Donovan, J.L.; Davis, M.; Walsh, E.; Dedman, D.; Down, L.; Turner, E.L.; Mason, M.D.; Metcalfe, C.; Peters, T.J.; et al. Active monitoring, radical prostatectomy, or radiotherapy for localised prostate cancer: Study design and diagnostic and baseline results of the ProtecT randomised phase 3 trial. Lancet Oncol. 2014, 15, 1109–1118. [Google Scholar] [CrossRef] [Green Version]
- Hessels, D.; Gunnewiek, J.M.K.; van Oort, I.; Karthaus, H.F.; van Leenders, G.J.; van Balken, B.; Kiemeney, L.A.; Witjes, J.; Schalken, J.A. DD3PCA3-based Molecular Urine Analysis for the Diagnosis of Prostate Cancer. Eur. Urol. 2003, 44, 8–16. [Google Scholar] [CrossRef]
- Connell, S.P.; Yazbek-Hanna, M.; McCarthy, F.; Hurst, R.; Webb, M.; Curley, H.; Walker, H.; Mills, R.; Ball, R.Y.; Sanda, M.G.; et al. A four-group urine risk classifier for predicting outcomes in patients with prostate cancer. BJU Int. 2019, 124, 609–620. [Google Scholar] [CrossRef] [Green Version]
- Ciccarese, C.; Massari, F.; Iacovelli, R.; Fiorentino, M.; Montironi, R.; Di Nunno, V.; Giunchi, F.; Brunelli, M.; Tortora, G. Prostate cancer heterogeneity: Discovering novel molecular targets for therapy. Cancer Treat. Rev. 2017, 54, 68–73. [Google Scholar] [CrossRef]
- Strand, S.H.; Bavafaye-Haghighi, E.; Kristensen, H.; Rasmussen, A.K.; Hoyer, S.; Borre, M.; Mouritzen, P.; Besenbacher, S.; Orntoft, T.F.; Sorensen, K.D. A novel combined miRNA and methylation marker panel (miMe) for prediction of prostate cancer outcome after radical prostatectomy. Int. J. Cancer 2019, 145, 3445–3452. [Google Scholar] [CrossRef] [Green Version]
- O’Reilly, E.; Tuzova, A.V.; Walsh, A.L.; Russell, N.M.; O’Brien, O.; Kelly, S.; Ni Dhomhnallain, O.; DeBarra, L.; Dale, C.M.; Brugman, R.; et al. epiCaPture: A Urine DNA Methylation Test for Early Detection of Aggressive Prostate Cancer. JCO Precis. Oncol. 2019, 2019, 1–18. [Google Scholar] [CrossRef]
- Zhao, F.; Olkhov-Mitsel, E.; Kamdar, S.; Jeyapala, R.; Garcia, J.; Hurst, R.; Hanna, M.Y.; Mills, R.; Tuzova, A.V.; O’Reilly, E.; et al. A urine-based DNA methylation assay, ProCUrE, to identify clinically significant prostate cancer. Clin. Epigenet. 2018, 10, 147. [Google Scholar] [CrossRef]
- Xia, Y.; Huang, C.-C.; Dittmar, R.; Du, M.; Wang, Y.; Liu, H.; Shenoy, N.; Wang, L.; Kohli, M. Copy number variations in urine cell free DNA as biomarkers in advanced prostate cancer. Oncotarget 2016, 7, 35818–35831. [Google Scholar] [CrossRef] [Green Version]
- Killick, E.; Morgan, R.; Launchbury, F.; Bancroft, E.; Page, E.; Castro, E.; Kote-Jarai, Z.; Aprikian, A.; Blanco, I.; Clowes, V.; et al. Role of Engrailed-2 (EN2) as a prostate cancer detection biomarker in genetically high risk men. Sci. Rep. 2013, 3, 2059. [Google Scholar] [CrossRef] [Green Version]
- Tomlins, S.A.; Day, J.R.; Lonigro, R.J.; Hovelson, D.H.; Siddiqui, J.; Kunju, L.P.; Dunn, R.L.; Meyer, S.; Hodge, P.; Groskopf, J.; et al. Urine TMPRSS2:ERG Plus PCA3 for Individualized Prostate Cancer Risk Assessment. Eur. Urol. 2016, 70, 45–53. [Google Scholar] [CrossRef] [PubMed] [Green Version]
- Webb, M.; Manley, K.; Olivan, M.; Guldvik, I.; Palczynska, M.; Hurst, R.; Connell, S.P.; Mills, I.G.; Brewer, D.S.; Mills, R.; et al. Methodology for the at-home collection of urine samples for prostate cancer detection. Biotechniques 2020, 68, 65–71. [Google Scholar] [CrossRef] [PubMed]
- Wallden, B.; Storhoff, J.; Nielsen, T.; Dowidar, N.; Schaper, C.; Ferree, S.; Liu, S.; Leung, S.; Geiss, G.; Snider, J.; et al. Development and Verification of the PAM50-Based Prosigna Breast Cancer Gene Signature Assay. BMC Med. Genom. 2015, 8, 54. [Google Scholar] [CrossRef] [PubMed] [Green Version]


| No Cancer Finding: | Biopsy Positive Cancer Finding | |
|---|---|---|
| Collection Centre: | ||
| NNUH, n (%) | 77 (100) | 130 (100) |
| Age: | ||
| minimum | 45.00 | 53.00 |
| median (IQR) | 65.00 (59.00, 71.00) | 68.50 (65.00, 76.00) |
| mean (sd) | 65.22 ± 8.10 | 69.71 ± 7.67 |
| maximum | 82.00 | 91.00 |
| PSA: | ||
| minimum | 0.30 | 4.10 |
| median (IQR) | 6.10 (3.70, 8.80) | 10.35 (6.82, 16.48) |
| mean (sd) | 7.89 ± 8.72 | 17.08 ± 18.33 |
| maximum | 63.80 | 95.90 |
| Prostate Size (DRE Estimate): | ||
| Small, n (%) | 13 (17) | 13 (10) |
| Medium, n (%) | 34 (44) | 64 (49) |
| Large, n (%) | 21 (27) | 38 (29) |
| Unknown, n (%) | 9 (12) | 15 (12) |
| Gleason Score: | ||
| 0, n (%) | 77 (100) | 0 (0) |
| 6, n (%) | 0 (0) | 30 (23) |
| 3 + 4, n (%) | 0 (0) | 48 (37) |
| 4 + 3, n (%) | 0 (0) | 24 (18) |
| ≥8, n (%) | 0 (0) | 28 (22) |
| Biopsy Outcome: | ||
| No Biopsy, n (%) | 25 (32) | 0 (0) |
| Biopsy Negative, n (%) | 52 (68) | 0 (0) |
| Biopsy Positive, n (%) | 0 (0) | 130 (100) |
| SoC | Engrailed | ExoRNA | ExoGrail | |
|---|---|---|---|---|
| Clinical Parameters | Serum PSA | - | - | Serum PSA |
| Age | - | - | - | |
| ELISA Targets | EN2 (ELISA) | - | EN2 (ELISA) | |
| NanoString cf-RNA targets | ERG exons 4-5 | ERG exons 4-5 | ||
| ERG exons 6-7 | ERG exons 6-7 | |||
| GJB1 | GJB1 | |||
| HOXC6 | HOXC6 | |||
| HPN | HPN | |||
| NKAIN1 | - | |||
| PCA3 | PCA3 | |||
| PPFIA2 | PPFIA2 | |||
| RPLP2 | - | |||
| - | SLC12A1 | |||
| TMEM45B | TMEM45B | |||
| TMPRSS2/ERG fusion | TMPRSS2/ERG fusion |
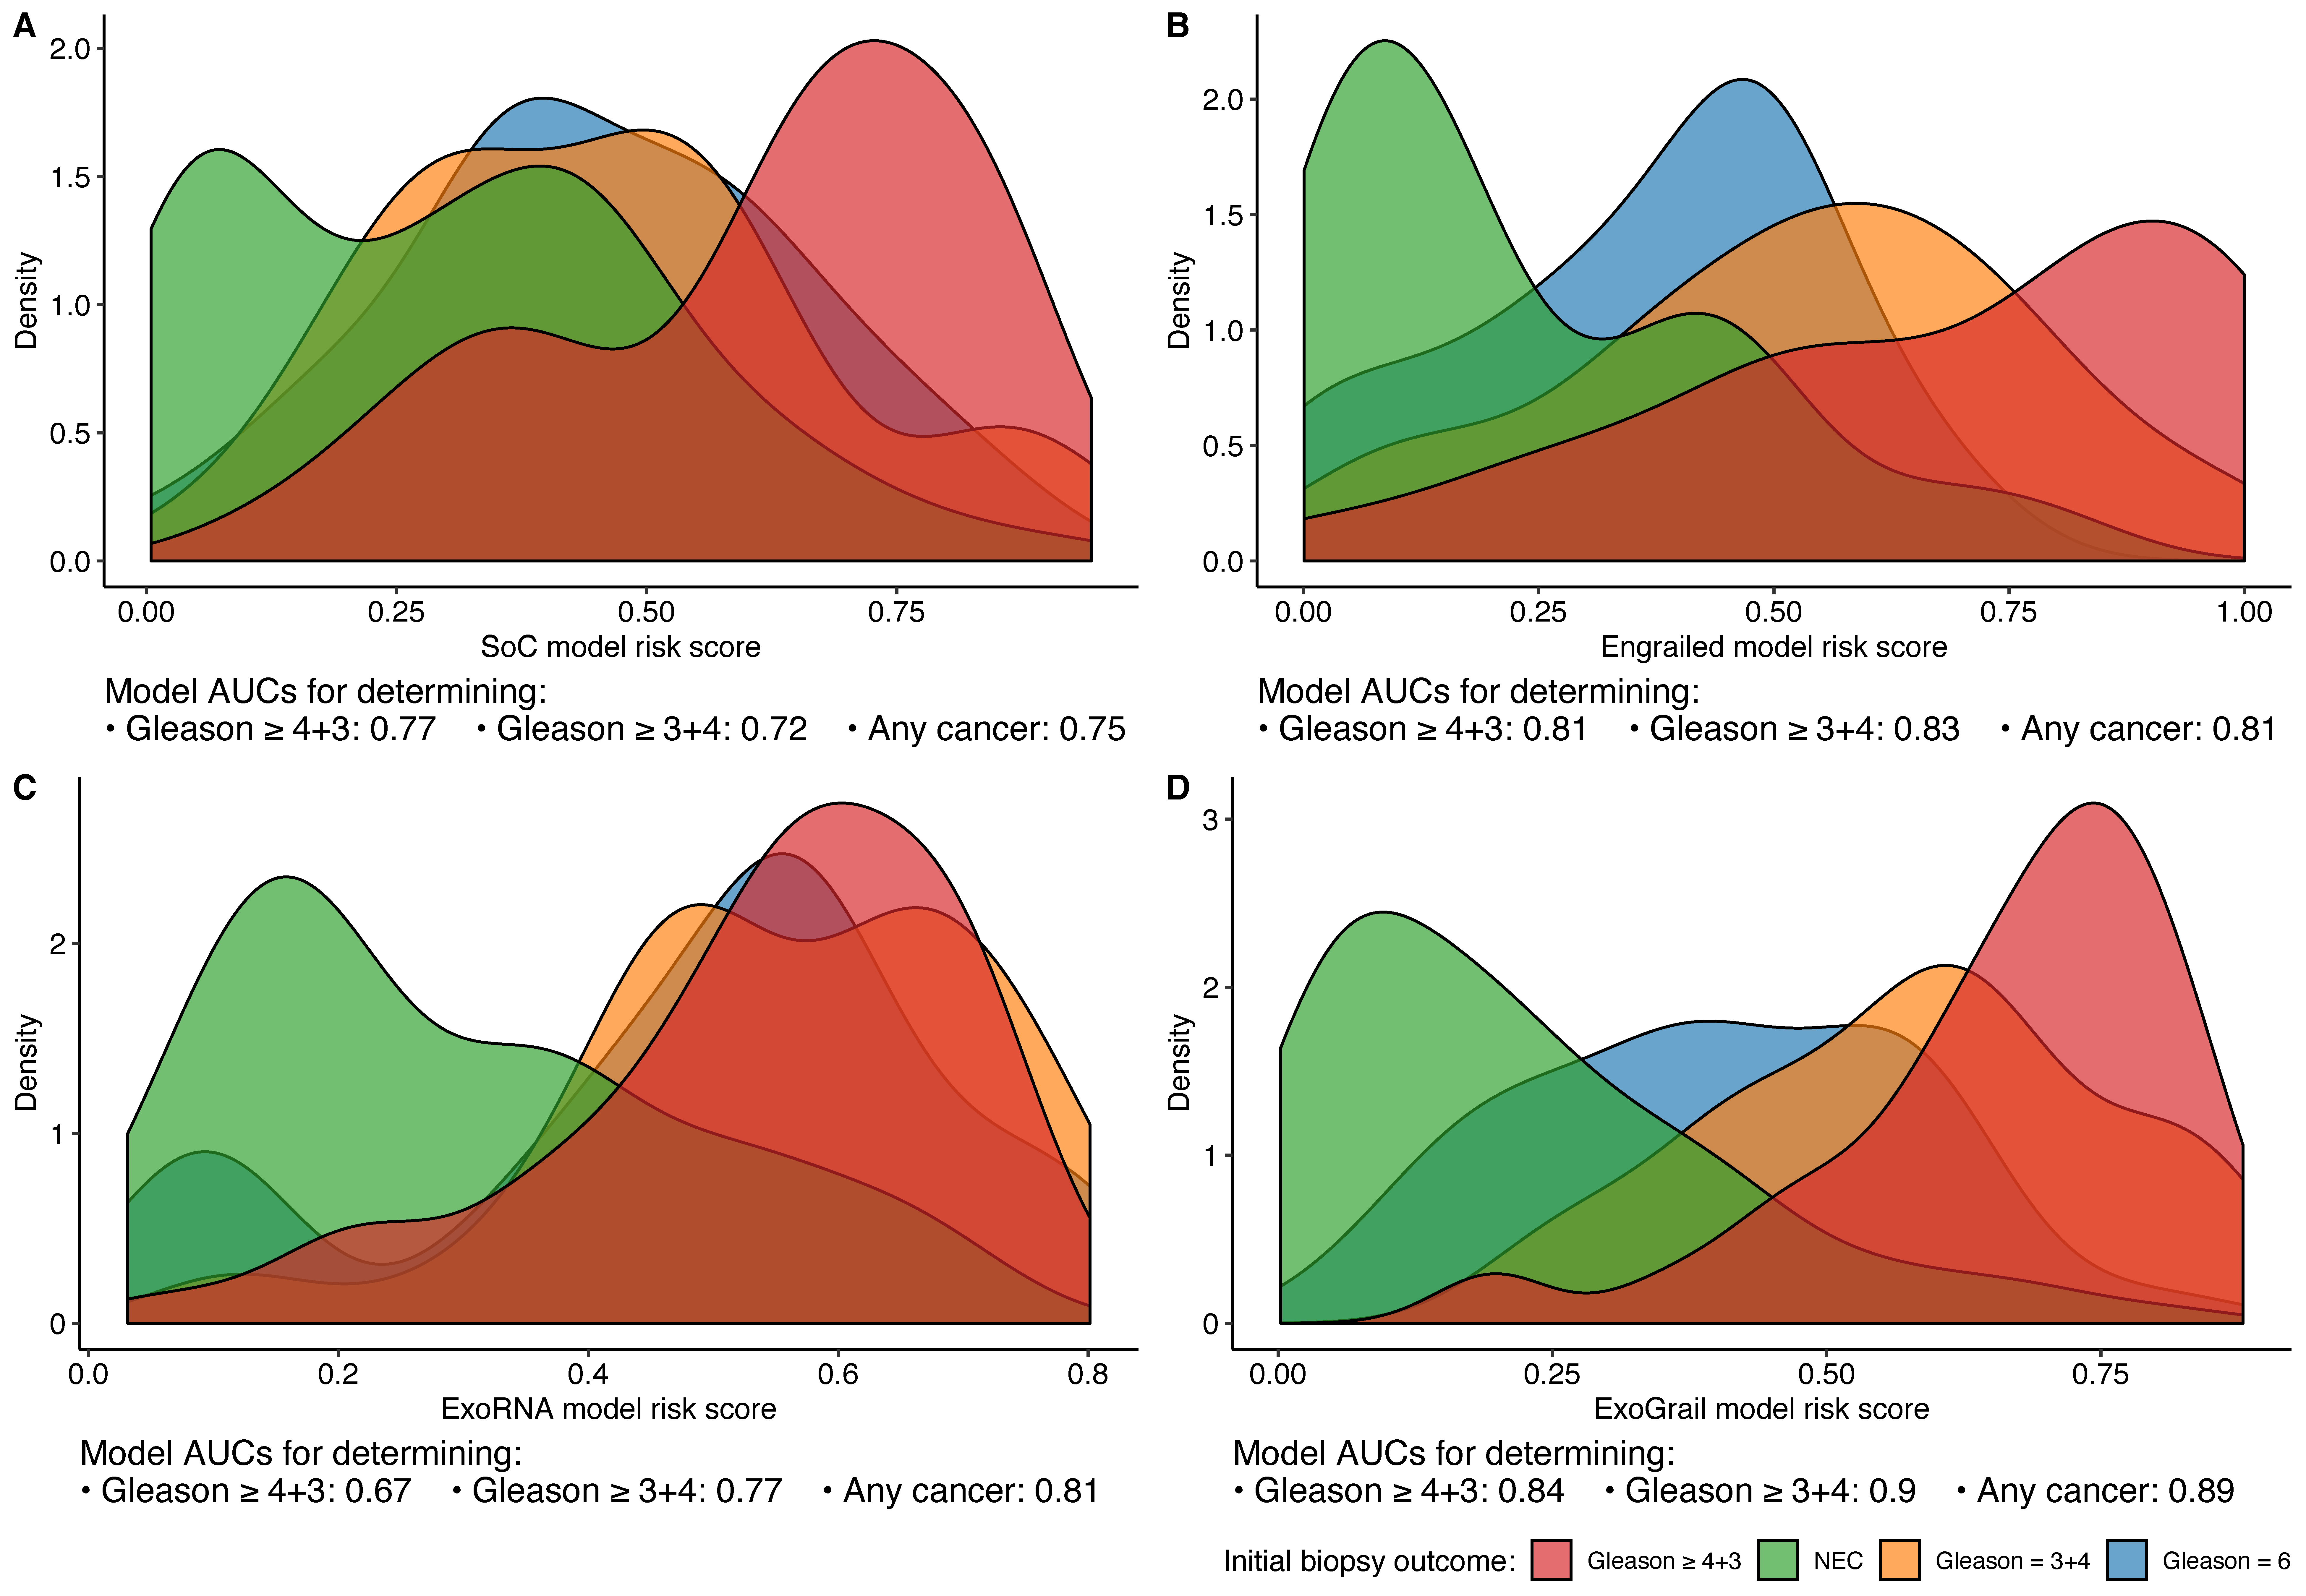
| Initial Biopsy Outcome: | SoC | Engrailed | ExoRNA | ExoGrail |
|---|---|---|---|---|
| Gleason ≥ 4 + 3: | 0.77 (0.69–0.84) | 0.81 (0.74–0.88) | 0.67 (0.59–0.75) | 0.84 (0.78–0.89) |
| Gleason ≥ 3 + 4: | 0.72 (0.65–0.79) | 0.83 (0.77–0.88) | 0.77 (0.70–0.83) | 0.90 (0.86–0.94) |
| Any Cancer | 0.75 (0.68–0.82) | 0.81 (0.74–0.86) | 0.81 (0.74–0.87) | 0.89 (0.85–0.94) |
Publisher’s Note: MDPI stays neutral with regard to jurisdictional claims in published maps and institutional affiliations. |
© 2021 by the authors. Licensee MDPI, Basel, Switzerland. This article is an open access article distributed under the terms and conditions of the Creative Commons Attribution (CC BY) license (https://creativecommons.org/licenses/by/4.0/).
Share and Cite
Connell, S.P.; Mills, R.; Pandha, H.; Morgan, R.; Cooper, C.S.; Clark, J.; Brewer, D.S.; The Movember GAP1 Urine Biomarker Consortium. Integration of Urinary EN2 Protein & Cell-Free RNA Data in the Development of a Multivariable Risk Model for the Detection of Prostate Cancer Prior to Biopsy. Cancers 2021, 13, 2102. https://doi.org/10.3390/cancers13092102
Connell SP, Mills R, Pandha H, Morgan R, Cooper CS, Clark J, Brewer DS, The Movember GAP1 Urine Biomarker Consortium. Integration of Urinary EN2 Protein & Cell-Free RNA Data in the Development of a Multivariable Risk Model for the Detection of Prostate Cancer Prior to Biopsy. Cancers. 2021; 13(9):2102. https://doi.org/10.3390/cancers13092102
Chicago/Turabian StyleConnell, Shea P., Robert Mills, Hardev Pandha, Richard Morgan, Colin S. Cooper, Jeremy Clark, Daniel S. Brewer, and The Movember GAP1 Urine Biomarker Consortium. 2021. "Integration of Urinary EN2 Protein & Cell-Free RNA Data in the Development of a Multivariable Risk Model for the Detection of Prostate Cancer Prior to Biopsy" Cancers 13, no. 9: 2102. https://doi.org/10.3390/cancers13092102