
Combined De-Repression of Chemoresistance Associated Mitogen-Activated Protein Kinase 14 and Activating Transcription Factor 2 by Loss of microRNA-622 in Hepatocellular Carcinoma

 , , and
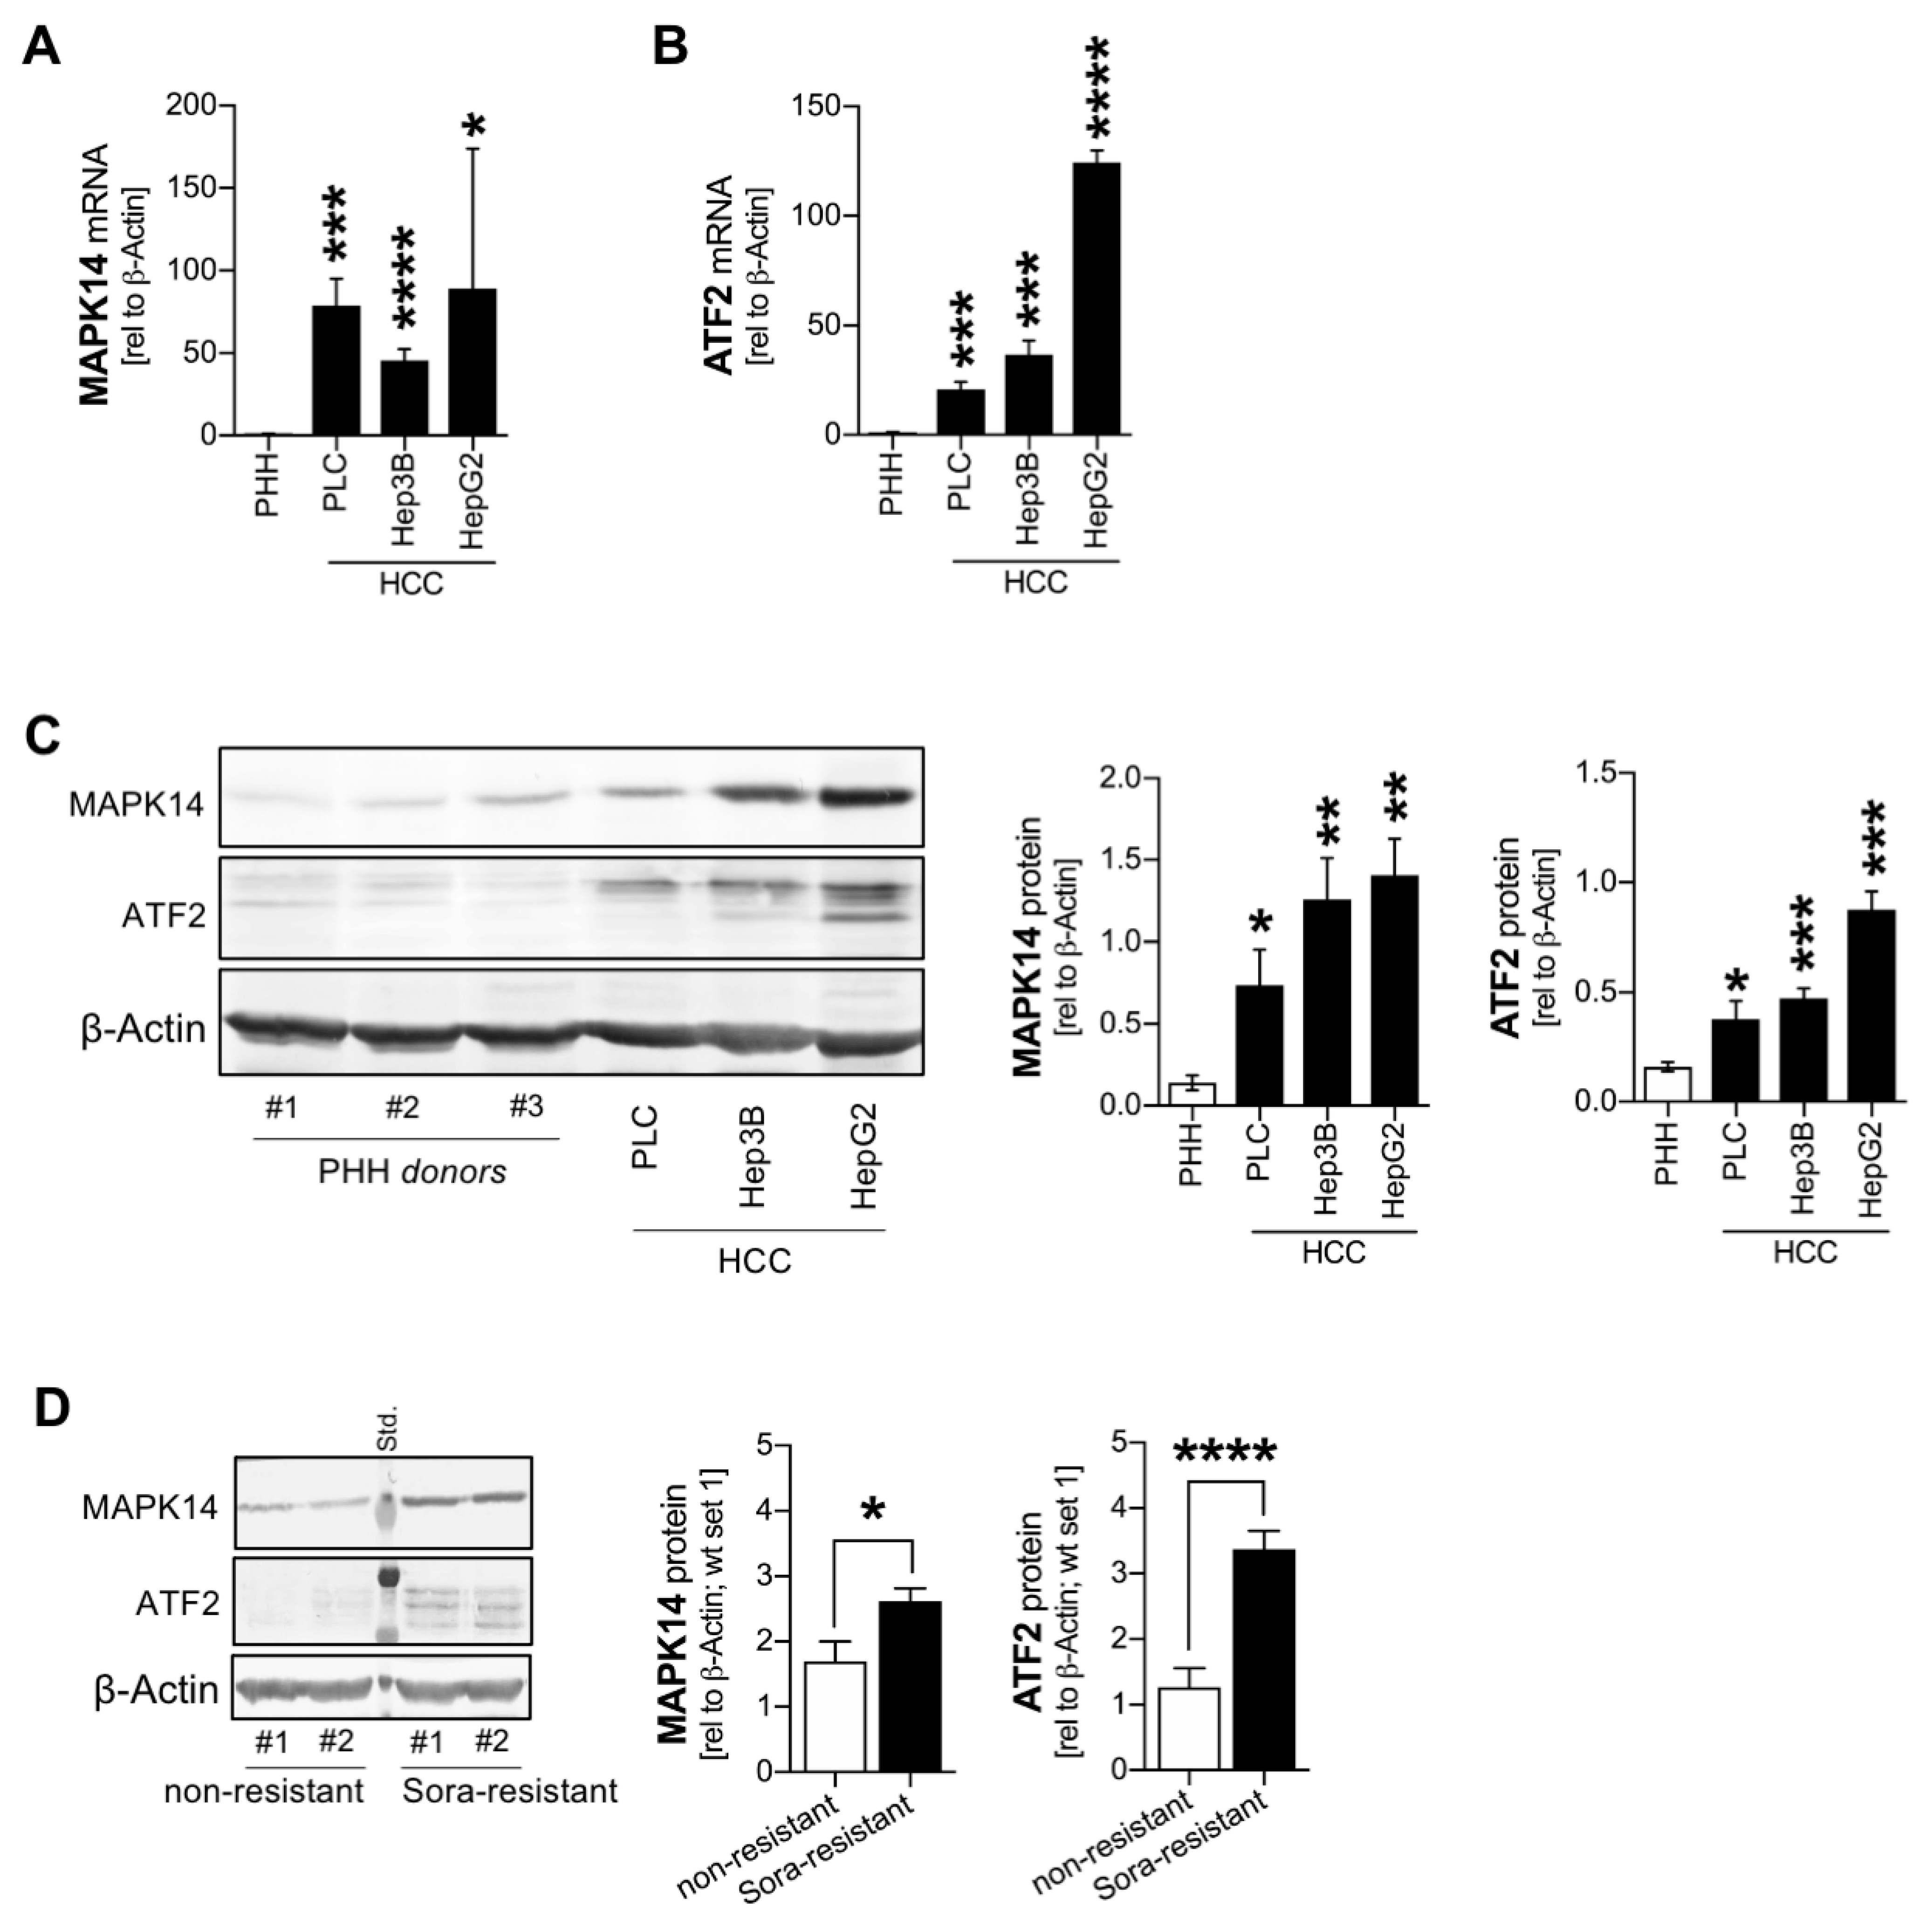
Abstract
:Simple Summary
Abstract
1. Introduction
2. Results
2.1. Combined Overexpression of MAPK14 and ATF2 in HCC Cells and in Sorafenib Resistance
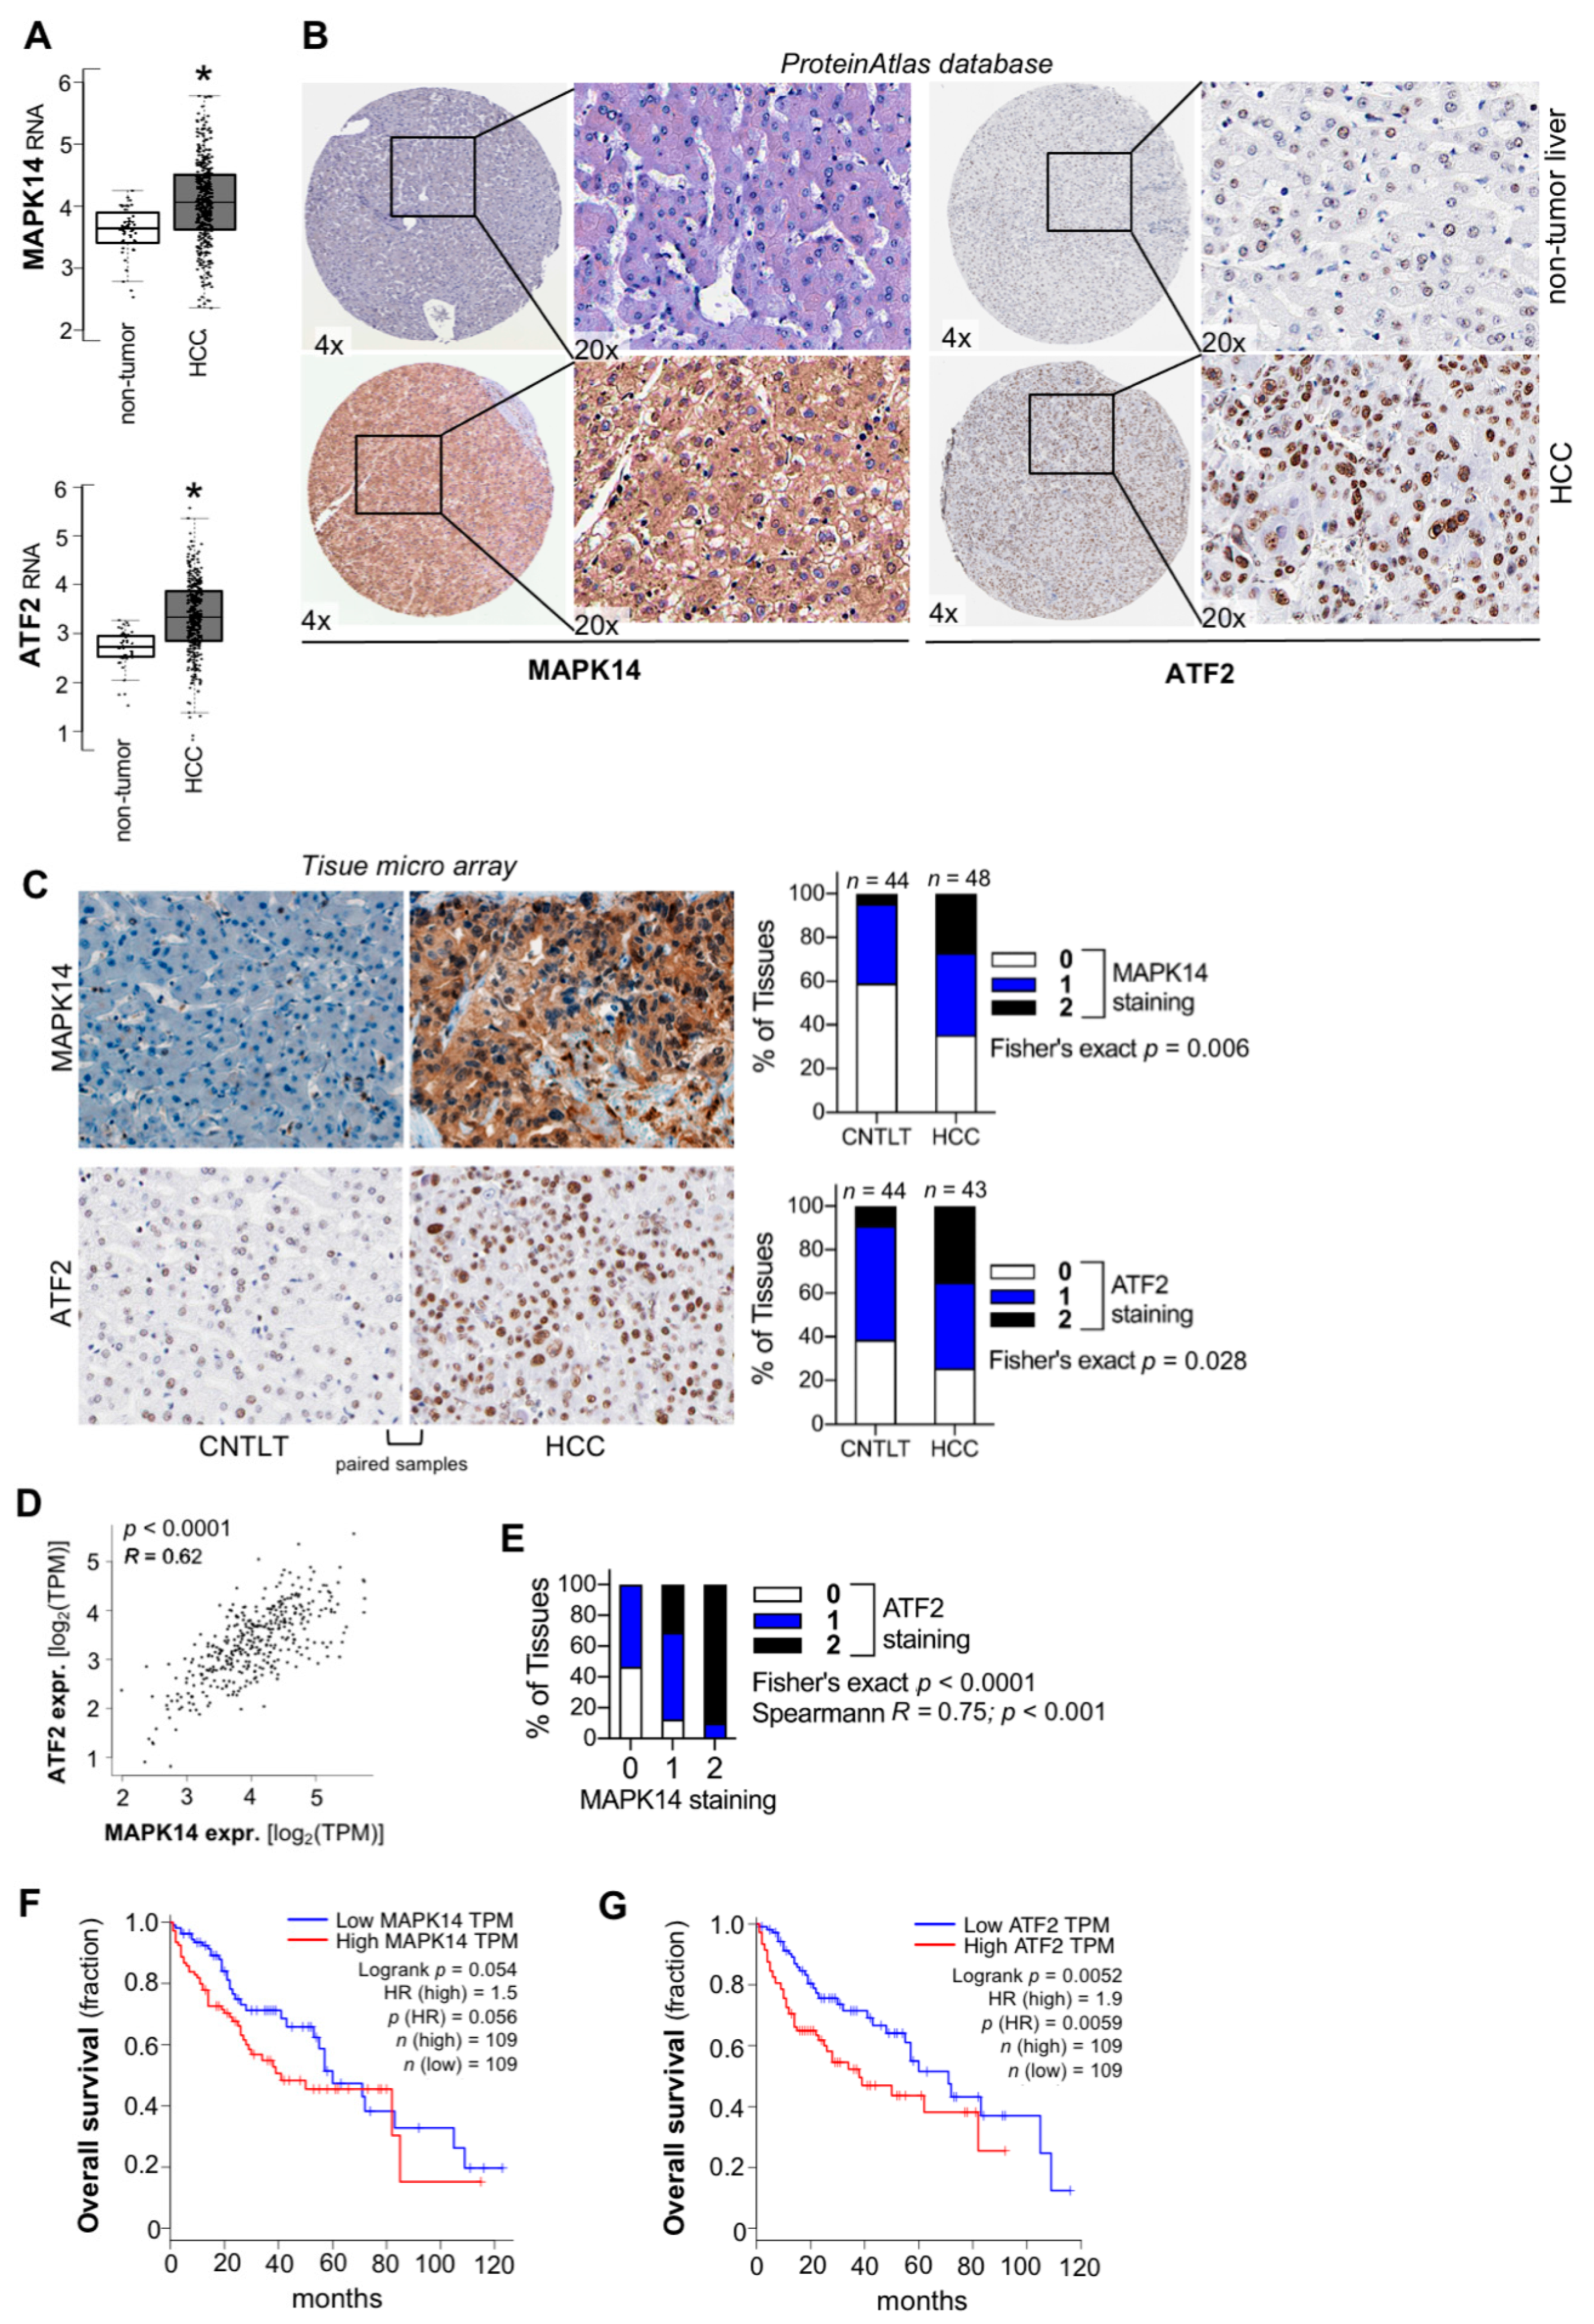
2.2. Combined Upregulation of MAPK14 and ATF2 in HCC In Vivo
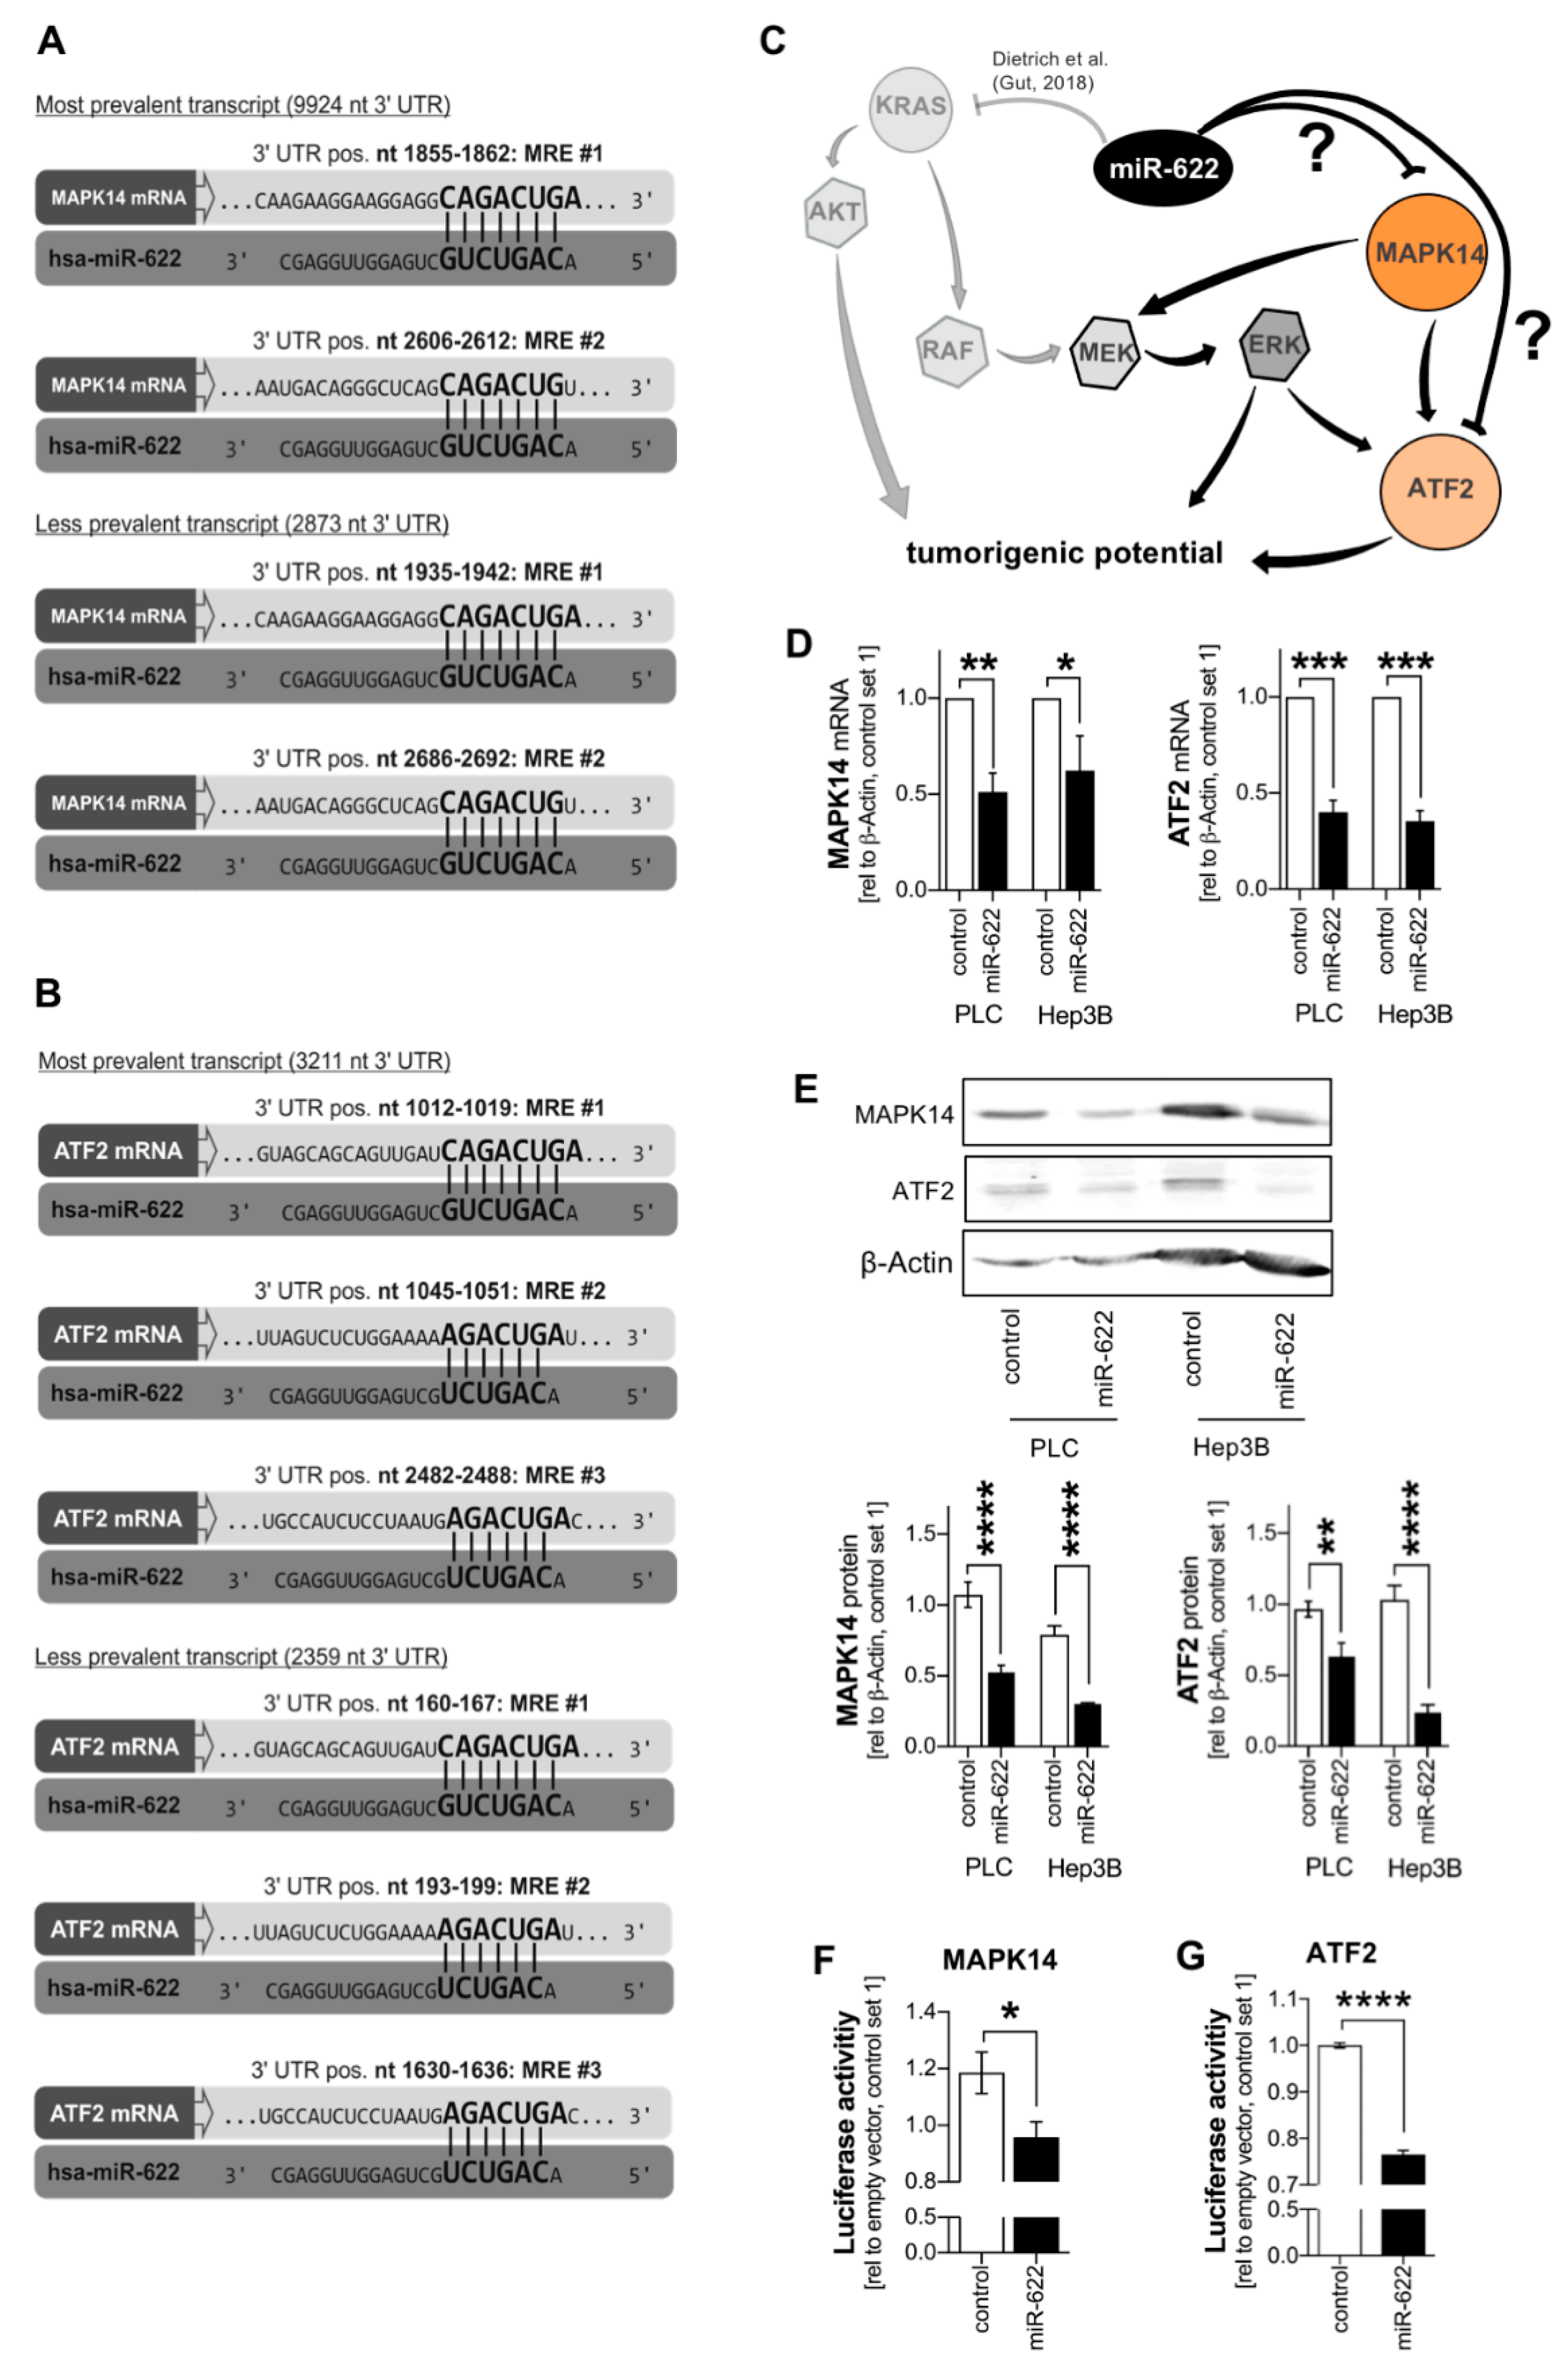
2.3. Loss of microRNA-622 Mediates De-Repression of the MAPK14-ATF2-Axis in HCC
3. Discussion
4. Material and Methods
4.1. Human Cells and Cell Culture
4.2. Human Liver Tissue
4.3. RNA Isolation and Expression Analysis
4.4. Transfection of HCC Cells with microRNA-622
4.5. Cloning, Luciferase Reporter Gene Assays & RNA Pulldown
4.6. Western Blotting
4.7. Immunohistochemistry and Immunofluorescence Analysis
4.8. In Silico Analysis
4.9. Statistical Analysis
5. Conclusions
Supplementary Materials
Author Contributions
Funding
Institutional Review Board Statement
Informed Consent Statement
Acknowledgments
Conflicts of Interest
References
- Llovet, J.M.; Zucman-Rossi, J.; Pikarsky, E.; Sangro, B.; Schwartz, M.; Sherman, M.; Gores, G. Hepatocellular carcinoma. Nat. Rev. Dis. Prim. 2016, 2, 16018. [Google Scholar] [CrossRef]
- Liu, Z.; Lin, Y.; Zhang, J.; Zhang, Y.; Li, Y.; Liu, Z.; Li, Q.; Luo, M.; Liang, R.; Ye, J. Molecular targeted and immune checkpoint therapy for advanced hepatocellular carcinoma. J. Exp. Clin. Cancer Res. 2019, 38, 447. [Google Scholar] [CrossRef] [PubMed]
- Lambring, C.B.; Ghabach, B.; Narra, K.; Basha, R. Current perspectives in immunotherapy for liver cancer. Crit. Rev. Oncog. 2020, 25, 31–46. [Google Scholar] [CrossRef] [PubMed]
- Vogel, A.; Saborowski, A. Current strategies for the treatment of intermediate and advanced hepatocellular carcinoma. Cancer Treat. Rev. 2020, 82, 101946. [Google Scholar] [CrossRef] [Green Version]
- Marin, J.J.G.; Briz, O.; Herraez, E.; Lozano, E.; Asensio, M.; Di Giacomo, S.; Romero, M.R.; Osorio-Padilla, L.M.; Santos-Llamas, A.I.; Serrano, M.A.; et al. Molecular bases of the poor response of liver cancer to chemotherapy. Clin. Res. Hepatol. Gastroenterol. 2018, 42, 182–192. [Google Scholar] [CrossRef]
- Dietrich, P.; Koch, A.; Fritz, V.; Hartmann, A.; Bosserhoff, A.K.; Hellerbrand, C. Wild type Kirsten rat sarcoma is a novel microRNA-622-regulated therapeutic target for hepatocellular carcinoma and contributes to sorafenib resistance. Gut 2018, 67, 1328–1341. [Google Scholar] [CrossRef]
- Dietrich, P.; Hellerbrand, C.; Bosserhoff, A. The delta subunit of rod-specific photoreceptor cGMP phosphodiesterase (PDE6D) contributes to hepatocellular carcinoma progression. Cancers 2019, 11, 398. [Google Scholar] [CrossRef] [Green Version]
- Dietrich, P.; Gaza, A.; Wormser, L.; Fritz, V.; Hellerbrand, C.; Bosserhoff, A.K. Neuroblastoma RAS viral oncogene homolog (NRAS) is a novel prognostic marker and contributes to sorafenib resistance in hepatocellular carcinoma. Neoplasia 2019, 21, 257–268. [Google Scholar] [CrossRef]
- Dietrich, P.; Freese, K.; Mahli, A.; Thasler, W.E.; Hellerbrand, C.; Bosserhoff, A.K. Combined effects of PLK1 and RAS in hepatocellular carcinoma reveal rigosertib as promising novel therapeutic “dual-hit” option. Oncotarget 2018, 9, 3605–3618. [Google Scholar] [CrossRef] [PubMed] [Green Version]
- Linck-Paulus, L.; Hellerbrand, C.; Bosserhoff, A.K.; Dietrich, P. Dissimilar appearances are deceptive-common microRNAs and therapeutic strategies in liver cancer and melanoma. Cells 2020, 9, 114. [Google Scholar] [CrossRef] [Green Version]
- Rudalska, R.; Dauch, D.; Longerich, T.; McJunkin, K.; Wuestefeld, T.; Kang, T.W.; Hohmeyer, A.; Pesic, M.; Leibold, J.; von Thun, A.; et al. In Vivo RNAi screening identifies a mechanism of sorafenib resistance in liver cancer. Nat. Med. 2014, 20, 1138–1146. [Google Scholar] [CrossRef] [PubMed] [Green Version]
- Luo, L.; Cai, L.; Luo, L.; Tang, Z.; Meng, X. Silencing activating transcription factor 2 promotes the anticancer activity of sorafenib in hepatocellular carcinoma cells. Mol. Med. Rep. 2018, 17, 8053–8060. [Google Scholar] [CrossRef] [PubMed] [Green Version]
- Uhlen, M.; Fagerberg, L.; Hallstrom, B.M.; Lindskog, C.; Oksvold, P.; Mardinoglu, A.; Sivertsson, A.; Kampf, C.; Sjostedt, E.; Asplund, A.; et al. Proteomics. Tissue-based map of the human proteome. Science 2015, 347, 1260419. [Google Scholar] [CrossRef]
- Uhlen, M.; Bjorling, E.; Agaton, C.; Szigyarto, C.A.; Amini, B.; Andersen, E.; Andersson, A.C.; Angelidou, P.; Asplund, A.; Asplund, C.; et al. A human protein atlas for normal and cancer tissues based on antibody proteomics. Mol. Cell Proteom. 2005, 4, 1920–1932. [Google Scholar] [CrossRef] [PubMed] [Green Version]
- Sjostedt, E.; Zhong, W.; Fagerberg, L.; Karlsson, M.; Mitsios, N.; Adori, C.; Oksvold, P.; Edfors, F.; Limiszewska, A.; Hikmet, F.; et al. An atlas of the protein-coding genes in the human, pig, and mouse brain. Science 2020, 367. [Google Scholar] [CrossRef]
- Dietrich, P.; Wormser, L.; Fritz, V.; Seitz, T.; De Maria, M.; Schambony, A.; Kremer, A.E.; Gunther, C.; Itzel, T.; Thasler, W.E.; et al. Molecular crosstalk between Y5 receptor and neuropeptide Y drives liver cancer. J. Clin. Investig. 2020, 130, 2509–2526. [Google Scholar] [CrossRef] [PubMed] [Green Version]
- Bauer, R.; Valletta, D.; Bauer, K.; Thasler, W.E.; Hartmann, A.; Muller, M.; Reichert, T.E.; Hellerbrand, C. Downregulation of P-cadherin expression in hepatocellular carcinoma induces tumorigenicity. Int. J. Clin. Exp. Pathol. 2014, 7, 6125–6132. [Google Scholar] [CrossRef] [Green Version]
- Huang, H.Y.; Lin, Y.C.; Li, J.; Huang, K.Y.; Shrestha, S.; Hong, H.C.; Tang, Y.; Chen, Y.G.; Jin, C.N.; Yu, Y.; et al. miRTarBase 2020: Updates to the experimentally validated microRNA-target interaction database. Nucleic Acids Res. 2020, 48, D148–D154. [Google Scholar] [CrossRef] [Green Version]
- Chen, Y.; Wang, X. miRDB: An online database for prediction of functional microRNA targets. Nucleic Acids Res. 2020, 48, D127–D131. [Google Scholar] [CrossRef] [Green Version]
- Agarwal, V.; Bell, G.W.; Nam, J.W.; Bartel, D.P. Predicting effective microRNA target sites in mammalian mRNAs. eLife 2015, 4. [Google Scholar] [CrossRef] [PubMed]
- Hsu, S.D.; Chu, C.H.; Tsou, A.P.; Chen, S.J.; Chen, H.C.; Hsu, P.W.; Wong, Y.H.; Chen, Y.H.; Chen, G.H.; Huang, H.D. miRNAMap 2.0: Genomic maps of microRNAs in metazoan genomes. Nucleic Acids Res. 2008, 36, D165–D169. [Google Scholar] [CrossRef] [PubMed] [Green Version]
- Bantel, H.; Canbay, A. Loss of KRAS control as consequence of downregulated microRNA-622 in hepatocellular carcinoma and its potential therapeutic implication. Gut 2018, 67, 1206–1207. [Google Scholar] [CrossRef] [PubMed]
- Zhang, R.; Luo, H.; Wang, S.; Chen, Z.; Hua, L.; Wang, H.W.; Chen, W.; Yuan, Y.; Zhou, X.; Li, D.; et al. MiR-622 suppresses proliferation, invasion and migration by directly targeting activating transcription factor 2 in glioma cells. J. Neuro-Oncol. 2015, 121, 63–72. [Google Scholar] [CrossRef]
- Liang, Y.; Liang, Q.; Qiao, L.; Xiao, F. MicroRNAs modulate drug resistance-related mechanisms in hepatocellular carcinoma. Front. Oncol. 2020, 10, 920. [Google Scholar] [CrossRef]
- Takahashi, K.; Koyama, K.; Ota, Y.; Iwamoto, H.; Yamakita, K.; Fujii, S.; Kitano, Y. The interaction between long non-coding RNA HULC and MicroRNA-622 via transfer by extracellular vesicles regulates cell invasion and migration in human pancreatic cancer. Front. Oncol. 2020, 10, 1013. [Google Scholar] [CrossRef] [PubMed]
- Orlandella, F.M.; Mariniello, R.M.; Mirabelli, P.; De Stefano, A.E.; Iervolino, P.L.C.; Lasorsa, V.A.; Capasso, M.; Giannatiempo, R.; Rongo, M.; Incoronato, M.; et al. miR-622 is a novel potential biomarker of breast carcinoma and impairs motility of breast cancer cells through targeting NUAK1 kinase. Br. J. Cancer 2020, 123, 426–437. [Google Scholar] [CrossRef] [PubMed]
- Vigneron, N.; Vernon, M.; Meryet-Figuiere, M.; Lambert, B.; Briand, M.; Louis, M.H.; Krieger, S.; Joly, F.; Lheureux, S.; Blanc-Fournier, C.; et al. Predictive relevance of circulating miR-622 in patients with newly diagnosed and recurrent high-grade serous ovarian carcinoma. Clin. Chem. 2020, 66, 352–362. [Google Scholar] [CrossRef] [Green Version]
- Liu, C.; Min, L.; Kuang, J.; Zhu, C.; Qiu, X.Y.; Zhu, L. Bioinformatic identification of miR-622 key target genes and experimental validation of the miR-622-RNF8 axis in breast cancer. Front. Oncol. 2019, 9, 1114. [Google Scholar] [CrossRef]
- Fang, Y.; Sun, B.; Wang, J.; Wang, Y. miR-622 inhibits angiogenesis by suppressing the CXCR4-VEGFA axis in colorectal cancer. Gene 2019, 699, 37–42. [Google Scholar] [CrossRef]
- Dietrich, P.; Kuphal, S.; Spruss, T.; Hellerbrand, C.; Bosserhoff, A.K. MicroRNA-622 is a novel mediator of tumorigenicity in melanoma by targeting Kirsten rat sarcoma. Pigment. Cell Melanoma Res. 2018, 31, 614–629. [Google Scholar] [CrossRef]
- Song, C.; Lu, P.; Shi, W.; Sun, G.; Wang, G.; Huang, X.; Wang, Z.; Wang, Z. MiR-622 functions as a tumor suppressor and directly targets E2F1 in human esophageal squamous cell carcinoma. Biomed. Pharm. 2016, 83, 843–849. [Google Scholar] [CrossRef]
- Liu, H.; Liu, Y.; Liu, W.; Zhang, W.; Xu, J. EZH2-mediated loss of miR-622 determines CXCR4 activation in hepatocellular carcinoma. Nat. Commun. 2015, 6, 8494. [Google Scholar] [CrossRef] [PubMed] [Green Version]
- Song, W.H.; Feng, X.J.; Gong, S.J.; Chen, J.M.; Wang, S.M.; Xing, D.J.; Zhu, M.H.; Zhang, S.H.; Xu, A.M. microRNA-622 acts as a tumor suppressor in hepatocellular carcinoma. Cancer Biol. 2015, 16, 1754–1763. [Google Scholar] [CrossRef] [Green Version]
- Huntzinger, E.; Izaurralde, E. Gene silencing by microRNAs: Contributions of translational repression and mRNA decay. Nat. Rev. Genet. 2011, 12, 99–110. [Google Scholar] [CrossRef]
- Sultan, A.S.; Brim, H.; Sherif, Z.A. Co-overexpression of Janus kinase 2 and signal transducer and activator of transcription 5a promotes differentiation of mammary cancer cells through reversal of epithelial-mesenchymal transition. Cancer Sci. 2008, 99, 272–279. [Google Scholar] [CrossRef] [PubMed]
- Berghoff, A.S.; Bartsch, R.; Preusser, M.; Ricken, G.; Steger, G.G.; Bago-Horvath, Z.; Rudas, M.; Streubel, B.; Dubsky, P.; Gnant, M.; et al. Co-overexpression of HER2/HER3 is a predictor of impaired survival in breast cancer patients. Breast 2014, 23, 637–643. [Google Scholar] [CrossRef]
- Murase, H.; Inokuchi, M.; Takagi, Y.; Kato, K.; Kojima, K.; Sugihara, K. Prognostic significance of the co-overexpression of fibroblast growth factor receptors 1, 2 and 4 in gastric cancer. Mol. Clin. Oncol. 2014, 2, 509–517. [Google Scholar] [CrossRef] [PubMed] [Green Version]
- Wang, L.; Shi, S.; Guo, Z.; Zhang, X.; Han, S.; Yang, A.; Wen, W.; Zhu, Q. Overexpression of YAP and TAZ is an independent predictor of prognosis in colorectal cancer and related to the proliferation and metastasis of colon cancer cells. PLoS ONE 2013, 8, e65539. [Google Scholar] [CrossRef] [PubMed]
- Stumm, G.; Eberwein, S.; Rostock-Wolf, S.; Stein, H.; Pomer, S.; Schlegel, J.; Waldherr, R. Concomitant overexpression of the EGFR and erbB-2 genes in renal cell carcinoma (RCC) is correlated with dedifferentiation and metastasis. Int. J. Cancer 1996, 69, 17–22. [Google Scholar] [CrossRef]
- Huebner, K.; Procházka, J.; Monteiro, A.C.; Mahadevan, V.; Schneider-Stock, R. The activating transcription factor 2: An influencer of cancer progression. Mutagenesis 2019, 34, 375–389. [Google Scholar] [CrossRef]
- Bhoumik, A.; Ronai, Z. ATF2: A transcription factor that elicits oncogenic or tumor suppressor activities. Cell Cycle 2008, 7, 2341–2345. [Google Scholar] [CrossRef] [Green Version]
- Igea, A.; Nebreda, A.R. The stress kinase p38α as a target for cancer therapy. Cancer Res. 2015, 75, 3997–4002. [Google Scholar] [CrossRef] [Green Version]
- Dominguez, C.; Powers, D.A.; Tamayo, N. p38 MAP kinase inhibitors: Many are made, but few are chosen. Curr. Opin. Drug Discov. Dev. 2005, 8, 421–430. [Google Scholar]
- Koeberle, S.C.; Romir, J.; Fischer, S.; Koeberle, A.; Schattel, V.; Albrecht, W.; Grutter, C.; Werz, O.; Rauh, D.; Stehle, T.; et al. Skepinone-L is a selective p38 mitogen-activated protein kinase inhibitor. Nat. Chem. Biol. 2011, 8, 141–143. [Google Scholar] [CrossRef]
- MacNee, W.; Allan, R.J.; Jones, I.; De Salvo, M.C.; Tan, L.F. Efficacy and safety of the oral p38 inhibitor PH-797804 in chronic obstructive pulmonary disease: A randomised clinical trial. Thorax 2013, 68, 738–745. [Google Scholar] [CrossRef] [Green Version]
- Yang, L.; Sun, X.; Ye, Y.; Lu, Y.; Zuo, J.; Liu, W.; Elcock, A.; Zhu, S. p38alpha mitogen-activated protein kinase is a druggable target in pancreatic adenocarcinoma. Front. Oncol. 2019, 9, 1294. [Google Scholar] [CrossRef]
- Martinez-Limon, A.; Joaquin, M.; Caballero, M.; Posas, F.; de Nadal, E. The p38 pathway: From biology to cancer therapy. Int. J. Mol. Sci. 2020, 21, 1913. [Google Scholar] [CrossRef] [PubMed] [Green Version]
- Lee, S.M.; Schelcher, C.; Demmel, M.; Hauner, M.; Thasler, W.E. Isolation of human hepatocytes by a two-step collagenase perfusion procedure. J. Vis. Exp. 2013. [Google Scholar] [CrossRef] [PubMed] [Green Version]
- Thasler, W.E.; Weiss, T.S.; Schillhorn, K.; Stoll, P.T.; Irrgang, B.; Jauch, K.W. Charitable state-controlled foundation human tissue and cell research: Ethic and legal aspects in the supply of surgically removed human tissue for research in the academic and commercial sector in Germany. Cell Tissue Bank 2003, 4, 49–56. [Google Scholar] [CrossRef] [PubMed]
- Schiffner, S.; Braunger, B.M.; de Jel, M.M.; Coupland, S.E.; Tamm, E.R.; Bosserhoff, A.K. Tg(Grm1) transgenic mice: A murine model that mimics spontaneous uveal melanoma in humans? Exp. Eye Res. 2014, 127, 59–68. [Google Scholar] [CrossRef] [PubMed]
- Voller, D.; Reinders, J.; Meister, G.; Bosserhoff, A.K. Strong reduction of AGO2 expression in melanoma and cellular consequences. Br. J. Cancer 2013, 109, 3116–3124. [Google Scholar] [CrossRef] [PubMed] [Green Version]
- Szklarczyk, D.; Gable, A.L.; Lyon, D.; Junge, A.; Wyder, S.; Huerta-Cepas, J.; Simonovic, M.; Doncheva, N.T.; Morris, J.H.; Bork, P.; et al. STRING v11: Protein-protein association networks with increased coverage, supporting functional discovery in genome-wide experimental datasets. Nucleic Acids Res. 2019, 47, D607–D613. [Google Scholar] [CrossRef] [PubMed] [Green Version]
- Tang, Z.; Li, C.; Kang, B.; Gao, G.; Li, C.; Zhang, Z. GEPIA: A web server for cancer and normal gene expression profiling and interactive analyses. Nucleic Acids Res. 2017, 45, W98–W102. [Google Scholar] [CrossRef] [PubMed] [Green Version]


Publisher’s Note: MDPI stays neutral with regard to jurisdictional claims in published maps and institutional affiliations. |
© 2021 by the authors. Licensee MDPI, Basel, Switzerland. This article is an open access article distributed under the terms and conditions of the Creative Commons Attribution (CC BY) license (http://creativecommons.org/licenses/by/4.0/).
Share and Cite
Fritz, V.; Malek, L.; Gaza, A.; Wormser, L.; Appel, M.; Kremer, A.E.; Thasler, W.E.; Siebler, J.; Neurath, M.F.; Hellerbrand, C.; et al. Combined De-Repression of Chemoresistance Associated Mitogen-Activated Protein Kinase 14 and Activating Transcription Factor 2 by Loss of microRNA-622 in Hepatocellular Carcinoma. Cancers 2021, 13, 1183. https://doi.org/10.3390/cancers13051183
Fritz V, Malek L, Gaza A, Wormser L, Appel M, Kremer AE, Thasler WE, Siebler J, Neurath MF, Hellerbrand C, et al. Combined De-Repression of Chemoresistance Associated Mitogen-Activated Protein Kinase 14 and Activating Transcription Factor 2 by Loss of microRNA-622 in Hepatocellular Carcinoma. Cancers. 2021; 13(5):1183. https://doi.org/10.3390/cancers13051183
Chicago/Turabian StyleFritz, Valerie, Lara Malek, Anne Gaza, Laura Wormser, Majken Appel, Andreas E. Kremer, Wolfgang E. Thasler, Jürgen Siebler, Markus F. Neurath, Claus Hellerbrand, and et al. 2021. "Combined De-Repression of Chemoresistance Associated Mitogen-Activated Protein Kinase 14 and Activating Transcription Factor 2 by Loss of microRNA-622 in Hepatocellular Carcinoma" Cancers 13, no. 5: 1183. https://doi.org/10.3390/cancers13051183