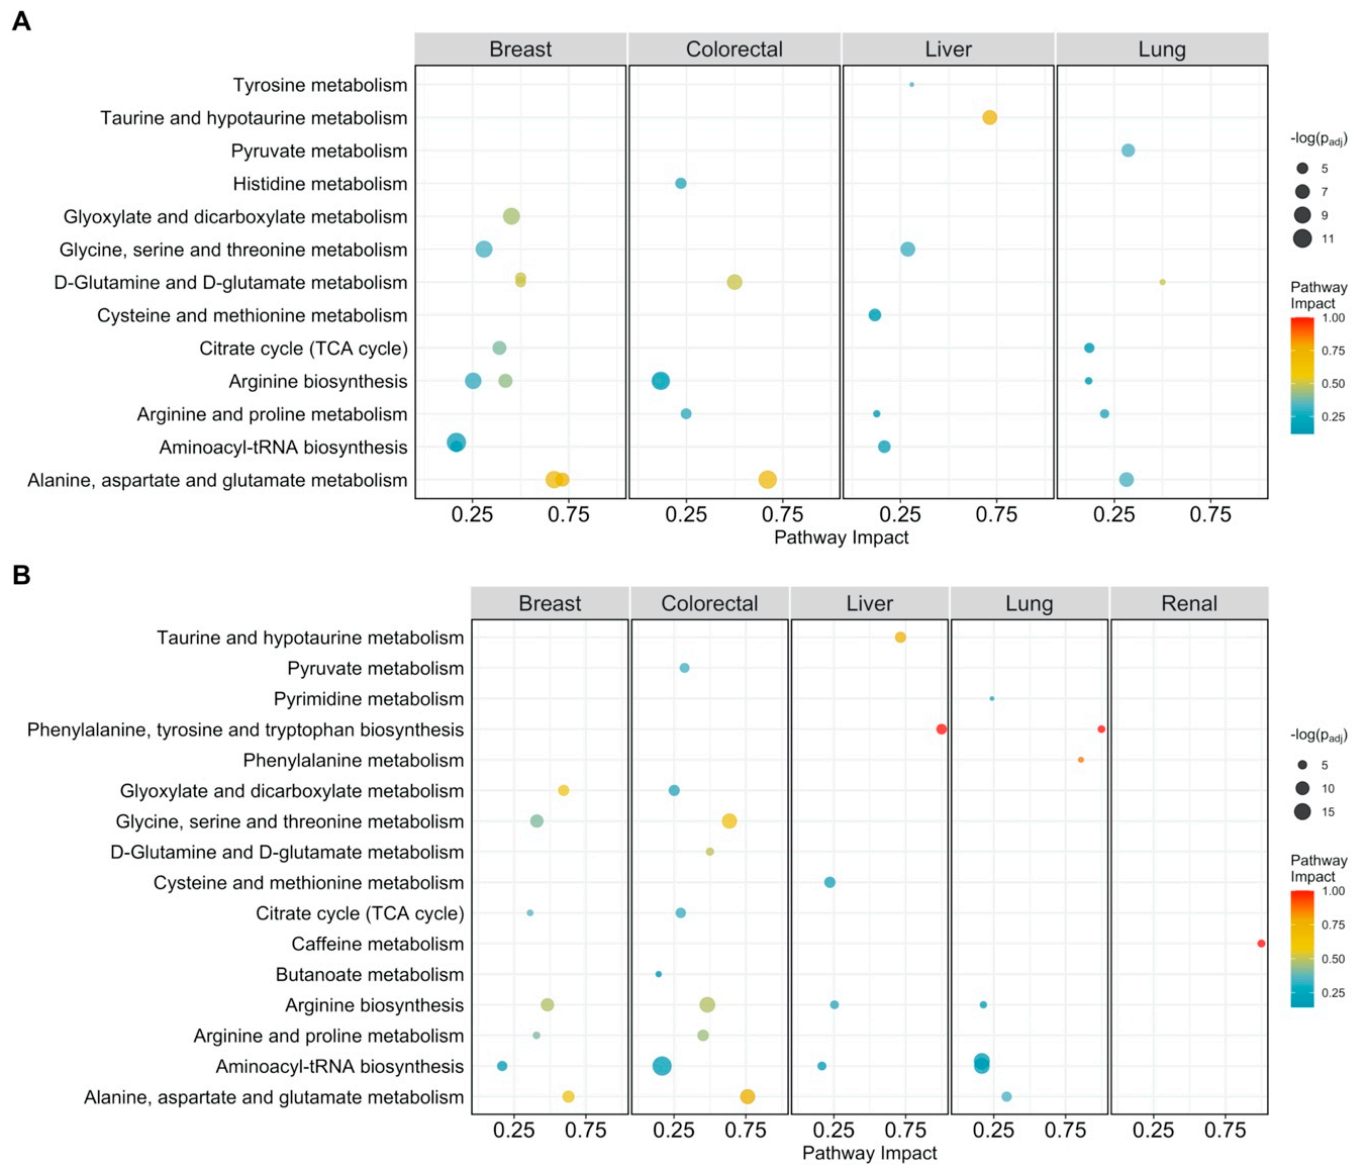
Figure 1.
Pathway analysis plot showing the impact on metabolic pathways that are significantly enriched (padj < 0.05) and have a pathway impact score > 0.1 per cancer type. Datapoints are colored according to their impact score. (A) Pathway impact according to differentially abundant metabolites (padj < 0.05); (B) pathway impact according to differentially connected metabolites (Benjamini-Hochberg adjusted p-value padj < 005).
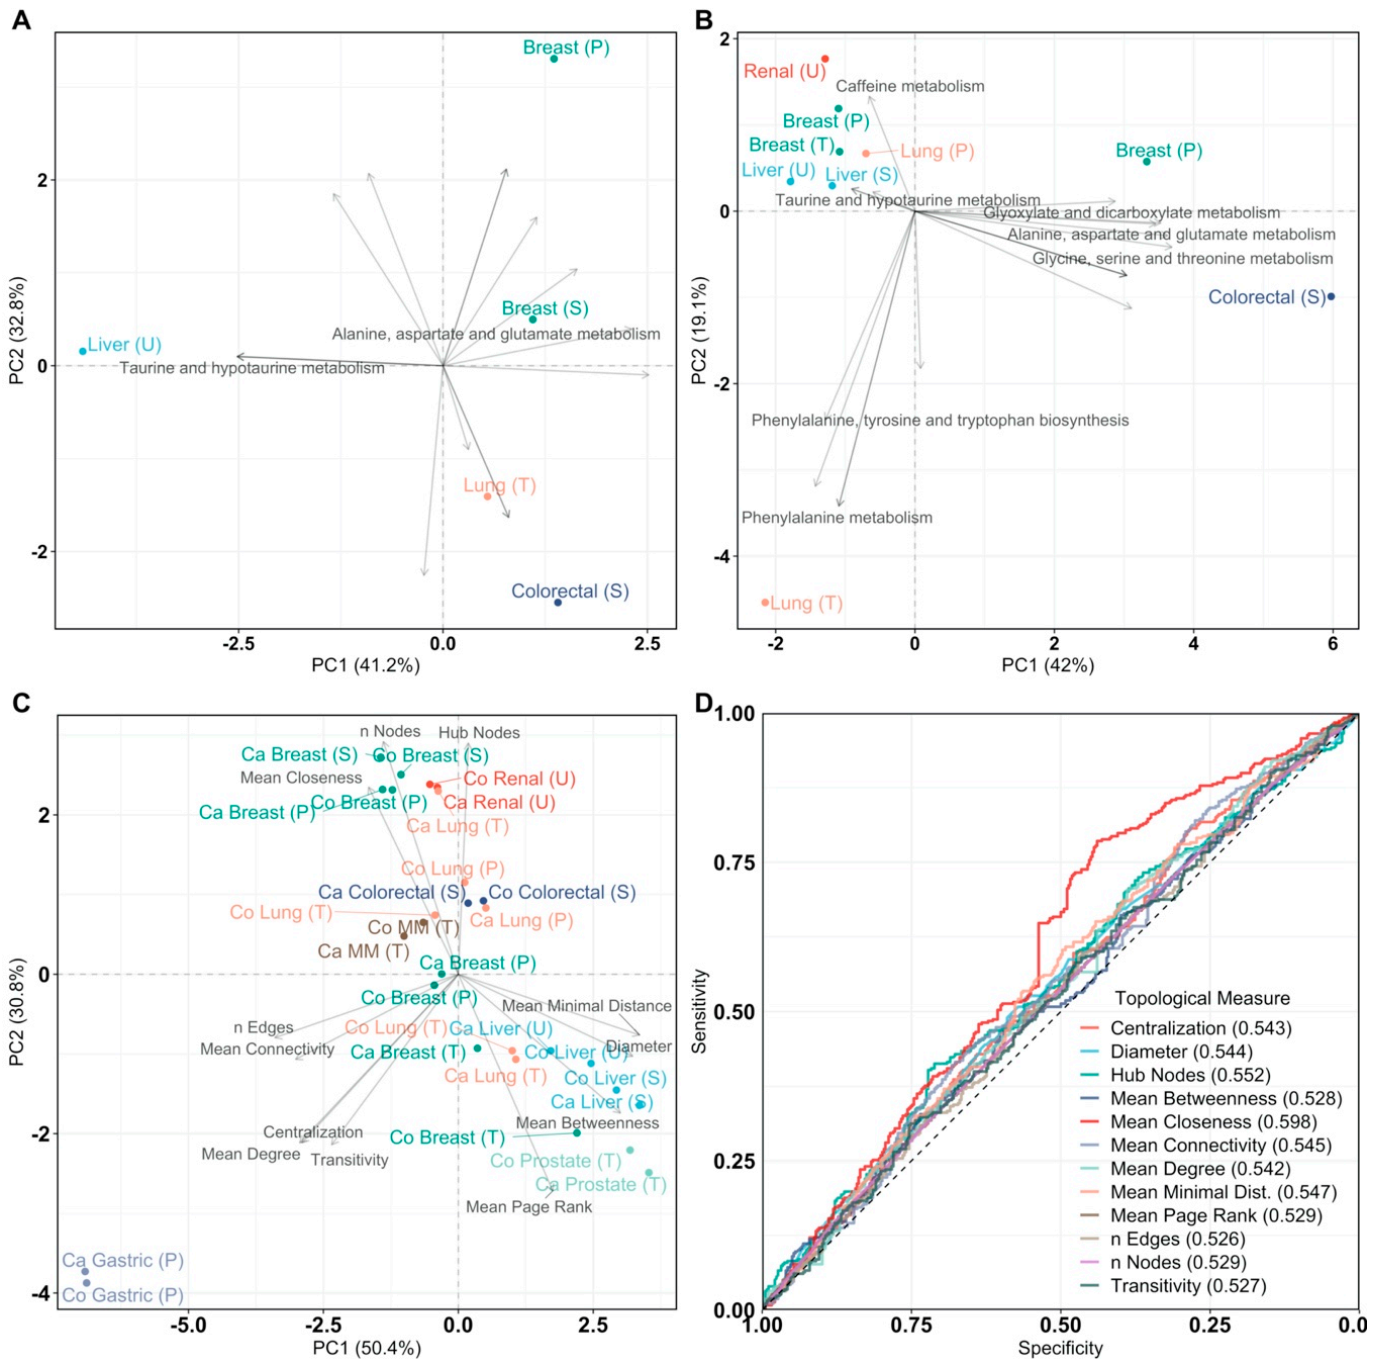
Figure 2.
Principal Component Analysis (PCA) of pathway impact and network analysis. PCA labels are colored according to their cancer type and PCA loadings are labeled if they have a pathway impact score > 0.5. Sample origin is labeled as T, U, S, P for tissue, urine, serum, and plasma, respectively. Multiple myeloma is abbreviated as MM. (A) PCA biplot of pathway impact based on differentially abundant metabolites per cancer type; (B) PCA biplot of pathway impact based on differentially connected metabolites per cancer type; (C) PCA biplot of topological network measures per cancer type for all inferred metabolite association networks. Here, networks inferred from cancer or control samples are labeled as “Ca” and “Co”, respectively; (D) receiver operating characteristic curves of topological measures predicting cancer pathology on metabolite association networks (n = 28, 14/14). Predictions are based on logistic regression, cross-validated with leave-one-out cross-validation. The Area Under the Curve (AUC), 95% confidence interval (CI), and p-value of all topological measures are Nodes: AUC = 0.529, 95% CI = 0.488–0.570, p = 0.170, Edges: AUC = 0.526, 95% CI = 0.485–0.567, p = 0.216, Mean Connectivity: AUC = 0.545, 95% CI = 0.504–0.586, p = 0.0302, Mean Degree: AUC = 0.542, 95% CI = 0.501–0.583, p = 0.0470, Mean Closeness: AUC = 0.598, 95% CI = 0.557–0.638, p = 2.20 × 10⁻⁶, Mean Betweenness: AUC = 0.528, 95% CI = 0.487–0.570, p = 0.175, Diameter: AUC = 0.544, 95% CI = 0.503–0.585, p = 0.0369, Mean Minimal Distance: AUC = 0.547, 95% CI = 0.506–0.588, p = 0.0244, Mean Page Rank: AUC = 0.529, 95% CI = 0.488–0.570, p = 0.165, Hub Nodes: AUC = 0.552, 95% CI = 0.511–0.593, p = 0.0137, Centralization: AUC = 0.543, 95% CI = 0.502–0.584, p = 0.0422, and Transitivity: AUC = 0.527, 95% CI = 0.486–0.568, p = 0.196. Definitions of topological measures are given in Methods.
![Cancers 13 00393 g002]()
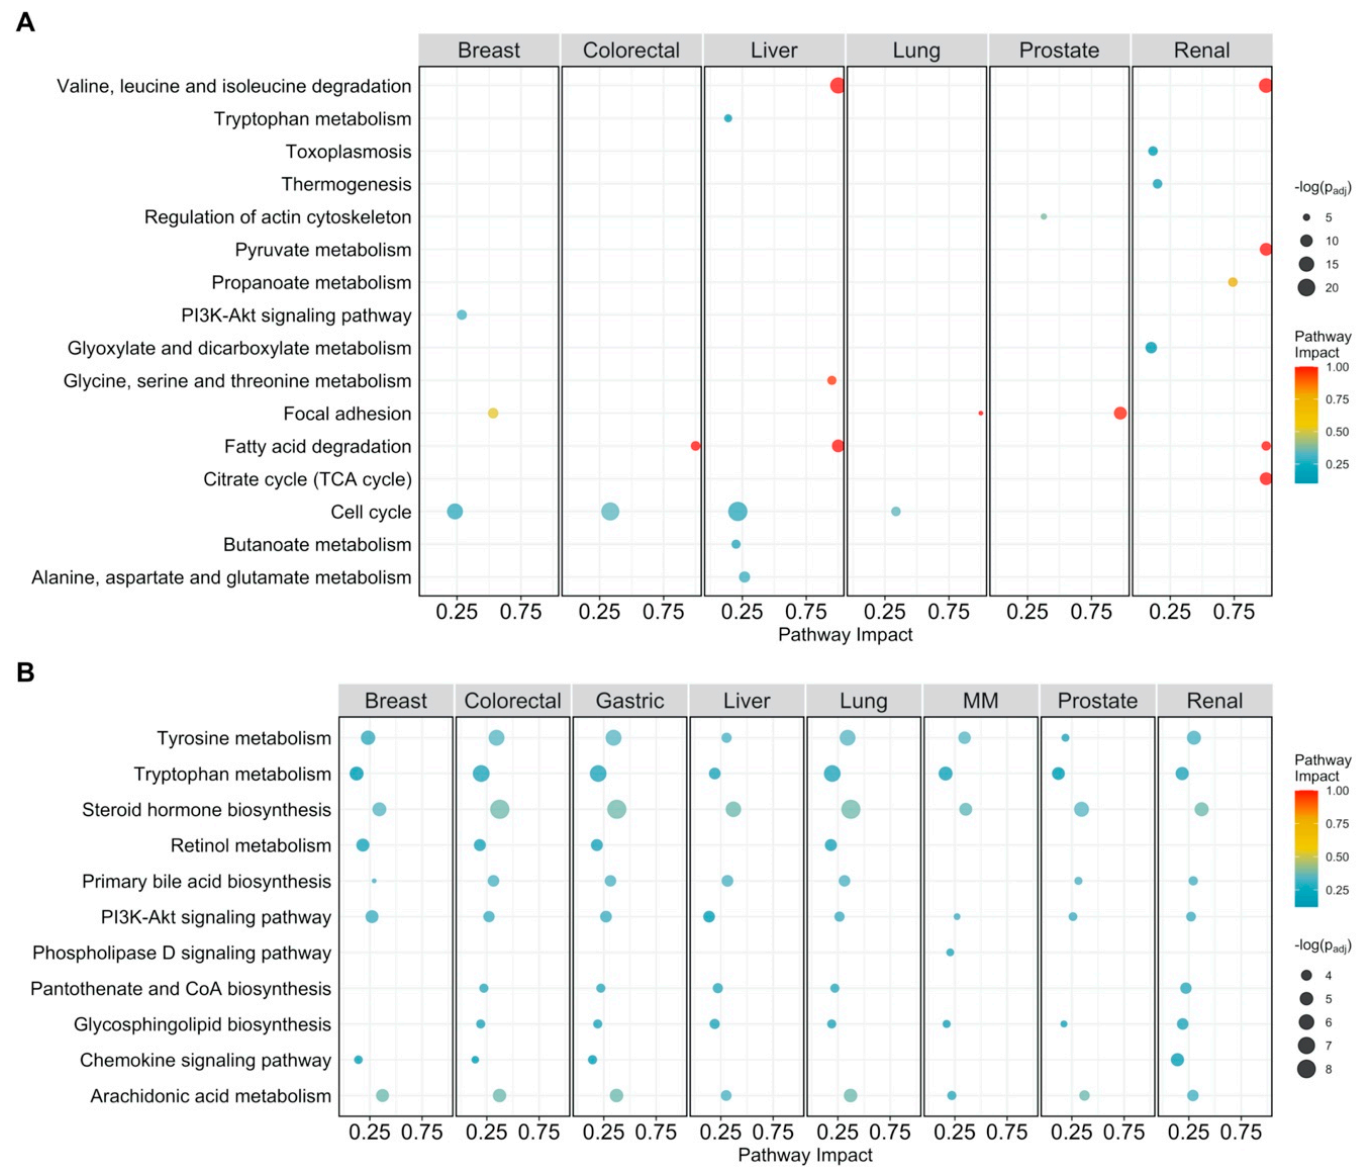
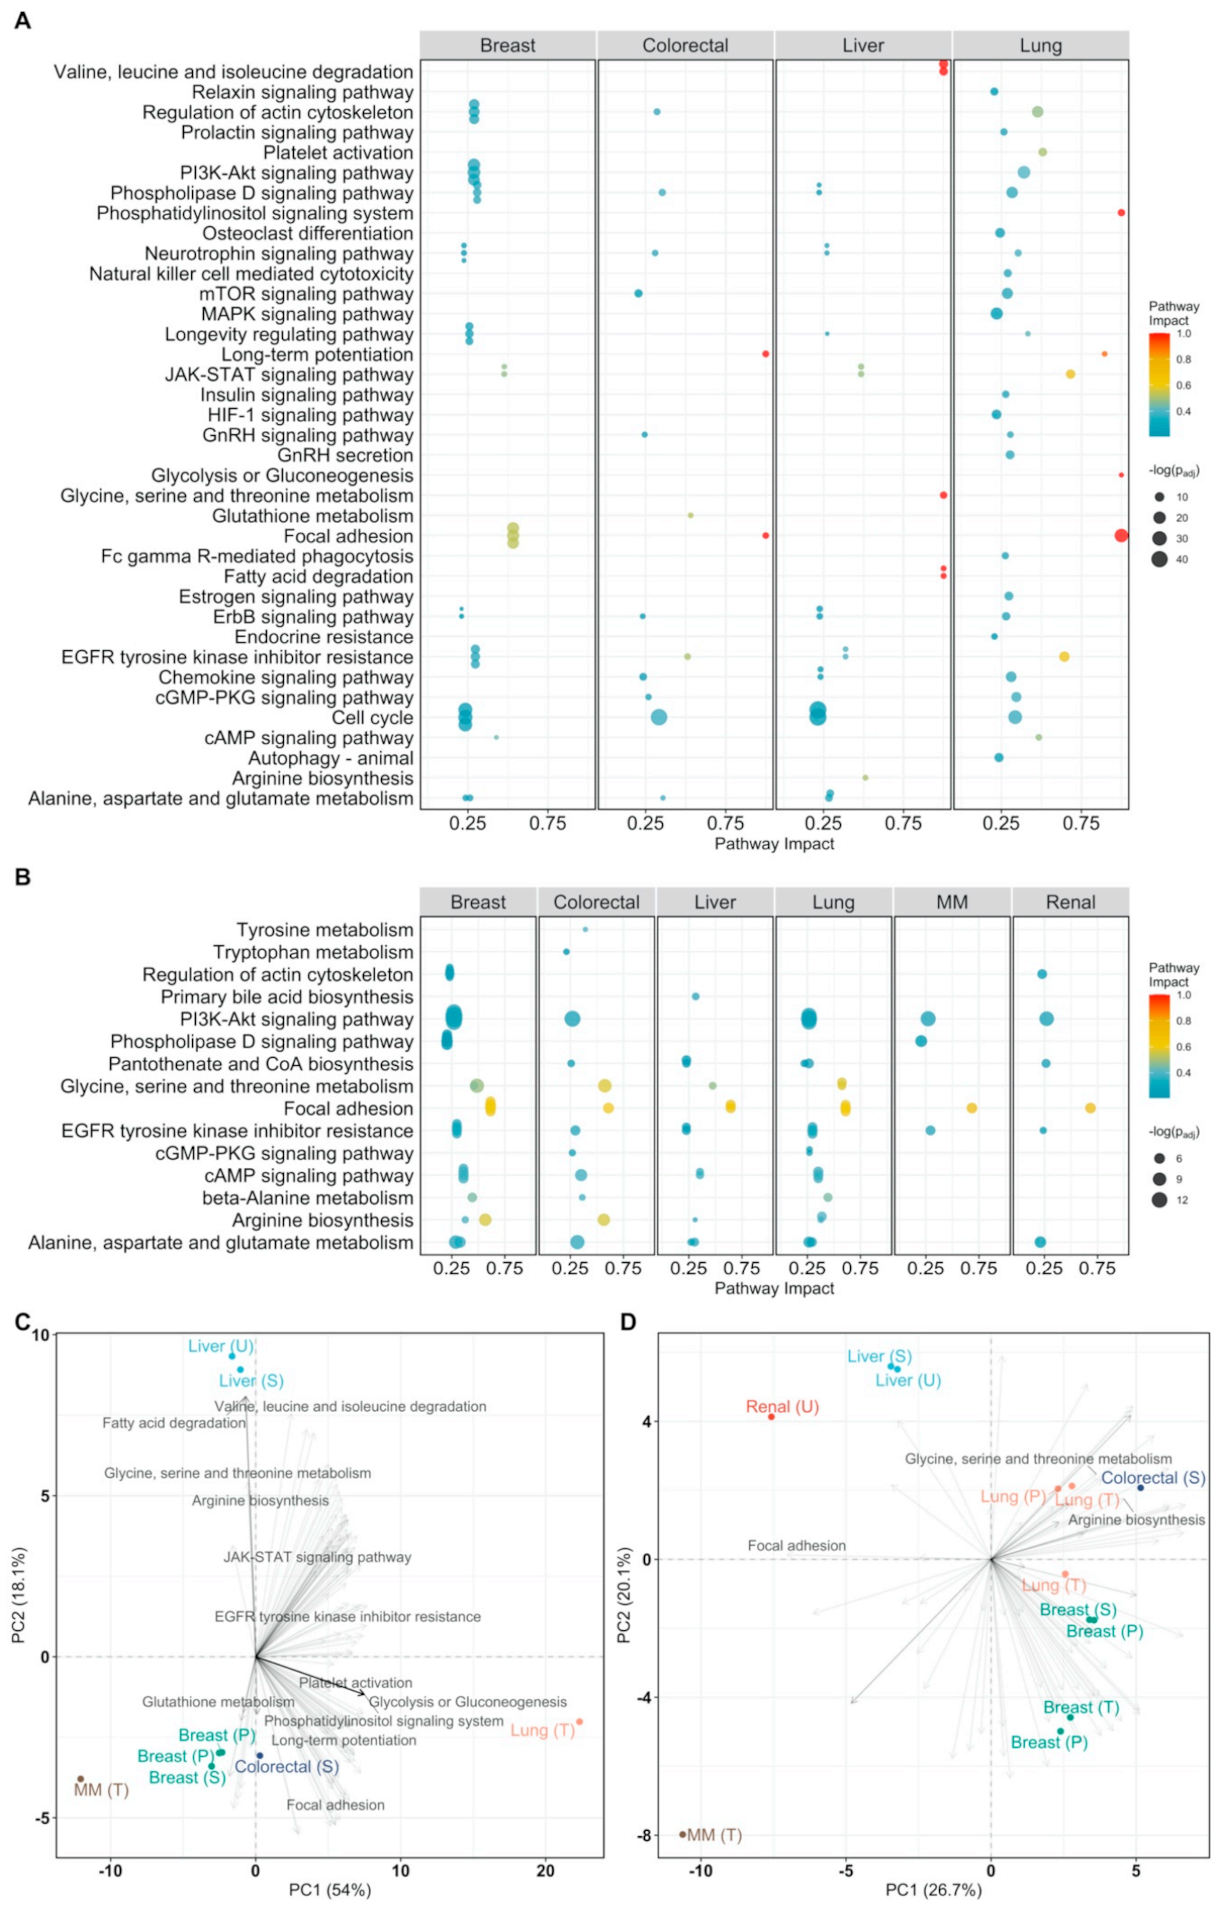
Figure 3.
Pathway analysis plot showing the impact on cellular pathways that are significantly enriched (padj < 0.05) and have a pathway impact score > 0.1 per cancer type. Datapoints are colored according to their impact score. Multiple myeloma is abbreviated as MM. (A) Pathway impact according to differentially expressed genes (padj < 0.05); (B) pathway impact according to differentially connected genes (padj < 0.05). padj indicates Benjamini–Hochberg corrected p-values.
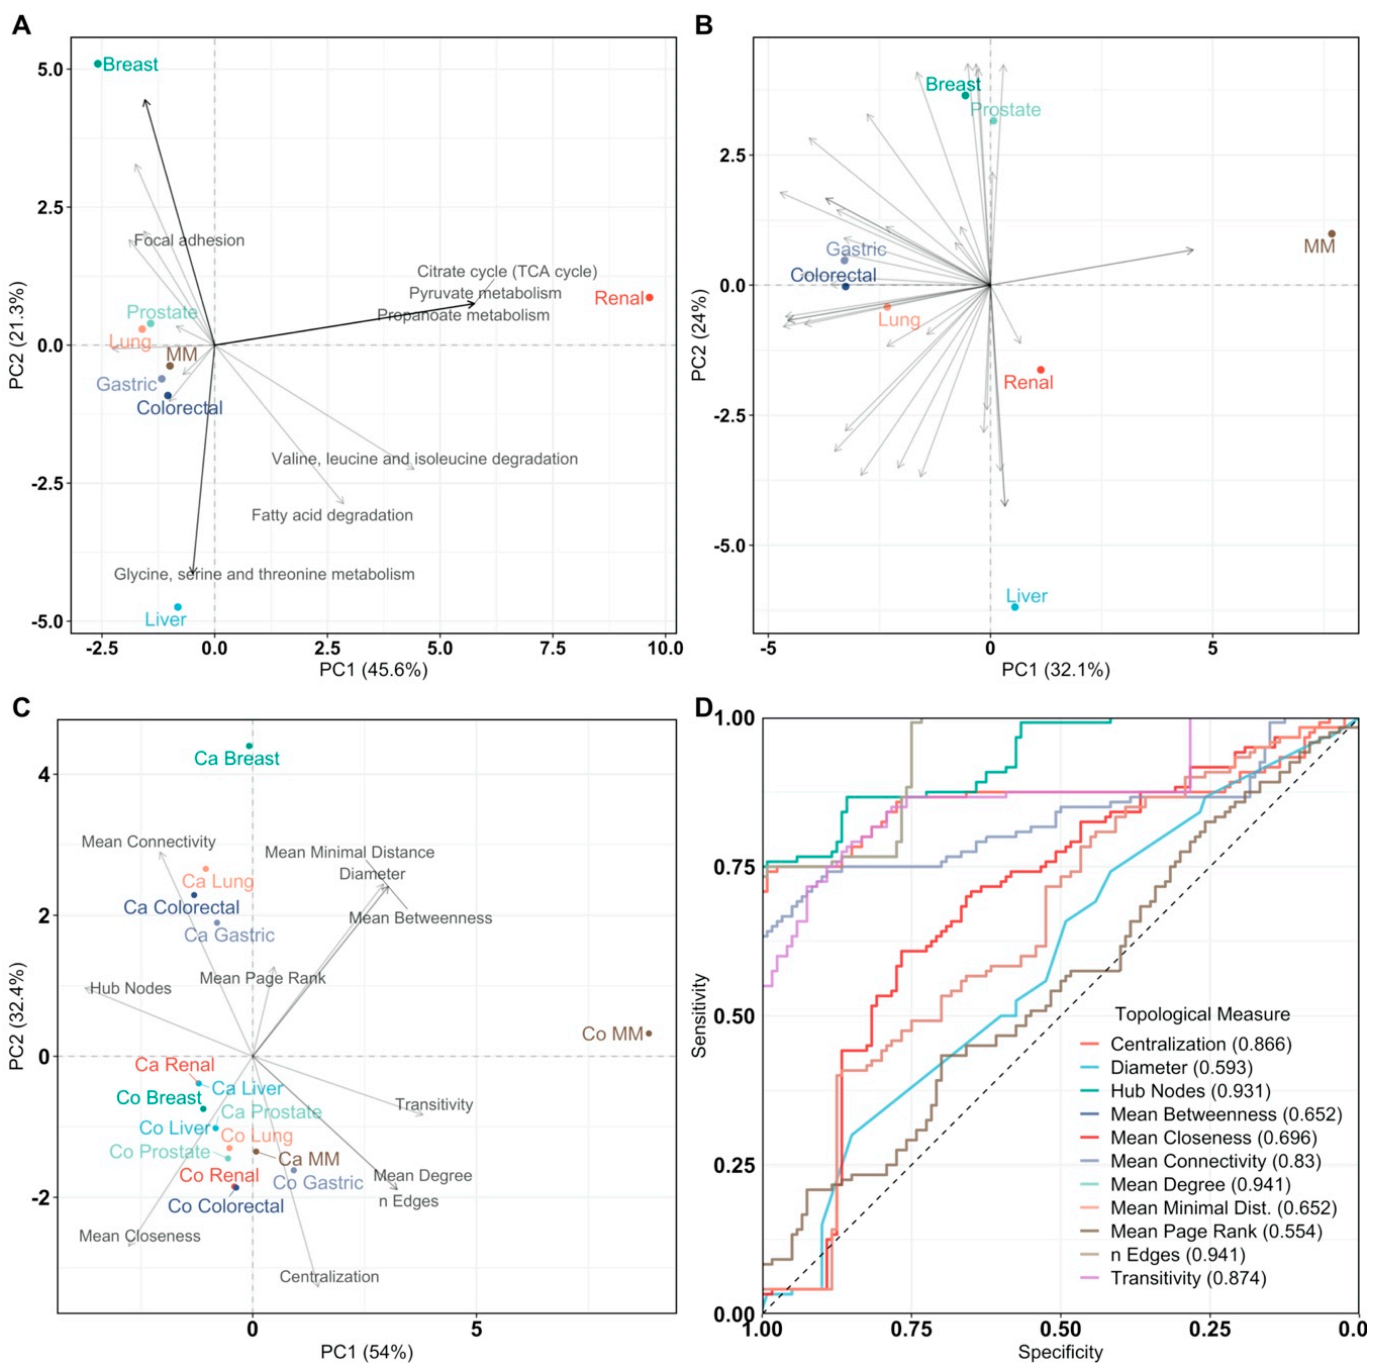
Figure 4.
Principal Component Analysis of pathway impact and network analysis. PCA labels are colored according to their cancer type and PCA loadings are labeled if they have a pathway impact score > 0.5. Multiple myeloma is abbreviated as MM. (A) PCA biplot of pathway impact based on differentially abundant genes per cancer type; (B) PCA biplot of pathway impact based on differentially connected genes per cancer type; (C) PCA biplot of topological network measures per cancer type for all inferred gene networks. Here, networks inferred from cancer or control samples are labeled as “Ca” and “Co”, respectively; (D) receiver operating characteristic curves of topological measures predicting cancer pathology on gene association networks (n = 16, 8/8). Predictions are based on logistic regression, cross-validated with leave-one-out cross-validation. The Area Under the Curve (AUC), 95% confidence interval (CI), and p-value of all topological measures are Edges: AUC = 0.941, 95% CI = 0.915–0.967, p = 7.59 × 10−242, Mean Connectivity: AUC = 0.830, 95% CI = 0.774–0.886, p = 8.80 × 10⁻³¹, Mean Degree: AUC =0.941, 95% CI = 0.915–0.967, p = 7.59 × 10−242, Mean Closeness: AUC = 0.696, 95% CI = 0.628–0.764, p = 1.85 × 10⁻⁸, Mean Betweenness: AUC = 0.652, 95% CI = 0.582–0.722, p = 2.14 × 10⁻⁵, Diameter: AUC = 0.593, 95% CI = 0.521–0.665, p = 0.0114, Mean Minimal Distance: AUC = 0.652, 95% CI = 0.582–0.722, p = 2.14 × 10⁻⁵, Mean Page Rank: AUC = 0.554, 95% CI = 0.481–0.627, p = 0.146, Hub Nodes: AUC = 0.931, 95% CI = 0.902–0.961, p = 2.93 × 10−178, Centralization: AUC = 0.866, 95% CI = 0.813–0.919, p = 8.00 × 10−42, and Transitivity: AUC = 0.874, 95% CI = 0.828–0.92, p = 1.48 × 10−56. Definitions of topological measures are given in Methods.
![Cancers 13 00393 g004]()
Figure 5.
Joint pathway analysis. Multiple myeloma is abbreviated as MM. Sample origin of the metabolomics counterpart is labeled as T, U, S, P for tissue, urine, serum, and plasma, respectively. (A) Pathway analysis score plot of the impact on cellular pathways that are significantly enriched (padj < 0.05) per cancer type according to differentially expressed genes (padj < 0.05) and differentially abundant metabolites (padj < 0.05); (B) pathway analysis score plot of the impact on cellular pathways that are significantly enriched (padj < 0.05) per cancer type according to differentially connected genes (padj < 0.05) and differentially connected metabolites (padj < 0.05). Data points are colored according to their impact score; (C) PCA biplot of pathway impact based on differentially expressed genes and differentially abundant metabolites per cancer type; (D) PCA biplot of pathway impact based on differentially connected genes and differentially connected metabolites per cancer type. Datapoints are colored according to their cancer type. PCA loadings are labeled only if corresponding to a pathway impact score >0.5. padj indicates Benjamini–Hochberg corrected p-values.
![Cancers 13 00393 g005]()
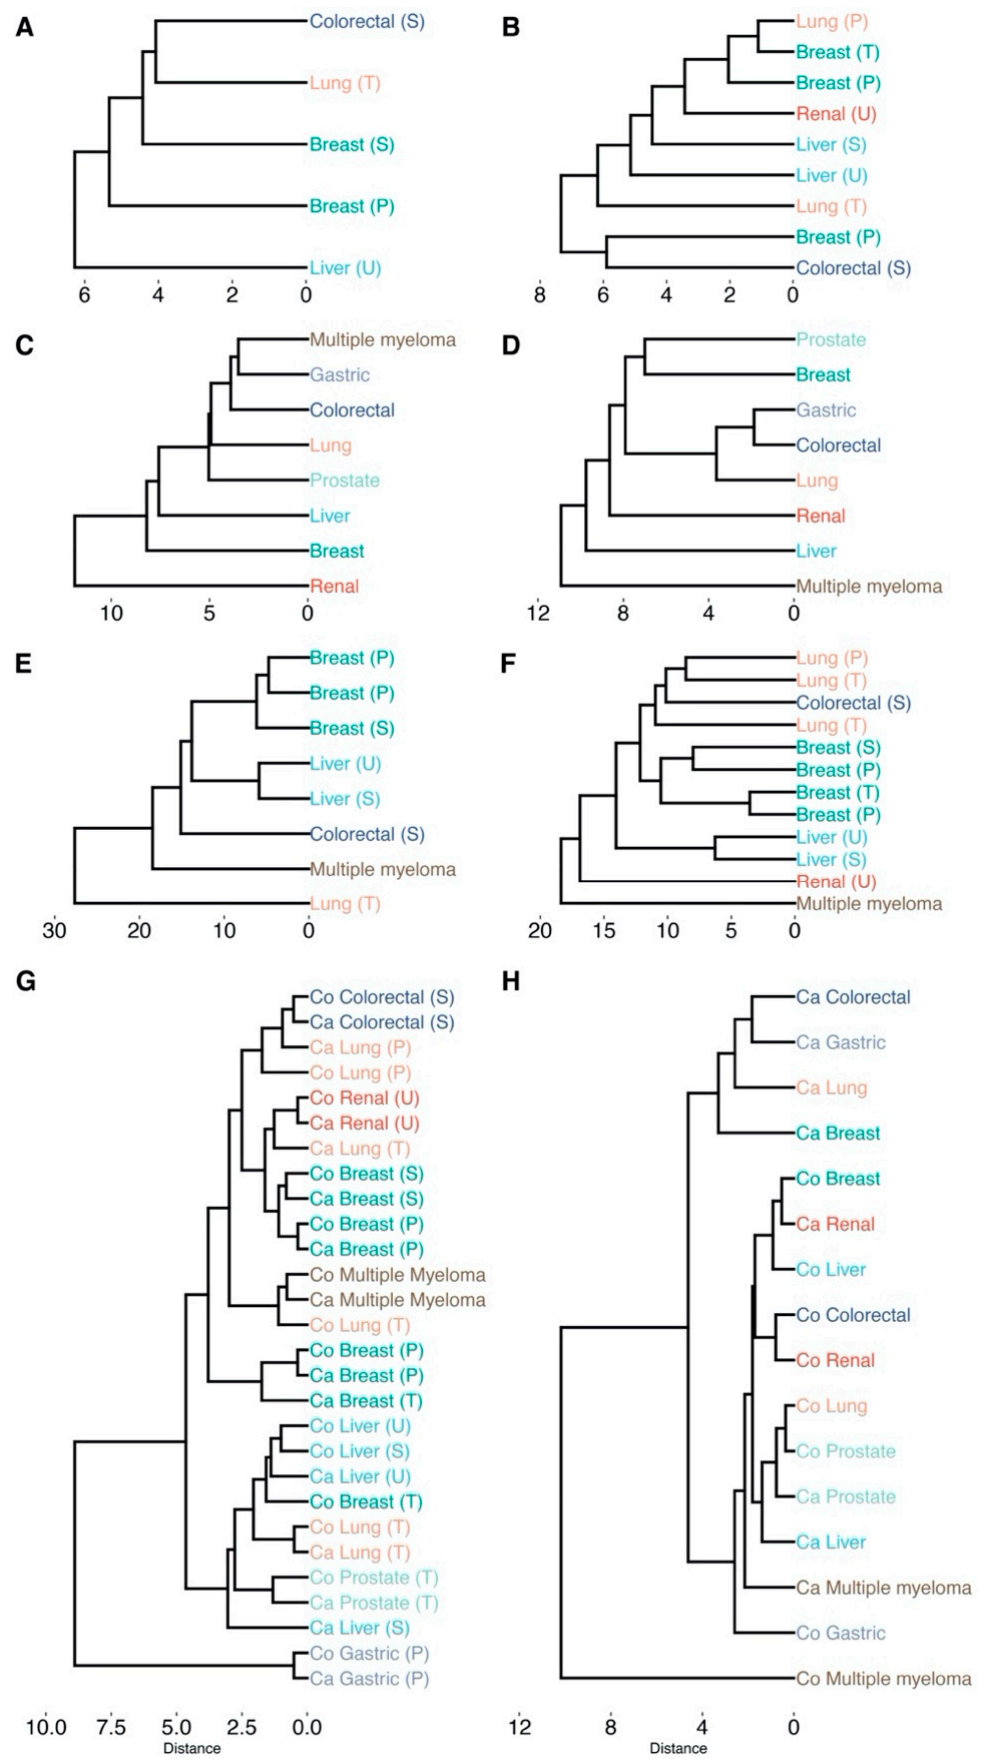
Figure 6.
Hierarchical clustering of cancer types based on the impact on cellular pathways that are significantly enriched (padj < 0.05). Labels are colored according to their cancer type. Sample origin is denoted as T, U, S, P for tissue, urine, serum and plasma, respectively (all transcriptomics analyses originate from tissue). All clustering is based on Euclidean distance and average linkage: (A) differentially abundant metabolites (padj < 0.05); (B) differentially connected metabolites (padj < 0.05); (C) differentially expressed genes (padj < 0.05); (D) differentially connected genes (padj < 0.05); (E) differentially abundant metabolites (padj < 0.05) and differentially expressed genes (padj < 0.05) conjoined; (F) differentially connected metabolites (padj < 0.05) and differentially connected genes (padj < 0.05) conjoined; (G) dendrogram based on the topological network measures per cancer type for all inferred metabolite association networks. Here, networks inferred from cancer or control samples are labeled as “Ca” and “Co”, respectively. (H) Dendrogram based on the topological network measures per cancer type for all inferred genes association networks. padj indicates Benjamini–Hochberg corrected p-values.
![Cancers 13 00393 g006]()
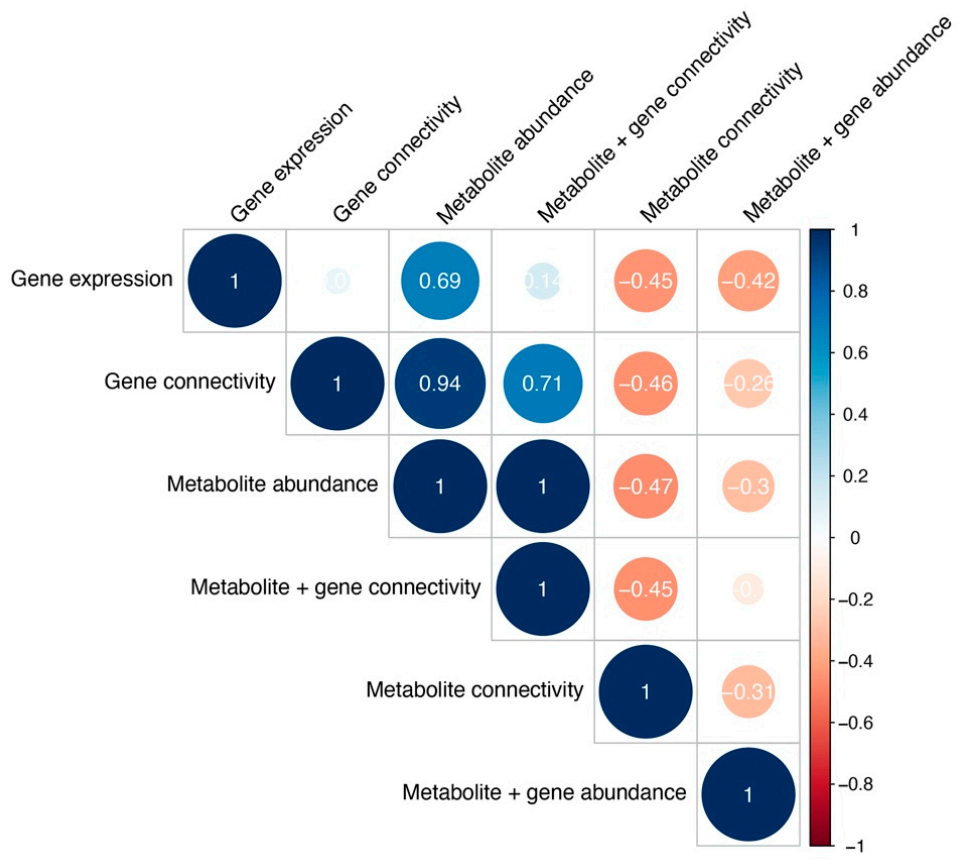
Figure 7.
Cophenetic correlations between cancer type clustering across different analyses, measuring clustering similarity. Color and size represent the Cophenetic correlation coefficient, with negative correlations depicted as red and correlations as blue.
Figure 7.
Cophenetic correlations between cancer type clustering across different analyses, measuring clustering similarity. Color and size represent the Cophenetic correlation coefficient, with negative correlations depicted as red and correlations as blue.
Table 1.
A summary of all 14 metabolomics and 8 transcriptomics data sets across eight different cancer types and different sampling origins. Data sets that are not accompanied by a paper are provided with their corresponding database ID from either the Metabolomics Workbench or the Gene Expression Omnibus.
| PubMed ID | Database ID | Data Type | Cancer Type | Sample Type | Cancer Samples | Control Samples | Metabolites/Genes |
|---|
| | ST000054 | Metabolomics | Breast | Tissue | 121 | 23 | 65 |
| 27036109 [15] | ST000355 | Metabolomics | Breast | Plasma | 138 | 77 | 221 |
| 27036109 [15] | ST000356 | Metabolomics | Breast | Serum | 104 | 32 | 262 |
| 31794572 [16] | | Metabolomics | Breast | Plasma | 80 | 60 | 69 |
| 25126899 [17] | ST000284 | Metabolomics | Colorectal | Serum | 66 | 92 | 113 |
| 29259332 [18] | | Metabolomics | Gastric | Plasma | 19 | 20 | 107 |
| 21518826 [19] | | Metabolomics | Liver | Serum | 82 | 71 | 66 |
| 21518826 [19] | | Metabolomics | Liver | Urine | 82 | 71 | 77 |
| | ST000390 | Metabolomics | Lung | Tissue | 70 | 10 | 182 |
| | ST000396 | Metabolomics | Lung | Plasma | 41 | 200 | 126 |
| 23543897 [20] | | Metabolomics | Lung | Tissue | 9 | 9 | 92 |
| | ST000221 | Metabolomics | Multiple myeloma | Tissue | 9 | 6 | 191 |
| 23543897 [20] | | Metabolomics | Prostate | Tissue | 7 | 7 | 72 |
| 21348635 [21] | | Metabolomics | Renal | Urine | 25 | 25 | 205 |
| 31594947 [22] | E-MTAB-6703 | Transcriptomics | Breast | Tissue | 2088 | 214 | 20,545 |
| 31594947 [22] | E-MTAB-6698 | Transcriptomics | Colorectal | Tissue | 1393 | 121 | 20,545 |
| 31594947 [22] | E-MTAB-6693 | Transcriptomics | Gastric | Tissue | 691 | 46 | 20,107 |
| 31594947 [22] | E-MTAB-6695 | Transcriptomics | Liver | Tissue | 264 | 137 | 20,107 |
| 31594947 [22] | E-MTAB-6699 | Transcriptomics | Lung | Tissue | 1474 | 147 | 20,545 |
| 24816239 [23] | GSE47552 | Transcriptomics | Multiple myeloma | Tissue | 41 | 4 | 22,470 |
| 31594947 [22] | E-MTAB-6694 | Transcriptomics | Prostate | Tissue | 121 | 116 | 20,107 |
| 31594947 [22] | E-MTAB-6692 | Transcriptomics | Renal | Tissue | 219 | 104 | 20,107 |
Table 2.
Overview of the number of significantly differentially abundant metabolites per data set and cancer type (Benjamini–Hochberg adjusted p-value padj < 0.05).
Table 2.
Overview of the number of significantly differentially abundant metabolites per data set and cancer type (Benjamini–Hochberg adjusted p-value padj < 0.05).
| Data Set | Cancer | Type | Metabolites | Differentially Abundant (padj < 0.05) |
|---|
| 31794572 [16] | Breast | Plasma | 69 | 41 |
| ST000054 | Breast | Tissue | 65 | 2 |
| 27036109 [15] | Breast | Plasma | 221 | 87 |
| 27036109 [15] | Breast | Serum | 262 | 182 |
| 25126899 [17] | Colorectal | Serum | 113 | 25 |
| 29259332 [18] | Gastric | Plasma | 104 | 4 |
| 21518826 [19] | Liver | Serum | 63 | 30 |
| 21518826 [19] | Liver | Urine | 77 | 47 |
| 23543897 [20] | Lung | Tissue | 92 | 43 |
| ST000396 | Lung | Plasma | 126 | 1 |
| ST000390 | Lung | Tissue | 182 | 3 |
| ST000221 | Multiple myeloma | Tissue | 191 | 114 |
| 23543897 [20] | Prostate | Tissue | 72 | 0 |
| 21348635 [21] | Renal | Urine | 205 | 0 |
Table 3.
Topological network characteristics of cancer (Ca) and control (Co) metabolite association networks across cancer types. Sample origin is labeled as T, U, S, P for tissue, urine, serum, and plasma, respectively. MM is multiple myeloma and data set identifiers are noted as: * ST000054, § ST000221, # ST000390 and † ST000396. Topological measures in the column names are: N = Nodes, E = Edges, Mean Conn. = Mean Connectivity, Mean Deg. = Mean Degree, Mean Close. = Mean Closeness, Mean Betw. = Mean Betweenness, D = Diameter, Mean Min. Dist. = Mean Minimal Distance, Mean Page Rank, Hub N = Hub Nodes, Centr. = Centralization, and Trans. = Transivity. All topological measures are further explained in the material and methods.
| Network | N | E | Mean Conn. | Mean Deg. | Mean Close. | Mean Betw. | D | Mean Min. Dist. | Mean Page Rank | Hub N | Centr. | Trans. |
|---|
| Ca Renal (U) [21] | 203 | 1939 | 0.407 | 0.095 | 0.348 | 0.009 | 6 | 2.886 | 0.005 | 95 | 0.163 | 0.191 |
| Co Renal (U) [21] | 203 | 1889 | 0.435 | 0.092 | 0.344 | 0.010 | 5 | 2.920 | 0.005 | 100 | 0.225 | 0.195 |
| Ca Liver (S) [19] | 62 | 229 | 0.547 | 0.121 | 0.205 | 0.067 | 11 | 5.003 | 0.016 | 43 | 0.207 | 0.036 |
| Co Liver (S) [19] | 62 | 191 | 0.428 | 0.101 | 0.051 | 0.036 | 11 | 4.489 | 0.016 | 40 | 0.129 | 0.025 |
| Ca Liver (U) [19] | 77 | 357 | 0.373 | 0.122 | 0.081 | 0.028 | 9 | 3.588 | 0.013 | 46 | 0.220 | 0.247 |
| Co Liver (U) [19] | 77 | 289 | 0.355 | 0.099 | 0.076 | 0.036 | 10 | 4.394 | 0.013 | 40 | 0.164 | 0.149 |
| Ca Lung (T) [20] | 91 | 632 | 0.272 | 0.154 | 0.152 | 0.026 | 8 | 3.484 | 0.011 | 14 | 0.223 | 0.457 |
| Co Lung (T) [20] | 91 | 612 | 0.263 | 0.149 | 0.135 | 0.023 | 8 | 3.239 | 0.011 | 15 | 0.295 | 0.372 |
| Ca Prostate (T) [20] | 72 | 294 | 0.168 | 0.115 | 0.052 | 0.045 | 16 | 5.513 | 0.014 | 9 | 0.167 | 0.447 |
| Co Prostate (T) [20] | 72 | 276 | 0.148 | 0.108 | 0.065 | 0.049 | 12 | 5.493 | 0.014 | 21 | 0.117 | 0.482 |
| Ca Gastric (P) [18] | 103 | 10204 | 2.072 | 1.943 | 0.243 | 0.000 | 1 | 1.000 | 0.010 | 0 | 2.018 | 1.000 |
| Co Gastric (P) [18] | 103 | 10004 | 2.225 | 1.904 | 0.193 | 0.000 | 1 | 1.000 | 0.010 | 0 | 2.017 | 1.000 |
| Ca Breast (P) [16] | 68 | 585 | 1.094 | 0.257 | 0.436 | 0.020 | 4 | 2.307 | 0.015 | 39 | 0.131 | 0.157 |
| Co Breast (P) [16] | 68 | 637 | 1.078 | 0.280 | 0.449 | 0.019 | 4 | 2.238 | 0.015 | 28 | 0.168 | 0.185 |
| Ca Breast (T) * | 65 | 499 | 0.566 | 0.240 | 0.370 | 0.028 | 5 | 2.750 | 0.015 | 8 | 0.229 | 0.334 |
| Co Breast (T) * | 65 | 293 | 0.409 | 0.141 | 0.106 | 0.042 | 10 | 4.130 | 0.015 | 23 | 0.234 | 0.397 |
| Ca MM (T) § | 191 | 3171 | 0.233 | 0.175 | 0.334 | 0.011 | 6 | 3.073 | 0.005 | 13 | 0.404 | 0.613 |
| Co MM (T) § | 191 | 2807 | 0.217 | 0.155 | 0.328 | 0.011 | 6 | 3.065 | 0.005 | 1 | 0.151 | 0.506 |
| Ca Colorectal (S) [17] | 113 | 813 | 0.650 | 0.128 | 0.347 | 0.017 | 6 | 2.911 | 0.009 | 59 | 0.122 | 0.169 |
| Co Colorectal (S) [17] | 113 | 713 | 0.710 | 0.113 | 0.327 | 0.019 | 7 | 3.100 | 0.009 | 69 | 0.084 | 0.141 |
| Ca Breast (P) [15] | 221 | 2863 | 0.941 | 0.118 | 0.389 | 0.007 | 4 | 2.585 | 0.005 | 78 | 0.146 | 0.215 |
| Co Breast (P) [15] | 221 | 2857 | 0.853 | 0.118 | 0.389 | 0.007 | 5 | 2.581 | 0.005 | 78 | 0.110 | 0.224 |
| Ca Breast (S) [15] | 260 | 3778 | 0.667 | 0.112 | 0.390 | 0.006 | 5 | 2.581 | 0.004 | 89 | 0.228 | 0.215 |
| Co Breast (S) [15] | 260 | 3500 | 0.463 | 0.104 | 0.377 | 0.006 | 6 | 2.675 | 0.004 | 69 | 0.143 | 0.233 |
| Ca Lung (T) # | 182 | 1614 | 0.732 | 0.098 | 0.261 | 0.010 | 5 | 2.831 | 0.005 | 123 | 0.101 | 0.153 |
| Co Lung (T) # | 182 | 2116 | 0.274 | 0.128 | 0.258 | 0.010 | 6 | 2.885 | 0.005 | 19 | 0.225 | 0.398 |
| Ca Lung (P) † | 126 | 878 | 0.460 | 0.111 | 0.247 | 0.016 | 7 | 3.055 | 0.008 | 62 | 0.113 | 0.189 |
| Co Lung (P) † | 126 | 914 | 0.833 | 0.116 | 0.169 | 0.014 | 5 | 2.844 | 0.008 | 98 | 0.140 | 0.110 |
Table 4.
Overview of the number of significantly differentially connected metabolites per data set and cancer type (Benjamini–Hochberg adjusted p-value padj < 0.05) according to inferred metabolite association networks.
Table 4.
Overview of the number of significantly differentially connected metabolites per data set and cancer type (Benjamini–Hochberg adjusted p-value padj < 0.05) according to inferred metabolite association networks.
| Data Set | Cancer | Type | Metabolites | Differentially Connected |
|---|
| 31794572 [16] | Breast | Plasma | 69 | 60 |
| ST000054 | Breast | Tissue | 65 | 48 |
| 27036109 [15] | Breast | Plasma | 221 | 181 |
| 27036109 [15] | Breast | Serum | 262 | 191 |
| 25126899 [17] | Colorectal | Serum | 113 | 100 |
| 29259332 [18] | Gastric | Plasma | 104 | 4 |
| 21518826 [19] | Liver | Serum | 63 | 52 |
| 21518826 [19] | Liver | Urine | 77 | 64 |
| 23543897 [20] | Lung | Tissue | 92 | 13 |
| ST000396 | Lung | Plasma | 126 | 114 |
| ST000390 | Lung | Tissue | 182 | 139 |
| ST000221 | Multiple myeloma | Tissue | 191 | 48 |
| 23543897 [20] | Prostate | Tissue | 72 | 0 |
| 21348635 [21] | Renal | Urine | 205 | 109 |
Table 5.
Overview of the number of significantly differentially expressed genes per cancer type (Benjamini–Hochberg adjusted p-value (padj) < 0.05).
Table 5.
Overview of the number of significantly differentially expressed genes per cancer type (Benjamini–Hochberg adjusted p-value (padj) < 0.05).
| Data Set | Cancer | Genes | Differentially Expressed |
|---|
| E-MTAB-6703 [22] | Breast | 20,545 | 2892 |
| E-MTAB-6698 [22] | Colorectal | 20,545 | 5577 |
| E-MTAB-6693 [22] | Gastric | 20,107 | 691 |
| E-MTAB-6695 [22] | Liver | 20,107 | 5225 |
| E-MTAB-6699 [22] | Lung | 20,545 | 9086 |
| GSE47552 [23] | Multiple myeloma | 22,470 | 132 |
| E-MTAB-6694 [22] | Prostate | 20,107 | 3691 |
| E-MTAB-6692 [22] | Renal | 20,107 | 9265 |
Table 6.
Topological network characteristics of cancer (Ca) and control (Co) gene association networks across cancer types. Multiple myeloma is abbreviated as MM. Topological measures in the column names are: N = Nodes, E = Edges, Mean Conn. = Mean Connectivity, Mean Deg. = Mean Degree, Mean Close. = Mean Closeness, Mean Betw. = Mean Betweenness, D = Diameter, Mean Min. Dist. = Mean Minimal Distance, Mean Page Rank, Hub N = Hub Nodes, Centr. = Centralization, and Trans. = Transivity. All topological measures are further explained in the material and methods.
| Network | N | E | Mean Conn. | Mean Deg. | Mean Close. | Mean Betw. | D | Mean Min. Dist. | Mean Page Rank | Hub N | Centr. | Trans. |
|---|
| Ca Renal [22] | 2570 | 148,296 | 0.811 | 0.045 | 0.433 | 0.001 | 3 | 2.311 | 0.000 | 2347 | 0.040 | 0.082 |
| Co Renal [22] | 2570 | 164,272 | 0.576 | 0.050 | 0.440 | 0.000 | 3 | 2.277 | 0.000 | 2055 | 0.086 | 0.121 |
| Ca Gastric [22] | 2570 | 111,026 | 1.273 | 0.034 | 0.398 | 0.001 | 4 | 2.513 | 0.000 | 2349 | 0.040 | 0.063 |
| Co Gastric [22] | 2570 | 163,932 | 0.366 | 0.050 | 0.425 | 0.001 | 4 | 2.357 | 0.000 | 1508 | 0.087 | 0.209 |
| Ca Prostate [22] | 2570 | 160,446 | 0.627 | 0.049 | 0.442 | 0.000 | 3 | 2.267 | 0.000 | 2251 | 0.061 | 0.091 |
| Co Prostate [22] | 2570 | 166,152 | 0.629 | 0.050 | 0.443 | 0.000 | 3 | 2.262 | 0.000 | 2149 | 0.078 | 0.107 |
| Ca Liver [22] | 2570 | 156,934 | 0.922 | 0.048 | 0.441 | 0.000 | 3 | 2.270 | 0.000 | 2358 | 0.047 | 0.081 |
| Co Liver [22] | 2570 | 151,116 | 0.620 | 0.046 | 0.433 | 0.001 | 3 | 2.314 | 0.000 | 2228 | 0.061 | 0.090 |
| Ca Colorectal [22] | 2570 | 108,138 | 1.687 | 0.033 | 0.398 | 0.001 | 4 | 2.518 | 0.000 | 2484 | 0.033 | 0.041 |
| Co Colorectal [22] | 2570 | 179,636 | 0.666 | 0.054 | 0.449 | 0.000 | 3 | 2.232 | 0.000 | 1904 | 0.074 | 0.139 |
| Ca Lung [22] | 2570 | 80,344 | 1.440 | 0.024 | 0.371 | 0.001 | 4 | 2.695 | 0.000 | 2483 | 0.030 | 0.038 |
| Co Lung [22] | 2570 | 168,414 | 0.713 | 0.051 | 0.443 | 0.000 | 3 | 2.264 | 0.000 | 2063 | 0.073 | 0.117 |
| Ca Breast [22] | 2570 | 50,256 | 1.164 | 0.015 | 0.334 | 0.001 | 5 | 3.000 | 0.000 | 2512 | 0.018 | 0.034 |
| Co Breast [22] | 2570 | 155,668 | 0.812 | 0.047 | 0.438 | 0.001 | 3 | 2.286 | 0.000 | 2283 | 0.050 | 0.082 |
| Ca MM [23] | 2570 | 145,712 | 0.325 | 0.044 | 0.418 | 0.001 | 3 | 2.395 | 0.000 | 2067 | 0.087 | 0.158 |
| Co MM [23] | 2570 | 356,528 | 0.152 | 0.108 | 0.292 | 0.001 | 6 | 3.423 | 0.000 | 0 | 0.080 | 0.602 |
Table 7.
Overview of the number of significantly differentially expressed genes per cancer type (padj < 0.05) according to inferred gene association networks. padj indicates Benjamini–Hochberg corrected p-values.
Table 7.
Overview of the number of significantly differentially expressed genes per cancer type (padj < 0.05) according to inferred gene association networks. padj indicates Benjamini–Hochberg corrected p-values.
| Data Set | Cancer | Genes | Differentially Connected (padj < 0.05) |
|---|
| E-MTAB-6703 [22] | Breast | 2570 | 2404 |
| E-MTAB-6698 [22] | Colorectal | 2570 | 2550 |
| E-MTAB-6693 [22] | Gastric | 2570 | 2552 |
| E-MTAB-6695 [22] | Liver | 2570 | 2345 |
| E-MTAB-6699 [22] | Lung | 2570 | 2536 |
| GSE47552 [23] | Multiple myeloma | 2570 | 2005 |
| E-MTAB-6694 [22] | Prostate | 2570 | 2146 |
| E-MTAB-6692 [22] | Renal | 2570 | 2155 |


