
Genome-Wide Circular RNA Expression Patterns Reflect Resistance to Immunomodulatory Drugs in Multiple Myeloma Cells

 and
and 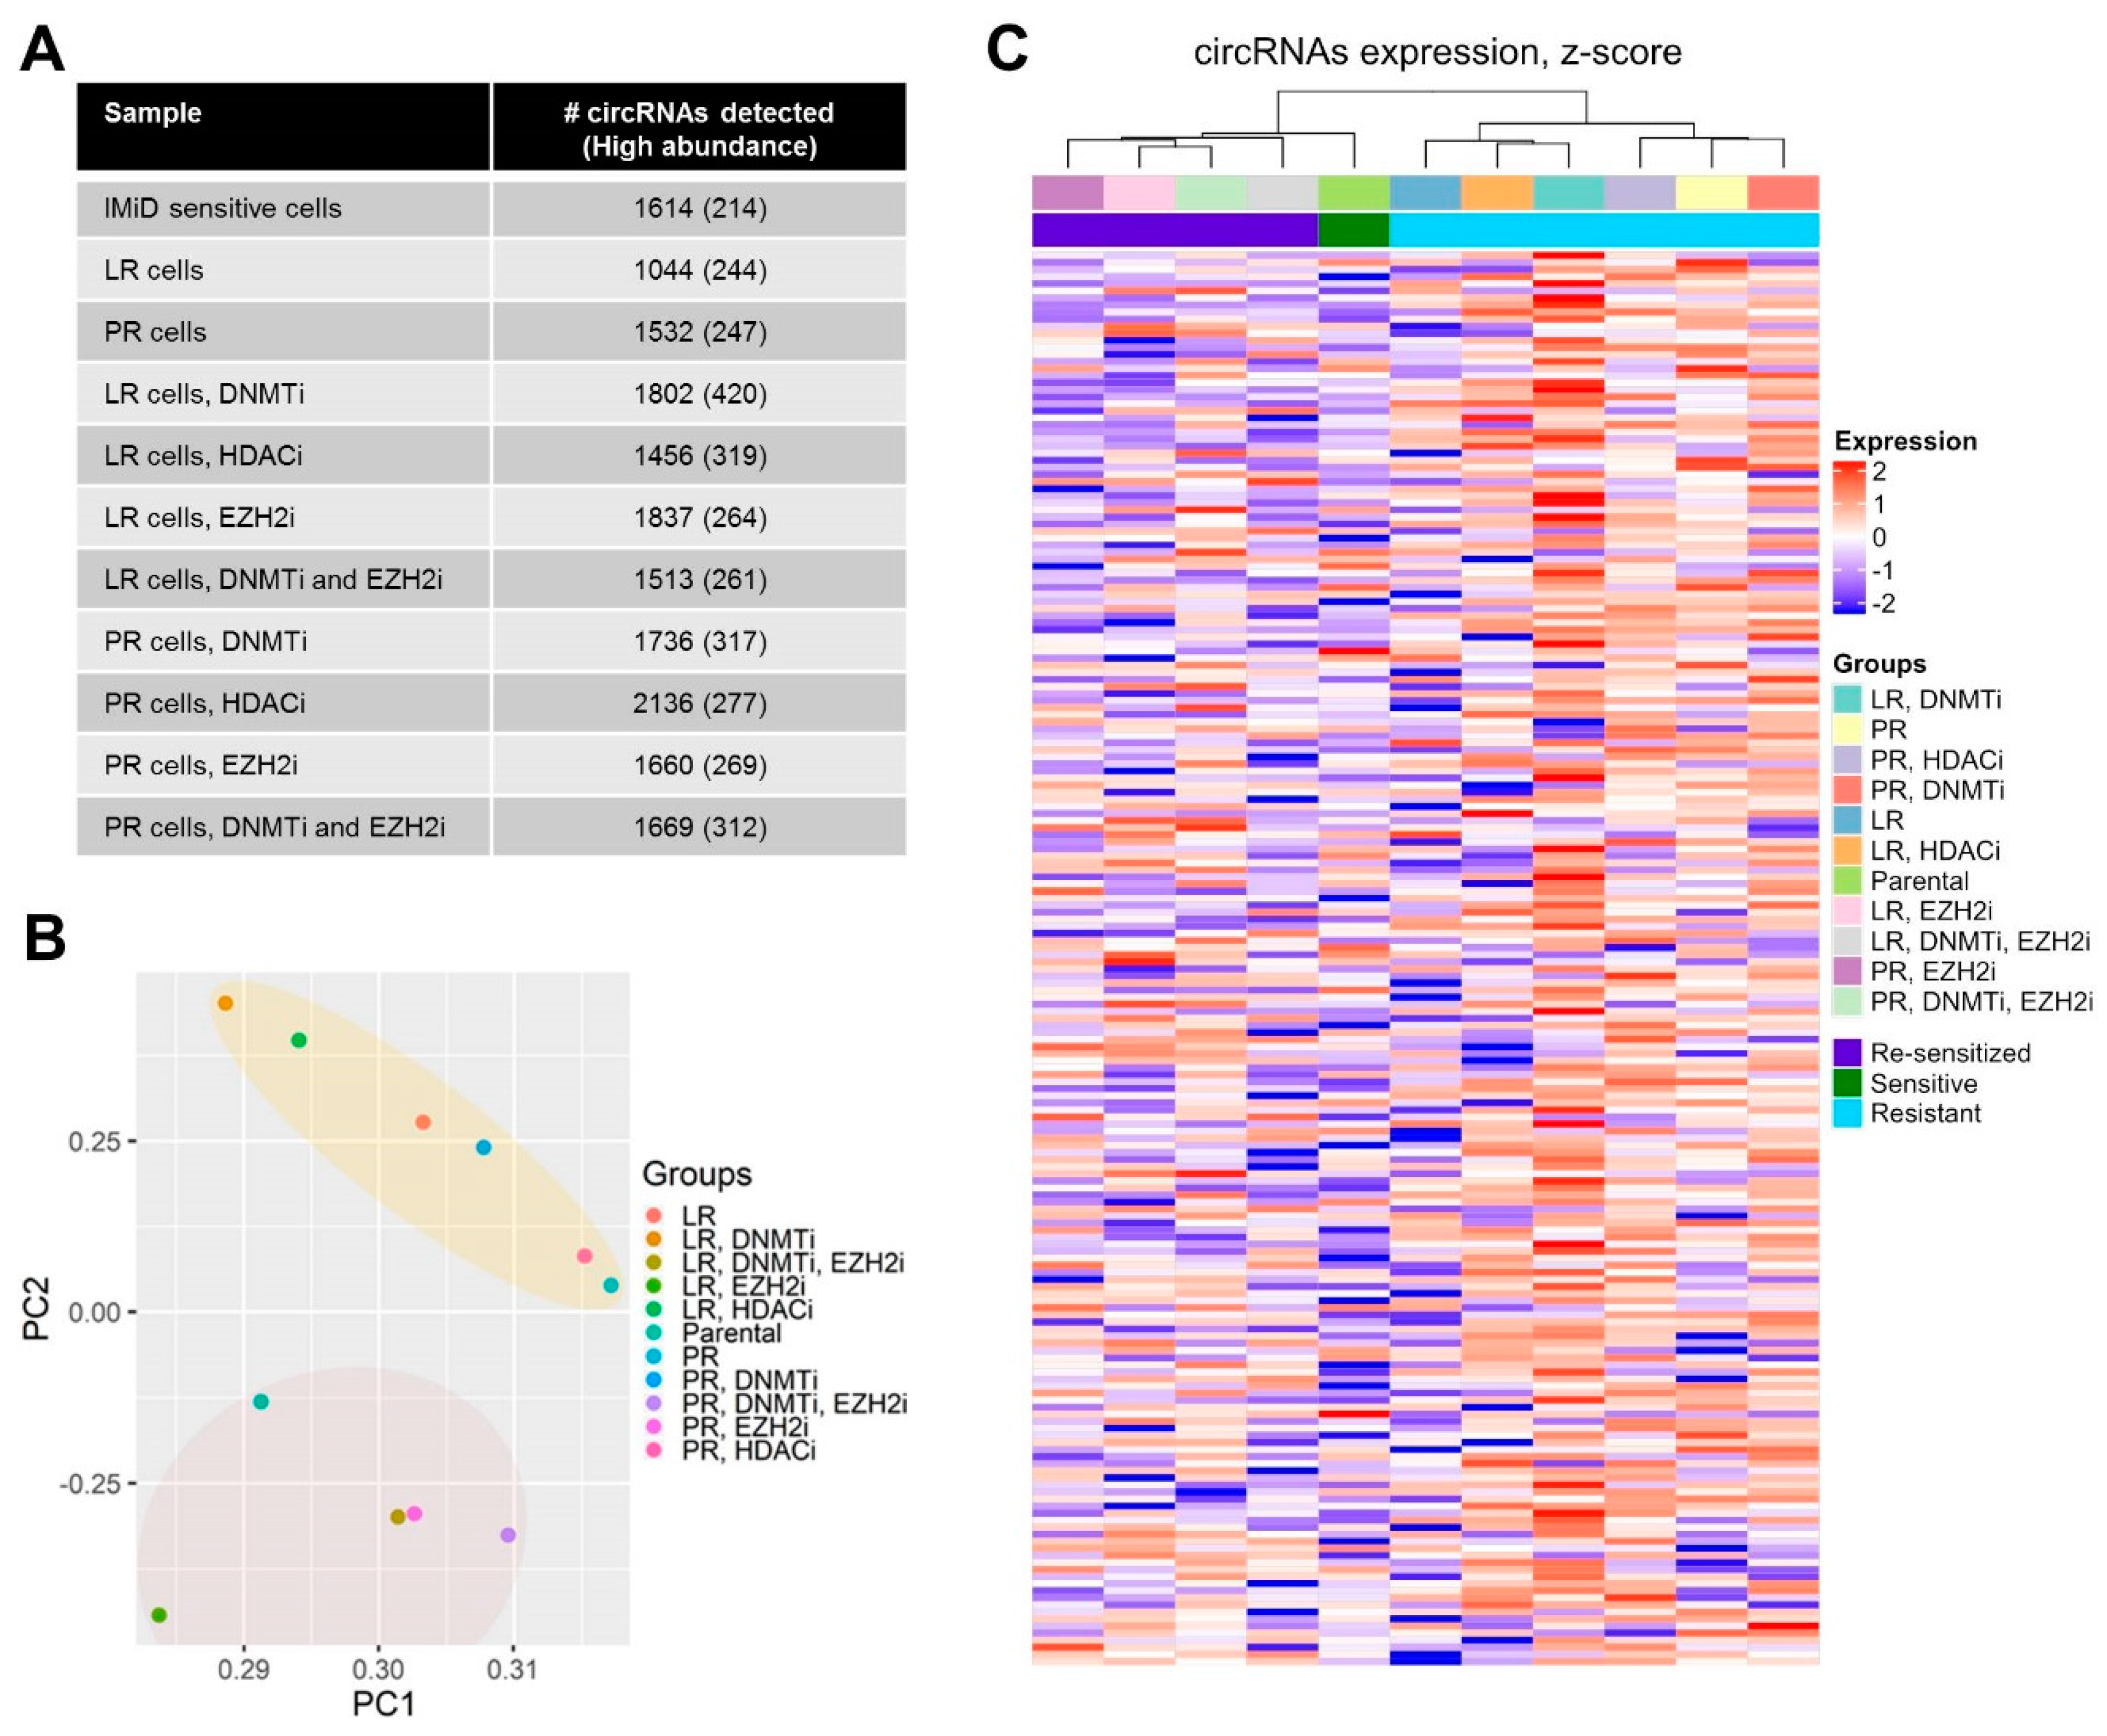
Abstract
:Simple Summary
Abstract
1. Introduction
2. Results
2.1. Genome-Wide circRNA Expression Patterns Reflect Sensitivity to IMiDs
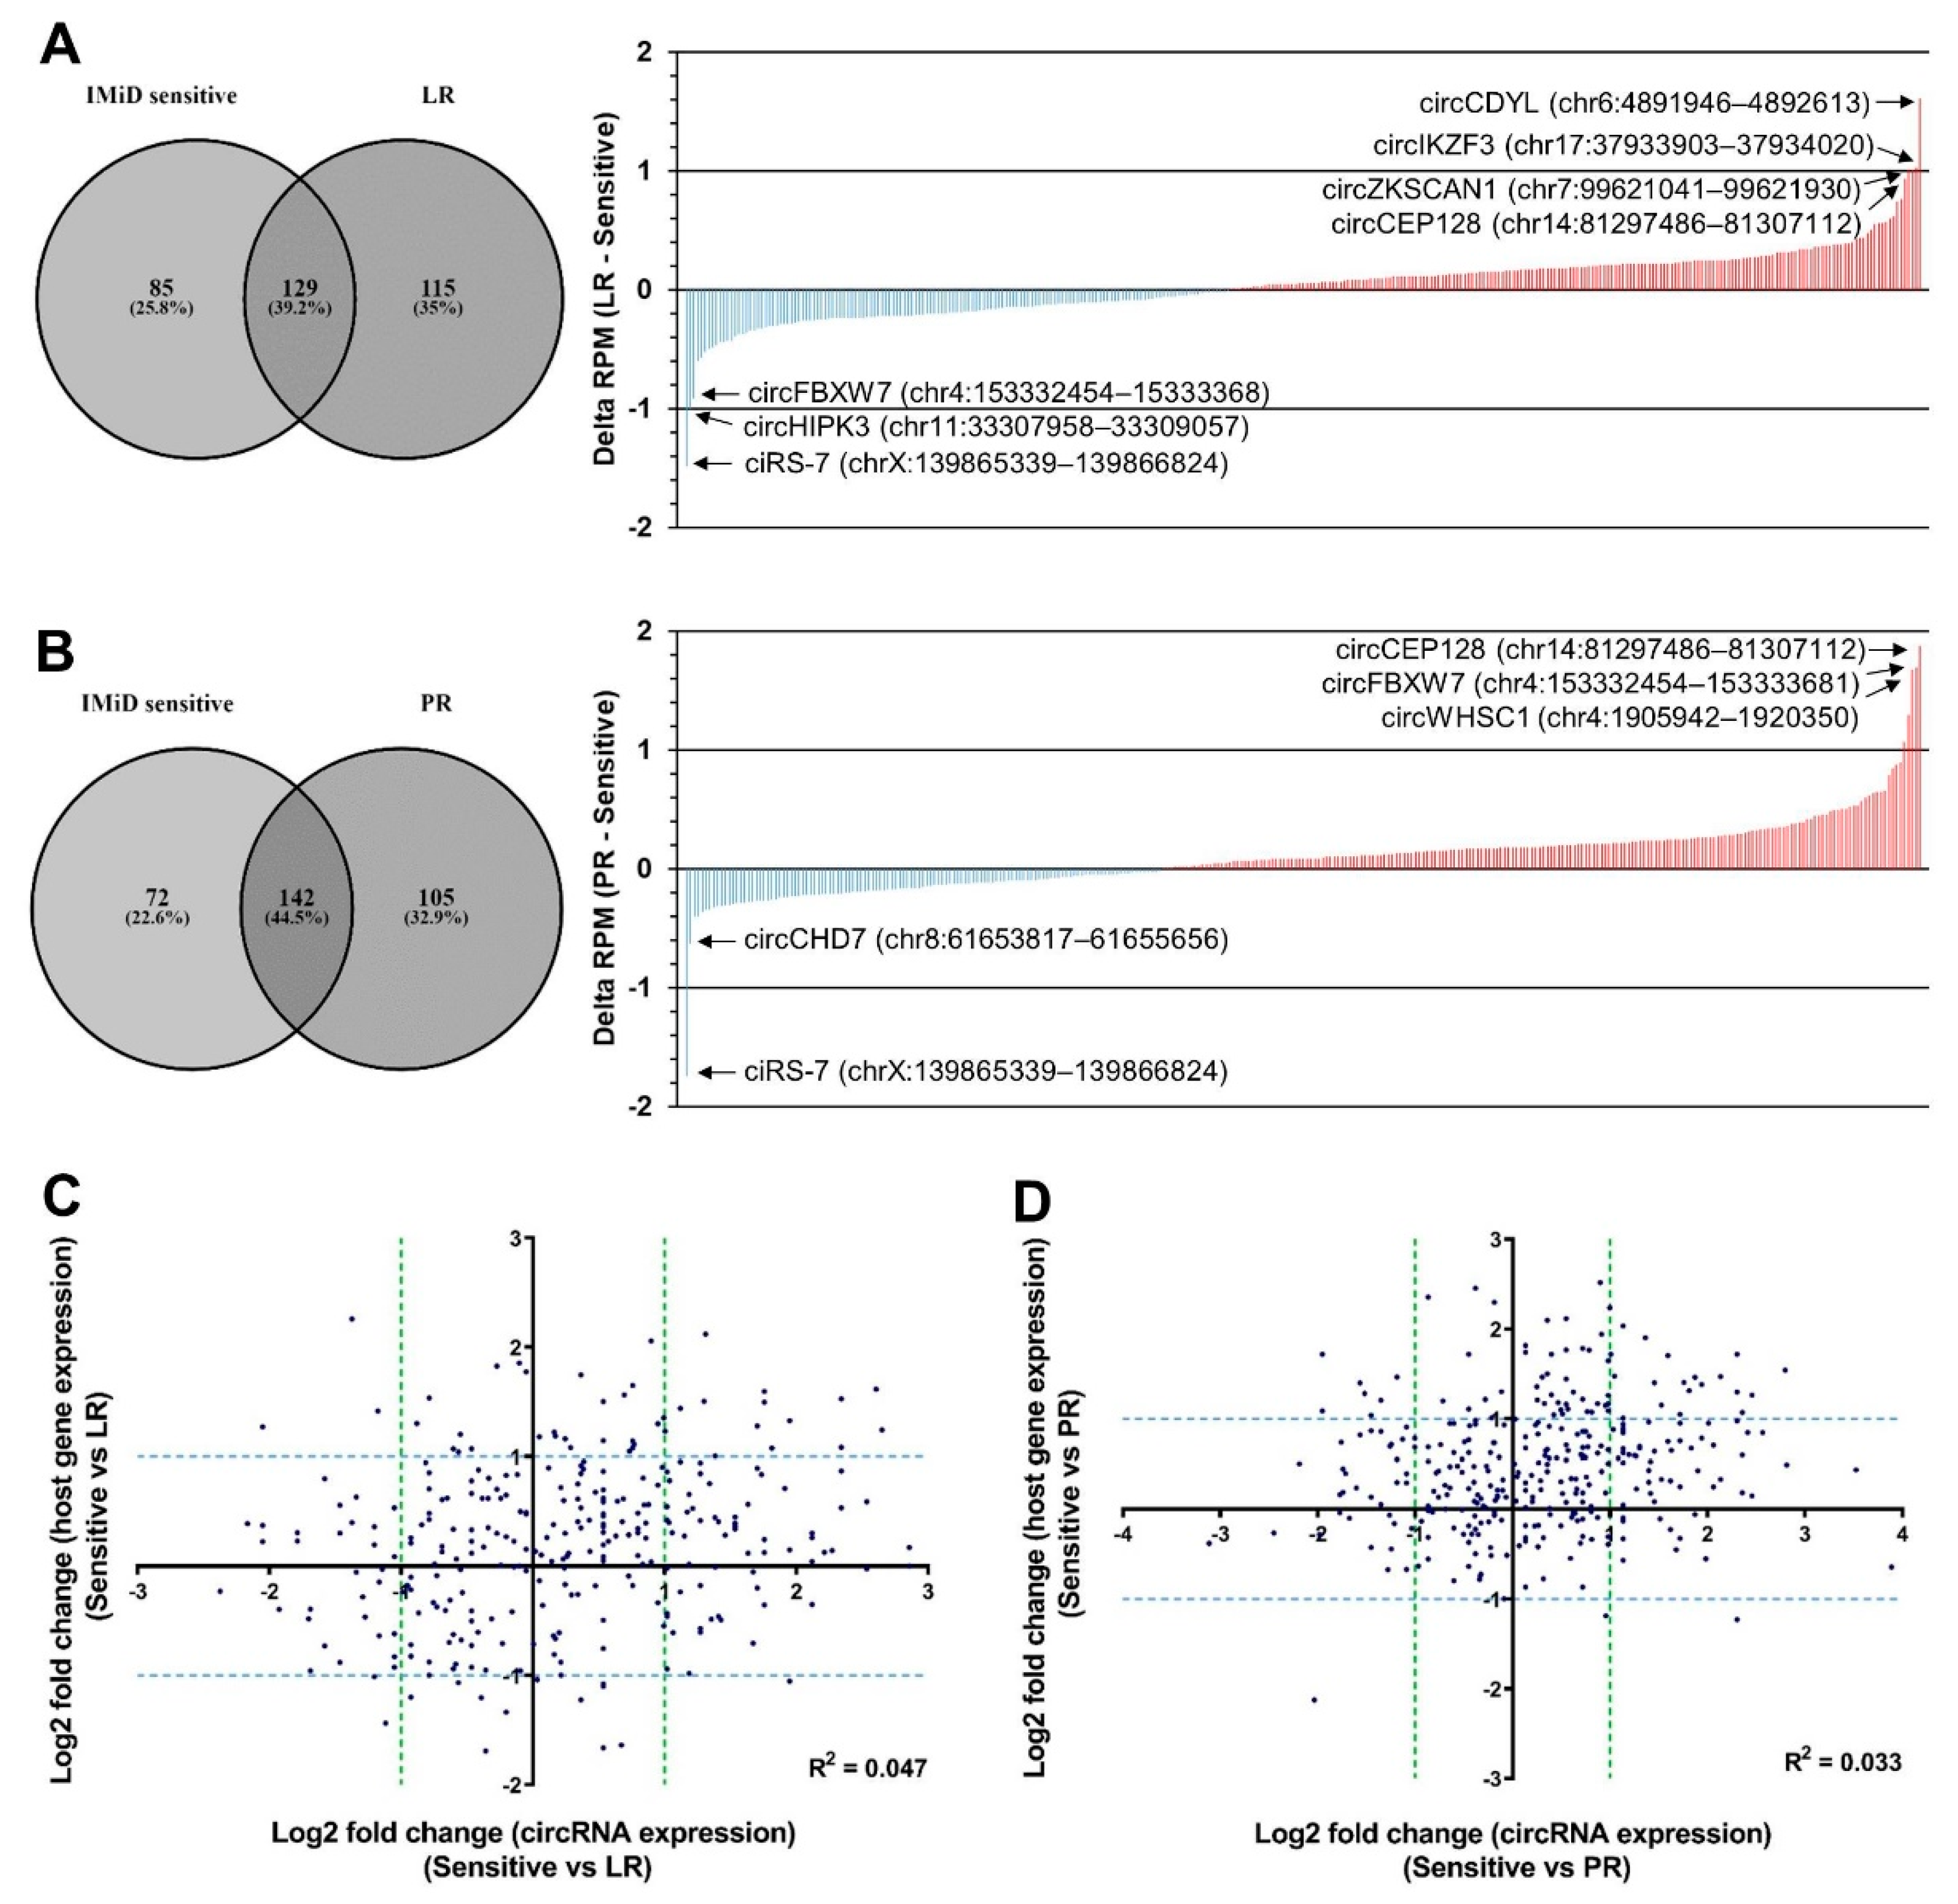
2.2. circRNA Expression Changes upon Acquired Resistance to IMiDs
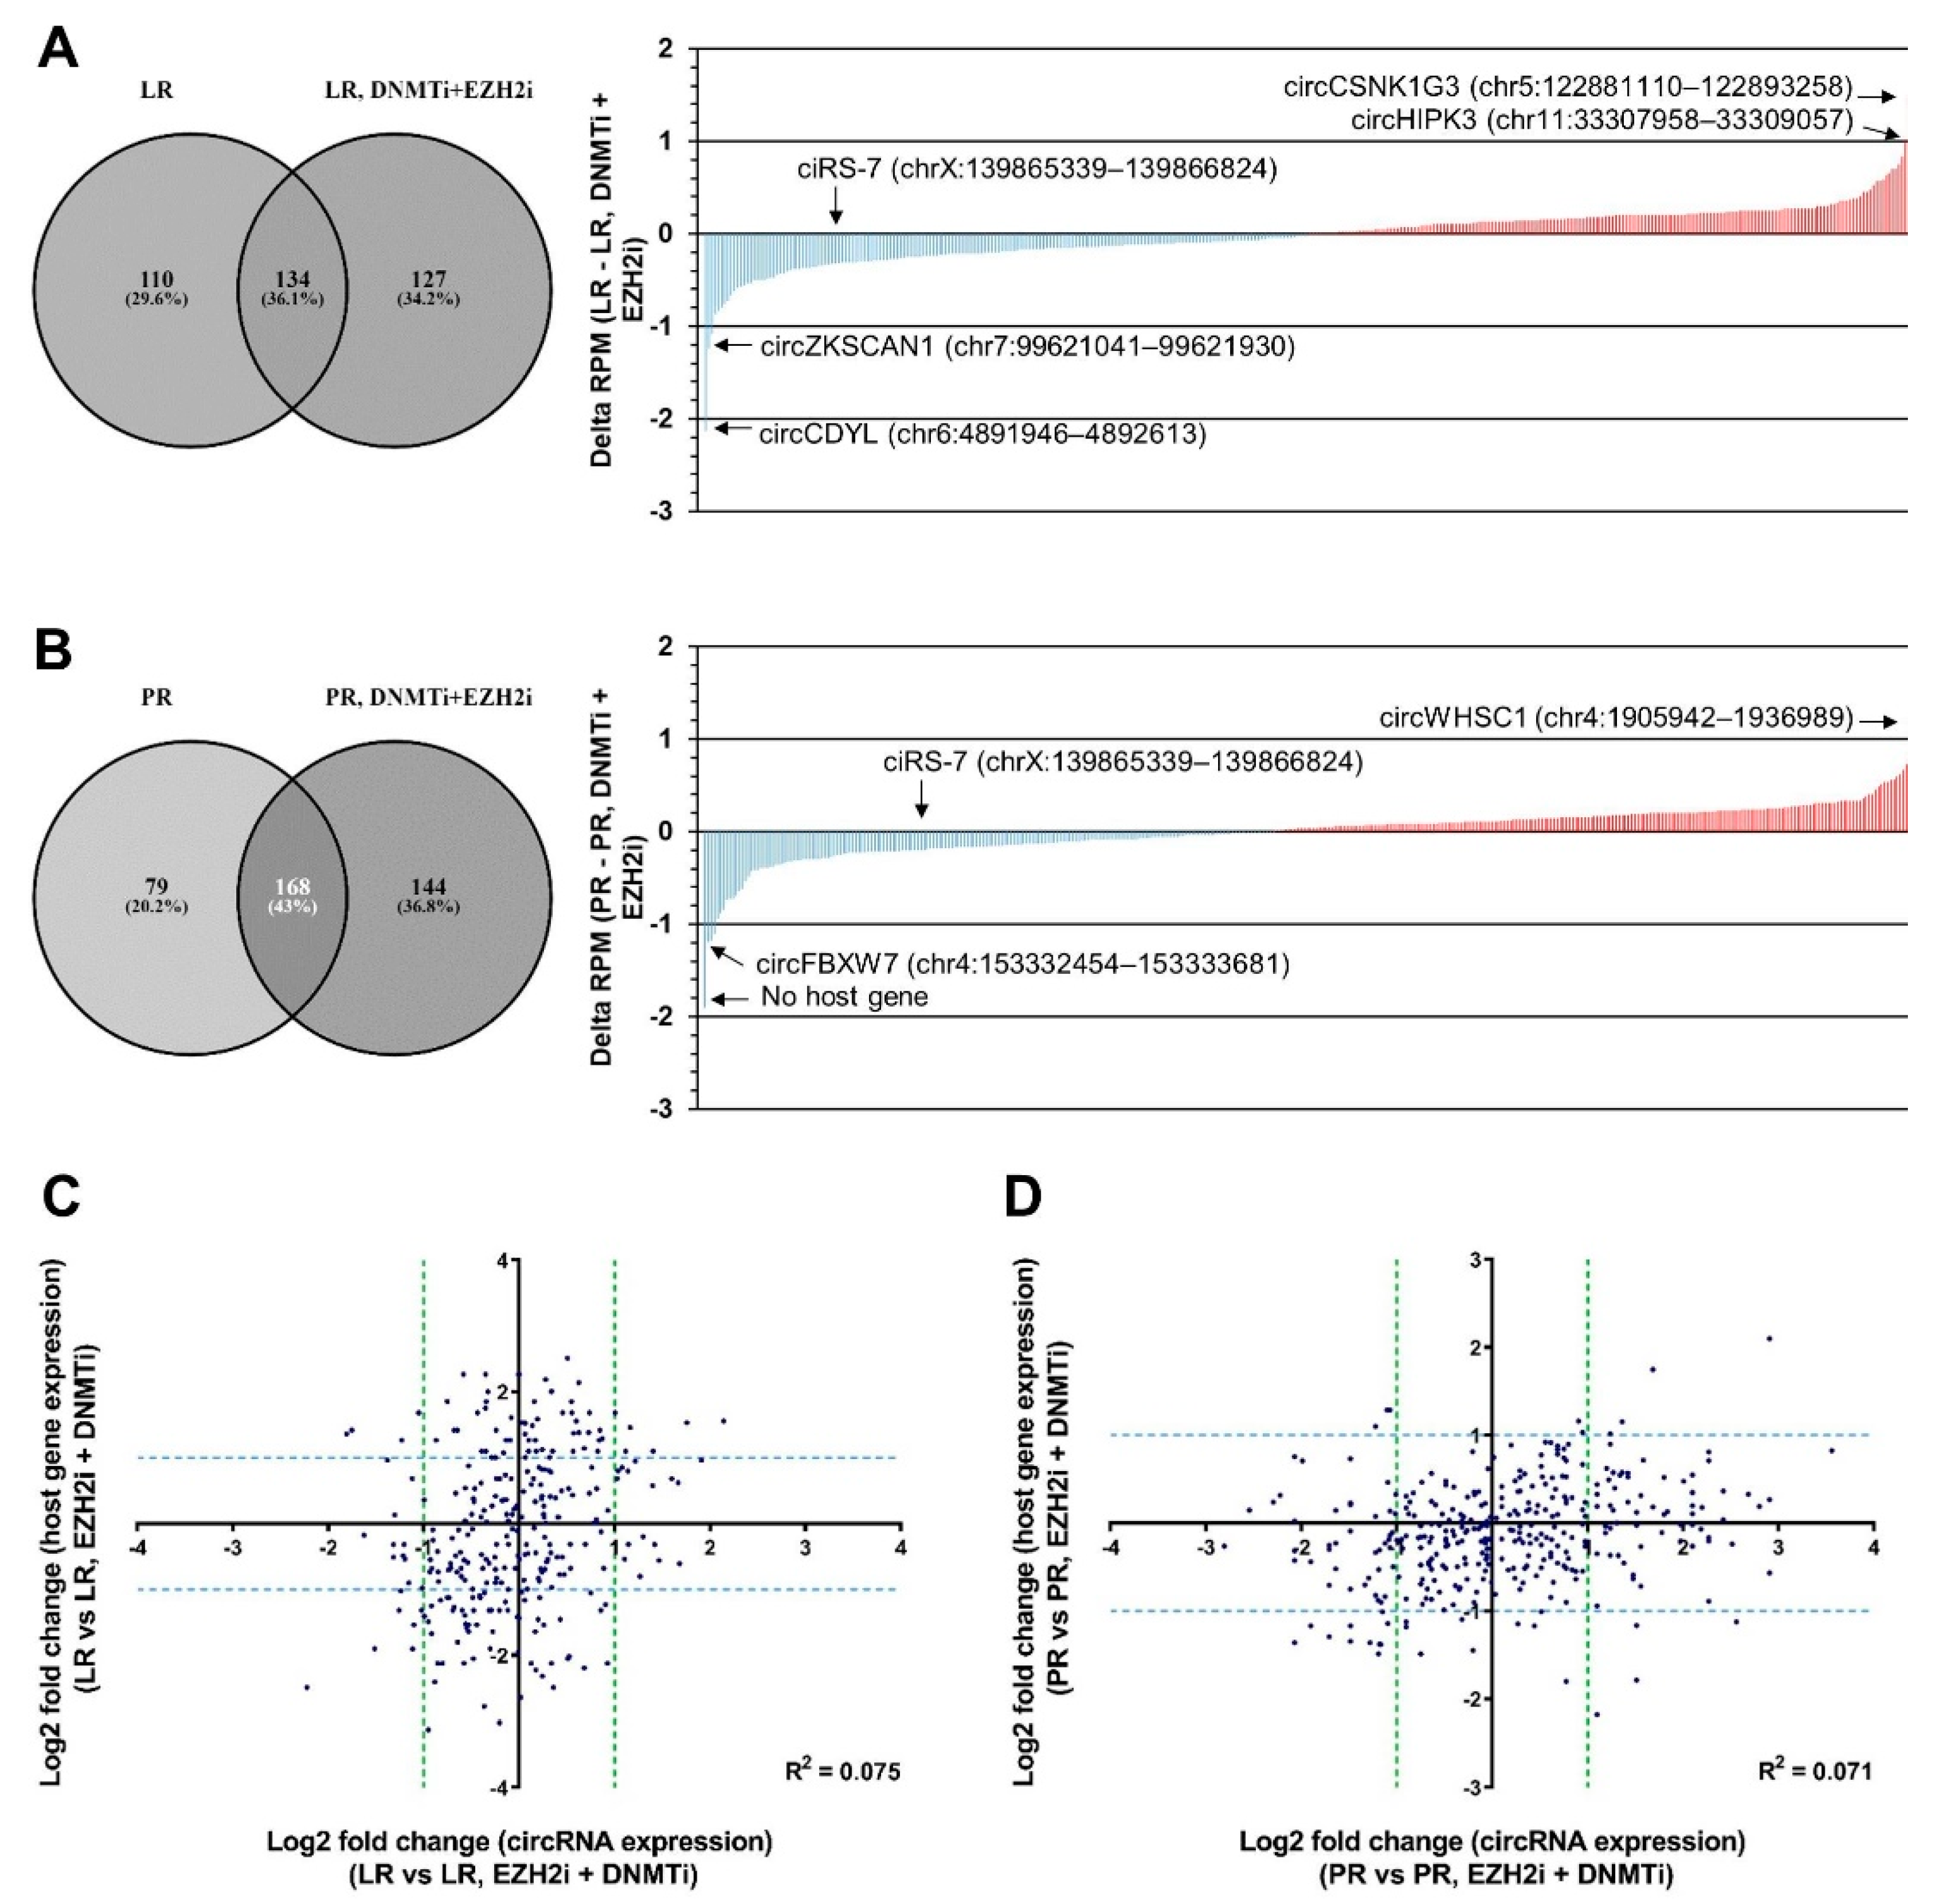
2.3. circRNA Expression Changes upon Combined DNMT and EZH2 Inhibition
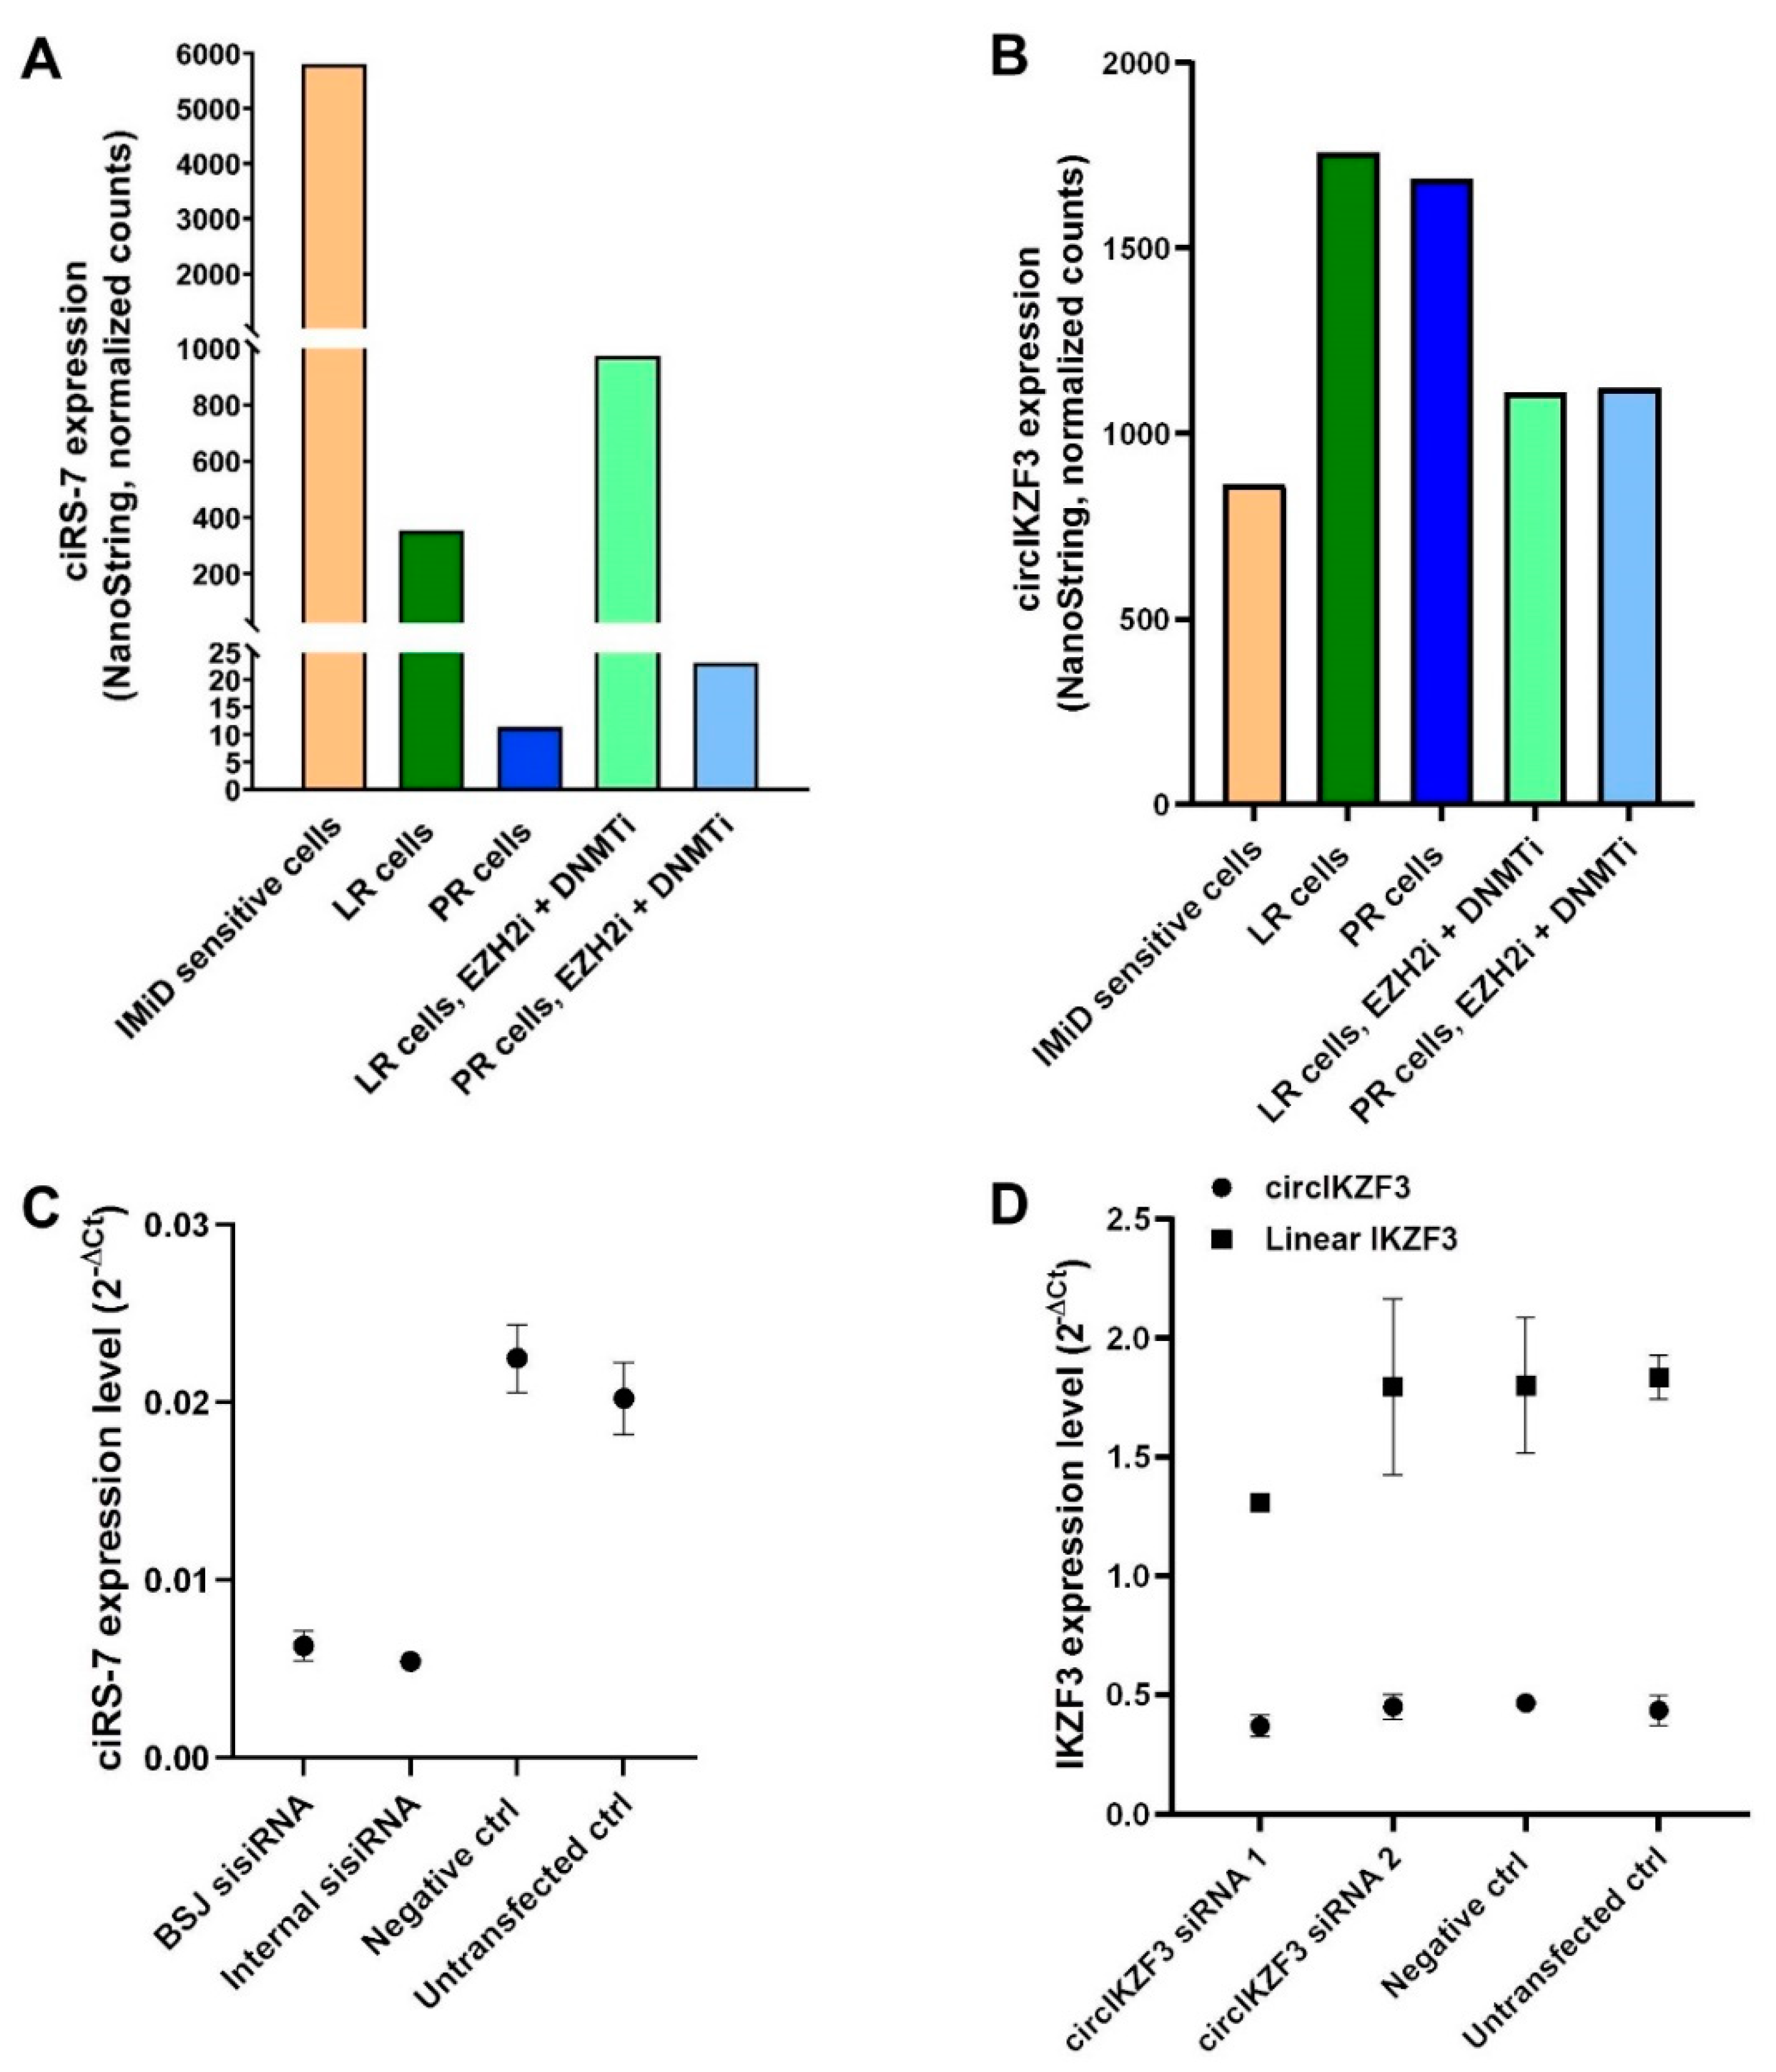
2.4. Validation of circRNA Candidates from the RNA-Seq Data by NanoString nCounter Technology
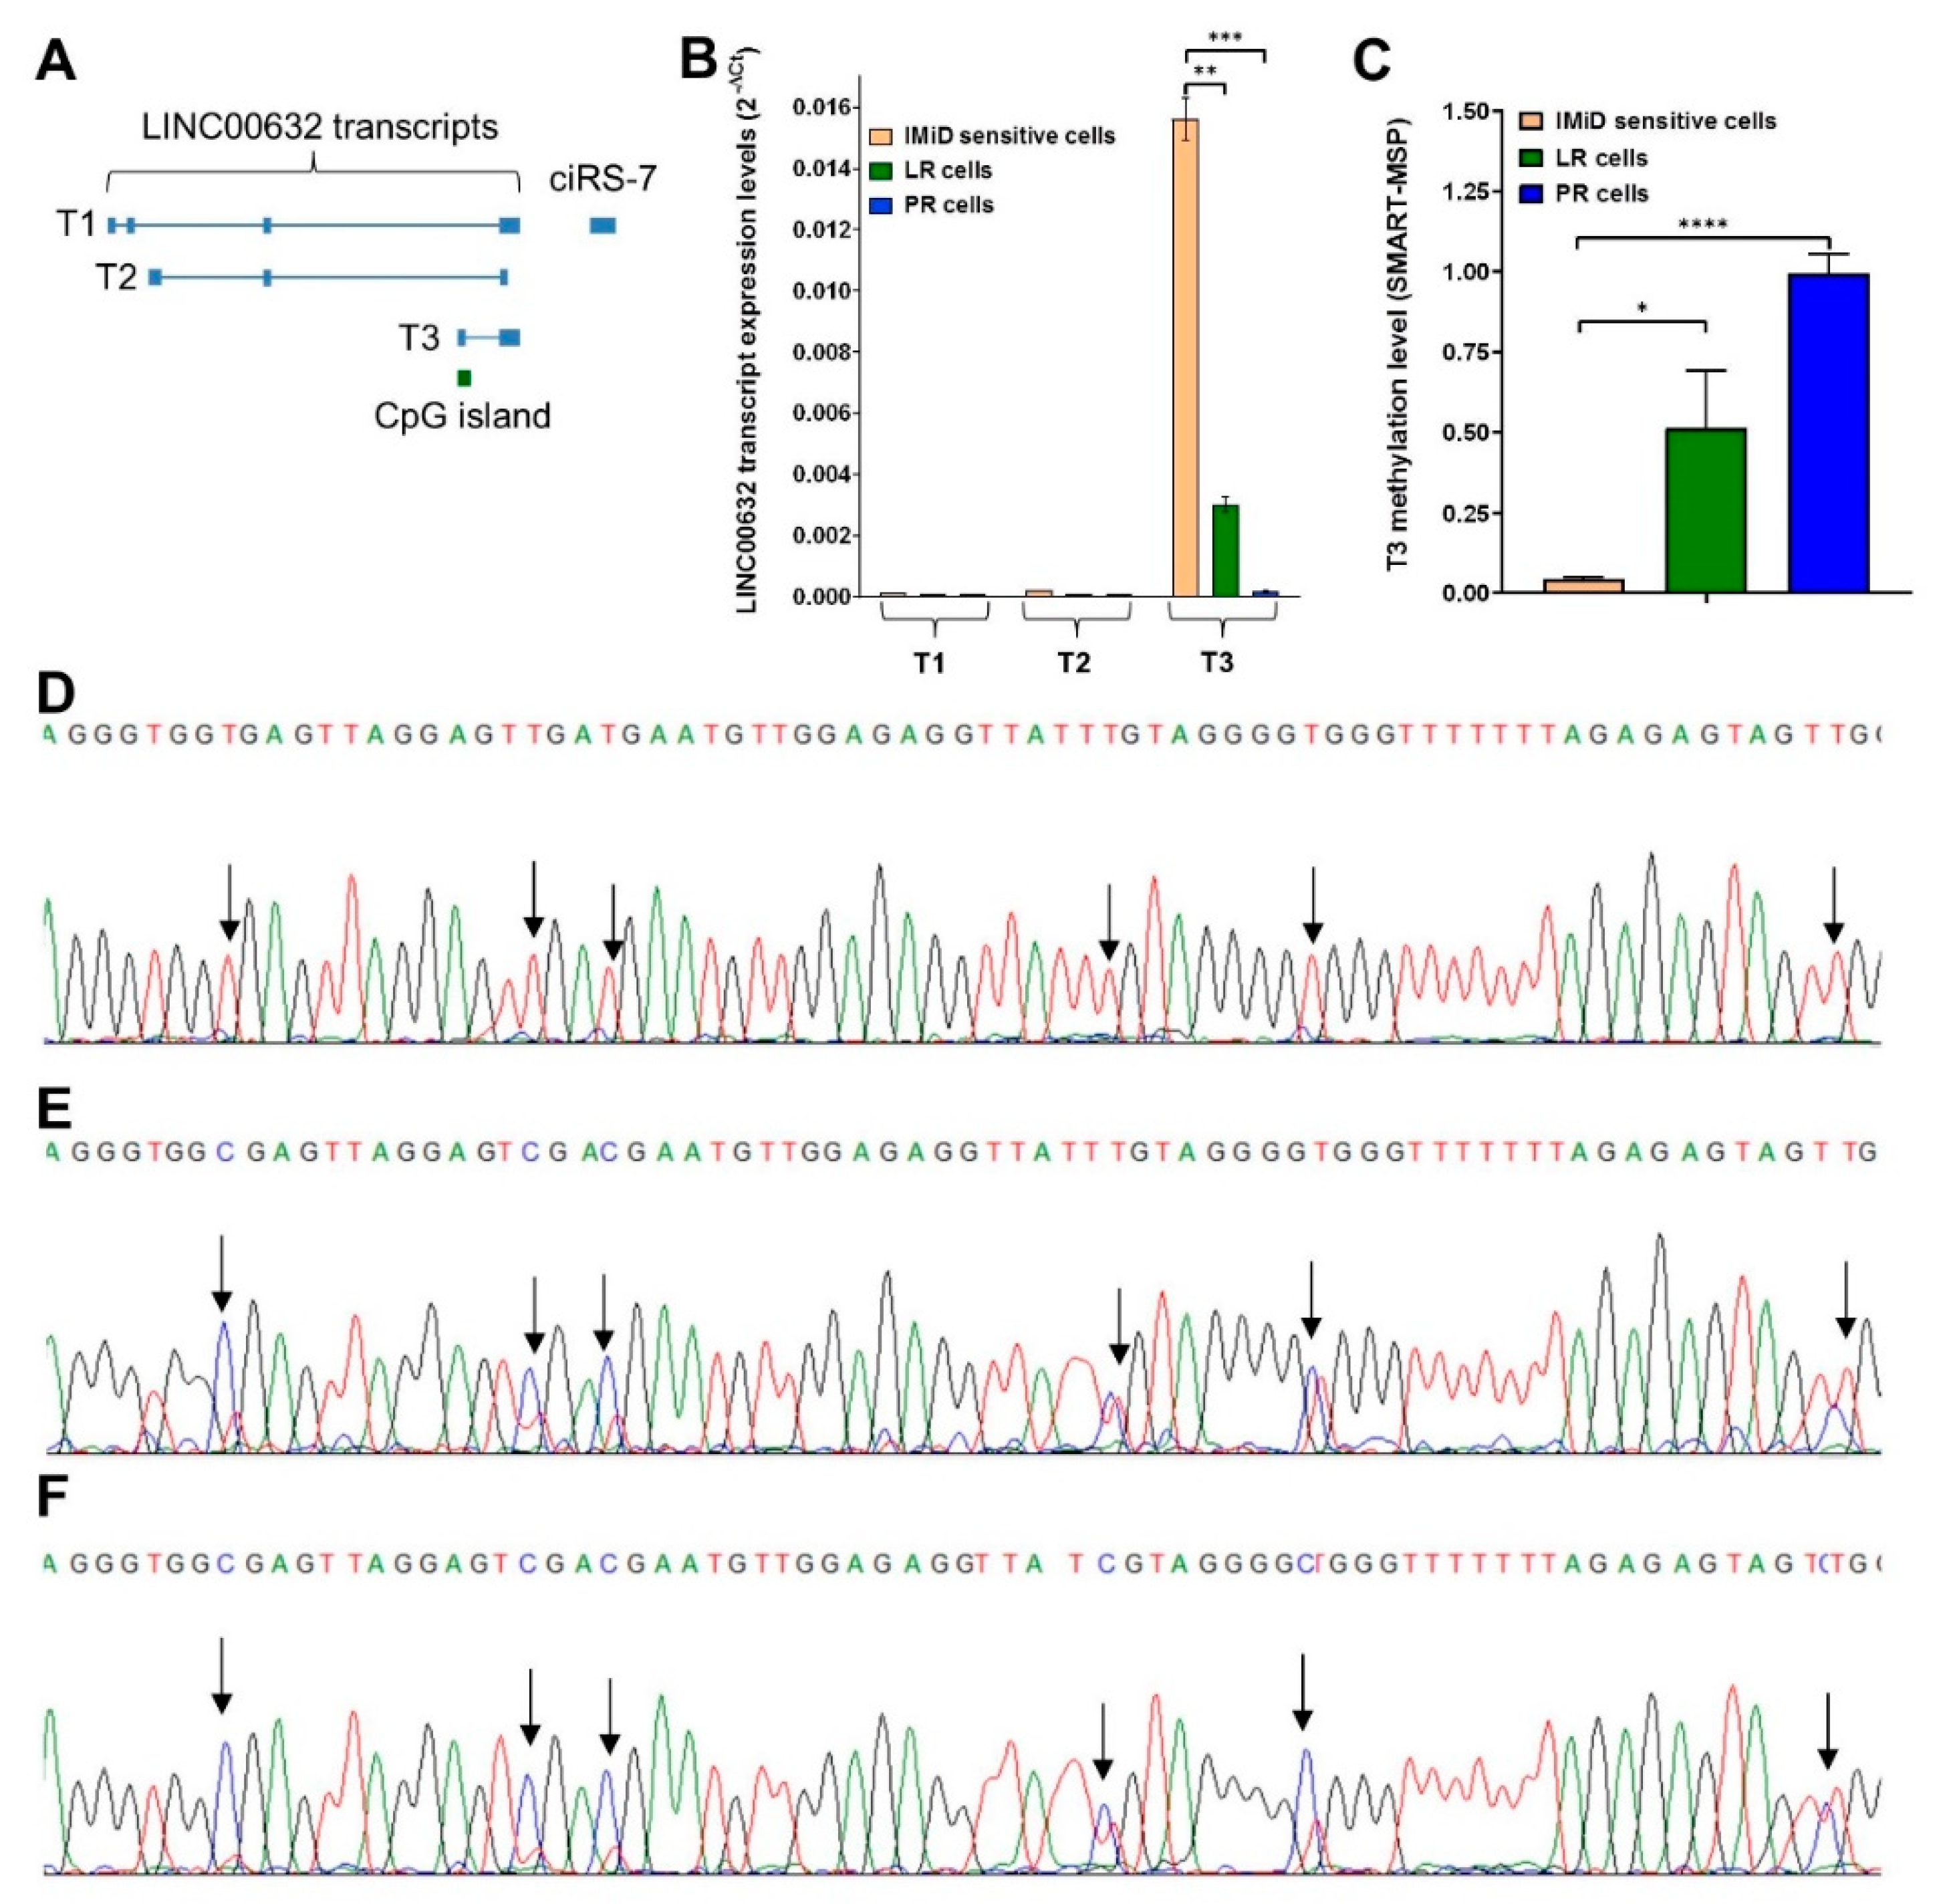
2.5. Downregulation of ciRS-7 Is Associated with Increased DNA Methylation Levels
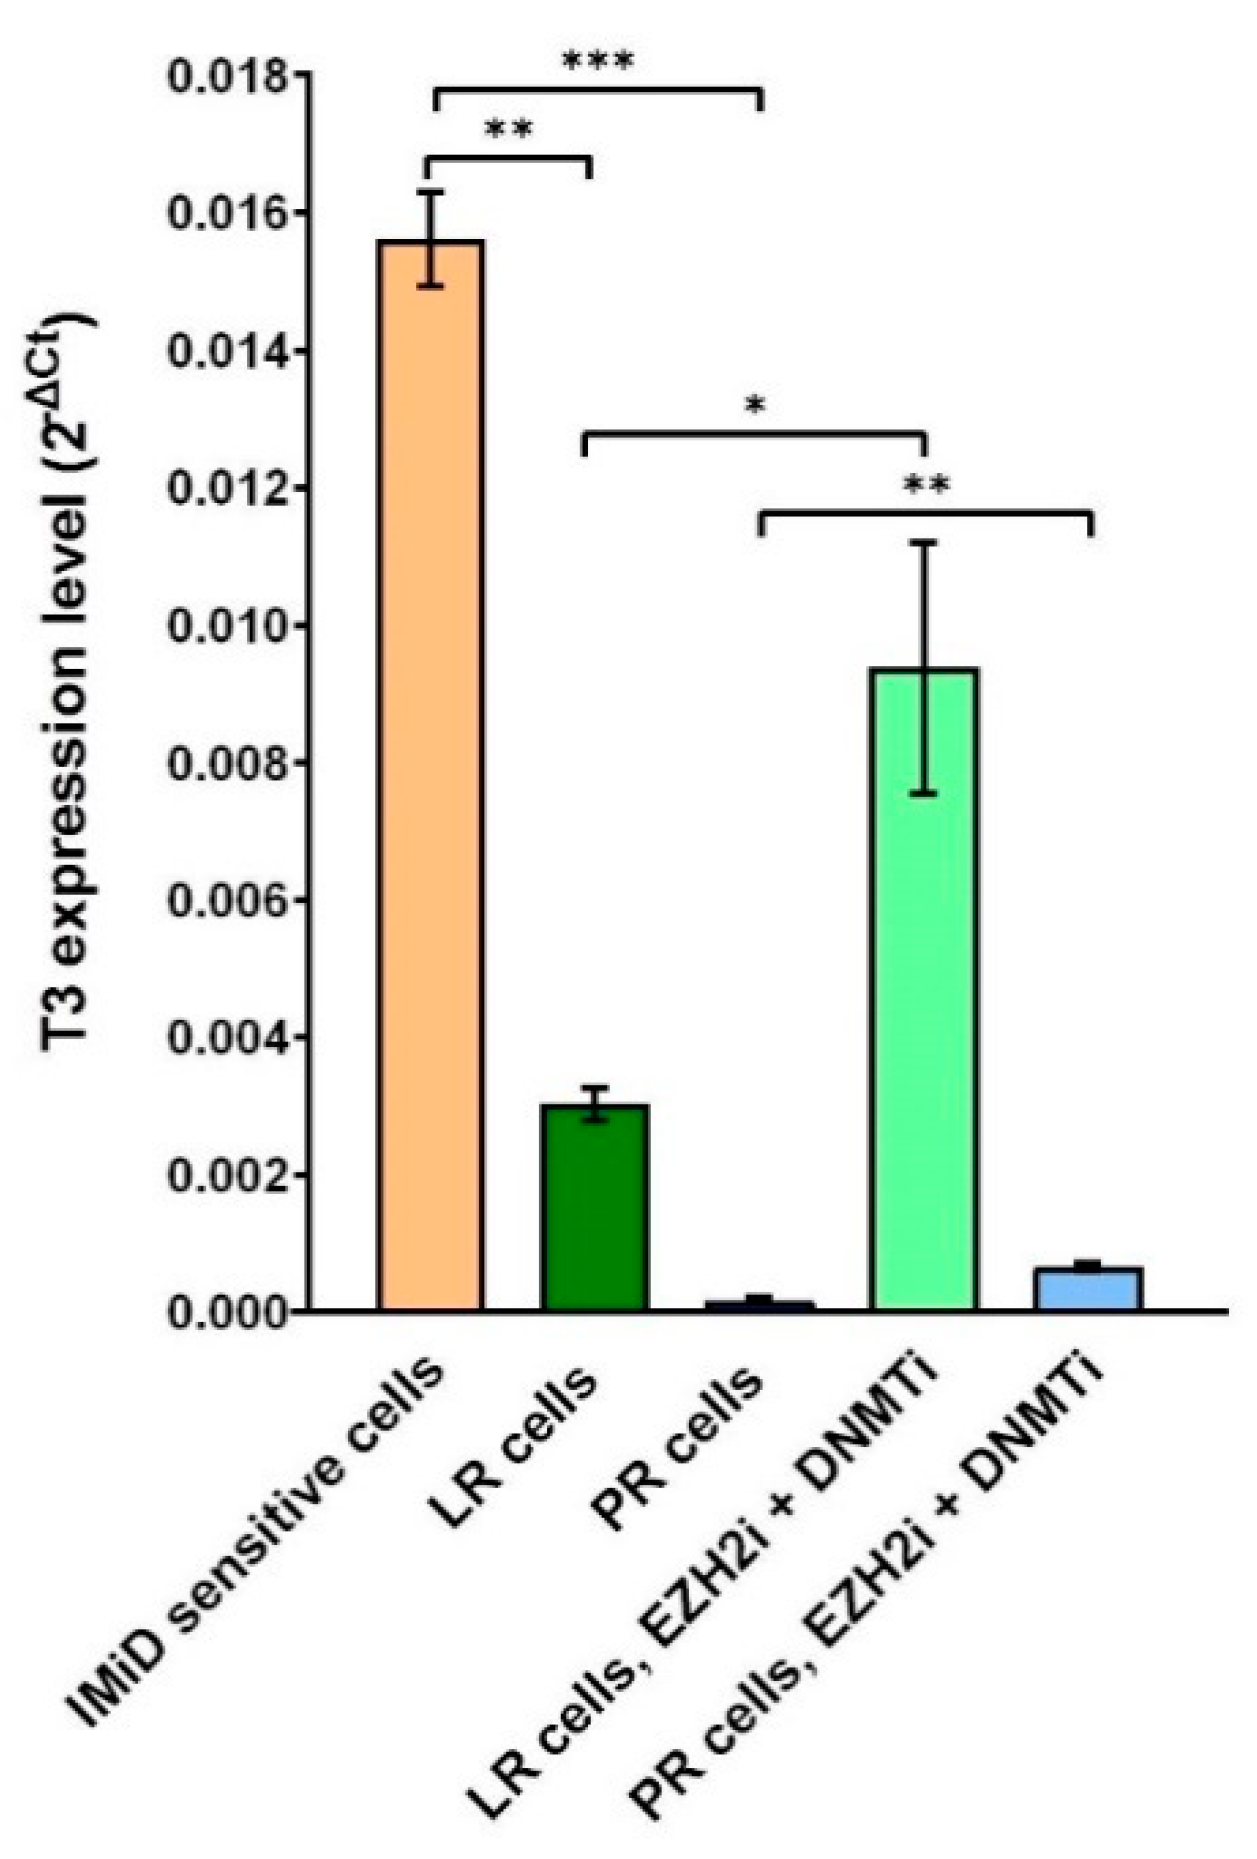
2.6. Combined DNMT and EZH2 Inhibition Reactivates ciRS-7 through T3
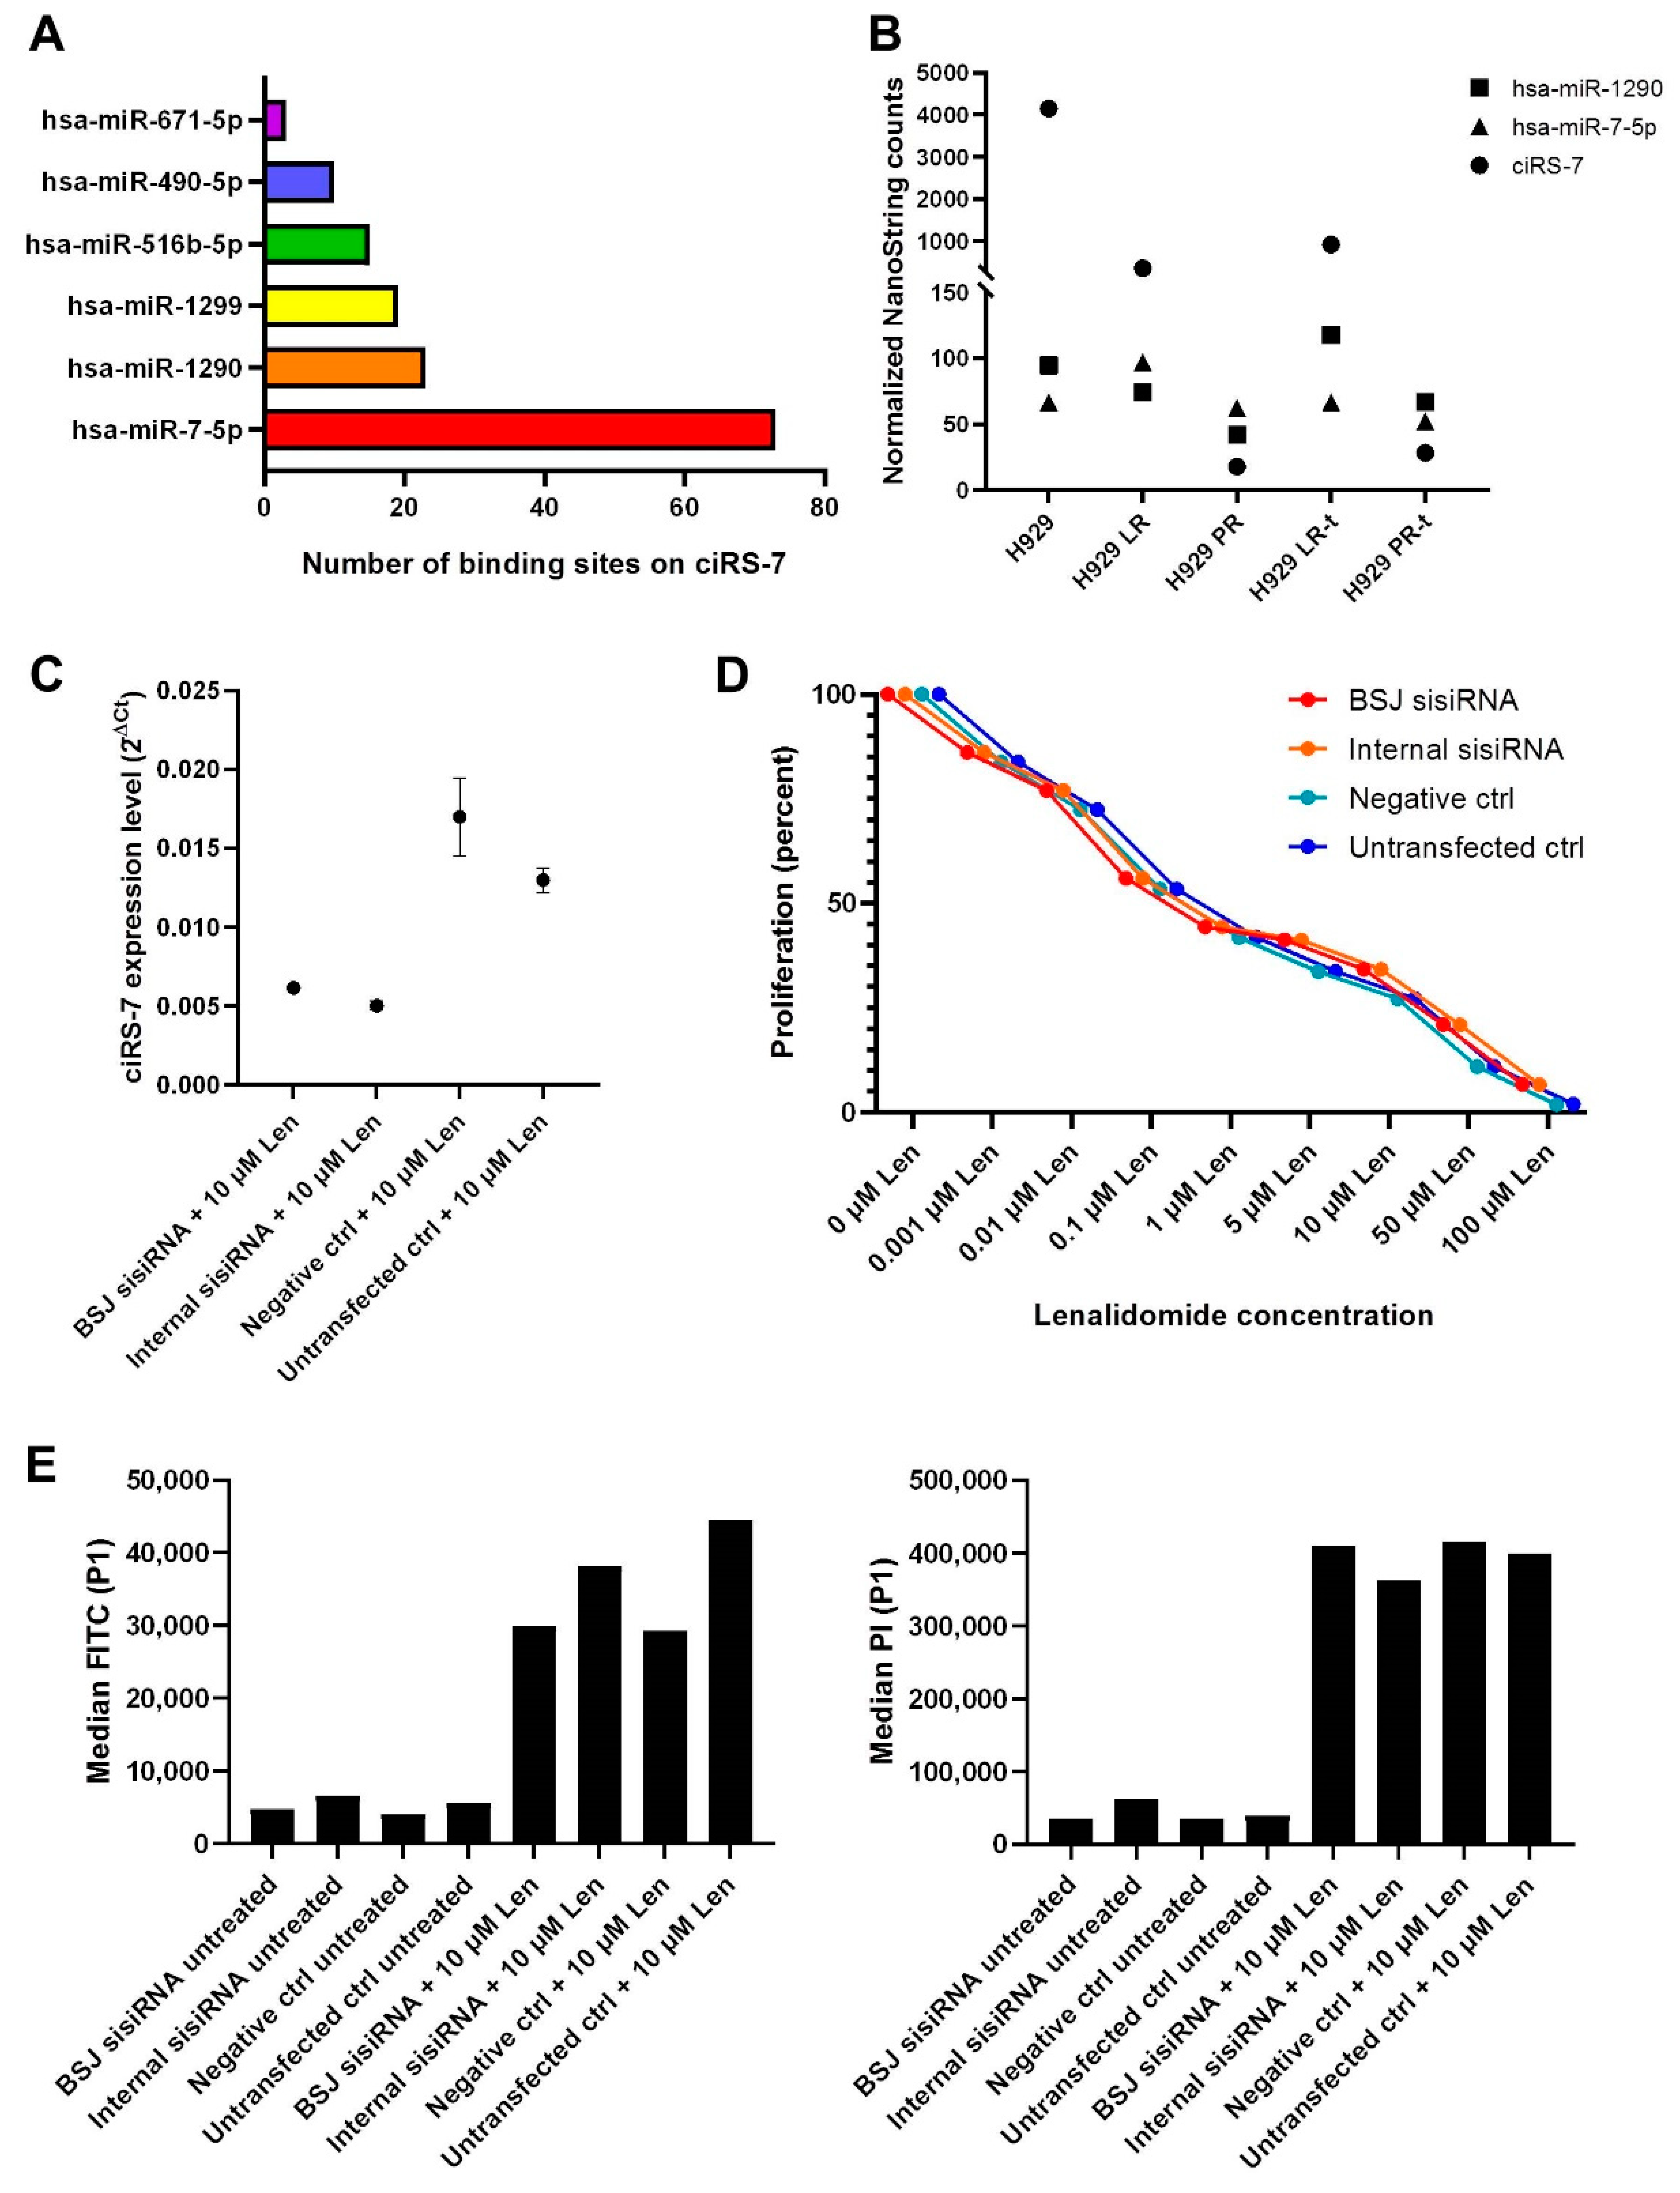
2.7. Knockdown of ciRS-7 Does Not Make the IMiD-Sensitive Cells Become More Resistant
2.8. ciRS-7 Expression in MM Cell Lines Does Not Reflect IMiD Sensitivity
2.9. ciRS-7 Becomes Epigenetically Silenced after Prolonged Cell Culture without Drug-Exposure
3. Discussion
4. Materials and Methods
4.1. Cell Cultures and Treatments
4.2. RNA and DNA Isolation
4.3. Library Preparation and High-Throughput RNA-seq
4.4. RNA-seq Data Analysis
4.5. RT-qPCR Analyses of the LINC00632 T1, T2 and T3 Transcripts
4.6. Sensitive Melting Analysis after Real-Time Methylation-Specific PCR (SMART-MSP)
4.7. Bisulfite Sequencing of the LINC00632 T3 Promoter CpG Island
4.8. NanoString nCounter Analysis of ciRS-7 and circIKZF3
4.9. NanoString nCounter Analysis of miRNAs
4.10. ciRS-7 and circIKZF3 Knockdown
4.11. Proliferation Assay
4.12. Apoptosis Assay
4.13. Statistical Analyses
5. Conclusions
Supplementary Materials
Author Contributions
Funding
Institutional Review Board Statement
Informed Consent Statement
Data Availability Statement
Acknowledgments
Conflicts of Interest
References
- Kumar, S.K.; Rajkumar, V.; Kyle, R.A.; van Duin, M.; Sonneveld, P.; Mateos, M.V.; Gay, F.; Anderson, K.C. Multiple myeloma. Nat. Rev. Dis. Primers 2017, 3, 17046. [Google Scholar] [CrossRef]
- Cowan, A.J.; Allen, C.; Barac, A.; Basaleem, H.; Bensenor, I.; Curado, M.P.; Foreman, K.; Gupta, R.; Harvey, J.; Hosgood, H.D.; et al. Global Burden of Multiple Myeloma: A Systematic Analysis for the Global Burden of Disease Study 2016. JAMA Oncol. 2018, 4, 1221–1227. [Google Scholar] [CrossRef] [Green Version]
- Pinto, V.; Bergantim, R.; Caires, H.R.; Seca, H.; Guimaraes, J.E.; Vasconcelos, M.H. Multiple Myeloma: Available Therapies and Causes of Drug Resistance. Cancers 2020, 12, 407. [Google Scholar] [CrossRef] [PubMed] [Green Version]
- Nass, J.; Efferth, T. Drug targets and resistance mechanisms in multiple myeloma. Cancer Drug Resist. 2018, 1, 87–117. [Google Scholar] [CrossRef] [Green Version]
- Dimopoulos, K.; Fibiger Munch-Petersen, H.; Winther Eskelund, C.; Dissing Sjö, L.; Ralfkiaer, E.; Gimsing, P.; Grønbaek, K. Expression of CRBN, IKZF1, and IKZF3 does not predict lenalidomide sensitivity and mutations in the cereblon pathway are infrequent in multiple myeloma. Leuk Lymphoma 2019, 60, 180–188. [Google Scholar] [CrossRef] [PubMed]
- Mogollón, P.; Díaz-Tejedor, A.; Algarín, E.M.; Paíno, T.; Garayoa, M.; Ocio, E.M. Biological Background of Resistance to Current Standards of Care in Multiple Myeloma. Cells 2019, 8, 1432. [Google Scholar] [CrossRef] [Green Version]
- Krönke, J.; Udeshi, N.D.; Narla, A.; Grauman, P.; Hurst, S.N.; McConkey, M.; Svinkina, T.; Heckl, D.; Comer, E.; Li, X.; et al. Lenalidomide causes selective degradation of IKZF1 and IKZF3 in multiple myeloma cells. Science 2014, 343, 301–305. [Google Scholar] [CrossRef] [Green Version]
- Lopez-Girona, A.; Mendy, D.; Ito, T.A.; Miller, K.H.; Gandhi, A.K.; Kang, J.; Karasawa, S.; Carmel, G.; E Jackson, P.; Abbasian, M.; et al. Cereblon is a direct protein target for immunomodulatory and antiproliferative activities of lenalidomide and pomalidomide. Leukemia 2012, 26, 2326–2335. [Google Scholar] [CrossRef]
- Lu, G.; Middleton, R.E.; Sun, H.; Naniong, M.; Ott, C.J.; Mitsiades, C.S.; Wong, K.K.; Bradner, J.E.; Kaelin, W.G., Jr. The myeloma drug lenalidomide promotes the cereblon-dependent destruction of Ikaros proteins. Science 2014, 343, 305–309. [Google Scholar] [CrossRef] [Green Version]
- Bjorklund, C.C.; Lu, L.; Kang, J.; Hagner, P.; Havens, C.G.; Amatangelo, M.; Wang, M.; Ren, Y.; Couto, S.S.; Breider, M.; et al. Rate of CRL4(CRBN) substrate Ikaros and Aiolos degradation underlies differential activity of lenalidomide and pomalidomide in multiple myeloma cells by regulation of c-Myc and IRF4. Blood Cancer J. 2015, 5, e354. [Google Scholar] [CrossRef]
- Xu, Q.; Hou, Y.-X.; Langlais, P.; Erickson, P.; Zhu, J.; Shi, C.-X.; Luo, M.; Zhu, Y.; Xu, Y.; Mandarino, L.J.; et al. Expression of the cereblon binding protein argonaute 2 plays an important role for multiple myeloma cell growth and survival. BMC Cancer 2016, 16, 297. [Google Scholar] [CrossRef] [PubMed] [Green Version]
- Diederichs, S.; Haber, D.A. Dual role for argonautes in microRNA processing and posttranscriptional regulation of microRNA expression. Cell 2007, 131, 1097–1108. [Google Scholar] [CrossRef] [PubMed] [Green Version]
- Dahl, M.; Kristensen, L.S.; Gronbaek, K. Long Non-Coding RNAs Guide the Fine-Tuning of Gene Regulation in B-Cell Development and Malignancy. Int. J. Mol. Sci. 2018, 19, 2475. [Google Scholar] [CrossRef] [PubMed] [Green Version]
- Zhou, F.; Wang, D.; Wei, W.; Chen, H.; Shi, H.; Zhou, N.; Wu, L.; Peng, R. Comprehensive profiling of circular RNA expressions reveals potential diagnostic and prognostic biomarkers in multiple myeloma. BMC Cancer 2020, 20, 40. [Google Scholar] [CrossRef] [PubMed] [Green Version]
- Wang, Y.; Lin, Q.; Song, C.; Ma, R.; Li, X. Circ_0007841 promotes the progression of multiple myeloma through targeting miR-338-3p/BRD4 signaling cascade. Cancer Cell Int. 2020, 20, 383. [Google Scholar] [CrossRef]
- Memczak, S.; Jens, M.; Elefsinioti, A.; Torti, F.; Krueger, J.; Rybak, A.; Maier, L.; Mackowiak, S.D.; Gregersen, L.H.; Munschauer, M.; et al. Circular RNAs are a large class of animal RNAs with regulatory potency. Nature 2013, 495, 333–338. [Google Scholar] [CrossRef]
- Jeck, W.R.; Sorrentino, J.A.; Wang, K.; Slevin, M.K.; Burd, C.E.; Liu, J.; Marzluff, W.F.; Sharpless, N.E. Circular RNAs are abundant, conserved, and associated with ALU repeats. RNA 2013, 19, 141–157. [Google Scholar] [CrossRef] [Green Version]
- Dong, R.; Ma, X.K.; Li, G.W.; Yang, L. CIRCpedia v2: An Updated Database for Comprehensive Circular RNA Annotation and Expression Comparison. Genom. Proteom. Bioinform. 2018, 16, 226–233. [Google Scholar] [CrossRef]
- Glazar, P.; Papavasileiou, P.; Rajewsky, N. circBase: A database for circular RNAs. RNA 2014, 20, 1666–1670. [Google Scholar] [CrossRef] [Green Version]
- Szabo, L.; Morey, R.; Palpant, N.J.; Wang, P.L.; Afari, N.; Jiang, C.; Parast, M.M.; Murry, C.E.; Laurent, L.C.; Salzman, J. Statistically based splicing detection reveals neural enrichment and tissue-specific induction of circular RNA during human fetal development. Genome Biol. 2015, 16, 126. [Google Scholar] [CrossRef] [Green Version]
- Maass, P.G.; Glazar, P.; Memczak, S.; Dittmar, G.; Hollfinger, I.; Schreyer, L.; Sauer, A.V.; Toka, O.; Aiuti, A.; Luft, F.C.; et al. A map of human circular RNAs in clinically relevant tissues. J. Mol. Med. 2017, 95, 1179–1189. [Google Scholar] [CrossRef] [PubMed]
- Zhang, P.; Zhang, X.-O.; Jiang, T.; Cai, L.; Huang, X.; Liu, Q.; Li, D.; Lu, A.; Liu, Y.; Xue, W.; et al. Comprehensive identification of alternative back-splicing in human tissue transcriptomes. Nucleic Acids Res. 2020, 48, 1779–1789. [Google Scholar] [CrossRef] [PubMed]
- Hansen, T.B.; Jensen, T.I.; Clausen, B.H.; Bramsen, J.B.; Finsen, B.; Damgaard, C.K.; Kjems, J. Natural RNA circles function as efficient microRNA sponges. Nature 2013, 495, 384–388. [Google Scholar] [CrossRef] [PubMed]
- Holdt, L.; Stahringer, A.; Sass, K.; Pichler, G.; Kulak, N.A.; Wilfert, W.; Kohlmaier, A.; Herbst, A.; Northoff, B.H.; Nicolaou, A.; et al. Circular non-coding RNA ANRIL modulates ribosomal RNA maturation and atherosclerosis in humans. Nat. Commun. 2016, 7, 12429. [Google Scholar] [CrossRef] [PubMed] [Green Version]
- Abdelmohsen, K.; Panda, A.C.; Munk, R.; Grammatikakis, I.; Dudekula, D.B.; De, S.; Kim, J.; Noh, J.H.; Kim, K.M.; Martindale, J.L.; et al. Identification of HuR target circular RNAs uncovers suppression of PABPN1 translation by CircPABPN1. RNA Biol. 2017, 14, 361–369. [Google Scholar] [CrossRef] [Green Version]
- Kleaveland, B.; Shi, C.Y.; Stefano, J.; Bartel, D.P. A Network of Noncoding Regulatory RNAs Acts in the Mammalian Brain. Cell 2018, 174, 350–362.e317. [Google Scholar] [CrossRef] [Green Version]
- Piwecka, M.; Glazar, P.; Hernandez-Miranda, L.R.; Memczak, S.; Wolf, S.A.; Rybak-Wolf, A.; Filipchyk, A.; Klironomos, F.; Cerda Jara, C.A.; Fenske, P.; et al. Loss of a mammalian circular RNA locus causes miRNA deregulation and affects brain function. Science 2017, 357. [Google Scholar] [CrossRef] [Green Version]
- Yu, C.Y.; Li, T.C.; Wu, Y.Y.; Yeh, C.H.; Chiang, W.; Chuang, C.Y.; Kuo, H.C. The circular RNA circBIRC6 participates in the molecular circuitry controlling human pluripotency. Nat. Commun. 2017, 8, 1149. [Google Scholar] [CrossRef]
- Kristensen, L.S.; Okholm, T.L.H.; Veno, M.T.; Kjems, J. Circular RNAs are abundantly expressed and upregulated during human epidermal stem cell differentiation. RNA Biol. 2018, 15, 280–291. [Google Scholar] [CrossRef]
- Kristensen, L.S.; Andersen, M.S.; Stagsted, L.V.W.; Ebbesen, K.K.; Hansen, T.B.; Kjems, J. The biogenesis, biology and characterization of circular RNAs. Nat. Rev. Genet. 2019, 20, 675–691. [Google Scholar] [CrossRef]
- Kristensen, L.S.; Hansen, T.B.; Veno, M.T.; Kjems, J. Circular RNAs in cancer: Opportunities and challenges in the field. Oncogene 2018, 37, 555–565. [Google Scholar] [CrossRef] [PubMed] [Green Version]
- Dimopoulos, K.; Helbo, A.S.; Munch-Petersen, H.F.; Sjö, L.; Christensen, J.; Kristensen, L.S.; Asmar, F.; Hermansen, N.E.U.; O’Connel, C.; Gimsing, P.; et al. Dual inhibition of DNMTs and EZH2 can overcome both intrinsic and acquired resistance of myeloma cells to IMiDs in a Cereblon-independent manner. Mol. Oncol. 2017. [Google Scholar] [CrossRef] [PubMed]
- Zhu, Y.-J.; Zheng, B.; Luo, G.-J.; Ma, X.-K.; Lu, X.-Y.; Lin, X.-M.; Yang, S.; Zhao, Q.; Wu, T.; Li, Z.-X.; et al. Circular RNAs negatively regulate cancer stem cells by physically binding FMRP against CCAR1 complex in hepatocellular carcinoma. Theranostics 2019, 9, 3526–3540. [Google Scholar] [CrossRef] [PubMed]
- Yao, Z.; Luo, J.; Hu, K.; Lin, J.; Huang, H.; Wang, Q.; Zhang, P.; Xiong, Z.; He, C.; Huang, Z.; et al. ZKSCAN1 gene and its related circular RNA (circZKSCAN1) both inhibit hepatocellular carcinoma cell growth, migration, and invasion but through different signaling pathways. Mol. Oncol. 2017, 11, 422–437. [Google Scholar] [CrossRef] [Green Version]
- Okholm, T.L.H.; Nielsen, M.M.; Hamilton, M.P.; Christensen, L.-L.; Vang, S.; Hedegaard, J.; Hansen, T.B.; Kjems, J.; Dyrskjøt, L.; Pedersen, J.S. Circular RNA expression is abundant and correlated to aggressiveness in early-stage bladder cancer. NPJ Genom. Med. 2017, 2, 36. [Google Scholar] [CrossRef]
- Chesi, M.; Nardini, E.; Lim, R.S.; Smith, K.D.; Kuehl, W.M.; Bergsagel, P.L. The t(4;14) translocation in myeloma dysregulates both FGFR3 and a novel gene, MMSET, resulting in IgH/MMSET hybrid transcripts. Blood 1998, 92, 3025–3034. [Google Scholar] [CrossRef]
- Li, R.C.; Ke, S.; Meng, F.K.; Lu, J.; Zou, X.J.; He, Z.G.; Wang, W.F.; Fang, M.H. CiRS-7 promotes growth and metastasis of esophageal squamous cell carcinoma via regulation of miR-7/HOXB13. Cell Death Dis. 2018, 9, 838. [Google Scholar] [CrossRef] [Green Version]
- Hanniford, D.; Ulloa-Morales, A.; Karz, A.; Berzoti-Coelho, M.G.; Moubarak, R.S.; Sánchez-Sendra, B.; Kloetgen, A.; Davalos, V.; Imig, J.; Wu, P.; et al. Epigenetic Silencing of CDR1as Drives IGF2BP3-Mediated Melanoma Invasion and Metastasis. Cancer Cell 2020, 37, 55–70.e15. [Google Scholar] [CrossRef]
- Dahl, M.; Daugaard, I.; Andersen, M.S.; Hansen, T.B.; Gronbaek, K.; Kjems, J.; Kristensen, L.S. Enzyme-free digital counting of endogenous circular RNA molecules in B-cell malignancies. Lab. Investig. 2018, 98, 1657–1669. [Google Scholar] [CrossRef] [Green Version]
- Geiss, G.K.; E Bumgarner, R.; Birditt, B.; Dahl, T.; Dowidar, N.; Dunaway, D.L.; Fell, H.P.; Ferree, S.; George, R.D.; Grogan, T.; et al. Direct multiplexed measurement of gene expression with color-coded probe pairs. Nat. Biotechnol. 2008, 26, 317–325. [Google Scholar] [CrossRef]
- Zhang, Y.; Xue, W.; Li, X.; Zhang, J.; Chen, S.; Zhang, J.L.; Yang, L.; Chen, L.L. The Biogenesis of Nascent Circular RNAs. Cell Rep. 2016, 15, 611–624. [Google Scholar] [CrossRef] [Green Version]
- Bachmayr-Heyda, A.; Reiner, A.T.; Auer, K.; Sukhbaatar, N.; Aust, S.; Bachleitner-Hofmann, T.; Mesteri, I.; Grunt, T.W.; Zeillinger, R.; Pils, D. Correlation of circular RNA abundance with proliferation--exemplified with colorectal and ovarian cancer, idiopathic lung fibrosis, and normal human tissues. Sci. Rep. 2015, 5, 8057. [Google Scholar] [CrossRef] [PubMed]
- Bramsen, J.B.; Laursen, M.B.; Damgaard, C.K.; Lena, S.W.; Babu, B.R.; Wengel, J.; Kjems, J. Improved silencing properties using small internally segmented interfering RNAs. Nucleic Acids Res. 2007, 35, 5886–5897. [Google Scholar] [CrossRef] [PubMed]
- Barrett, S.P.; Parker, K.R.; Horn, C.; Mata, M.; Salzman, J. ciRS-7 exonic sequence is embedded in a long non-coding RNA locus. PLoS Genet. 2017, 13, e1007114. [Google Scholar] [CrossRef] [PubMed] [Green Version]
- Kristensen, L.S.; Mikeska, T.; Krypuy, M.; Dobrovic, A. Sensitive Melting Analysis after Real Time- Methylation Specific PCR (SMART-MSP): High-throughput and probe-free quantitative DNA methylation detection. Nucleic Acids Res. 2008, 36, e42. [Google Scholar] [CrossRef] [PubMed] [Green Version]
- Khalighfard, S.; Kalhori, M.R.; Haddad, P.; Khori, V.; Alizadeh, A.M. Enhancement of resistance to chemo-radiation by hsa-miR-1290 expression in glioblastoma cells. Eur. J. Pharmacol. 2020, 880, 173144. [Google Scholar] [CrossRef] [PubMed]
- Ye, L.; Jiang, T.; Shao, H.; Zhong, L.; Wang, Z.; Liu, Y.; Tang, H.; Qin, B.; Zhang, X.; Fan, J. miR-1290 Is a Biomarker in DNA-Mismatch-Repair-Deficient Colon Cancer and Promotes Resistance to 5-Fluorouracil by Directly Targeting hMSH2. Mol. Ther. Nucleic Acids 2017, 7, 453–464. [Google Scholar] [CrossRef] [Green Version]
- Dudekula, D.B.; Panda, A.C.; Grammatikakis, I.; De, S.; Abdelmohsen, K.; Gorospe, M. CircInteractome: A web tool for exploring circular RNAs and their interacting proteins and microRNAs. RNA Biol. 2016, 13, 34–42. [Google Scholar] [CrossRef] [Green Version]
- Hansen, T.B.; Wiklund, E.D.; Bramsen, J.B.; Villadsen, S.B.; Statham, A.L.; Clark, S.J.; Kjems, J. miRNA-dependent gene silencing involving Ago2-mediated cleavage of a circular antisense RNA. EMBO J. 2011, 30, 4414–4422. [Google Scholar] [CrossRef] [Green Version]
- Kristensen, L.S.; Ebbesen, K.K.; Sokol, M.; Jakobsen, T.; Korsgaard, U.; Eriksen, A.C.; Hansen, T.B.; Kjems, J.; Hager, H. Spatial expression analyses of the putative oncogene ciRS-7 in cancer reshape the microRNA sponge theory. Nat. Commun. 2020, 11, 4551. [Google Scholar] [CrossRef]
- Moldovan, L.I.; Hansen, T.B.; Veno, M.T.; Okholm, T.L.H.; Andersen, T.L.; Hager, H.; Iversen, L.; Kjems, J.; Johansen, C.; Kristensen, L.S. High-throughput RNA sequencing from paired lesional- and non-lesional skin reveals major alterations in the psoriasis circRNAome. BMC Med. Genom. 2019, 12, 174. [Google Scholar] [CrossRef] [PubMed] [Green Version]
- Das Mahapatra, K.; Pasquali, L.; Søndergaard, J.N.; Lapins, J.; Nemeth, I.B.; Baltás, E.; Kemény, L.; Homey, B.; Moldovan, L.-I.; Kjems, J.; et al. A comprehensive analysis of coding and non-coding transcriptomic changes in cutaneous squamous cell carcinoma. Sci. Rep. 2020, 10, 3637. [Google Scholar] [CrossRef] [PubMed] [Green Version]
- Ferreira, H.J.; Davalos, V.; de Moura, M.C.; Soler, M.; Perez-Salvia, M.; Bueno-Costa, A.; Setien, F.; Moran, S.; Villanueva, A.; Esteller, M. Circular RNA CpG island hypermethylation-associated silencing in human cancer. Oncotarget 2018, 9, 29208–29219. [Google Scholar] [CrossRef] [PubMed] [Green Version]
- Conn, S.J.; Pillman, K.A.; Toubia, J.; Conn, V.M.; Salmanidis, M.; Phillips, C.A.; Roslan, S.; Schreiber, A.W.; Gregory, P.A.; Goodall, G.J. The RNA binding protein quaking regulates formation of circRNAs. Cell 2015, 160, 1125–1134. [Google Scholar] [CrossRef] [PubMed] [Green Version]
- Rybak-Wolf, A.; Stottmeister, C.; Glažar, P.; Jens, M.; Pino, N.; Giusti, S.; Hanan, M.; Behm, M.; Bartok, O.; Ashwal-Fluss, R.; et al. Circular RNAs in the Mammalian Brain Are Highly Abundant, Conserved, and Dynamically Expressed. Mol. Cell 2015, 58, 870–885. [Google Scholar] [CrossRef] [Green Version]
- Aktas, T.; Avsar Ilik, I.; Maticzka, D.; Bhardwaj, V.; Pessoa Rodrigues, C.; Mittler, G.; Manke, T.; Backofen, R.; Akhtar, A. DHX9 suppresses RNA processing defects originating from the Alu invasion of the human genome. Nature 2017, 544, 115–119. [Google Scholar] [CrossRef]
- Veno, M.T.; Hansen, T.B.; Veno, S.T.; Clausen, B.H.; Grebing, M.; Finsen, B.; Holm, I.E.; Kjems, J. Spatio-temporal regulation of circular RNA expression during porcine embryonic brain development. Genome Biol. 2015, 16, 245. [Google Scholar] [CrossRef] [Green Version]
- Kristensen, L.S.; Nielsen, H.M.; Hager, H.; Hansen, L.L. Methylation of MGMT in malignant pleural mesothelioma occurs in a subset of patients and is associated with the T allele of the rs16906252 MGMT promoter SNP. Lung Cancer 2011, 71, 130–136. [Google Scholar] [CrossRef]
- Weisenberger, D.J.; Campan, M.; Long, T.I.; Kim, M.; Woods, C.; Fiala, E.; Ehrlich, M.; Laird, P.W. Analysis of repetitive element DNA methylation by MethyLight. Nucleic Acids Res. 2005, 33, 6823–6836. [Google Scholar] [CrossRef] [Green Version]


Publisher’s Note: MDPI stays neutral with regard to jurisdictional claims in published maps and institutional affiliations. |
© 2021 by the authors. Licensee MDPI, Basel, Switzerland. This article is an open access article distributed under the terms and conditions of the Creative Commons Attribution (CC BY) license (http://creativecommons.org/licenses/by/4.0/).
Share and Cite
Jakobsen, T.; Dahl, M.; Dimopoulos, K.; Grønbæk, K.; Kjems, J.; Kristensen, L.S. Genome-Wide Circular RNA Expression Patterns Reflect Resistance to Immunomodulatory Drugs in Multiple Myeloma Cells. Cancers 2021, 13, 365. https://doi.org/10.3390/cancers13030365
Jakobsen T, Dahl M, Dimopoulos K, Grønbæk K, Kjems J, Kristensen LS. Genome-Wide Circular RNA Expression Patterns Reflect Resistance to Immunomodulatory Drugs in Multiple Myeloma Cells. Cancers. 2021; 13(3):365. https://doi.org/10.3390/cancers13030365
Chicago/Turabian StyleJakobsen, Theresa, Mette Dahl, Konstantinos Dimopoulos, Kirsten Grønbæk, Jørgen Kjems, and Lasse Sommer Kristensen. 2021. "Genome-Wide Circular RNA Expression Patterns Reflect Resistance to Immunomodulatory Drugs in Multiple Myeloma Cells" Cancers 13, no. 3: 365. https://doi.org/10.3390/cancers13030365