
EWSR1-WT1 Target Genes and Therapeutic Options Identified in a Novel DSRCT In Vitro Model

 and
and 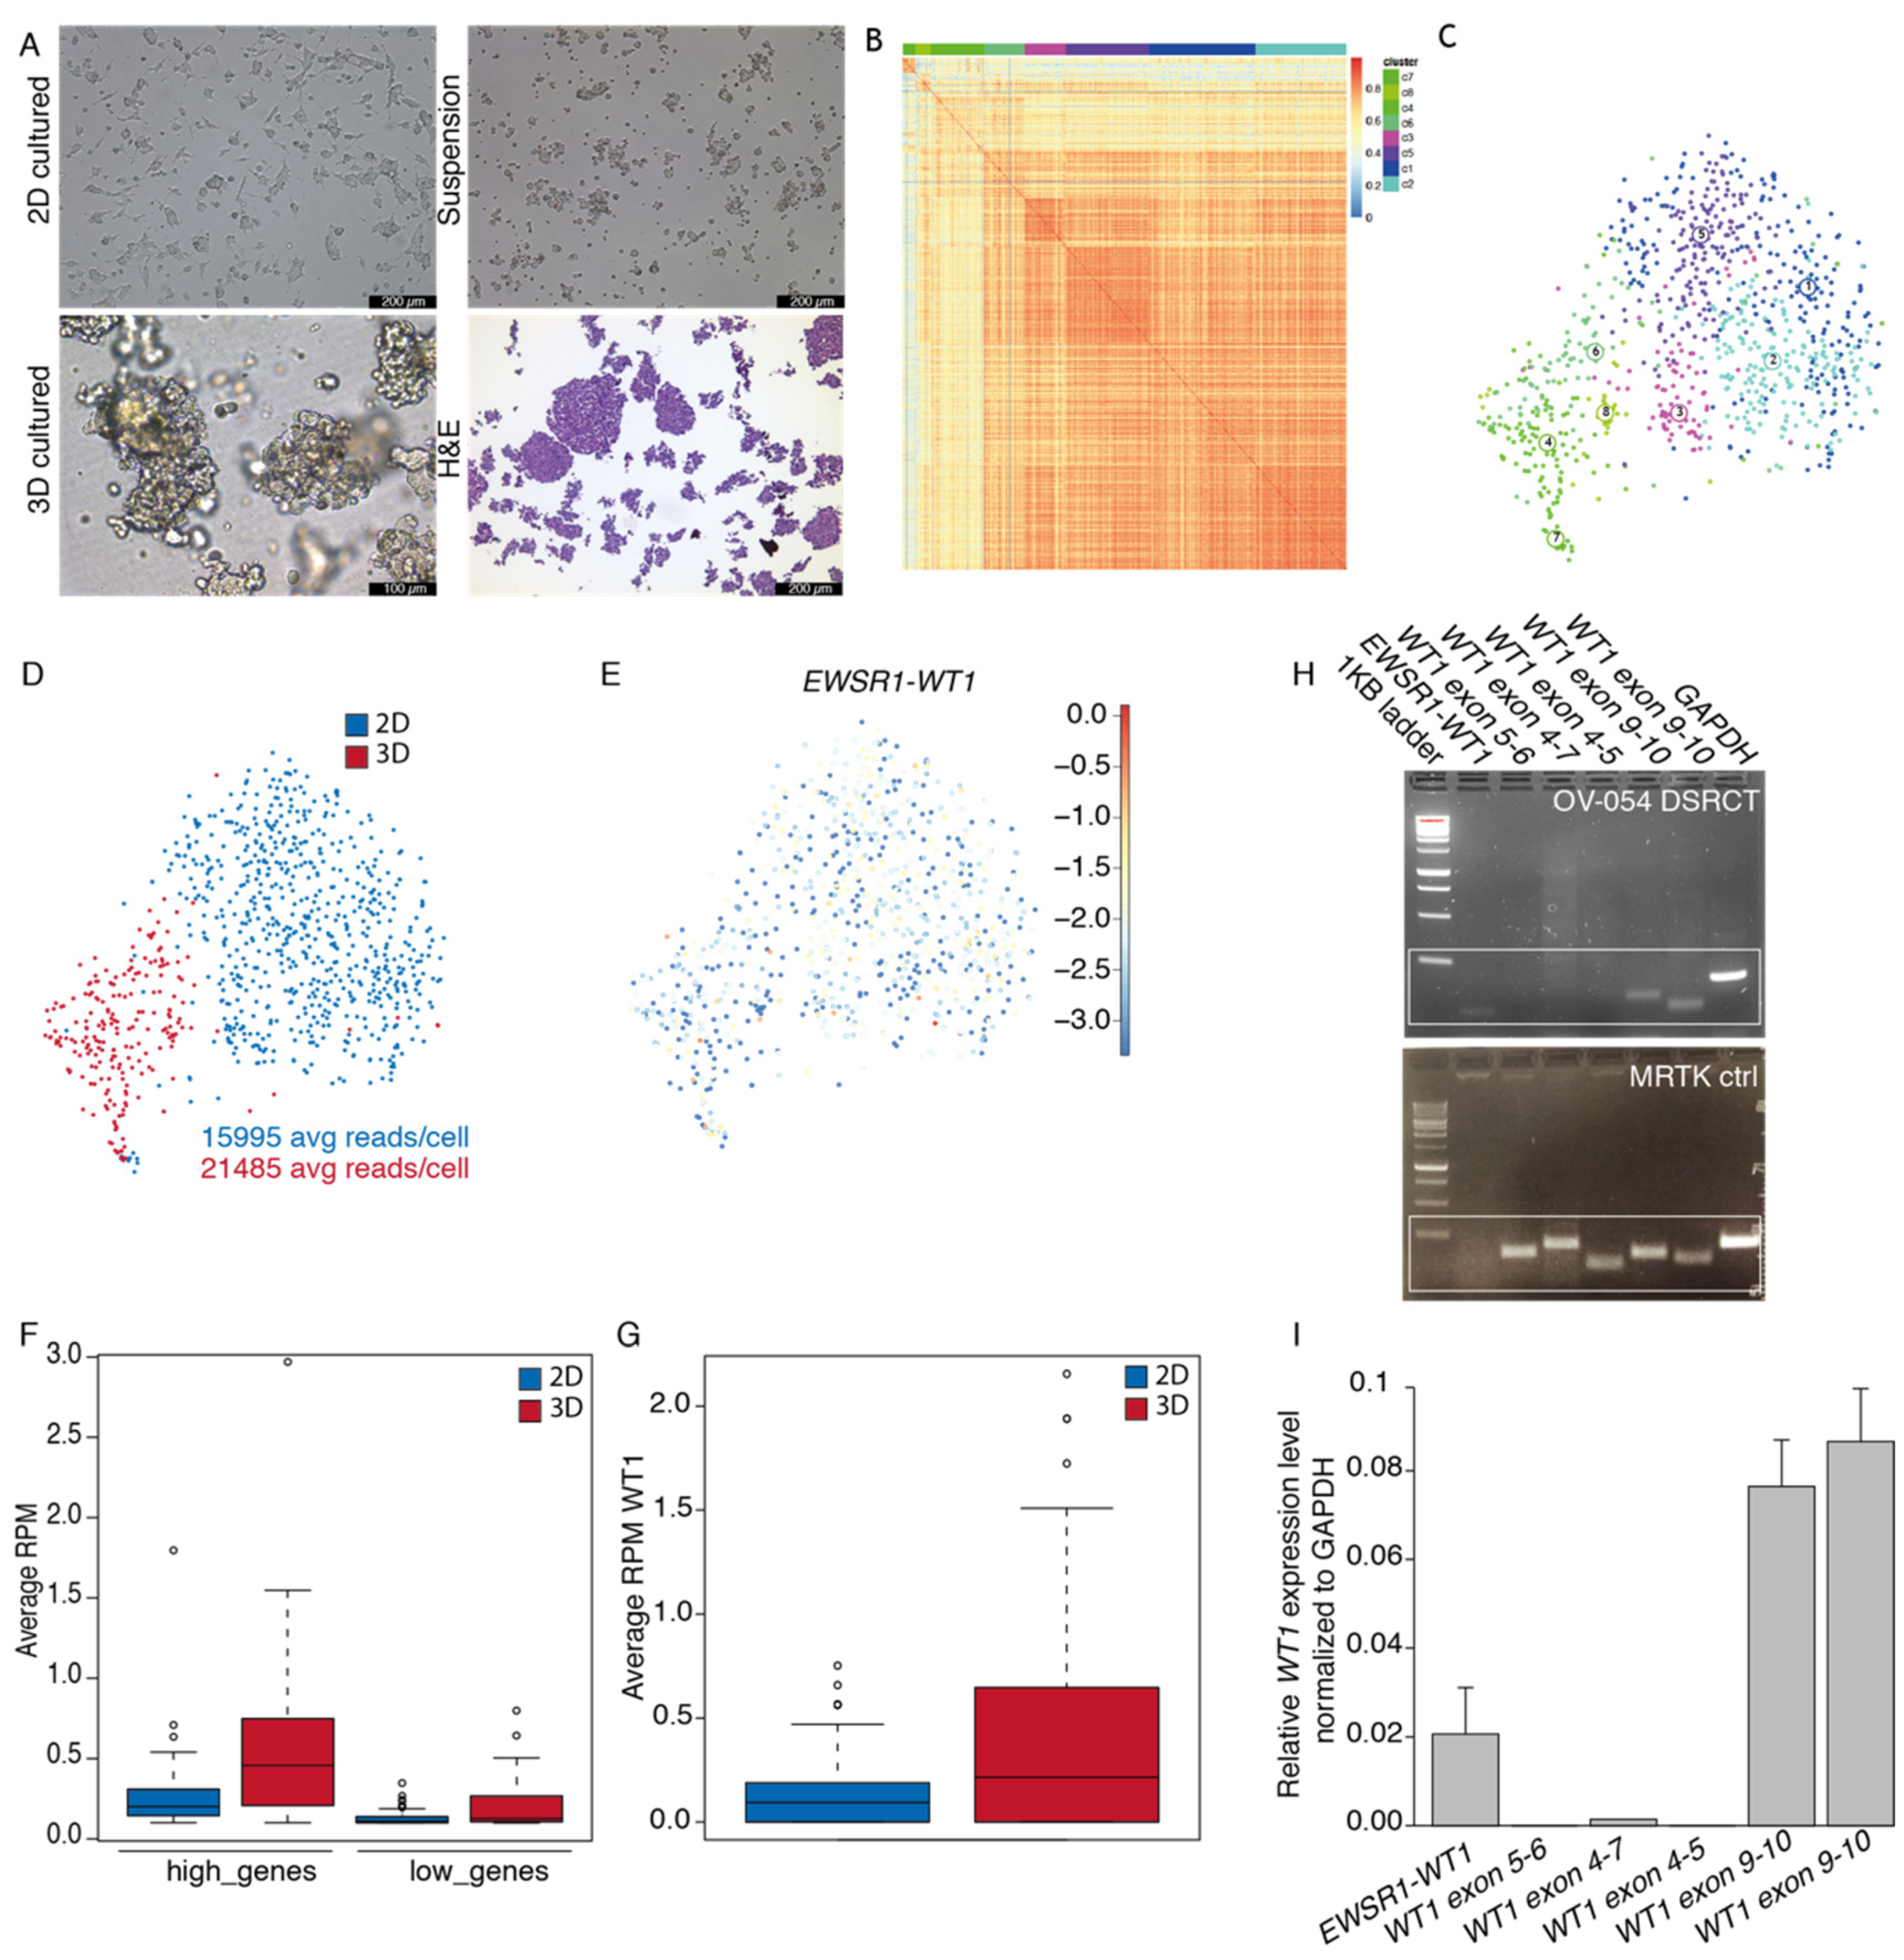
Abstract
:Simple Summary
Abstract
1. Introduction
2. Materials and Methods
2.1. Patient-Derived DSRCT Specimen
2.2. Cell Culture
2.3. Single-Cell RNA Sequencing
2.4. Comparison R2 Dataset
2.5. Introduction of shRNAs into OV-054 DSRCT Cells
2.6. RNA Isolation, PCR, and qPCR
2.7. RNA Sequencing
2.8. Time-Lapse Imaging and Particle Analysis
2.9. Medium-Throughput Compound Screen
2.10. UNC2025 Screen
3. Results
3.1. Establishment and Characterization of a DSRCT In Vitro Preclinical Model
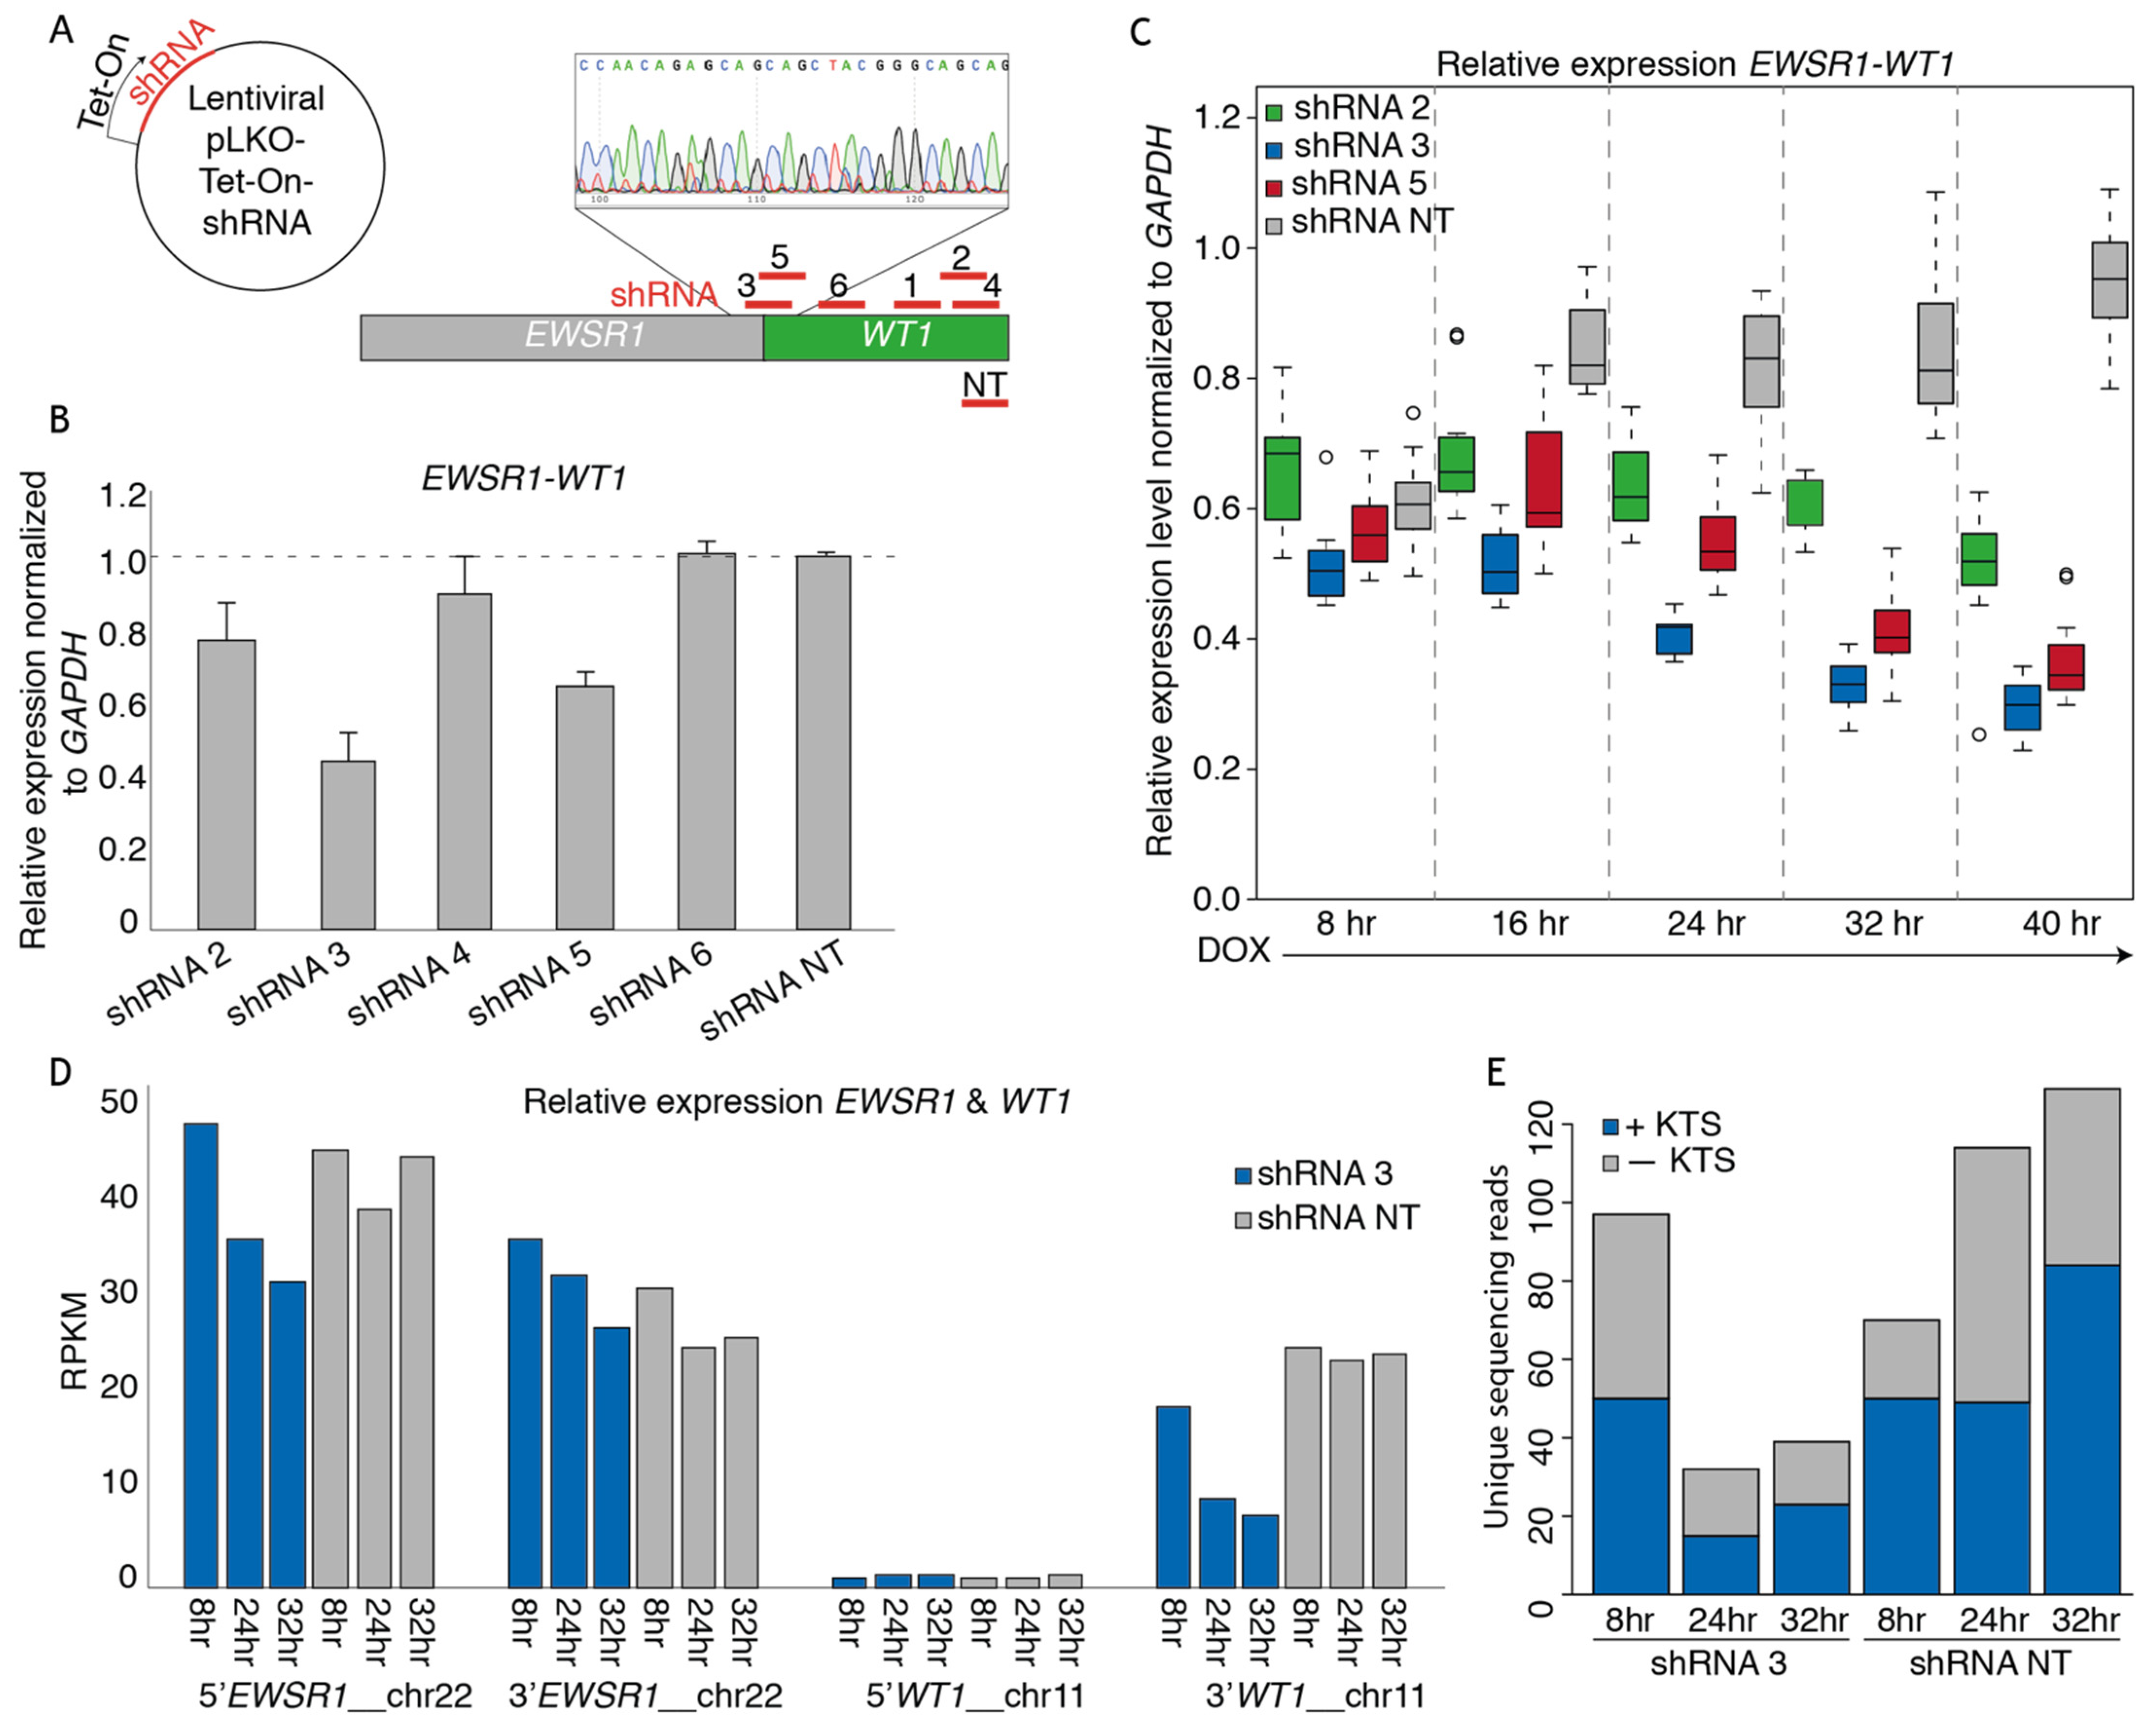
3.2. shRNAs Targeting the EWSR1-WT Breakpoint Create an Effective Knock-Down of the Fusion mRNA
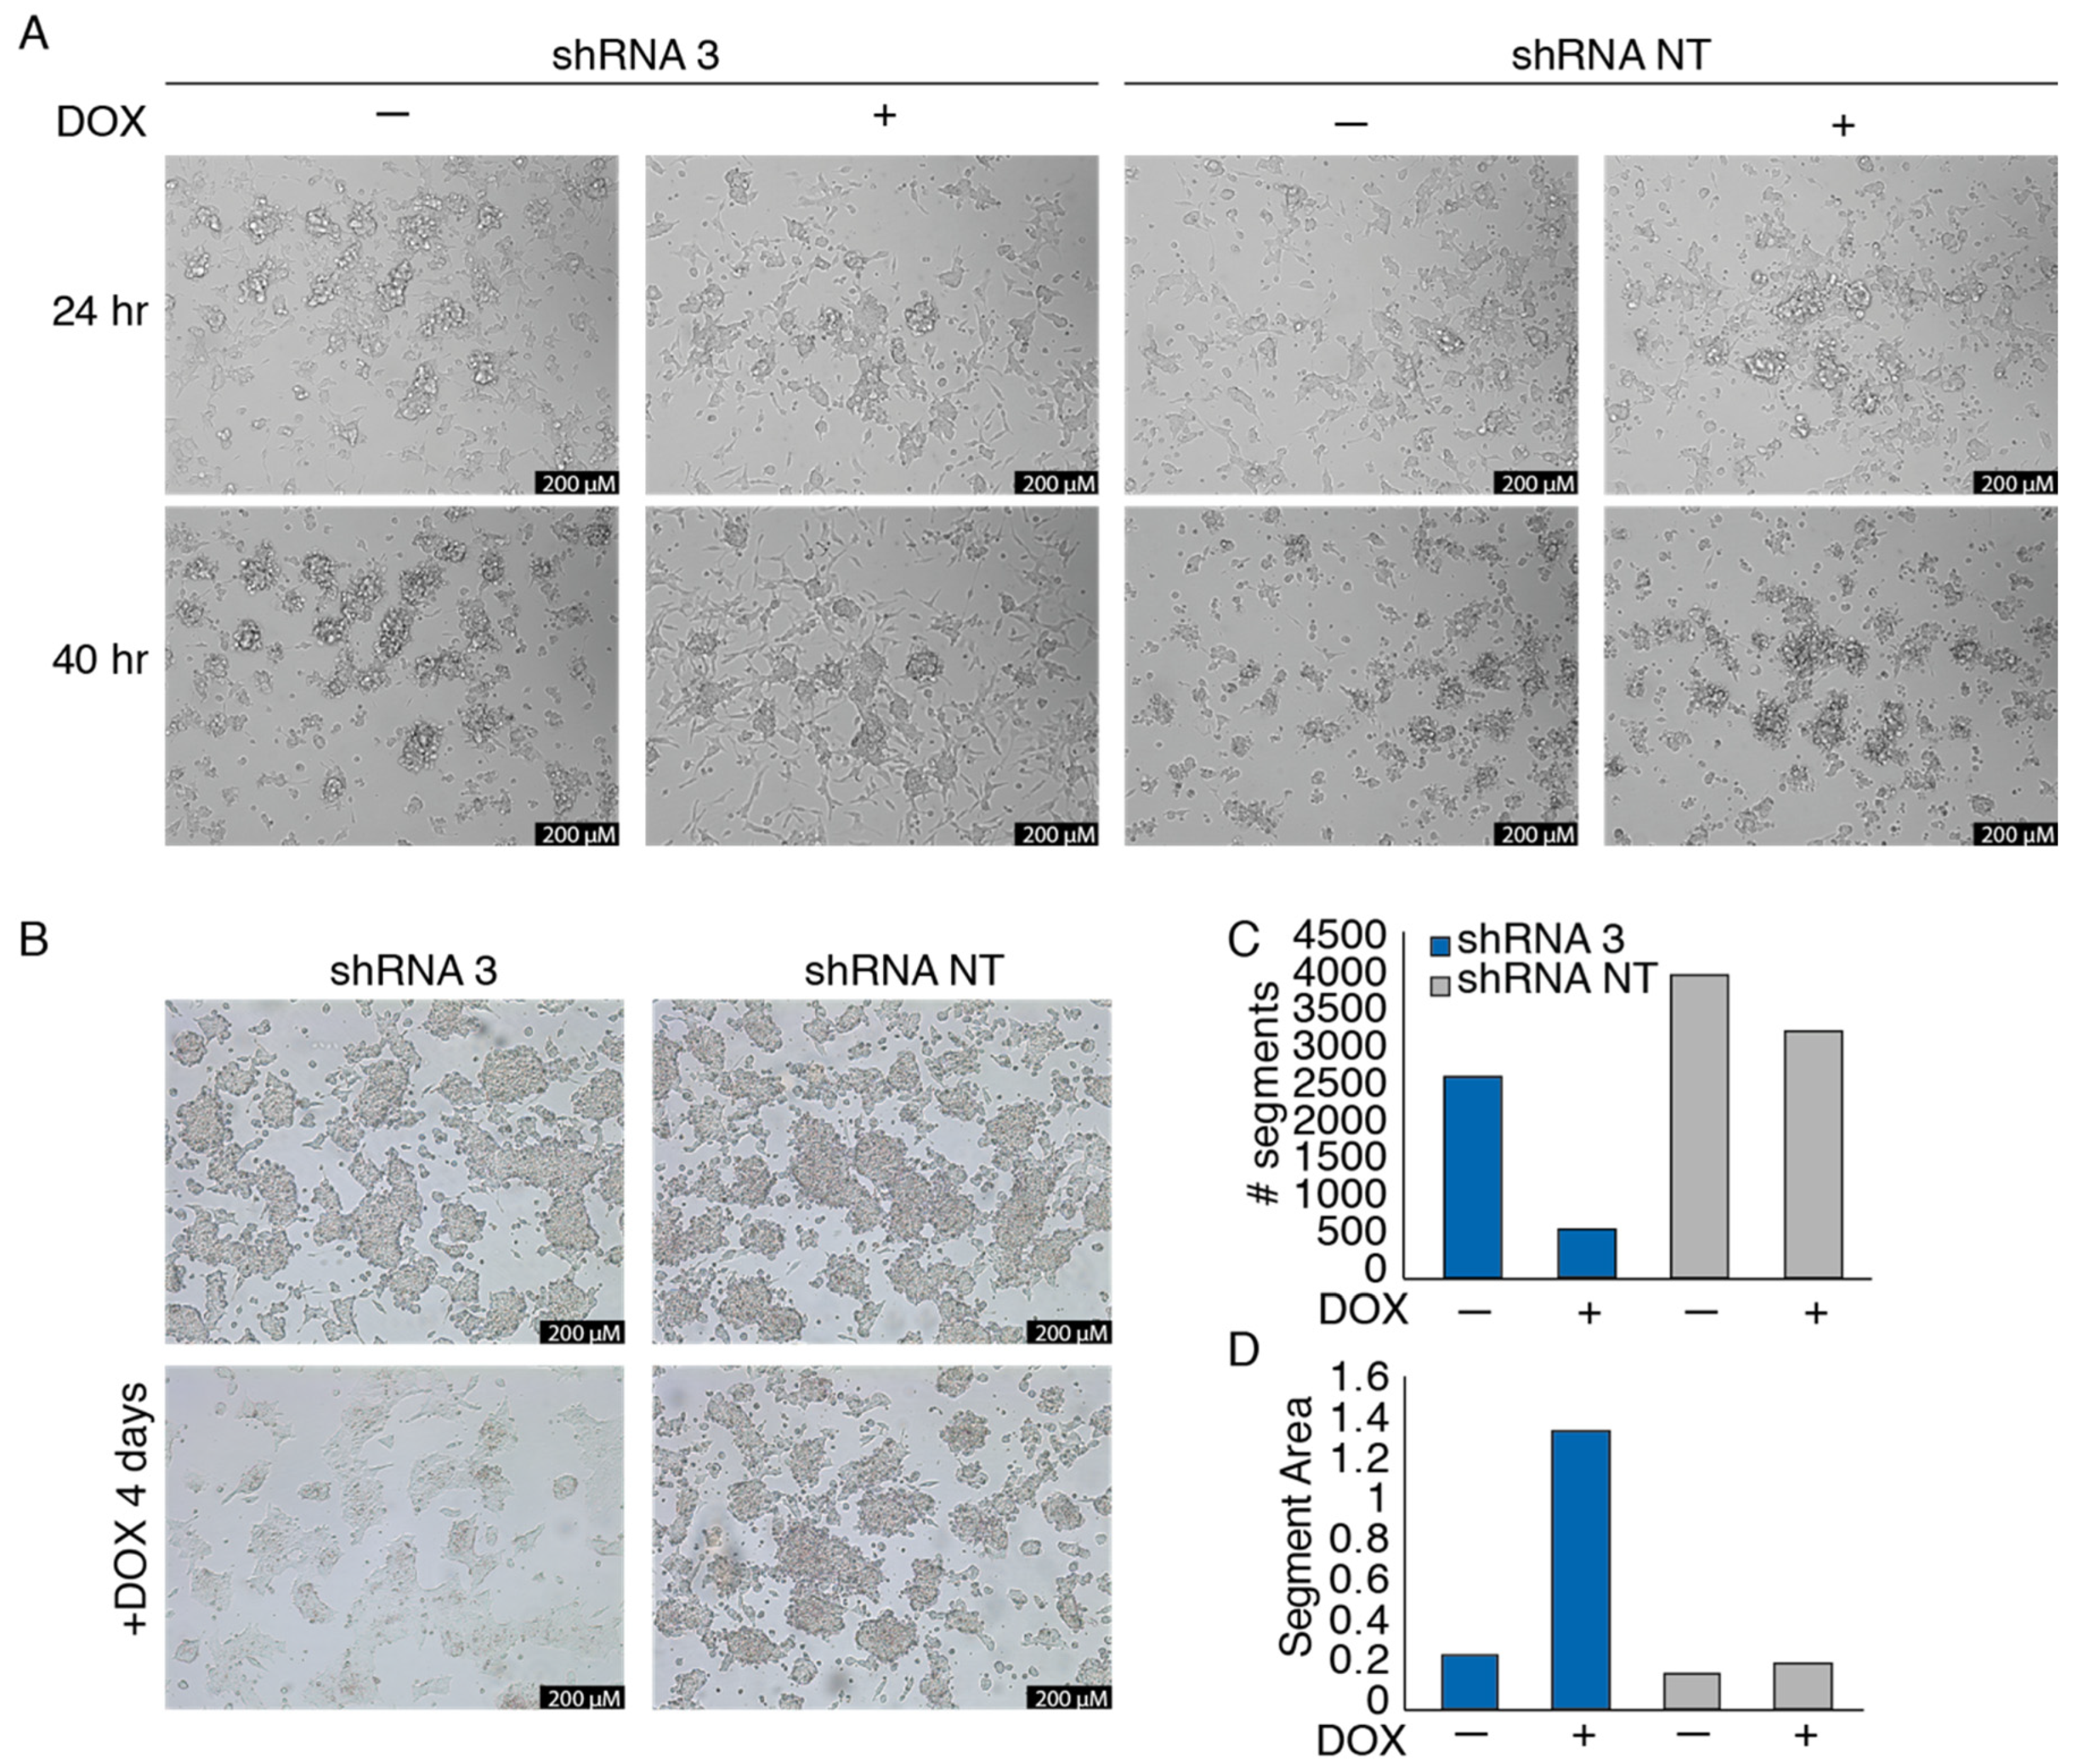
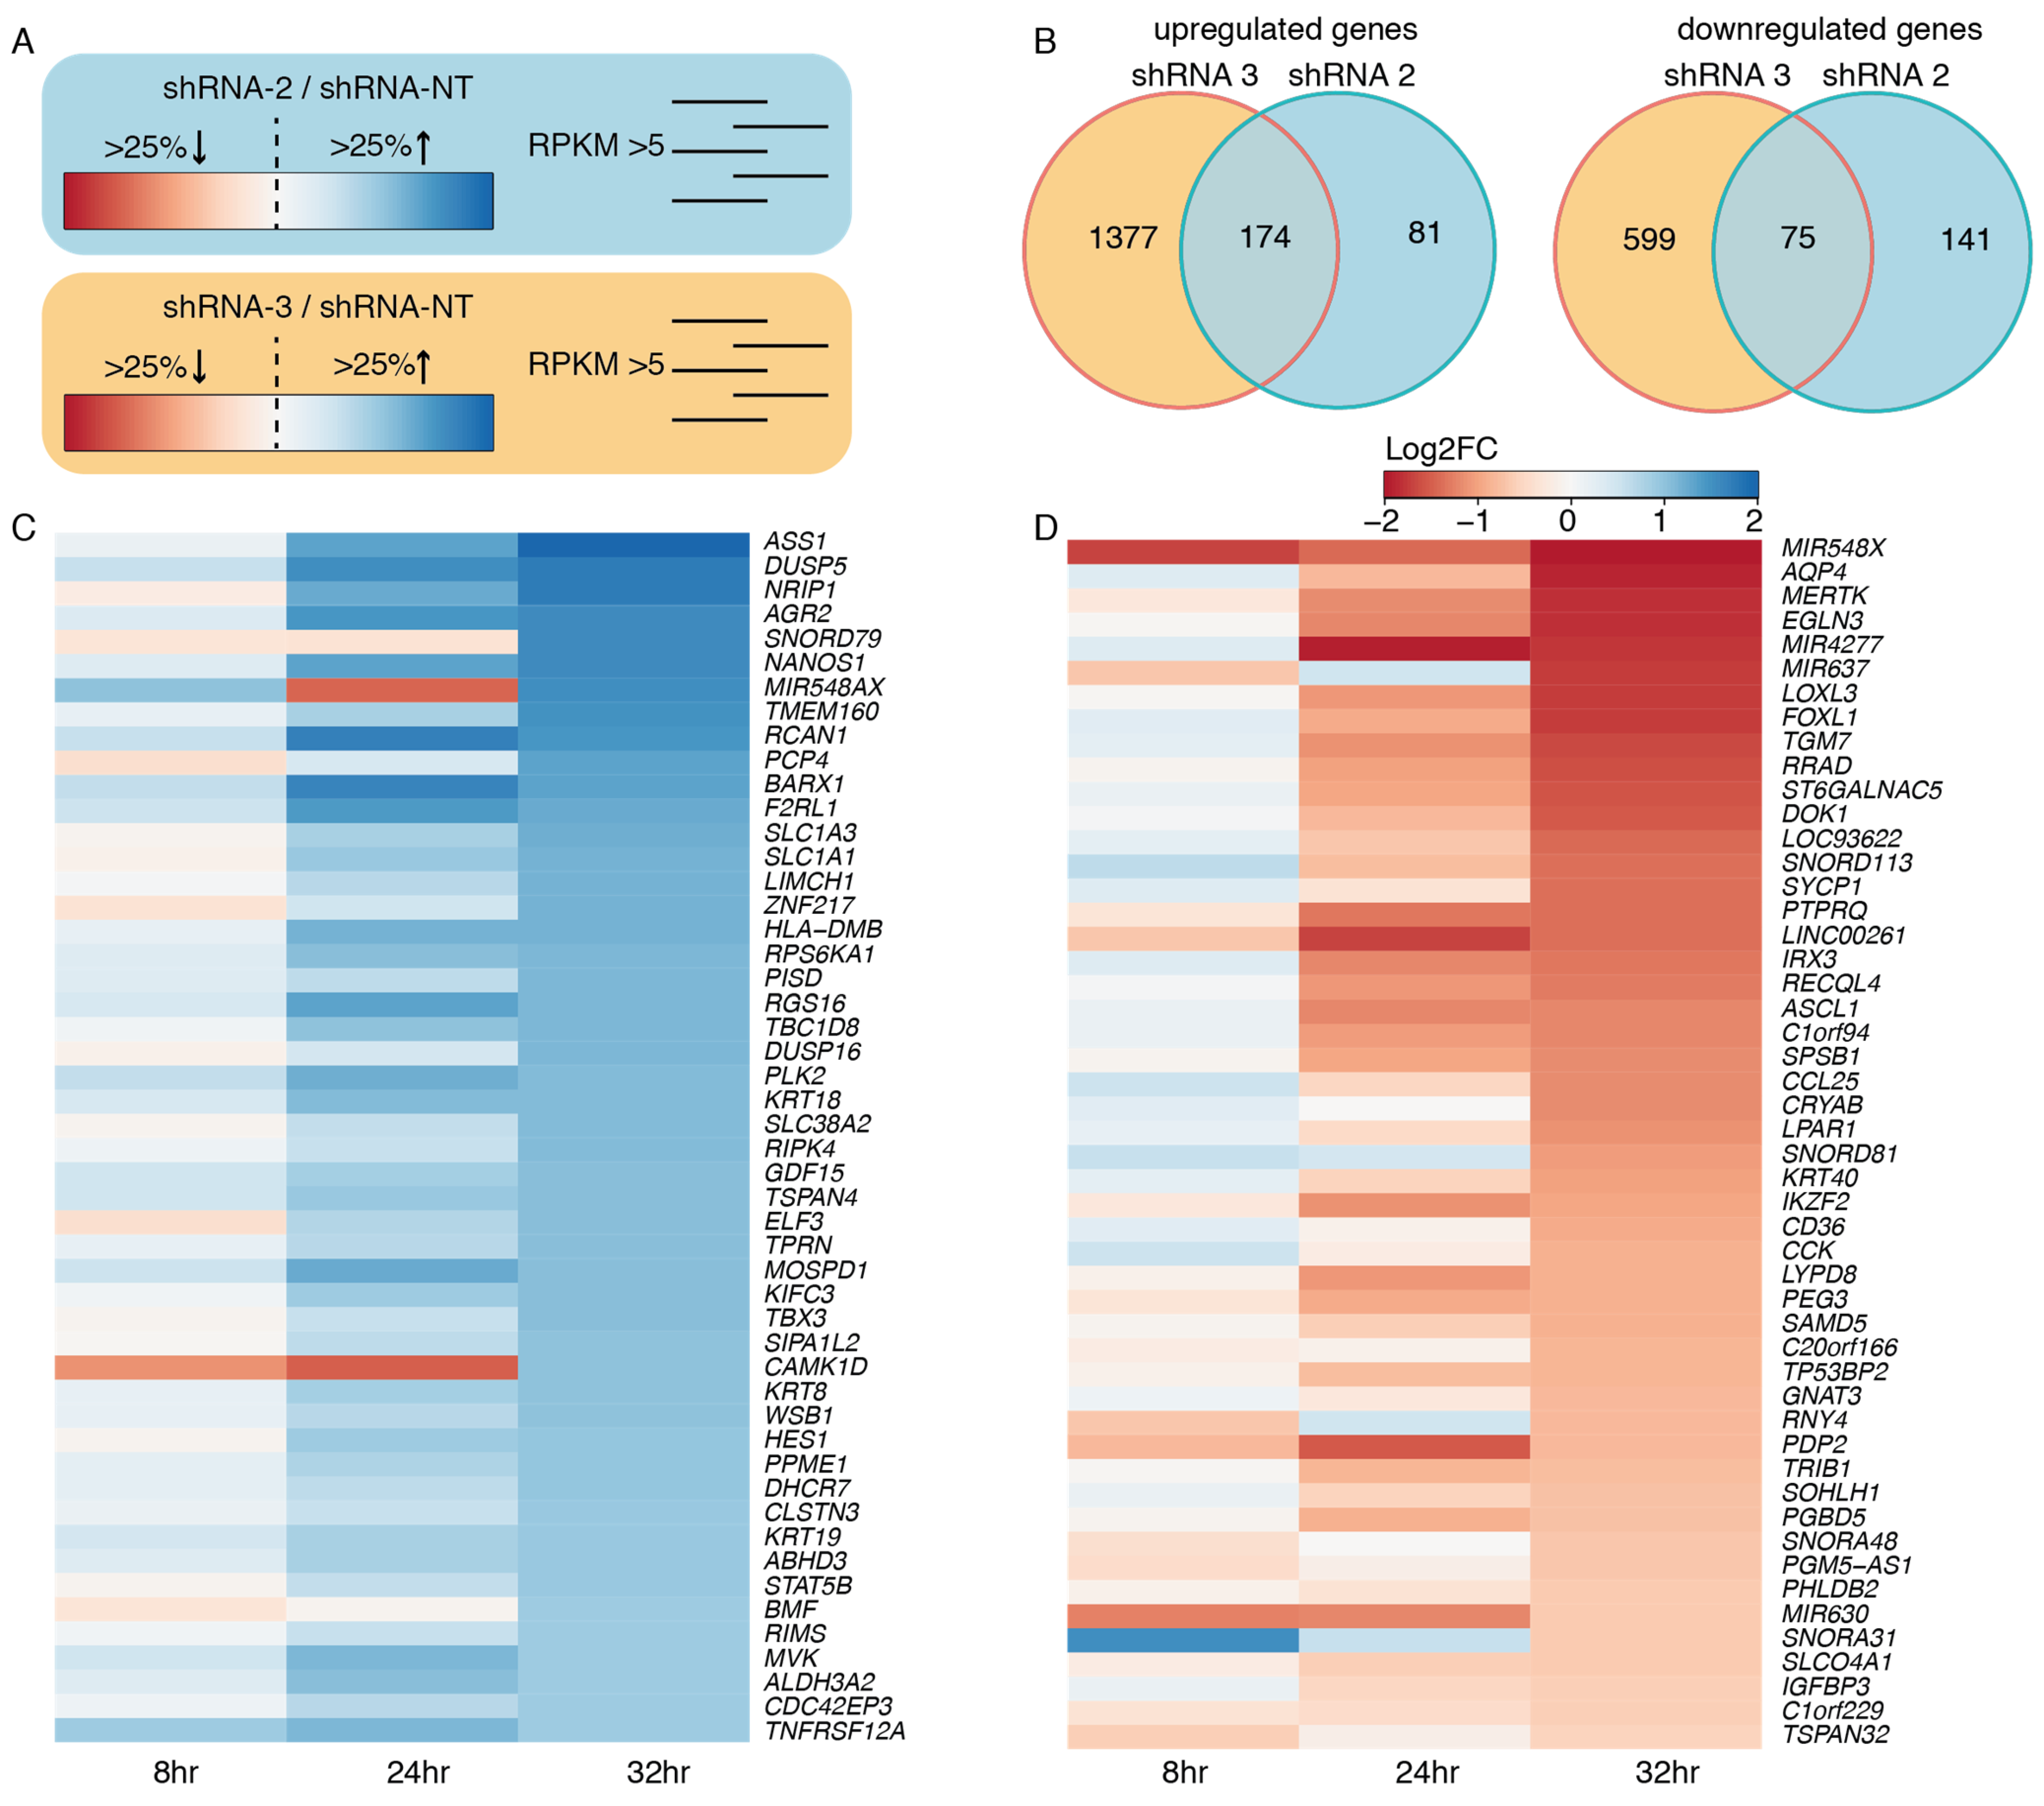
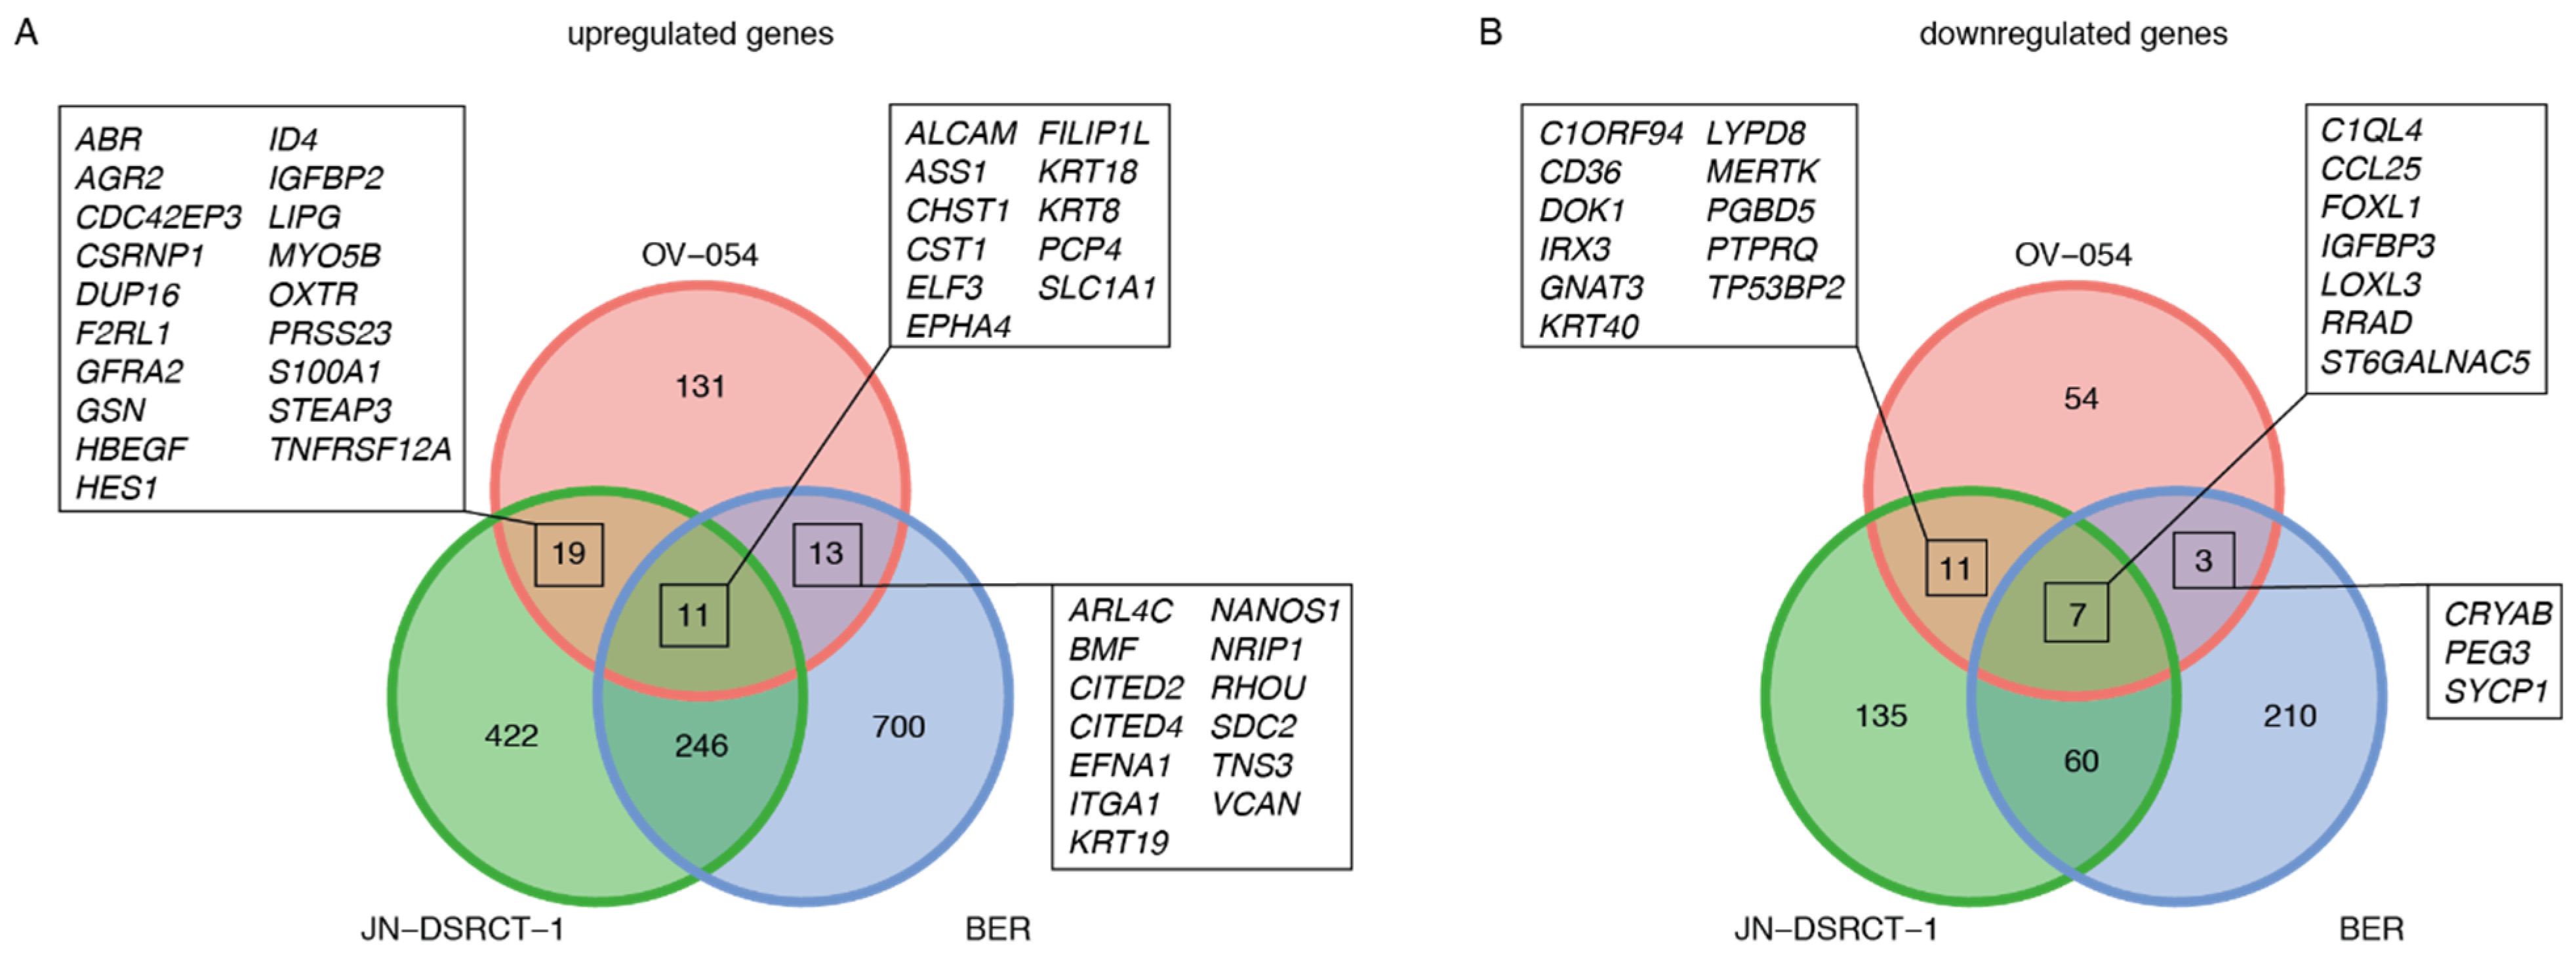
3.3. EWSR1-WT1 Expression Affects Cell Shape, Cell Propagation, and the Transcriptome
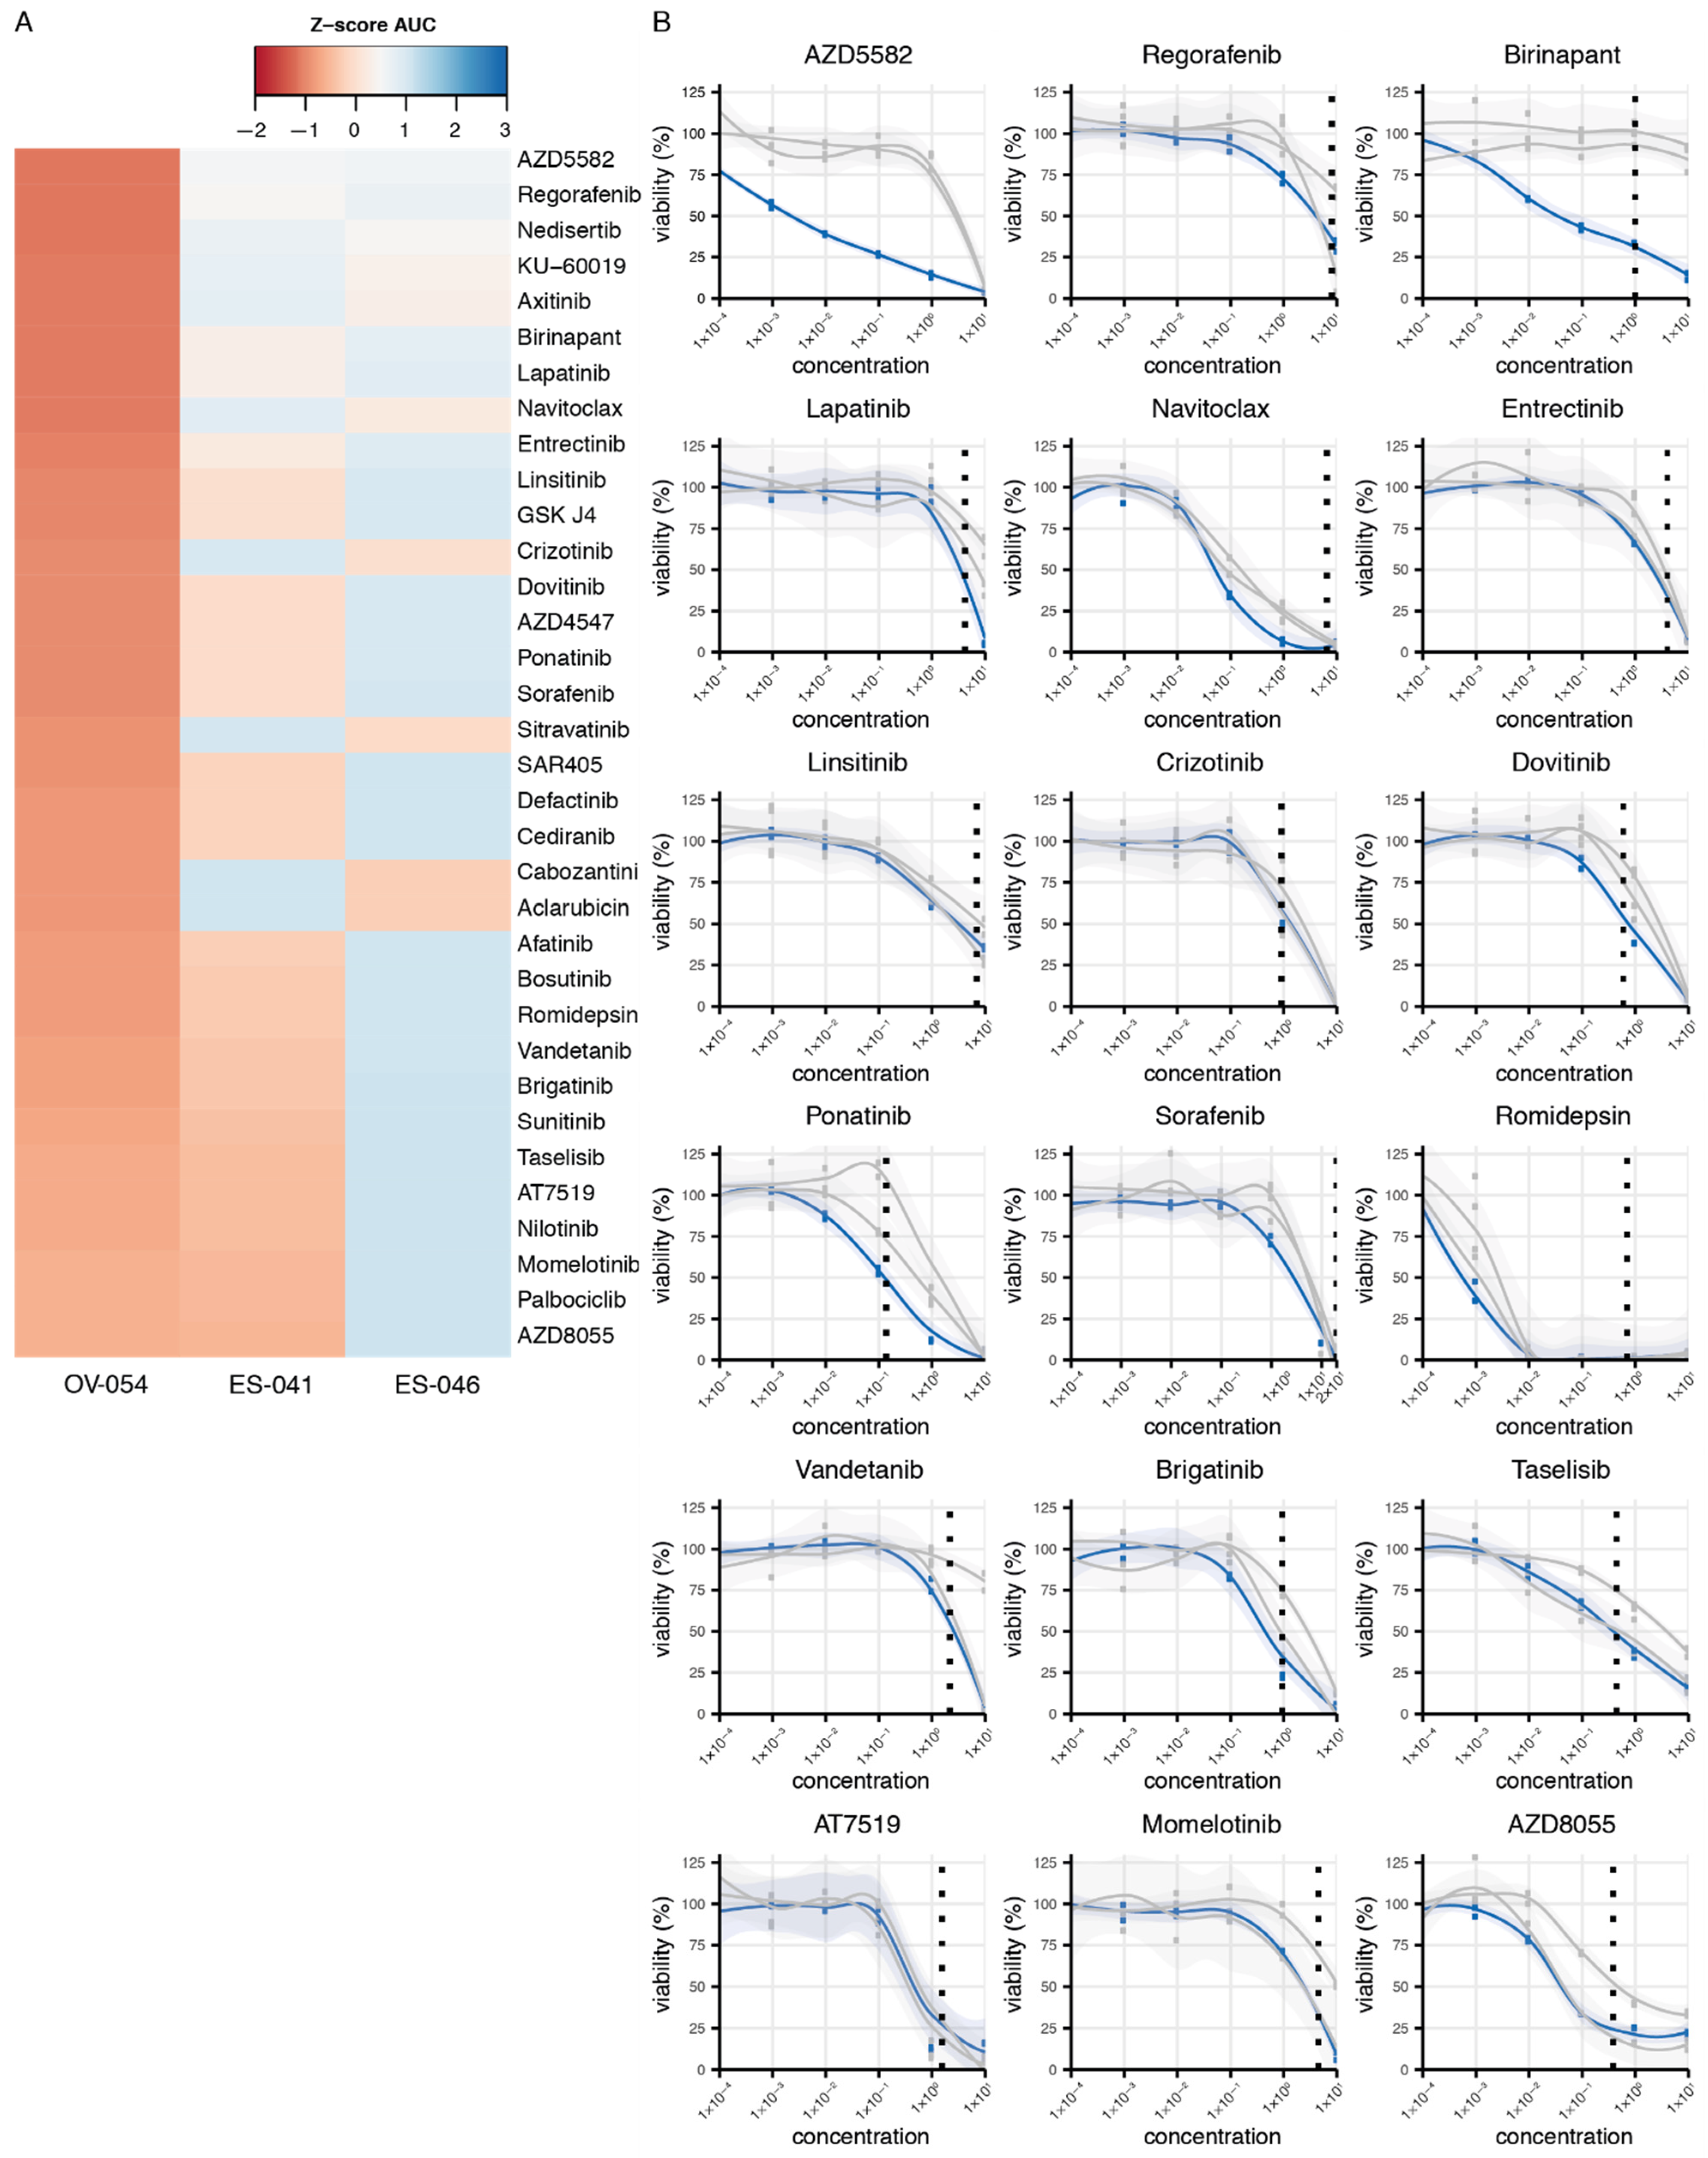
3.4. Drug Screen on OV-054 Cells Reveals Effective Compounds Targeting RTKs and Downstream Pathways
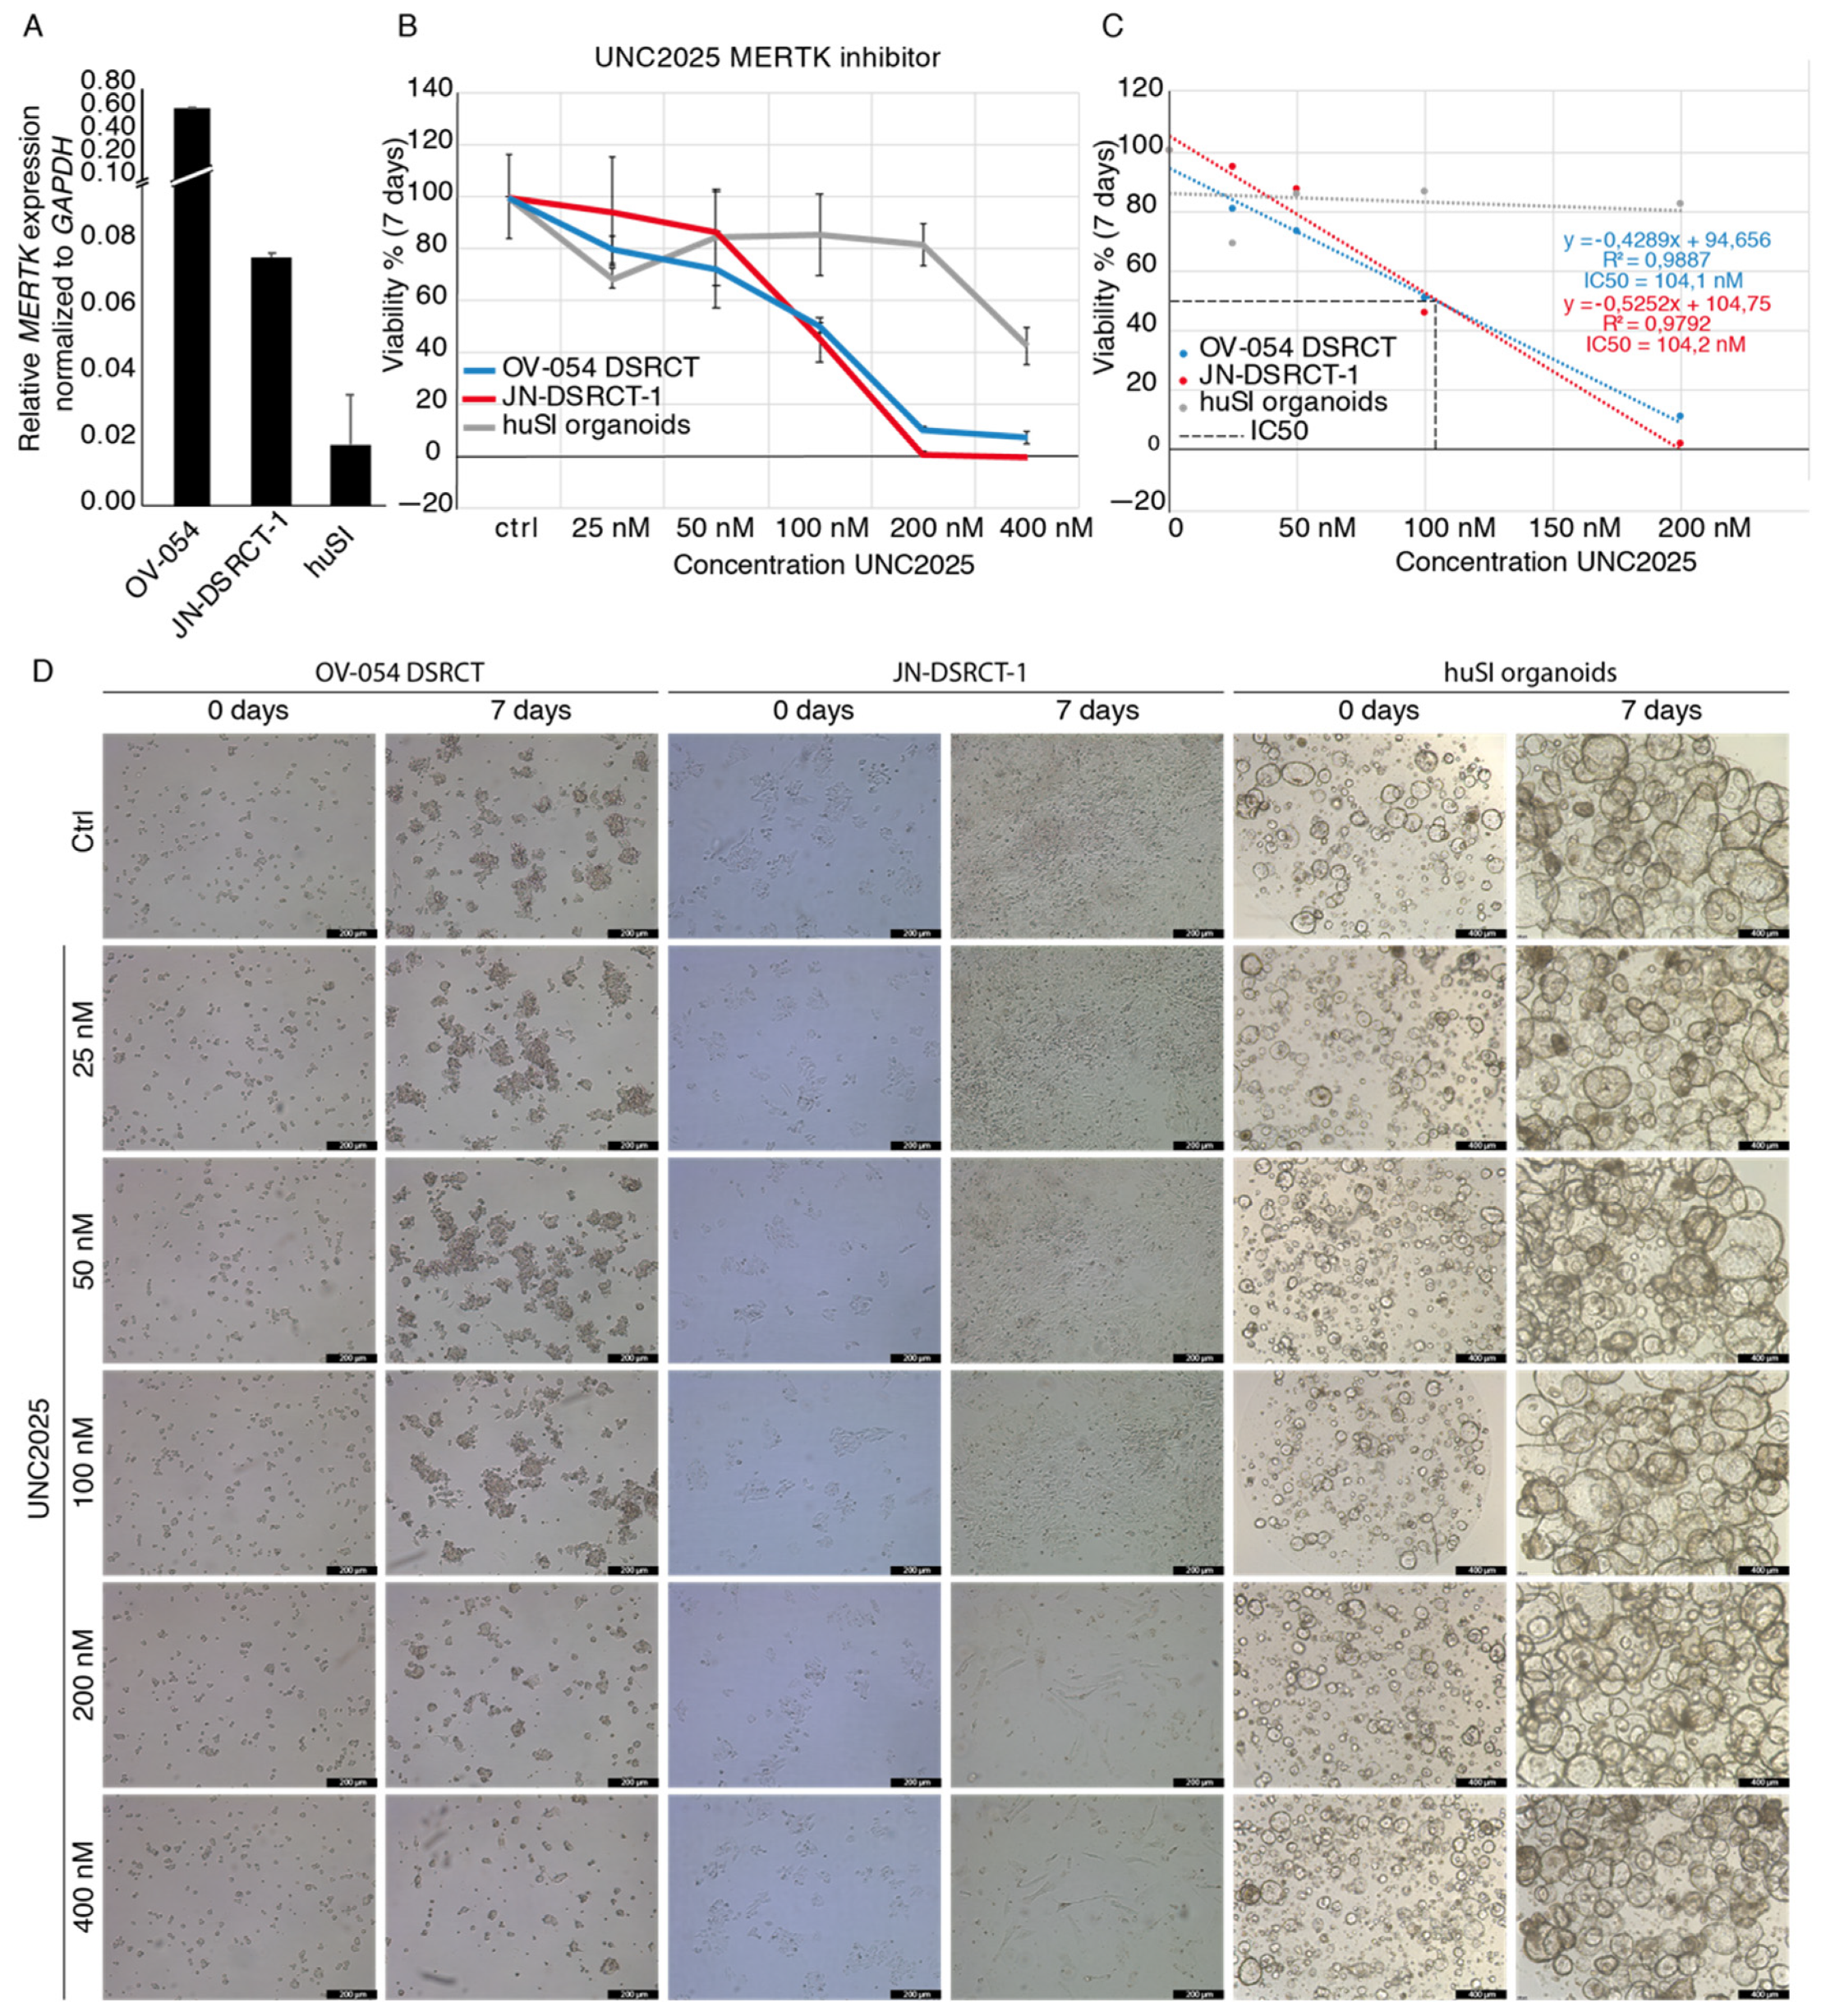
3.5. MERTK, Regulated by EWSR1-WT1, Is a Potential Therapeutic Target in DSRCT
4. Discussion
5. Conclusions
Supplementary Materials
Author Contributions
Funding
Institutional Review Board Statement
Informed Consent Statement
Data Availability Statement
Acknowledgments
Conflicts of Interest
References
- Soft Tissue and Bone Tumours: WHO Classification of Tumours, 5th ed.; IARC: Lyon, France, 2020.
- Bulbul, A.; Fahy, B.N.; Xiu, J.; Rashad, S.; Mustafa, A.; Husain, H.; Hayes-Jordan, A. Desmoplastic small round blue cell tumor: A review of treatment and potential therapeutic genomic alterations. Sarcoma 2017, 2017, 1278268. [Google Scholar] [CrossRef] [PubMed]
- Hayes-Jordan, A.; LaQuaglia, M.P.; Modak, S. Management of desmoplastic small round cell tumor. Semin. Pediatr. Surg. 2016, 25, 299–304. [Google Scholar] [CrossRef] [PubMed] [Green Version]
- Gerald, W.L.; Rosai, J. Case 2. Desmoplastic small cell tumor with divergent differentiation. Pediatr. Pathol. 1989, 9, 177–183. [Google Scholar] [CrossRef] [PubMed]
- Karnieli, E.; Werner, H.; Rauscher, F.J., 3rd; Benjamin, L.E.; LeRoith, D. The IGF-I receptor gene promoter is a molecular target for the Ewing’s sarcoma-Wilms’ tumor 1 fusion protein. J. Biol. Chem. 1996, 271, 19304–19309. [Google Scholar] [CrossRef] [PubMed] [Green Version]
- Gerald, W.L.; Haber, D.A. The EWS-WT1 gene fusion in desmoplastic small round cell tumor. Semin. Cancer Biol. 2005, 15, 197–205. [Google Scholar] [CrossRef]
- Kang, H.J.; Park, J.H.; Chen, W.; Kang, S.I.; Moroz, K.; Ladanyi, M.; Lee, S.B. EWS-WT1 oncoprotein activates neuronal reprogramming factor ASCL1 and promotes neural differentiation. Cancer Res. 2014, 74, 4526–4535. [Google Scholar] [CrossRef] [Green Version]
- Kim, J.; Lee, K.; Pelletier, J. The desmoplastic small round cell tumor t(11;22) translocation produces EWS/WT1 isoforms with differing oncogenic properties. Oncogene 1998, 16, 1973–1979. [Google Scholar] [CrossRef] [Green Version]
- Watson, S.; Perrin, V.; Guillemot, D.; Reynaud, S.; Coindre, J.M.; Karanian, M.; Guinebretiere, J.M.; Freneaux, P.; Le Loarer, F.; Bouvet, M.; et al. Transcriptomic definition of molecular subgroups of small round cell sarcomas. J. Pathol. 2018, 245, 29–40. [Google Scholar] [CrossRef] [PubMed] [Green Version]
- Gedminas, J.M.; Chasse, M.H.; McBrairty, M.; Beddows, I.; Kitchen-Goosen, S.M.; Grohar, P.J. Desmoplastic small round cell tumor is dependent on the EWS-WT1 transcription factor. Oncogenesis 2020, 9, 41. [Google Scholar] [CrossRef] [PubMed]
- Markides, C.S.; Coil, D.R.; Luong, L.H.; Mendoza, J.; Kozielski, T.; Vardeman, D.; Giovanella, B.C. Desmoplastic small round cell tumor (DSRCT) xenografts and tissue culture lines: Establishment and initial characterization. Oncol. Lett. 2013, 5, 1453–1456. [Google Scholar] [CrossRef] [PubMed]
- Nishio, J.; Iwasaki, H.; Ishiguro, M.; Ohjimi, Y.; Fujita, C.; Yanai, F.; Nibu, K.; Mitsudome, A.; Kaneko, Y.; Kikuchi, M. Establishment and characterization of a novel human desmoplastic small round cell tumor cell line, JN-DSRCT-1. Lab. Investig. 2002, 82, 1175–1182. [Google Scholar] [CrossRef]
- Hingorani, P.; Dinu, V.; Zhang, X.; Lei, H.; Shern, J.F.; Park, J.; Steel, J.; Rauf, F.; Parham, D.; Gastier-Foster, J.; et al. Transcriptome analysis of desmoplastic small round cell tumors identifies actionable therapeutic targets: A report from the Children’s Oncology Group. Sci. Rep. 2020, 10, 12318. [Google Scholar] [CrossRef] [PubMed]
- Bleijs, M.; van de Wetering, M.; Clevers, H.; Drost, J. Xenograft and organoid model systems in cancer research. EMBO J. 2019, 38, e101654. [Google Scholar] [CrossRef] [PubMed]
- Muraro, M.J.; Dharmadhikari, G.; Grun, D.; Groen, N.; Dielen, T.; Jansen, E.; van Gurp, L.; Engelse, M.A.; Carlotti, F.; de Koning, E.J.; et al. A single-cell transcriptome atlas of the human pancreas. Cell Syst. 2016, 3, 385–394.e3. [Google Scholar] [CrossRef] [Green Version]
- Herman, J.S.; Sagar; Grun, D. FateID infers cell fate bias in multipotent progenitors from single-cell RNA-seq data. Nat. Methods 2018, 15, 379–386. [Google Scholar] [CrossRef] [PubMed]
- Van Tilburg, C.M.; Pfaff, E.; Pajtler, K.W.; Langenberg, K.P.S.; Fiesel, P.; Jones, B.C.; Balasubramanian, G.P.; Stark, S.; Johann, P.D.; Blattner-Johnson, M.; et al. The pediatric precision oncology inform registry: Clinical outcome and benefit for patients with very high-evidence targets. Cancer Discov. 2021, 11, 2764–2779. [Google Scholar] [CrossRef] [PubMed]
- Li, H.; Durbin, R. Fast and accurate short read alignment with Burrows-Wheeler transform. Bioinformatics 2009, 25, 1754–1760. [Google Scholar] [CrossRef] [PubMed] [Green Version]
- Da huang, W.; Sherman, B.T.; Lempicki, R.A. Bioinformatics enrichment tools: Paths toward the comprehensive functional analysis of large gene lists. Nucleic Acids. Res. 2009, 37, 1–13. [Google Scholar] [CrossRef] [PubMed] [Green Version]
- Da Huang, W.; Sherman, B.T.; Lempicki, R.A. Systematic and integrative analysis of large gene lists using DAVID bioinformatics resources. Nat. Protoc. 2009, 4, 44–57. [Google Scholar] [CrossRef]
- Calandrini, C.; Schutgens, F.; Oka, R.; Margaritis, T.; Candelli, T.; Mathijsen, L.; Ammerlaan, C.; van Ineveld, R.L.; Derakhshan, S.; de Haan, S.; et al. An organoid biobank for childhood kidney cancers that captures disease and tissue heterogeneity. Nat. Commun. 2020, 11, 1310. [Google Scholar] [CrossRef]
- Pastushenko, I.; Blanpain, C. EMT transition states during tumor progression and metastasis. Trends Cell Biol. 2019, 29, 212–226. [Google Scholar] [CrossRef] [PubMed] [Green Version]
- Bedi, S.; Khan, S.A.; AbuKhader, M.M.; Alam, P.; Siddiqui, N.A.; Husain, A. A comprehensive review on Brigatinib—A wonder drug for targeted cancer therapy in non-small cell lung cancer. Saudi Pharm. J. 2018, 26, 755–763. [Google Scholar] [CrossRef]
- Chen, E.X.; Hotte, S.; Hirte, H.; Siu, L.L.; Lyons, J.; Squires, M.; Lovell, S.; Turner, S.; McIntosh, L.; Seymour, L. A Phase I study of cyclin-dependent kinase inhibitor, AT7519, in patients with advanced cancer: NCIC Clinical Trials Group IND 177. Br. J. Cancer 2014, 111, 2262–2267. [Google Scholar] [CrossRef] [PubMed] [Green Version]
- Juric, D.; Krop, I.; Ramanathan, R.K.; Wilson, T.R.; Ware, J.A.; Sanabria Bohorquez, S.M.; Savage, H.M.; Sampath, D.; Salphati, L.; Lin, R.S.; et al. Phase I dose-escalation study of taselisib, an oral PI3K inhibitor, in patients with advanced solid tumors. Cancer Discov. 2017, 7, 704–715. [Google Scholar] [CrossRef] [Green Version]
- Kang, Y.K.; Yoo, C.; Ryoo, B.Y.; Lee, J.J.; Tan, E.; Park, I.; Park, J.H.; Choi, Y.J.; Jo, J.; Ryu, J.S.; et al. Phase II study of dovitinib in patients with metastatic and/or unresectable gastrointestinal stromal tumours after failure of imatinib and sunitinib. Br. J. Cancer 2013, 109, 2309–2315. [Google Scholar] [CrossRef] [PubMed]
- Liston, D.R.; Davis, M. Clinically relevant concentrations of anticancer drugs: A guide for nonclinical studies. Clin. Cancer Res. 2017, 23, 3489–3498. [Google Scholar] [CrossRef] [PubMed] [Green Version]
- Macaulay, V.M.; Middleton, M.R.; Eckhardt, S.G.; Rudin, C.M.; Juergens, R.A.; Gedrich, R.; Gogov, S.; McCarthy, S.; Poondru, S.; Stephens, A.W.; et al. Phase I dose-escalation study of linsitinib (OSI-906) and erlotinib in patients with advanced solid tumors. Clin. Cancer Res. 2016, 22, 2897–2907. [Google Scholar] [CrossRef] [PubMed] [Green Version]
- Meneses-Lorente, G.; Bentley, D.; Guerini, E.; Kowalski, K.; Chow-Maneval, E.; Yu, L.; Brink, A.; Djebli, N.; Mercier, F.; Buchheit, V.; et al. Characterization of the pharmacokinetics of entrectinib and its active M5 metabolite in healthy volunteers and patients with solid tumors. Investig. New Drugs 2021, 39, 803–811. [Google Scholar] [CrossRef]
- Naing, A.; Aghajanian, C.; Raymond, E.; Olmos, D.; Schwartz, G.; Oelmann, E.; Grinsted, L.; Burke, W.; Taylor, R.; Kaye, S.; et al. Safety, tolerability, pharmacokinetics and pharmacodynamics of AZD8055 in advanced solid tumours and lymphoma. Br. J. Cancer 2012, 107, 1093–1099. [Google Scholar] [CrossRef] [Green Version]
- Wilson, W.H.; O’Connor, O.A.; Czuczman, M.S.; LaCasce, A.S.; Gerecitano, J.F.; Leonard, J.P.; Tulpule, A.; Dunleavy, K.; Xiong, H.; Chiu, Y.L.; et al. Navitoclax, a targeted high-affinity inhibitor of BCL-2, in lymphoid malignancies: A phase 1 dose-escalation study of safety, pharmacokinetics, pharmacodynamics, and antitumour activity. Lancet Oncol. 2010, 11, 1149–1159. [Google Scholar] [CrossRef] [Green Version]
- Zheng, J.; Xin, Y.; Zhang, J.; Subramanian, R.; Murray, B.P.; Whitney, J.A.; Warr, M.R.; Ling, J.; Moorehead, L.; Kwan, E.; et al. Pharmacokinetics and Disposition of Momelotinib Revealed a Disproportionate Human Metabolite-Resolution for Clinical Development. Drug Metab. Dispos. 2018, 46, 237–247. [Google Scholar] [CrossRef]
- Zhu, X.; Trueman, S.; Straubinger, R.M.; Jusko, W.J. Physiologically-based pharmacokinetic and pharmacodynamic models for gemcitabine and birinapant in pancreatic cancer xenografts. J. Pharmacokinet. Pharmacodyn. 2018, 45, 733–746. [Google Scholar] [CrossRef]
- DeRyckere, D.; Lee-Sherick, A.B.; Huey, M.G.; Hill, A.A.; Tyner, J.W.; Jacobsen, K.M.; Page, L.S.; Kirkpatrick, G.G.; Eryildiz, F.; Montgomery, S.A.; et al. UNC2025, a mertk small-molecule inhibitor, is therapeutically effective alone and in combination with methotrexate in leukemia models. Clin. Cancer Res. 2017, 23, 1481–1492. [Google Scholar] [CrossRef] [Green Version]
- Graham, D.K.; DeRyckere, D.; Davies, K.D.; Earp, H.S. The TAM family: Phosphatidylserine sensing receptor tyrosine kinases gone awry in cancer. Nat. Rev. Cancer 2014, 14, 769–785. [Google Scholar] [CrossRef] [PubMed]
- Schlegel, J.; Sambade, M.J.; Sather, S.; Moschos, S.J.; Tan, A.C.; Winges, A.; DeRyckere, D.; Carson, C.C.; Trembath, D.G.; Tentler, J.J.; et al. MERTK receptor tyrosine kinase is a therapeutic target in melanoma. J. Clin. Investig. 2013, 123, 2257–2267. [Google Scholar] [CrossRef] [PubMed] [Green Version]
- Zhang, S.; Zhang, Y.; Yu, Y.H.; Li, J. Results of multimodal treatment for desmoplastic small round cell tumor of the abdomen and pelvis. Int. J. Clin. Exp. Med. 2015, 8, 9658–9666. [Google Scholar] [PubMed]
- Franzetti, G.A.; Laud-Duval, K.; van der Ent, W.; Brisac, A.; Irondelle, M.; Aubert, S.; Dirksen, U.; Bouvier, C.; de Pinieux, G.; Snaar-Jagalska, E.; et al. Cell-to-cell heterogeneity of EWSR1-FLI1 activity determines proliferation/migration choices in Ewing sarcoma cells. Oncogene 2017, 36, 3505–3514. [Google Scholar] [CrossRef] [PubMed] [Green Version]
- Brandao, L.N.; Winges, A.; Christoph, S.; Sather, S.; Migdall-Wilson, J.; Schlegel, J.; McGranahan, A.; Gao, D.; Liang, X.; Deryckere, D.; et al. Inhibition of MerTK increases chemosensitivity and decreases oncogenic potential in T-cell acute lymphoblastic leukemia. Blood Cancer J. 2013, 3, e101. [Google Scholar] [CrossRef] [Green Version]
- Lee-Sherick, A.B.; Eisenman, K.M.; Sather, S.; McGranahan, A.; Armistead, P.M.; McGary, C.S.; Hunsucker, S.A.; Schlegel, J.; Martinson, H.; Cannon, C.; et al. Aberrant Mer receptor tyrosine kinase expression contributes to leukemogenesis in acute myeloid leukemia. Oncogene 2013, 32, 5359–5368. [Google Scholar] [CrossRef] [Green Version]


Publisher’s Note: MDPI stays neutral with regard to jurisdictional claims in published maps and institutional affiliations. |
© 2021 by the authors. Licensee MDPI, Basel, Switzerland. This article is an open access article distributed under the terms and conditions of the Creative Commons Attribution (CC BY) license (https://creativecommons.org/licenses/by/4.0/).
Share and Cite
Bleijs, M.; Pleijte, C.; Engels, S.; Ringnalda, F.; Meyer-Wentrup, F.; van de Wetering, M.; Clevers, H. EWSR1-WT1 Target Genes and Therapeutic Options Identified in a Novel DSRCT In Vitro Model. Cancers 2021, 13, 6072. https://doi.org/10.3390/cancers13236072
Bleijs M, Pleijte C, Engels S, Ringnalda F, Meyer-Wentrup F, van de Wetering M, Clevers H. EWSR1-WT1 Target Genes and Therapeutic Options Identified in a Novel DSRCT In Vitro Model. Cancers. 2021; 13(23):6072. https://doi.org/10.3390/cancers13236072
Chicago/Turabian StyleBleijs, Margit, Corine Pleijte, Sem Engels, Femke Ringnalda, Friederike Meyer-Wentrup, Marc van de Wetering, and Hans Clevers. 2021. "EWSR1-WT1 Target Genes and Therapeutic Options Identified in a Novel DSRCT In Vitro Model" Cancers 13, no. 23: 6072. https://doi.org/10.3390/cancers13236072