
The Pseudokinase TRIB3 Negatively Regulates the HER2 Receptor Pathway and Is a Biomarker of Good Prognosis in Luminal Breast Cancer

 , , , , , and
Abstract
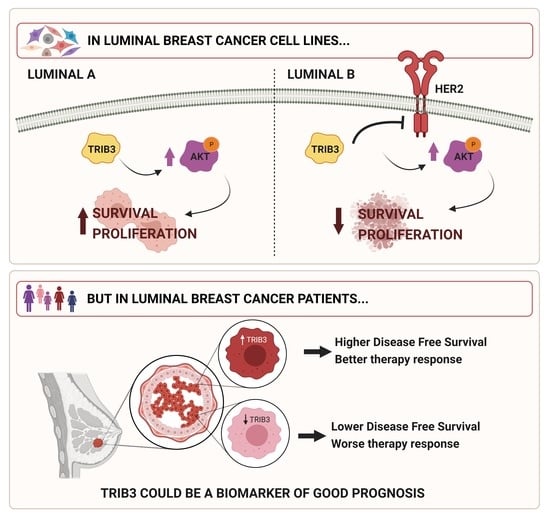
:Simple Summary
Abstract
1. Introduction
2. Materials and Methods
2.1. Cell Cultures and Plasmid Transduction
2.2. Cell Viability Assays
2.3. RT-PCR Analysis
2.4. Western Blot
2.5. Cytosolic and Nuclear Fractionation
2.6. Immunostaining and Microscopy
2.7. Immunoprecipitation
2.8. Tissue Microarrays (TMAs)
2.9. Immunohistological Analysis
2.10. Statistical Analyses
3. Results
3.1. TRIB3 Plays an Opposite Role in the Proliferation of Luminal A and B Breast Cancer Cell Lines
3.2. TRIB3 Regulates Differently the AKT Pathway in Luminal A and B BC Cell Lines
3.3. TRIB3 and HER2 Are Functionally Associated in Luminal B BC Cell Lines
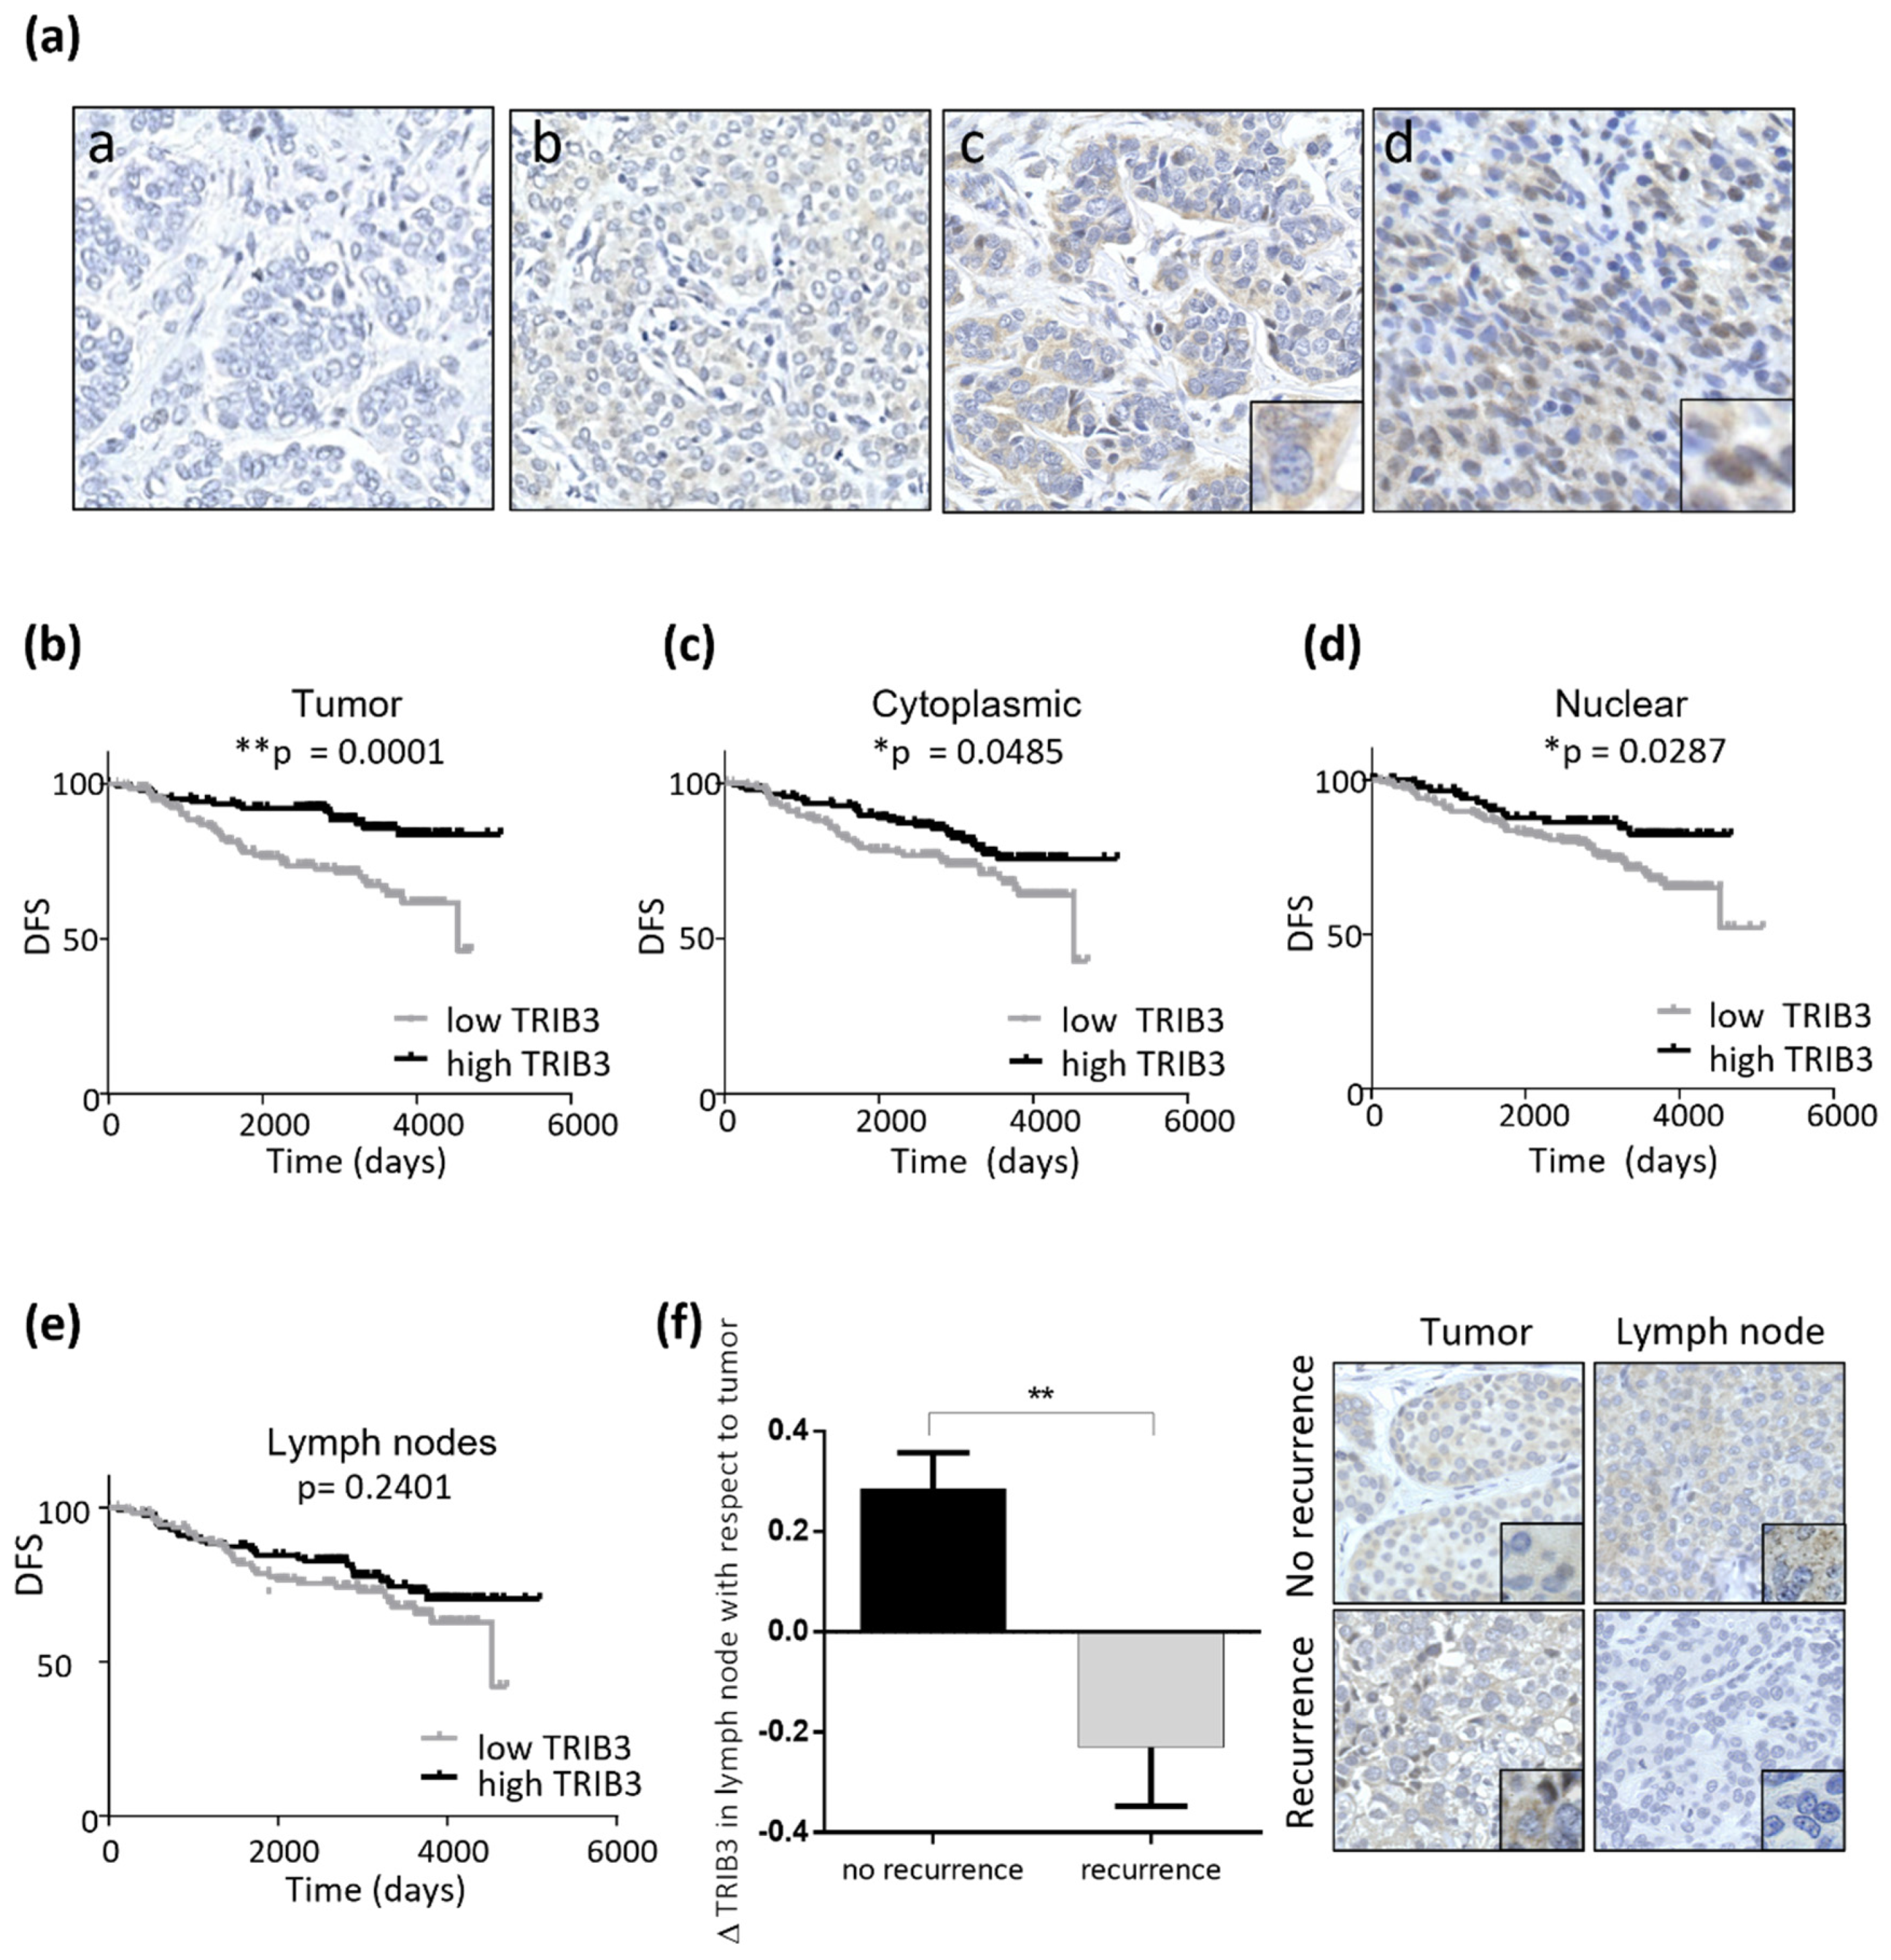
3.4. Analysis of TRIB3 Protein Levels in a Wide Cohort of Breast Cancer Patients Unravels Its Potential Role as a Biomarker of Good Prognosis in Luminal BC
3.5. TRIB3 Expression Is Associated to a Better Response to Therapy in Luminal BC
4. Discussion
5. Conclusions
Supplementary Materials
Author Contributions
Funding
Institutional Review Board Statement
Informed Consent Statement
Data Availability Statement
Acknowledgments
Conflicts of Interest
References
- Bray, F.; Ferlay, J.; Soerjomataram, I.; Siegel, R.L.; Torre, L.A.; Jemal, A. Global cancer statistics 2018: GLOBOCAN estimates of incidence and mortality worldwide for 36 cancers in 185 countries. CA Cancer J. Clin. 2018, 68, 394–424. [Google Scholar] [CrossRef] [Green Version]
- Harbeck, N.; Gnant, M. Breast cancer. Lancet 2017, 389, 1134–1150. [Google Scholar] [CrossRef]
- Malhotra, G.K.; Zhao, X.; Band, H.; Band, V. Histological, molecular and functional subtypes of breast cancers. Cancer Biol. Ther. 2010, 10, 955–960. [Google Scholar] [CrossRef] [Green Version]
- Provenzano, E.; Ulaner, G.A.; Chin, S.-F. Molecular classification of breast cancer. PET Clin. 2018, 13, 325–338. [Google Scholar] [CrossRef]
- Goldhirsch, A.; Wood, W.C.; Coates, A.S.; Gelber, R.D.; Thurlimann, B.; Senn, H.J. Strategies for subtypes—Dealing with the diversity of breast cancer: Highlights of the St. Gallen International Expert Consensus on the primary therapy of early breast cancer 2011. Ann. Oncol. 2011, 22, 1736–1747. [Google Scholar] [CrossRef] [PubMed]
- Gao, J.J.; Swain, S.M. Luminal A breast cancer and molecular assays: A review. Oncologist 2018, 23, 556–565. [Google Scholar] [CrossRef] [Green Version]
- Patel, R.R.; Sharma, C.G.N.; Jordan, V.C. Optimizing the antihormonal treatment and prevention of breast cancer. Breast Cancer 2007, 14, 113–122. [Google Scholar] [CrossRef]
- Loi, S.; Sotiriou, C.; Haibe-Kains, B.; Lallemand, F.; Conus, N.M.; Piccart, M.J.; Speed, T.P.; McArthur, A.G. Gene expression profiling identifies activated growth factor signaling in poor prognosis (Luminal-B) estrogen receptor positive breast cancer. BMC Med. Genom. 2009, 2, 37. [Google Scholar] [CrossRef] [Green Version]
- Creighton, C.J. The molecular profile of luminal B breast cancer. Biol. Targets Ther. 2012, 6, 289–297. [Google Scholar] [CrossRef] [Green Version]
- Dey, N.; Aske, J.; De, P. Targeted neoadjuvant therapies in HR+/HER2−breast cancers: Challenges for improving pCR. Cancers 2021, 13, 458. [Google Scholar] [CrossRef]
- Yao, J.; Deng, K.; Huang, J.; Zeng, R.; Zuo, J. Progress in the understanding of the mechanism of tamoxifen resistance in breast cancer. Front. Pharmacol. 2020, 11, 11. [Google Scholar] [CrossRef]
- Großhans, J.; Wieschaus, E. A genetic link between morphogenesis and cell division during formation of the ventral furrow in drosophila. Cell 2000, 101, 523–531. [Google Scholar] [CrossRef] [Green Version]
- Mata, J.; Curado, S.; Ephrussi, A.; Rørth, P. Tribbles coordinates mitosis and morphogenesis in drosophila by regulating string/CDC25 proteolysis. Cell 2000, 101, 511–522. [Google Scholar] [CrossRef] [Green Version]
- Kiss-Toth, E.; Velasco, G.; Pear, W.S. Tribbles at the cross-road. Biochem. Soc. Trans. 2015, 43, 1049–1050. [Google Scholar] [CrossRef]
- Kiss-Toth, E. Tribbles: ‘Puzzling’ regulators of cell signalling. Biochem. Soc Trans. 2011, 39, 684–687. [Google Scholar] [CrossRef] [PubMed]
- Salazar, M.; Lorente, M.; Orea-Soufi, A.; Dávila, D.; Erazo, T.; Lizcano, J.M.; Carracedo, A.; Kiss-Toth, E.; Velasco, G. Oncosuppressive functions of tribbles pseudokinase 3. Biochem. Soc. Trans. 2015, 43, 1122–1126. [Google Scholar] [CrossRef] [PubMed]
- Ord, T.; Ord, T. Mammalian pseudokinase TRIB3 in normal physiology and disease: Charting the progress in old and new avenues. Current Protein Peptide Sci. 2017, 18, 819–842. [Google Scholar] [CrossRef]
- Hua, F.; Li, K.; Yu, J.-J.; Lv, X.; Yan, J.; Zhang, X.-W.; Sun, W.; Lin, H.; Shang, S.; Wang, F.; et al. TRB3 links insulin/IGF to tumour promotion by interacting with p62 and impeding autophagic/proteasomal degradations. Nat. Commun. 2015, 6, 7951. [Google Scholar] [CrossRef] [Green Version]
- Hua, F.; Mu, R.; Liu, J.; Xue, J.; Wang, Z.; Lin, H.; Yang, H.; Chen, X.; Hu, Z. TRB3 interacts with SMAD3 promoting tumor cell migration and invasion. J. Cell Sci. 2011, 124, 3235–3246. [Google Scholar] [CrossRef] [Green Version]
- Tang, Z.; Chen, H.; Zhong, D.; Wei, W.; Liu, L.; Duan, Q.; Han, B.; Li, G. TRIB3 facilitates glioblastoma progression via restraining autophagy. Aging 2020, 12, 25020–25034. [Google Scholar] [CrossRef]
- Xing, Y.; Luo, P.; Hu, R.; Wang, D.; Zhou, G.; Jiang, J. TRIB3 promotes lung adenocarcinoma progression via an enhanced warburg effect. Cancer Manag. Res. 2020, 12, 13195–13206. [Google Scholar] [CrossRef]
- Yu, J.J.; Zhou, D.D.; Yang, X.X.; Cui, B.; Tan, F.W.; Wang, J.; Li, K.; Shang, S.; Zhang, C.; Lv, X.X.; et al. TRIB3-EGFR interaction promotes lung cancer progression and defines a therapeutic target. Nat. Commun. 2020, 11, 3660. [Google Scholar] [CrossRef]
- Zhang, X.; Zhong, N.; Li, X.; Chen, M.-B. TRIB3 promotes lung cancer progression by activating β-catenin signaling. Eur. J. Pharmacol. 2019, 863, 172697. [Google Scholar] [CrossRef]
- Zhou, H.; Luo, Y.; Chen, J.-H.; Hu, J.; Luo, Y.-Z.; Wang, W.; Zeng, Y.; Xiao, L. Knockdown of TRB3 induces apoptosis in human lung adenocarcinoma cells through regulation of Notch 1 expression. Mol. Med. Rep. 2013, 8, 47–52. [Google Scholar] [CrossRef] [Green Version]
- Aynaud, M.-M.; Suspène, R.; Vidalain, P.-O.; Mussil, B.; Guétard, D.; Tangy, F.; Wain-Hobson, S.; Vartanian, J.-P. Human tribbles 3 protects nuclear DNA from cytidine deamination by APOBEC3A. J. Biol. Chem. 2012, 287, 39182–39192. [Google Scholar] [CrossRef] [Green Version]
- Duggan, S.P.; Behan, F.M.; Kirca, M.; Smith, S.; Reynolds, J.V.; Long, A.; Kelleher, D. An integrative genomic approach in oesophageal cells identifies TRB3 as a bile acid responsive gene, downregulated in Barrett′s oesophagus, which regulates NF-κB activation and cytokine levels. Carcinogenesis 2010, 31, 936–945. [Google Scholar] [CrossRef] [Green Version]
- Qu, J.; Liu, B.; Li, B.; Du, G.; Li, Y.; Wang, J.; He, L.; Wan, X. TRIB3 suppresses proliferation and invasion and promotes apoptosis of endometrial cancer cells by regulating the AKT signaling pathway. OncoTargets Ther. 2019, 12, 2235–2245. [Google Scholar] [CrossRef] [Green Version]
- Roh, J.I.; Lee, J.; Sung, Y.H.; Oh, J.; Kim, Y.; Lee, S.; Devkota, S.; Kim, H.J.; Park, B.; Nam, T.; et al. Impaired AKT signaling and lung tu-morigenesis by PIERCE1 ablation in KRAS-mutant non-small cell lung cancer. Oncogenesis 2020, 39, 5876–5887. [Google Scholar] [CrossRef]
- Salazar, M.; Lorente, M.; García-Taboada, E.; Gómez, E.P.; Dávila, D.; Zúñiga-García, P.; Flores, J.M.; Rodríguez, A.; Hegedus, Z.; Mosén-Ansorena, D.; et al. Loss of tribbles pseudokinase-3 promotes Akt-driven tumorigenesis via FOXO inactivation. Cell Death Differ. 2014, 22, 131–144. [Google Scholar] [CrossRef] [Green Version]
- Su, J.; Yan, Y.; Qu, J.; Xue, X.; Liu, Z.; Cai, H. Emodin induces apoptosis of lung cancer cells through ER stress and the TRIB3/NF-κB pathway. Oncol. Rep. 2017, 37, 1565–1572. [Google Scholar] [CrossRef] [Green Version]
- Wennemers, M.; Bussink, J.; Scheijen, B.; Nagtegaal, I.D.; Van Laarhoven, H.W.; Raleigh, J.A.; Varia, M.A.; Heuvel, J.J.; Rouschop, K.M.; Sweep, F.C.; et al. Tribbles homolog 3 denotes a poor prognosis in breast cancer and is involved in hypoxia response. Breast Cancer Res. 2011, 13, R82. [Google Scholar] [CrossRef] [PubMed] [Green Version]
- Wennemers, M.; Bussink, J.; Grebenchtchikov, N.; Sweep, F.; Span, P. TRIB3 protein denotes a good prognosis in breast cancer patients and is associated with hypoxia sensitivity. Radiother. Oncol. 2011, 101, 198–202. [Google Scholar] [CrossRef] [PubMed] [Green Version]
- Lee, Y.-C.; Wang, W.-L.; Chang, W.-C.; Huang, Y.-H.; Hong, G.-C.; Wang, H.-L.; Chou, Y.-H.; Tseng, H.-C.; Lee, H.-T.; Li, S.-T.; et al. Tribbles homolog 3 involved in radiation response of triple negative breast cancer cells by regulating Notch1 activation. Cancers 2019, 11, 127. [Google Scholar] [CrossRef] [PubMed] [Green Version]
- Yu, J.M.; Sun, W.; Wang, Z.H.; Liang, X.; Hua, F.; Li, K.; Lv, X.X.; Zhang, X.W.; Liu, Y.Y.; Yu, J.J.; et al. TRIB3 supports breast cancer stemness by suppressing FOXO1 degradation and enhancing SOX2 transcription. Nat. Commun. 2019, 10, 5720. [Google Scholar] [CrossRef] [PubMed] [Green Version]
- Russnes, H.G.; Lingjaerde, O.C.; Borresen-Dale, A.L.; Caldas, C. Breast cancer molecular stratification: From intrinsic subtypes to integrative clusters. Am. J. Pathol. 2017, 187, 2152–2162. [Google Scholar] [CrossRef] [PubMed]
- Ciruelos Gil, E.M. Targeting the PI3K/AKT/mTOR pathway in estrogen receptor-positive breast cancer. Cancer Treat. Rev. 2014, 40, 862–871. [Google Scholar] [CrossRef] [PubMed]
- Lu, X.; Lu, X.; Wang, Z.C.; Iglehart, J.D.; Zhang, X.; Richardson, A.L. Predicting features of breast cancer with gene expression patterns. Breast Cancer Res. Treat. 2007, 108, 191–201. [Google Scholar] [CrossRef] [PubMed]
- Cortazar, A.R.; Torrano, V.; Martín-Martín, N.; Caro-Maldonado, A.; Camacho, L.; Hermanova, I.; Guruceaga, E.; Lorenzo-Martín, L.F.; Caloto, R.; Gomis, R.R.; et al. CANCERTOOL: A visualization and representation interface to exploit cancer datasets. Cancer Res. 2018, 78, 6320–6328. [Google Scholar] [CrossRef] [PubMed] [Green Version]
- Curtis, C.; Shah, S.P.; Chin, S.-F.; Turashvili, G.; Palacio, O.R.; Dunning, M.; Speed, D.; Lynch, A.; Samarajiwa, S.; Yuan, Y.; et al. The genomic and transcriptomic architecture of 2000 breast tumours reveals novel subgroups. Nature 2020, 486, 346–352. [Google Scholar] [CrossRef] [PubMed]
- Ivshina, A.V.; George, J.; Senko, O.; Mow, B.; Putti, T.C.; Smeds, J.; Lindahl, T.; Pawitan, Y.; Hall, P.; Nordgren, H.; et al. Genetic reclassification of histologic grade delineates new clinical subtypes of breast cancer. Cancer Res. 2006, 66, 10292–10301. [Google Scholar] [CrossRef] [PubMed] [Green Version]
- Wang, Y.; Klijn, J.G.; Zhang, Y.; Sieuwerts, A.M.; Look, M.P.; Yang, F.; Talantov, D.; Timmermans, M.; Meijer-van Gelder, M.E.; Yu, J.; et al. Gene-expression profiles to predict distant metastasis of lymph-node-negative primary breast cancer. Lancet 2005, 365, 671–679. [Google Scholar] [CrossRef]
- Guan, H.; Shuaib, A.; De Leon, D.D.; Angyal, A.; Salazar, M.; Velasco, G.; Holcombe, M.; Dower, S.K.; Kiss-Toth, E. Competition between members of the tribbles pseudokinase protein family shapes their interactions with mitogen activated protein kinase pathways. Sci. Rep. 2016, 6, 32667. [Google Scholar] [CrossRef] [Green Version]
- Fekete, J.T.; Győrffy, B. ROCplot.org: Validating predictive biomarkers of chemotherapy/hormonal therapy/anti-HER2 therapy using transcriptomic data of 3104 breast cancer patients. Int. J. Cancer 2019, 145, 3140–3151. [Google Scholar] [CrossRef]
- Qi, L.; Heredia, J.E.; Altarejos, J.Y.; Screaton, R.; Goebel, N.; Niessen, S.; MacLeod, I.X.; Liew, C.W.; Kulkarni, R.N.; Bain, J.; et al. TRB3 links the E3 ubiquitin ligase COP1 to lipid metabolism. Science 2006, 312, 1763–1766. [Google Scholar] [CrossRef]
- Cheng, J.; Liang, M.; Carvalho, M.F.; Tigue, N.; Faggioni, R.; Roskos, L.K.; Vainshtein, I. Molecular mechanism of HER2 rapid internalization and redirected trafficking induced by Anti-HER2 biparatopic antibody. Antibodies 2020, 9, 49. [Google Scholar] [CrossRef]
- Citri, A.; Alroy, I.; Lavi, S.; Rubin, C.; Xu, W.; Grammatikakis, N.; Patterson, C.; Neckers, L.; Fry, D.W.; Yarden, Y. Drug-induced ubiquitylation and degradation of ErbB receptor tyrosine kinases: Implications for cancer therapy. EMBO J. 2002, 21, 2407–2417. [Google Scholar] [CrossRef] [Green Version]
- Li, B.T.; Michelini, F.; Misale, S.; Cocco, E.; Baldino, L.; Cai, Y.; Shifman, S.; Tu, H.-Y.; Myers, M.L.; Xu, C.; et al. HER2-mediated internalization of cytotoxic agents in ERBB2 amplified or mutant lung cancers. Cancer Discov. 2020, 10, 674–687. [Google Scholar] [CrossRef] [PubMed] [Green Version]
- Liu, X.; Zhao, J.; Liu, Q.; Xiong, X.; Zhang, Z.; Jiao, Y.; Li, X.; Liu, B.; Li, Y.; Lu, Y. MicroRNA-124 promotes hepatic triglyceride accumulation through targeting tribbles homolog 3. Sci. Rep. 2016, 6, 37170. [Google Scholar] [CrossRef] [Green Version]
- Wennemers, M.; Bussink, J.; Beucken, T.V.D.; Sweep, F.C.G.J.; Span, P.N. Regulation of TRIB3 mRNA and protein in breast cancer. PLoS ONE 2012, 7, e49439. [Google Scholar] [CrossRef]
- Carracedo, A.; Lorente, M.; Egia, A.; Blázquez, C.; García, S.; Giroux, V.; Malicet, C.; Villuendas, R.; Gironella, M.; González-Feria, L.; et al. The stress-regulated protein p8 mediates cannabinoid-induced apoptosis of tumor cells. Cancer Cell 2006, 9, 301–312. [Google Scholar] [CrossRef] [PubMed] [Green Version]
- Salazar, M.; Carracedo, A.; Salanueva Íñigo, J.; Hernández-Tiedra, S.; Lorente, M.; Egia, A.; Vázquez, P.; Blázquez, C.; Torres, S.; García, S.; et al. Cannabinoid action induces autophagy-mediated cell death through stimulation of ER stress in human glioma cells. J. Clin. Investig. 2009, 119, 1359–1372. [Google Scholar] [CrossRef] [PubMed] [Green Version]
- Salazar, M.; Lorente, M.; García-Taboada, E.; Hernández-Tiedra, S.; Davila, D.; Francis, S.E.; Guzmán, M.; Kiss-Toth, E.; Velasco, G. The pseudokinase tribbles homologue-3 plays a crucial role in cannabinoid anticancer action. Biochim. Biophys. Acta BBA Mol. Cell Biol. Lipids 2013, 1831, 1573–1578. [Google Scholar] [CrossRef] [PubMed]
- Erazo, T.; Lorente, M.; López-Plana, A.; Muñoz-Guardiola, P.; Fernández-Nogueira, P.; García-Martínez, J.A.; Bragado, P.; Fuster, G.; Salazar, M.; Espadaler, J.; et al. The new antitumor drug ABTL0812 inhibits the Akt/mTORC1 axis by upregulating tribbles-3 pseudokinase. Clin. Cancer Res. 2016, 22, 2508–2519. [Google Scholar] [CrossRef] [PubMed] [Green Version]


Publisher’s Note: MDPI stays neutral with regard to jurisdictional claims in published maps and institutional affiliations. |
© 2021 by the authors. Licensee MDPI, Basel, Switzerland. This article is an open access article distributed under the terms and conditions of the Creative Commons Attribution (CC BY) license (https://creativecommons.org/licenses/by/4.0/).
Share and Cite
Orea-Soufi, A.; Castillo-Lluva, S.; Salvador-Tormo, N.; Martín-Cabrera, P.; Recuero, S.; Gabicagogeascoa, E.; Moreno-Valladares, M.; Mendiburu-Eliçabe, M.; Blanco-Gómez, A.; Ramos-Pittol, J.M.; et al. The Pseudokinase TRIB3 Negatively Regulates the HER2 Receptor Pathway and Is a Biomarker of Good Prognosis in Luminal Breast Cancer. Cancers 2021, 13, 5307. https://doi.org/10.3390/cancers13215307
Orea-Soufi A, Castillo-Lluva S, Salvador-Tormo N, Martín-Cabrera P, Recuero S, Gabicagogeascoa E, Moreno-Valladares M, Mendiburu-Eliçabe M, Blanco-Gómez A, Ramos-Pittol JM, et al. The Pseudokinase TRIB3 Negatively Regulates the HER2 Receptor Pathway and Is a Biomarker of Good Prognosis in Luminal Breast Cancer. Cancers. 2021; 13(21):5307. https://doi.org/10.3390/cancers13215307
Chicago/Turabian StyleOrea-Soufi, Alba, Sonia Castillo-Lluva, Nélida Salvador-Tormo, Paola Martín-Cabrera, Silvia Recuero, Estíbaliz Gabicagogeascoa, Manuel Moreno-Valladares, Marina Mendiburu-Eliçabe, Adrián Blanco-Gómez, José Miguel Ramos-Pittol, and et al. 2021. "The Pseudokinase TRIB3 Negatively Regulates the HER2 Receptor Pathway and Is a Biomarker of Good Prognosis in Luminal Breast Cancer" Cancers 13, no. 21: 5307. https://doi.org/10.3390/cancers13215307