
Prognostic Role of Preoperative Sarcopenia Evaluation of Cervical Muscles with Long-Term Outcomes of Patients with Oral Squamous Cell Carcinoma

 , ,
, ,
Abstract
:Simple Summary
Abstract
1. Introduction
2. Materials and Methods
2.1. Patients
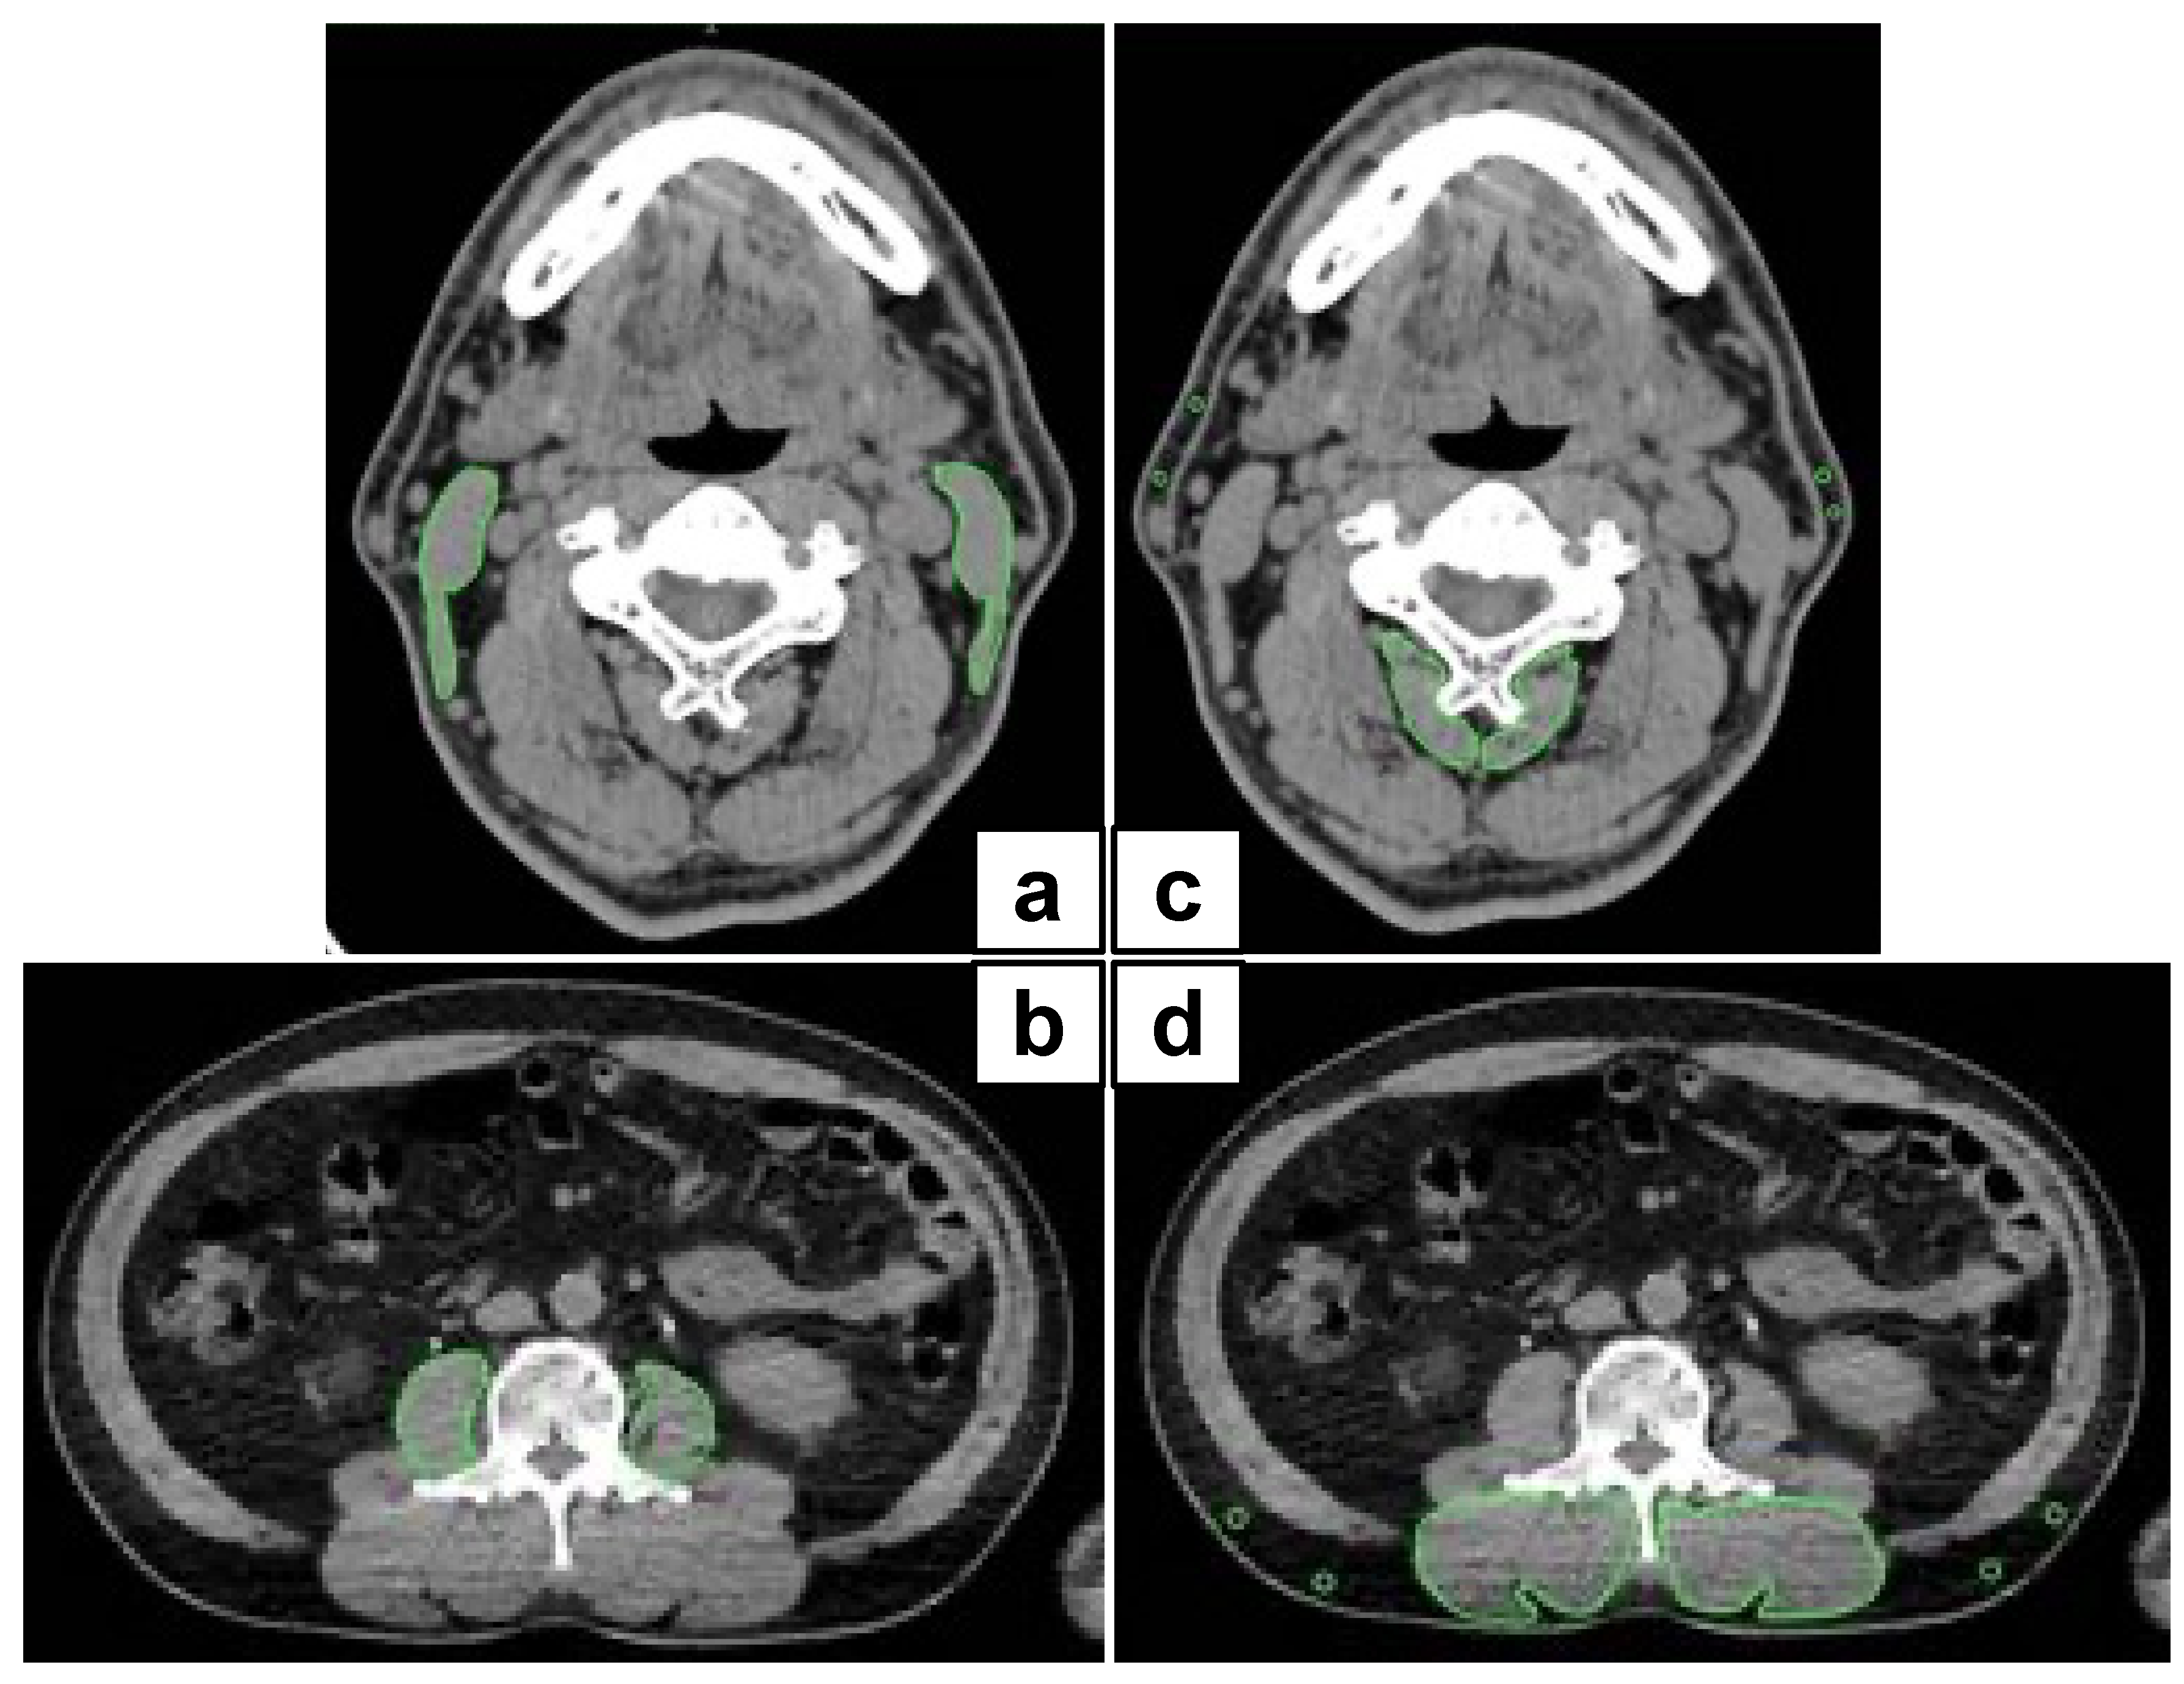
2.2. Image Analysis
2.3. Cutoff Values for SCMI and P-IMAC
2.4. Parameter Analysis
2.5. Statistical Analysis
3. Results
3.1. Patient Characteristics
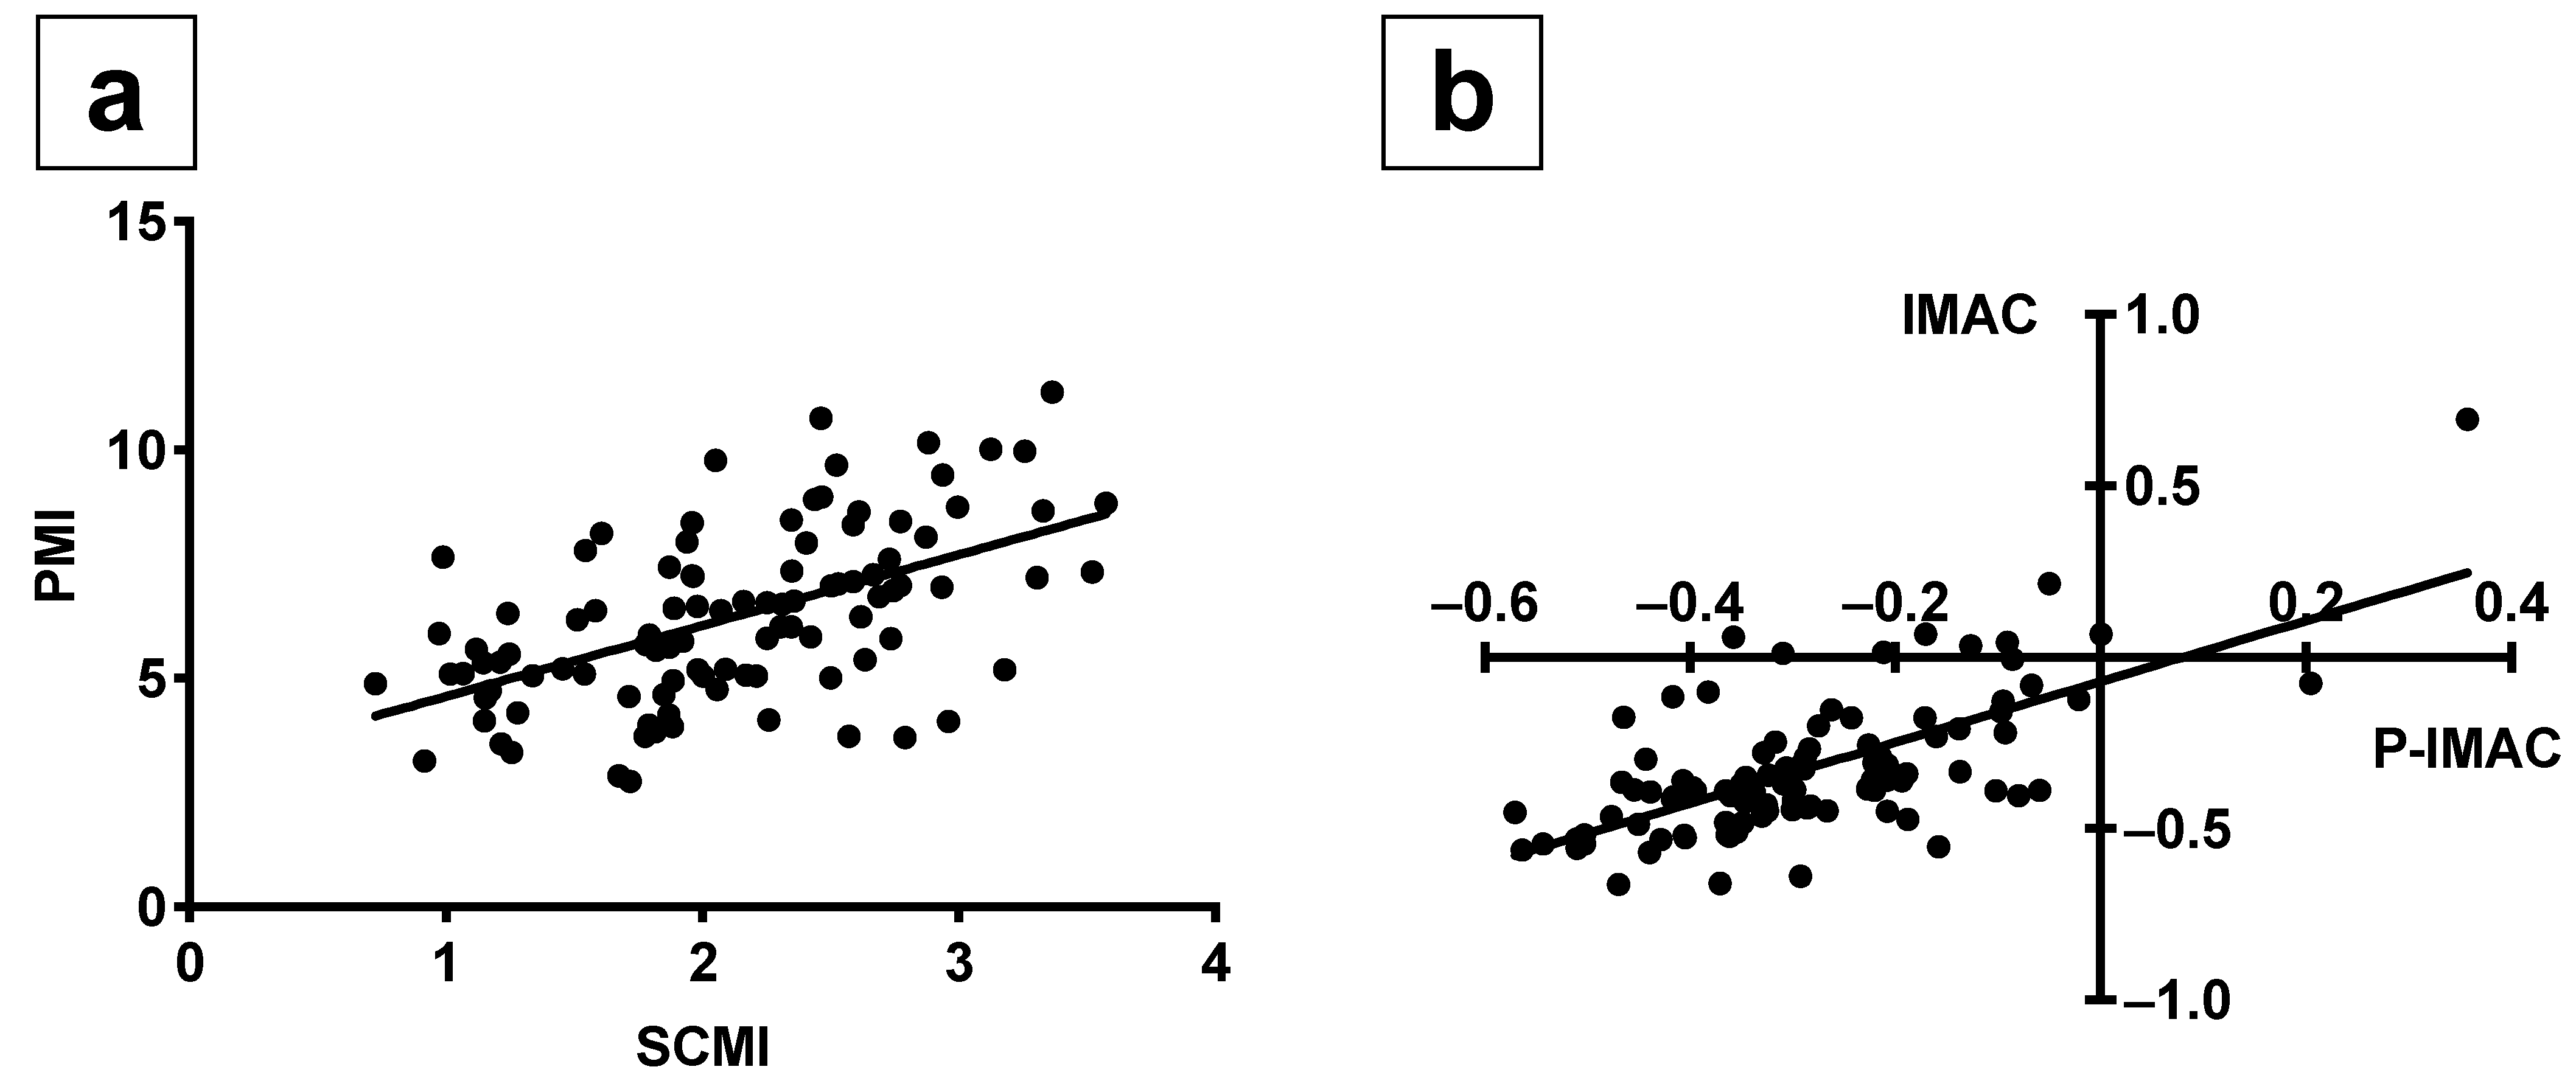
3.2. The Correlations between SCMI and PMI, as well as P-IMAC and IMAC
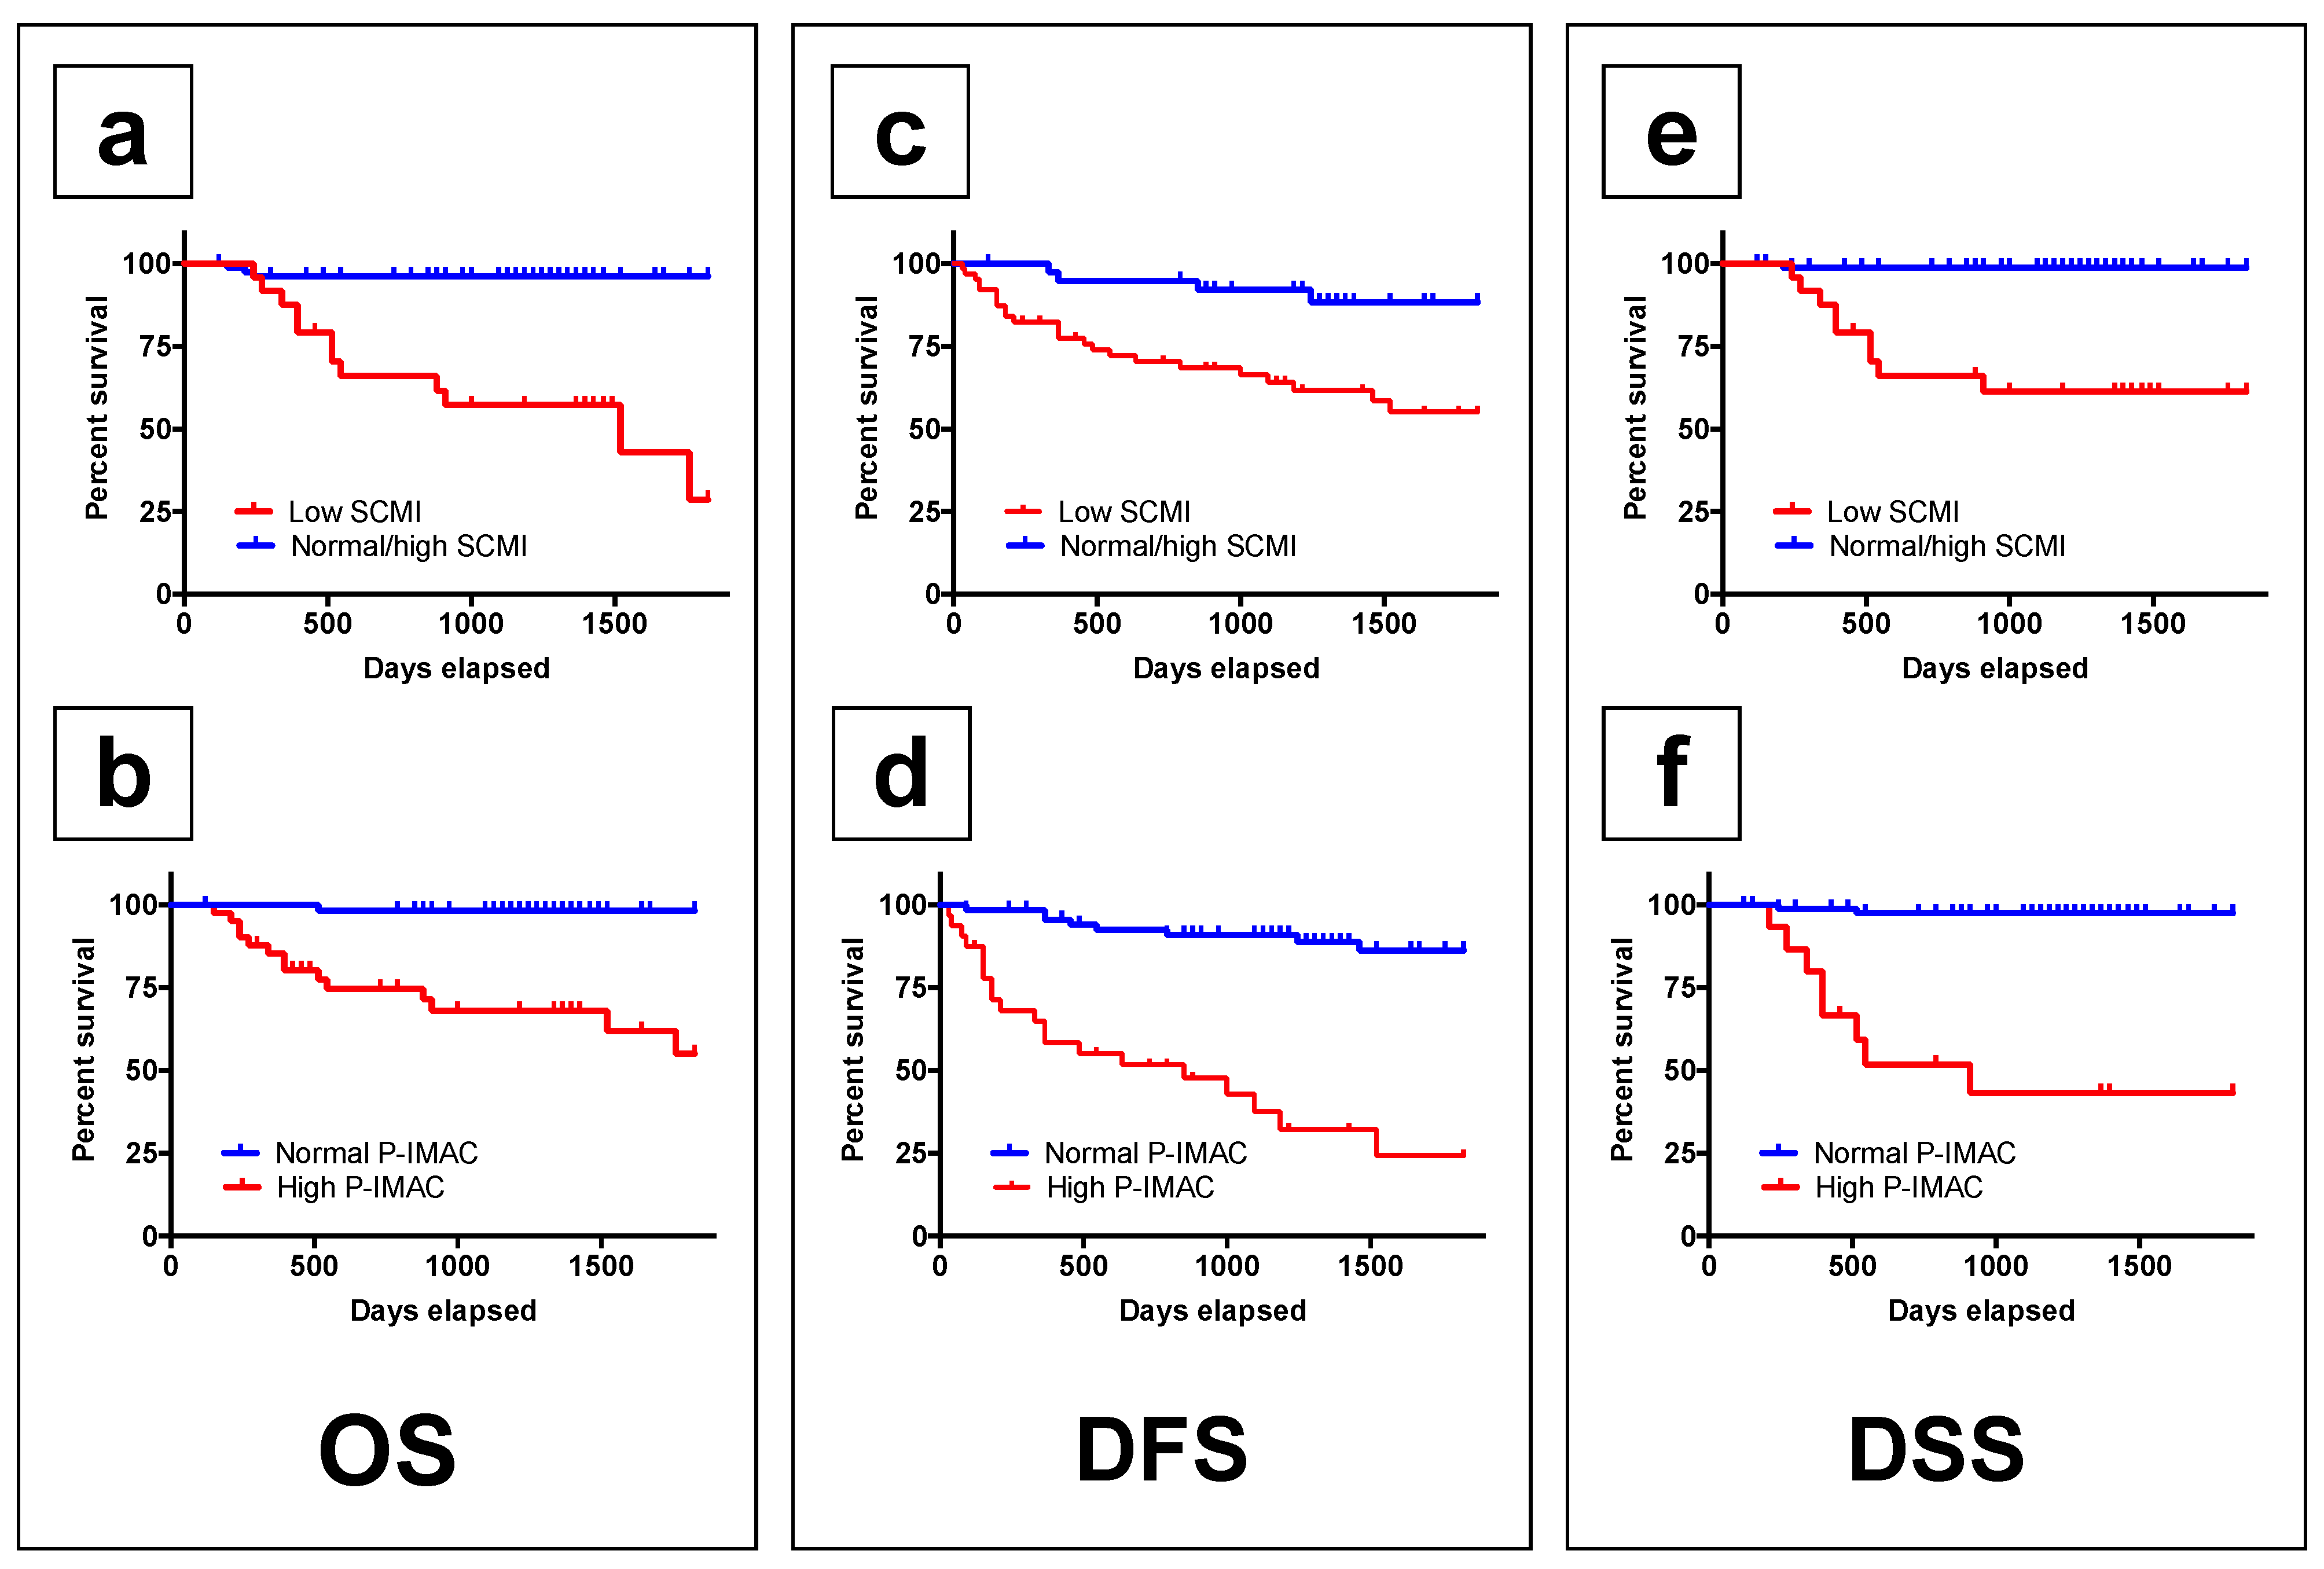
3.3. The Survival Rates According to Preoperative SCMI and P-IMAC
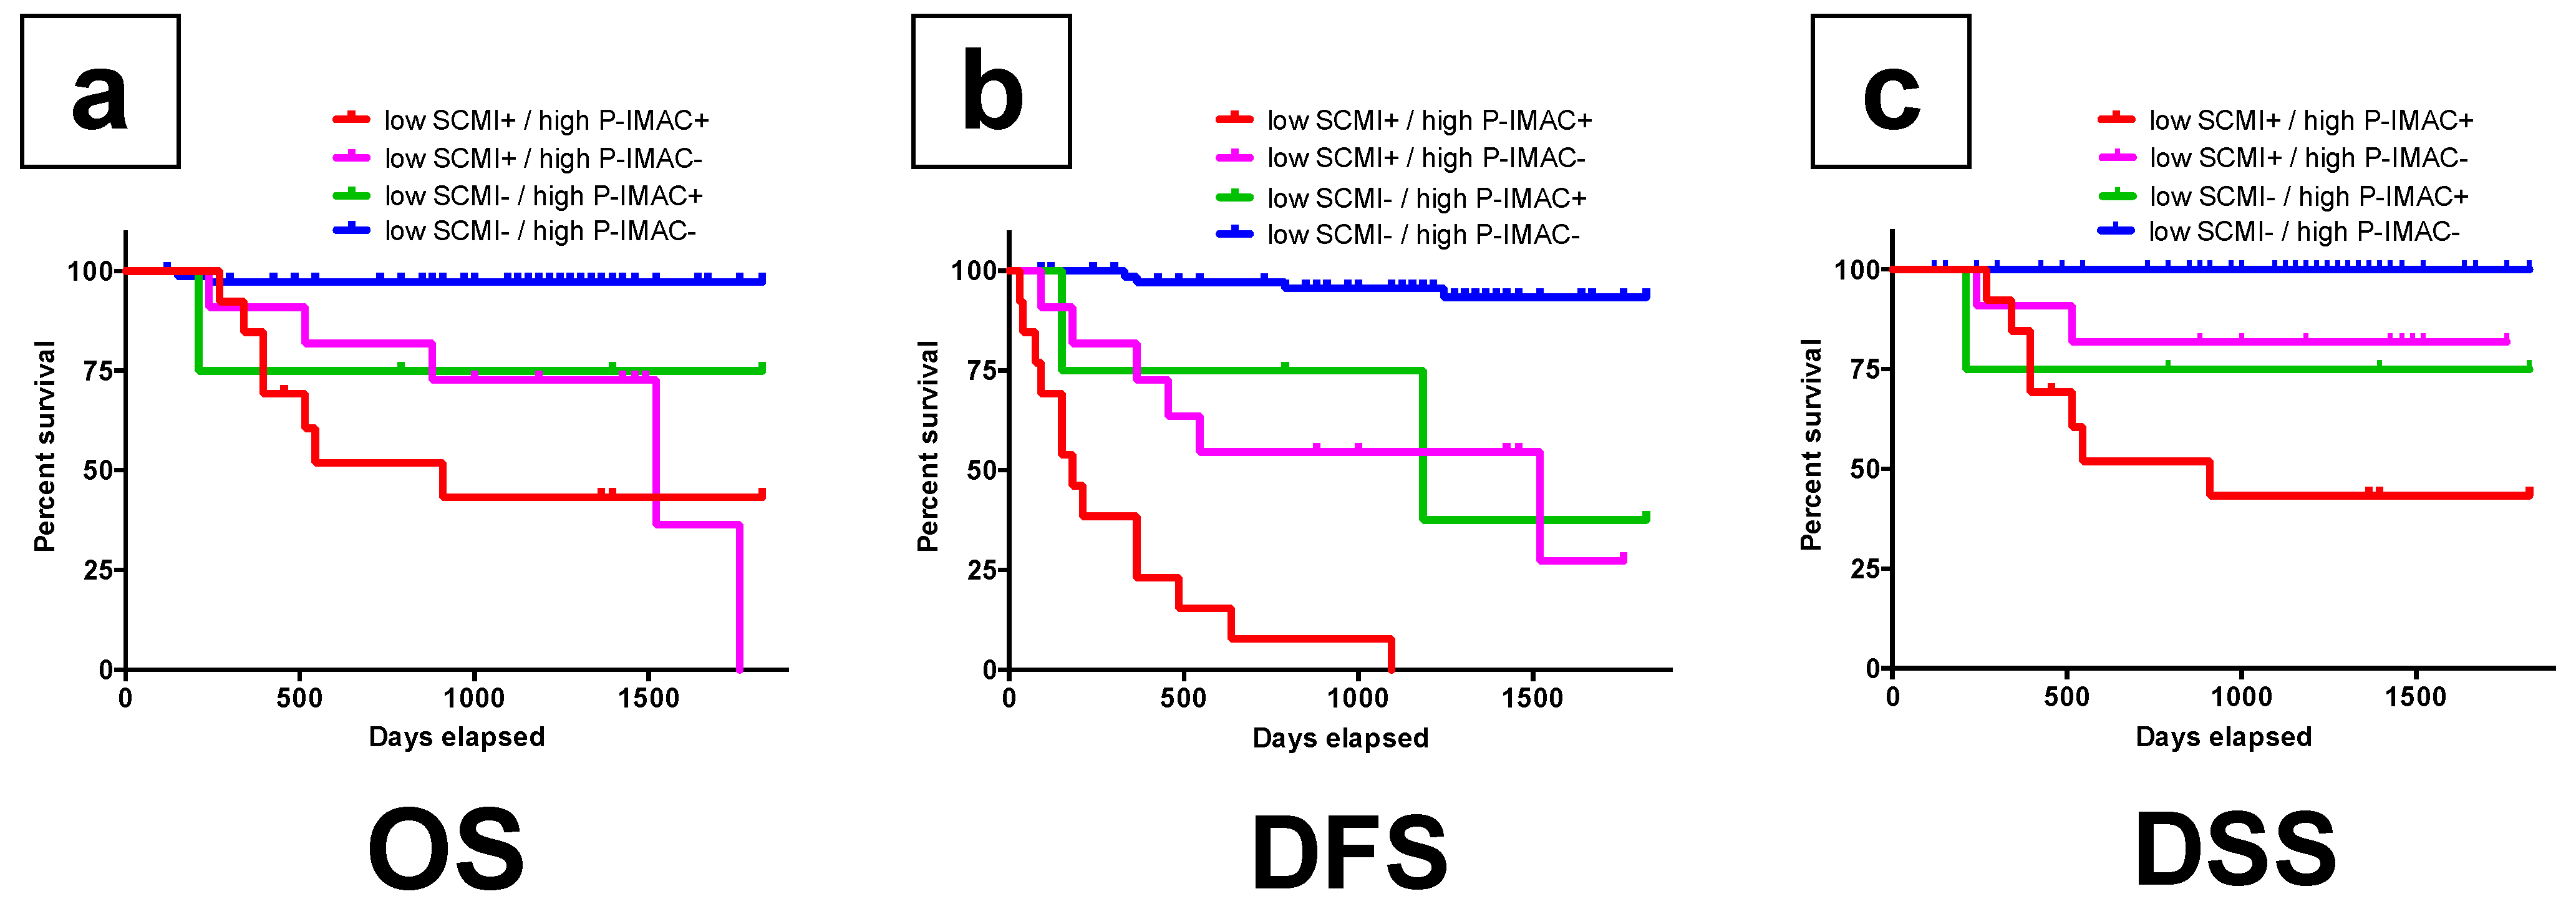
3.4. The Survival Rates According to the Combination of Preoperative SCMI and P-IMAC for Trend
3.5. A Cox Proportional Hazards Regression Model for Survival Rates
4. Discussion
5. Conclusions
Author Contributions
Funding
Institutional Review Board Statement
Informed Consent Statement
Data Availability Statement
Conflicts of Interest
Abbreviations
| AJCC | American Joint Committee on Cancer |
| AUC | Area under the curve |
| C3 | Third cervical vertebra |
| CI | Confidence interval |
| CSA | Cross-sectional area |
| CT | Computed tomography |
| DEXA | Dual energy X-ray absorptiometry |
| DFS | Disease-free survival |
| DSS | Disease-specific survival |
| EWGSOP2 | European Working Group on Sarcopenia in Older People 2 |
| FDG PET/CT | 18F-fluorodeoxyglucose positron emission tomography/computed tomography |
| HR | Hazard ratio |
| IMAC | Intramuscular adipose tissue content |
| L3 | Third lumbar vertebra |
| M-SMI | Masticatory-skeletal muscle index |
| MM/F | Multifidus muscle/fat |
| MRI | Magnetic resonance imaging |
| OS | Overall survival |
| OSCC | Oral squamous cell carcinoma |
| P-IMAC | Processus spinosus muscle—intramuscular adipose tissue content |
| PMI | Psoas muscle mass index |
| ROC | Receiver operating characteristic |
| ROI | Region of interest |
| SCMI | Sternocleidomastoid muscle mass index |
References
- Siegel, R.L.; Miller, K.D.; Fuchs, H.E.; Jemal, A. Cancer statistics, 2021. CA Cancer J. Clin. 2021, 71, 7–33. [Google Scholar] [CrossRef] [PubMed]
- Pressoir, M.; Desné, S.; Berchery, D.; Rossignol, G.; Poiree, B.; Meslier, M.; Traversier, S.; Vittot, M.; Simon, M.; Gekiere, J.P.; et al. Prevalence, risk factors and clinical implications of malnutrition in french comprehensive cancer centres. Br. J. Cancer 2010, 102, 966–971. [Google Scholar] [CrossRef] [Green Version]
- Swartz, J.E.; Pothen, A.J.; Wegner, I.; Smid, E.J.; Swart, K.M.A.; de Bree, R.; Leenen, L.P.H.; Grolman, W. Feasibility of using head and neck CT imaging to assess skeletal muscle mass in head and neck cancer patients. Oral Oncol. 2016, 62, 28–33. [Google Scholar] [CrossRef]
- Kitajima, Y.; Hyogo, H.; Sumida, Y.; Eguchi, Y.; Ono, N.; Kuwashiro, T.; Tanaka, K.; Takahashi, H.; Mizuta, T.; Ozaki, I.; et al. Severity of non-alcoholic steatohepatitis is associated with substitution of adipose tissue in skeletal muscle. J. Gastroenterol. Hepatol. 2013, 28, 1507–1514. [Google Scholar] [CrossRef]
- Hamaguchi, Y.; Kaido, T.; Okumura, S.; Kobayashi, A.; Hammad, A.; Tamai, Y.; Inagaki, N.; Uemoto, S. Proposal for new diagnostic criteria for low skeletal muscle mass based on computed tomography imaging in Asian adults. Nutrition 2016, 32, 1200–1205. [Google Scholar] [CrossRef]
- Baker, S.; Strauss, B.; Prendergast, L.; Panagiotopoulos, S.; Thomas, G.; Vu, T.; Proietto, J.; Jerums, G. Estimating dual-energy X-ray absorptiometry-derived total body skeletal muscle mass using single-slice abdominal magnetic resonance imaging in obese subjects with and without diabetes: A pilot study. Eur. J. Clin. Nutr. 2012, 66, 628–632. [Google Scholar] [CrossRef] [Green Version]
- Kim, J.; Wang, Z.; Heymsfield, S.B.; Baumgartner, R.N.; Gallagher, D. Total-body skeletal muscle mass: Estimation by a new dual-energy X-ray absorptiometry method. Am. J. Clin. Nutr. 2002, 76, 378–389. [Google Scholar] [CrossRef] [Green Version]
- Mourtzakis, M.; Prado, C.M.M.; Lieffers, J.R.; Reiman, T.; McCargar, L.J.; Baracos, V.E. A practical and precise approach to quantification of body composition in cancer patients using computed tomography images acquired during routine care. Appl. Physiol. Nutr. Metab. 2008, 33, 997–1006. [Google Scholar] [CrossRef]
- Leenders, M.; Verdijk, L.B.; van der Hoeven, L.; van Kranenburg, J.; Nilwik, R.; van Loon, L.J.C. Elderly men and women benefit equally from prolonged resistance-type exercise training. J. Gerontol. Ser. A 2013, 68, 769–779. [Google Scholar] [CrossRef] [PubMed] [Green Version]
- Shen, W.; Punyanitya, M.; Wang, Z.M.; Gallagher, D.; St.-Onge, M.P.; Albu, J.; Heymsfield, S.B.; Heshka, S. Total body skeletal muscle and adipose tissue volumes: Estimation from a single abdominal cross-sectional image. J. Appl. Physiol. 2004, 97, 2333–2338. [Google Scholar] [CrossRef] [PubMed] [Green Version]
- Grossberg, A.J.; Chamchod, S.; Fuller, C.D.; Mohamed, A.S.R.; Heukelom, J.; Eichelberger, H.; Kantor, M.E.; Hutcheson, K.A.; Gunn, G.B.; Garden, A.S.; et al. Association of Body Composition With Survival and Locoregional Control of Radiotherapy-Treated Head and Neck Squamous Cell Carcinoma. JAMA Oncol. 2016, 2, 782. [Google Scholar] [CrossRef] [PubMed]
- Pałasz, P.; Adamski, Ł.; Górska-Chrząstek, M.; Starzyńska, A.; Studniarek, M. Contemporary Diagnostic Imaging of Oral Squamous Cell Carcinoma—A Review of Literature. Polish J. Radiol. 2017, 82, 193–202. [Google Scholar] [CrossRef] [PubMed] [Green Version]
- Yoshimura, T.; Suzuki, H.; Takayama, H.; Higashi, S.; Hirano, Y.; Tezuka, M.; Ishida, T.; Ishihata, K.; Nishi, Y.; Nakamura, Y.; et al. Impact of preoperative low prognostic nutritional index and high intramuscular adipose tissue content on outcomes of patients with oral squamous cell carcinoma. Cancers 2020, 12, 3167. [Google Scholar] [CrossRef]
- Grégoire, V.; Lefebvre, J.-L.; Licitra, L.; Felip, E. Squamous cell carcinoma of the head and neck: EHNS–ESMO–ESTRO Clinical Practice Guidelines for diagnosis, treatment and follow-up. Ann. Oncol. 2010, 21, v184–v186. [Google Scholar] [CrossRef]
- Chang, S.-W.; Tsai, Y.-H.; Hsu, C.; Huang, E.I.; Chang, G.-H.; Tsai, M.; Tsai, Y.-T. Masticatory muscle index for indicating skeletal muscle mass in patients with head and neck cancer. PLoS ONE 2021, 16, e0251455. [Google Scholar] [CrossRef]
- Bril, S.I.; Wendrich, A.W.; Swartz, J.E.; Wegner, I.; Pameijer, F.; Smid, E.J.; Bol, G.H.; Pothen, A.J.; de Bree, R. Interobserver agreement of skeletal muscle mass measurement on head and neck CT imaging at the level of the third cervical vertebra. Eur. Arch. Oto-Rhino-Laryngol. 2019, 276, 1175–1182. [Google Scholar] [CrossRef] [PubMed] [Green Version]
- Wendrich, A.W.; Swartz, J.E.; Bril, S.I.; Wegner, I.; de Graeff, A.; Smid, E.J.; de Bree, R.; Pothen, A.J. Low skeletal muscle mass is a predictive factor for chemotherapy dose-limiting toxicity in patients with locally advanced head and neck cancer. Oral Oncol. 2017, 71, 26–33. [Google Scholar] [CrossRef] [PubMed]
- Cruz-Jentoft, A.J.; Bahat, G.; Bauer, J.; Boirie, Y.; Bruyère, O.; Cederholm, T.; Cooper, C.; Landi, F.; Rolland, Y.; Sayer, A.A.; et al. Sarcopenia: Revised European consensus on definition and diagnosis. Age Ageing 2019, 48, 16–31. [Google Scholar] [CrossRef] [Green Version]
- Kitajima, Y.; Eguchi, Y.; Ishibashi, E.; Nakashita, S.; Aoki, S.; Toda, S.; Mizuta, T.; Ozaki, I.; Ono, N.; Eguchi, T.; et al. Age-related fat deposition in multifidus muscle could be a marker for nonalcoholic fatty liver disease. J. Gastroenterol. 2010, 45, 218–224. [Google Scholar] [CrossRef]
- Cesari, M.; Fielding, R.A.; Pahor, M.; Goodpaster, B.; Hellerstein, M.; Van Kan, G.A.; Anker, S.D.; Rutkove, S.; Vrijbloed, J.W.; Isaac, M.; et al. Biomarkers of sarcopenia in clinical trials-recommendations from the International Working Group on Sarcopenia. J. Cachexia Sarcopenia Muscle 2012, 3, 181–190. [Google Scholar] [CrossRef] [PubMed] [Green Version]
- Maeda, K.; Koga, T.; Akagi, J. Tentative nil per os leads to poor outcomes in older adults with aspiration pneumonia. Clin. Nutr. 2016, 35, 1147–1152. [Google Scholar] [CrossRef]
- Baracos, V.E. Psoas as a sentinel muscle for sarcopenia: A flawed premise. J. Cachexia Sarcopenia Muscle 2017, 8, 527–528. [Google Scholar] [CrossRef] [PubMed]
- Hamaguchi, Y.; Kaido, T.; Okumura, S.; Ito, T.; Fujimoto, Y.; Ogawa, K.; Mori, A.; Hammad, A.; Hatano, E.; Uemoto, S. Preoperative intramuscular adipose tissue content is a novel prognostic predictor after hepatectomy for hepatocellular carcinoma. J. Hepatobiliary Pancreat. Sci. 2015, 22, 475–485. [Google Scholar] [CrossRef] [PubMed] [Green Version]
- Kurumisawa, S.; Kawahito, K. The psoas muscle index as a predictor of long-term survival after cardiac surgery for hemodialysis-dependent patients. J. Artif. Organs 2019, 22, 214–221. [Google Scholar] [CrossRef] [PubMed]
- Okumura, S.; Kaido, T.; Hamaguchi, Y.; Fujimoto, Y.; Masui, T.; Mizumoto, M.; Hammad, A.; Mori, A.; Takaori, K.; Uemoto, S. Impact of preoperative quality as well as quantity of skeletal muscle on survival after resection of pancreatic cancer. Surgery 2015, 157, 1088–1098. [Google Scholar] [CrossRef] [PubMed] [Green Version]
- Okumura, S.; Kaido, T.; Hamaguchi, Y.; Fujimoto, Y.; Kobayashi, A.; Iida, T.; Yagi, S.; Taura, K.; Hatano, E.; Uemoto, S. Impact of the preoperative quantity and quality of skeletal muscle on outcomes after resection of extrahepatic biliary malignancies. Surgery 2016, 159, 821–833. [Google Scholar] [CrossRef]
- Ojima, Y.; Harano, M.; Sumitani, D.; Okajima, M. Impact of preoperative skeletal muscle mass and quality on the survival of elderly patients after curative resection of colorectal cancer. J. Anus Rectum Colon 2019, 3, 143–151. [Google Scholar] [CrossRef] [PubMed] [Green Version]
- Harimoto, N.; Shirabe, K.; Yamashita, Y.-I.; Ikegami, T.; Yoshizumi, T.; Soejima, Y.; Ikeda, T.; Maehara, Y.; Nishie, A.; Yamanaka, T. Sarcopenia as a predictor of prognosis in patients following hepatectomy for hepatocellular carcinoma. Br. J. Surg. 2013, 100, 1523–1530. [Google Scholar] [CrossRef]
- Fukushima, H.; Yokoyama, M.; Nakanishi, Y.; Tobisu, K.I.; Koga, F. Sarcopenia as a prognostic biomarker of advanced urothelial carcinoma. PLoS ONE 2015, 10, e0115895. [Google Scholar] [CrossRef]
- Bauckneht, M.; Lai, R.; Miceli, A.; Schenone, D.; Cossu, V.; Donegani, M.I.; Raffa, S.; Borra, A.; Marra, S.; Campi, C.; et al. Spinal cord hypermetabolism extends to skeletal muscle in amyotrophic lateral sclerosis: A computational approach to [18F]-fluorodeoxyglucose PET/CT images. EJNMMI Res. 2020, 10, 23. [Google Scholar] [CrossRef] [Green Version]
- Bauckneht, M.; Cossu, V.; Castellani, P.; Piccioli, P.; Orengo, A.M.; Emionite, L.; Di Giulio, F.; Donegani, M.I.; Miceli, A.; Raffa, S.; et al. FDG uptake tracks the oxidative damage in diabetic skeletal muscle: An experimental study. Mol. Metab. 2020, 31, 98–108. [Google Scholar] [CrossRef] [PubMed]
- Marini, C.; Cossu, V.; Bonifacino, T.; Bauckneht, M.; Torazza, C.; Bruno, S.; Castellani, P.; Ravera, S.; Milanese, M.; Venturi, C.; et al. Mechanisms underlying the predictive power of high skeletal muscle uptake of FDG in amyotrophic lateral sclerosis. EJNMMI Res. 2020, 10, 76. [Google Scholar] [CrossRef] [PubMed]


| Characteristics | n = 102 |
|---|---|
| Sex (male/female) | 60/42 |
| Age (years) | 67 (64–69) |
| Comorbidities, yes | 84 |
| Tobacco/Alcohol (%) | 48/38 |
| Tumor site | |
| Tongue/gingival/oral floor/buccal/palate/lip | 47/31/11/7/5/1 |
| TNM staging (AJCC) | |
| T1/T2/T3/T4 | 22/54/15/11 |
| N0/N1/N2 | 61/19/22 |
| Stage | |
| I/II/III/IV | 18/32/21/31 |
| Treatment | |
| Surgery only | 60 |
| Surgery with RT/CT | 42 |
| Follow up duration | 1259 (1155–1362) |
| Preoperative PMI | |
| Male | 7.26 (6.81–7.70) |
| Females | 5.03 (4.67–5.39) |
| Preoperative IMAC | |
| Male | −0.41 (−0.44–−0.38) |
| Females | −0.21 (−0.29–−0.14) |
| Preoperative SCMI | |
| Male | 2.38 (2.22–2.53) |
| Females | 1.74 (1.56–1.91) |
| Preoperative P-IMAC | |
| Male | −0.32 (−0.36–−0.28) |
| Females | −0.23 (−0.28–−0.17) |
| Variable | OS | DFS | DSS | |||||||||
|---|---|---|---|---|---|---|---|---|---|---|---|---|
| Univariate | Multivariate | Univariate | Multivariate | Univariate | Multivariate | |||||||
| p | HR | 95%CI | p | p | HR | 95%CI | p | p | HR | 95%CI | p | |
| Age | 0.016 | 1.035 | 0.981–1.092 | 0.206 | 0.282 | 0.075 | 0.994 | 0.930–1.062 | 0.864 | |||
| Sex | 0.934 | 0.012 | 1.079 | 0.394–2.950 | 0.881 | 0.254 | ||||||
| Comorbidities | 0.792 | 0.195 | 0.546 | |||||||||
| PMI | ||||||||||||
| Low | 0.042 | 1.150 | 0.378–3.497 | 0.805 | 0.059 | 0.925 | 0.386–2.211 | 0.861 | 0.011 | 2.986 | 0.605–14.718 | 0.179 |
| SCMI | ||||||||||||
| Low | 0.000 | 13.462 | 3.136–57.791 | 0.000 | 0.000 | 10.179 | 3.476–29.810 | 0.000 | 0.001 | 10.190 | 1.051–98.728 | 0.045 |
| IMAC | ||||||||||||
| High | 0.038 | 2.092 | 0.656–6.663 | 0.212 | 0.172 | 0.004 | 2.464 | 0.672–9.030 | 0.045 | |||
| P-IMAC | ||||||||||||
| High | 0.000 | 1.081 | 0.311–3.752 | 0.902 | 0.000 | 5.857 | 2.088–16.425 | 0.001 | 0.000 | 4.815 | 0.761–30.442 | 0.095 |
Publisher’s Note: MDPI stays neutral with regard to jurisdictional claims in published maps and institutional affiliations. |
© 2021 by the authors. Licensee MDPI, Basel, Switzerland. This article is an open access article distributed under the terms and conditions of the Creative Commons Attribution (CC BY) license (https://creativecommons.org/licenses/by/4.0/).
Share and Cite
Yoshimura, T.; Suzuki, H.; Takayama, H.; Higashi, S.; Hirano, Y.; Tezuka, M.; Ishida, T.; Ishihata, K.; Amitani, M.; Amitani, H.; et al. Prognostic Role of Preoperative Sarcopenia Evaluation of Cervical Muscles with Long-Term Outcomes of Patients with Oral Squamous Cell Carcinoma. Cancers 2021, 13, 4725. https://doi.org/10.3390/cancers13184725
Yoshimura T, Suzuki H, Takayama H, Higashi S, Hirano Y, Tezuka M, Ishida T, Ishihata K, Amitani M, Amitani H, et al. Prognostic Role of Preoperative Sarcopenia Evaluation of Cervical Muscles with Long-Term Outcomes of Patients with Oral Squamous Cell Carcinoma. Cancers. 2021; 13(18):4725. https://doi.org/10.3390/cancers13184725
Chicago/Turabian StyleYoshimura, Takuya, Hajime Suzuki, Hirotaka Takayama, Shotaro Higashi, Yuka Hirano, Masahiro Tezuka, Takayuki Ishida, Kiyohide Ishihata, Marie Amitani, Haruka Amitani, and et al. 2021. "Prognostic Role of Preoperative Sarcopenia Evaluation of Cervical Muscles with Long-Term Outcomes of Patients with Oral Squamous Cell Carcinoma" Cancers 13, no. 18: 4725. https://doi.org/10.3390/cancers13184725