
Prostate Health Index and Multiparametric MRI: Partners in Crime Fighting Overdiagnosis and Overtreatment in Prostate Cancer

 , ,
, ,  ,
,  ,
,
Abstract
:Simple Summary
Abstract
1. Introduction
2. Materials and Methods
2.1. Study Design
2.2. Biomarker Measurement
2.3. Multiparametric MRI and Biopsy Protocols
2.4. Statistical Analysis
3. Results
3.1. Biopsy Outcome
3.2. Radical Prostatectomy Outcome
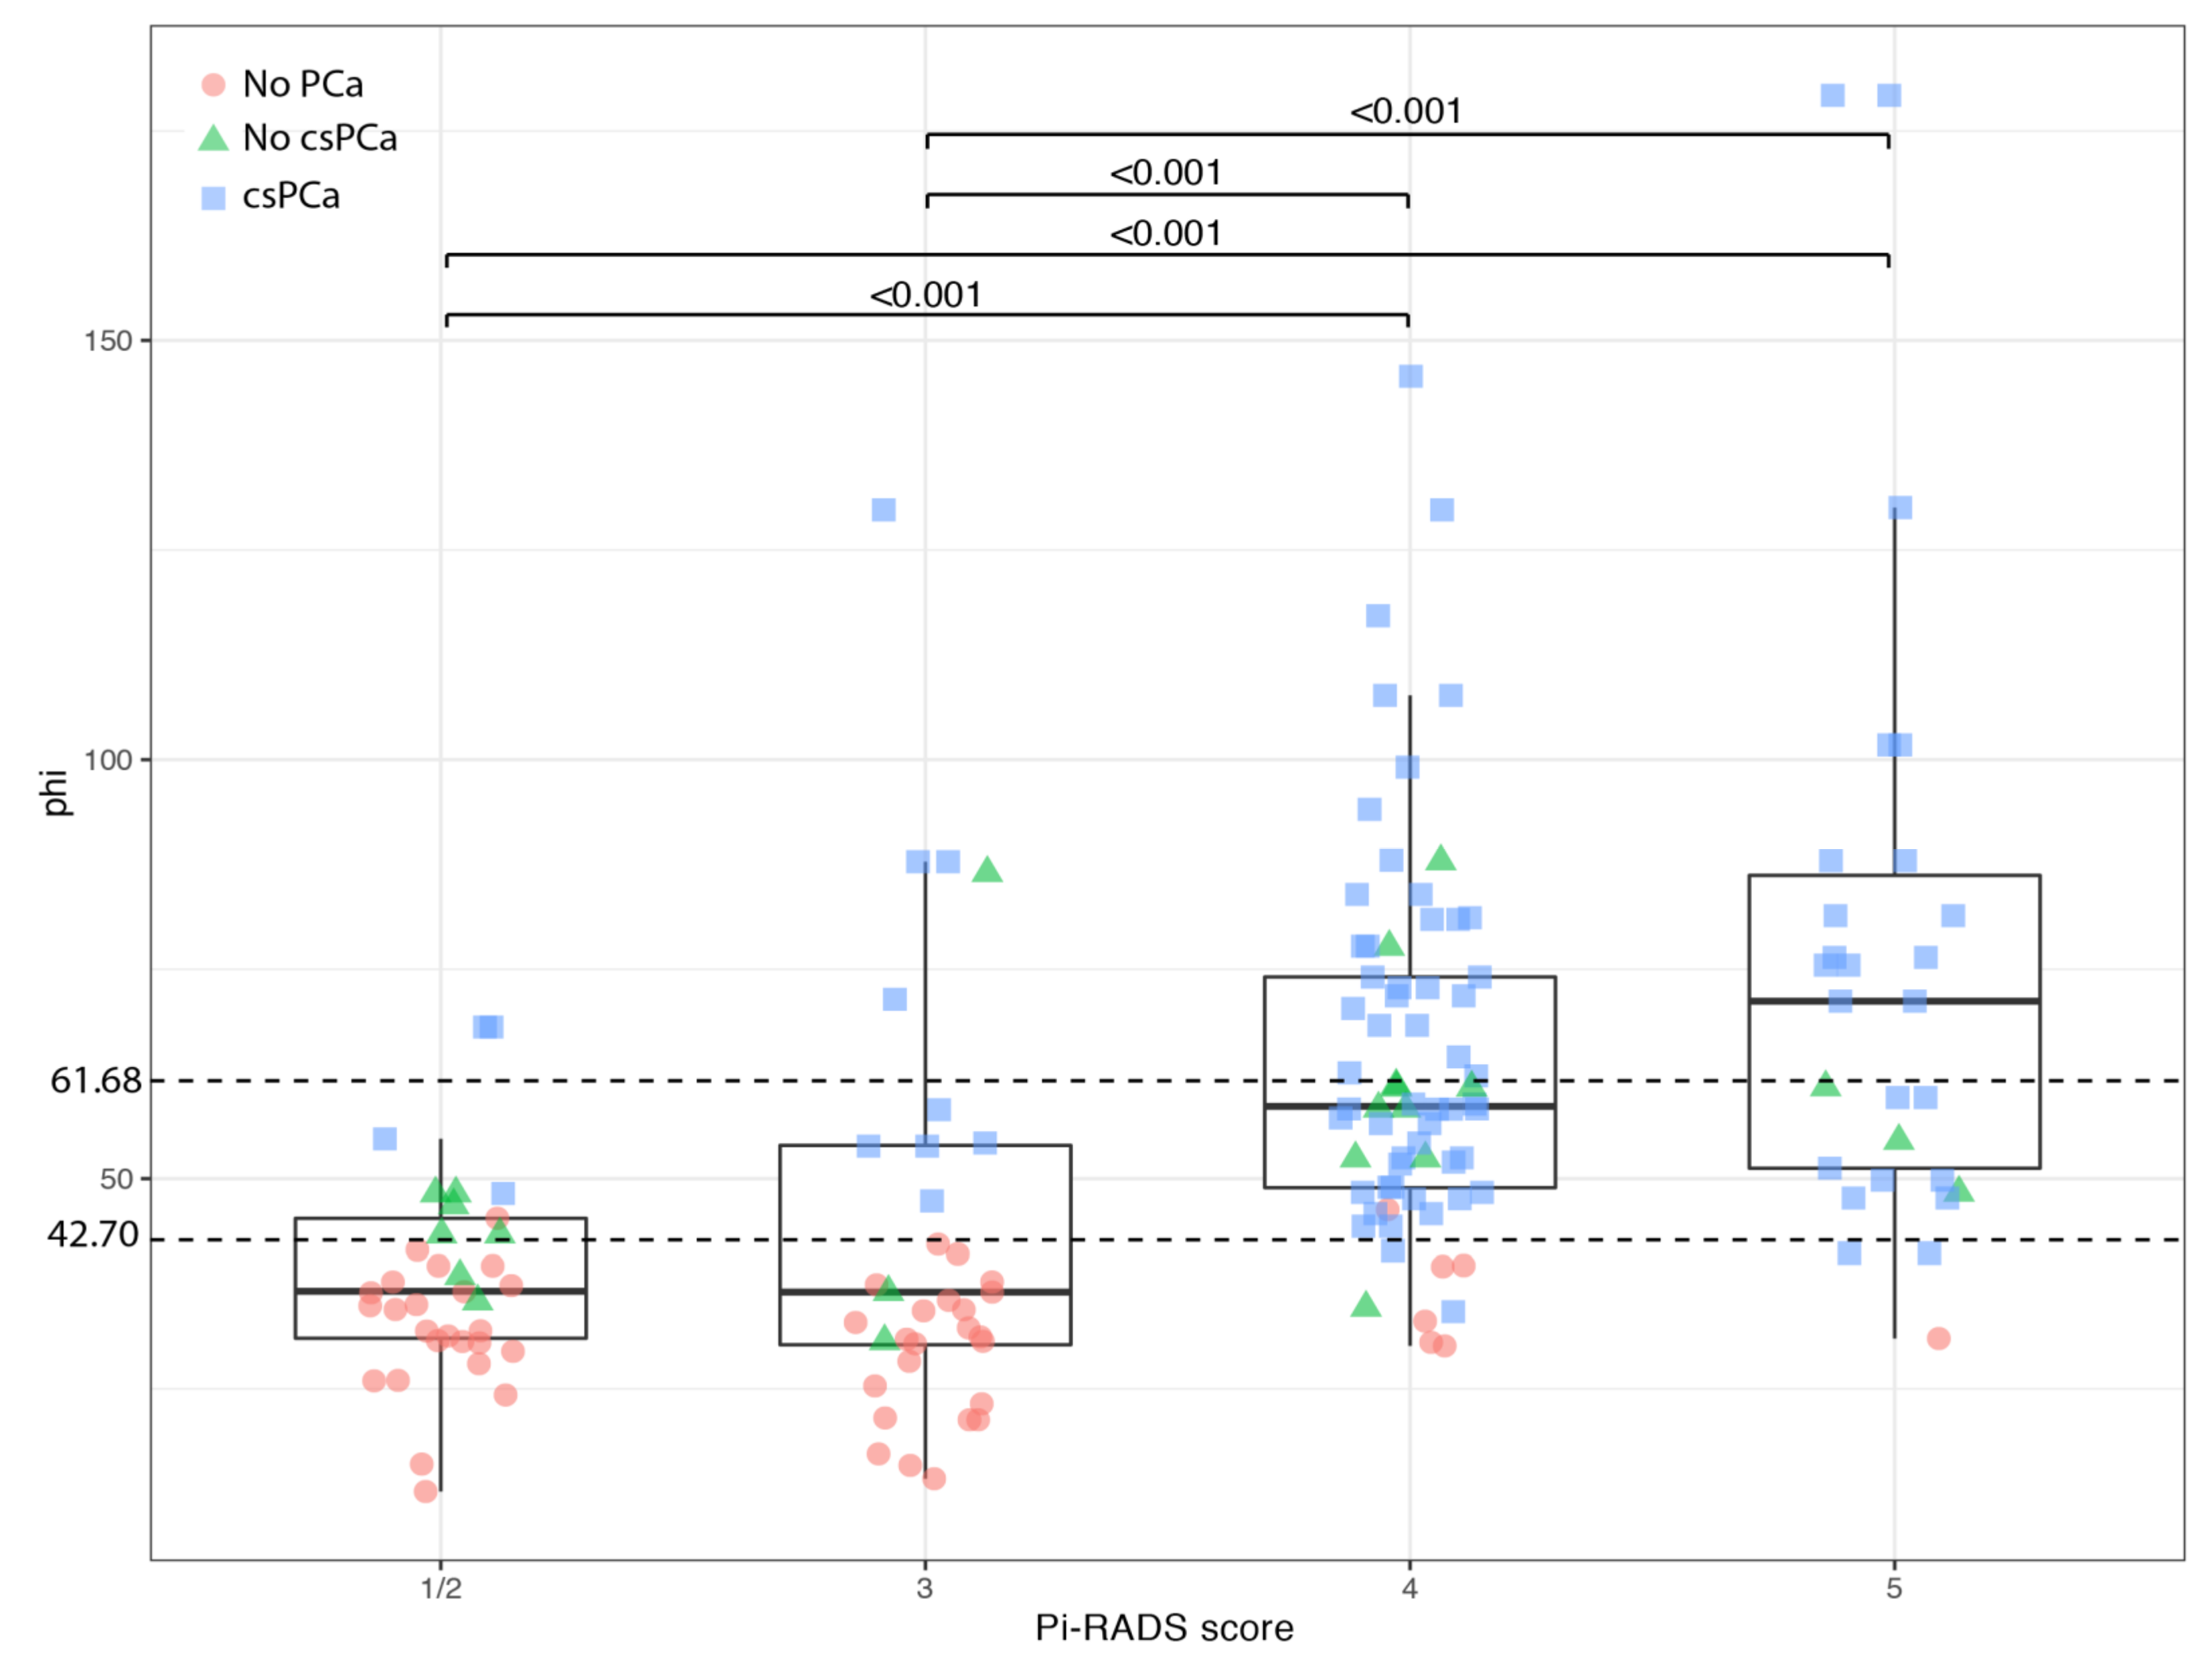
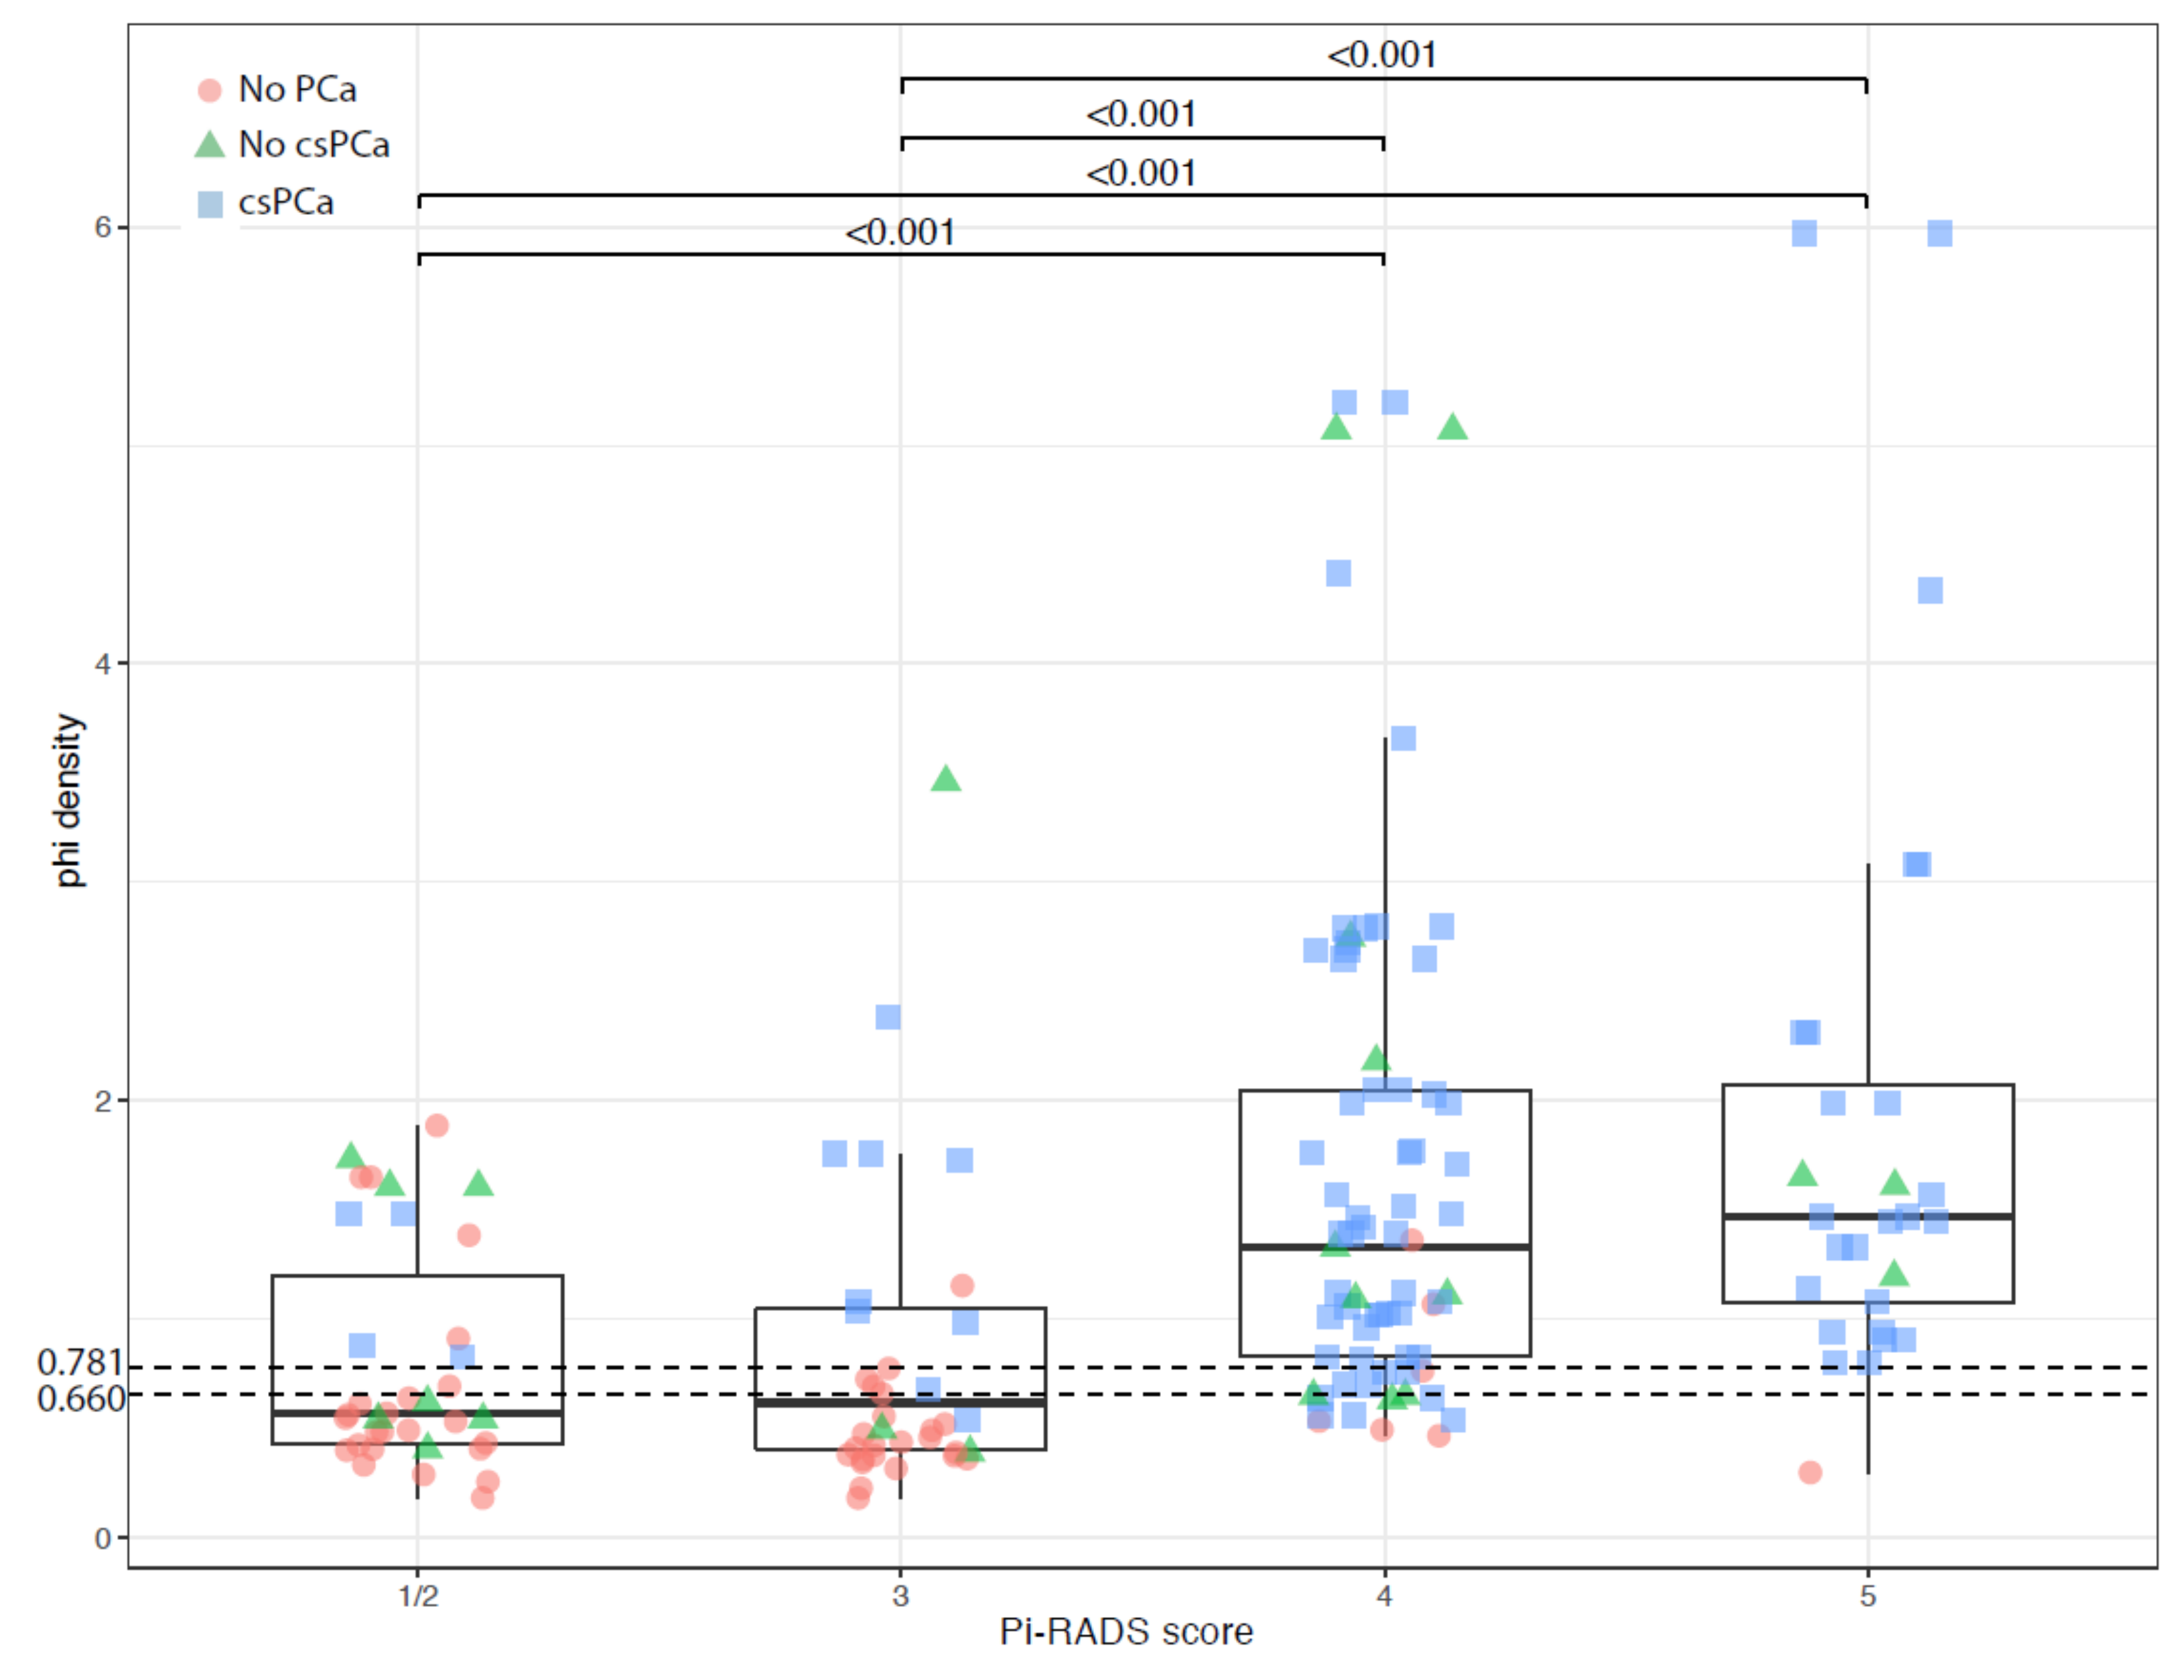
3.3. Correlation between PHI and PI-RADS Score
4. Discussion
5. Conclusions
Author Contributions
Funding
Institutional Review Board Statement
Informed Consent Statement
Data Availability Statement
Acknowledgments
Conflicts of Interest
Abbreviations
References
- Kasivisvanathan, V.; Rannikko, A.S.; Borghi, M.; Panebianco, V.; Mynderse, L.A.; Vaarala, M.H.; Briganti, A.; Budaus, L.; Hellawell, G.; Hindley, R.G.; et al. MRI-Targeted or Standard Biopsy for Prostate-Cancer Diagnosis. N. Engl. J. Med. 2018, 378, 1767–1777. [Google Scholar] [CrossRef]
- Mottet, N.; van den Bergh, R.C.N.; Briers, E.; Van den Broeck, T.; Cumberbatch, M.G.; De Santis, M.; Fanti, S.; Fossati, N.; Gandaglia, G.; Gillessen, S.; et al. EAU-EANM-ESTRO-ESUR-SIOG Guidelines on Prostate Cancer-2020 Update. Part 1: Screening, Diagnosis, and Local Treatment with Curative Intent. Eur. Urol. 2021, 79, 243–262. [Google Scholar] [CrossRef] [PubMed]
- Weinreb, J.C.; Barentsz, J.O.; Choyke, P.L.; Cornud, F.; Haider, M.A.; Macura, K.J.; Margolis, D.; Schnall, M.D.; Shtern, F.; Tempany, C.M.; et al. PI-RADS Prostate Imaging-Reporting and Data System: 2015, Version 2. Eur. Urol. 2016, 69, 16–40. [Google Scholar] [CrossRef]
- Cuocolo, R.; Stanzione, A.; Ponsiglione, A.; Romeo, V.; Verde, F.; Creta, M.; La Rocca, R.; Longo, N.; Pace, L.; Imbriaco, M. Clinically significant prostate cancer detection on MRI: A radiomic shape features study. Eur. J. Radiol. 2019, 116, 144–149. [Google Scholar] [CrossRef] [PubMed]
- Grey, A.D.; Chana, M.S.; Popert, R.; Wolfe, K.; Liyanage, S.H.; Acher, P.L. Diagnostic accuracy of magnetic resonance imaging (MRI) prostate imaging reporting and data system (PI-RADS) scoring in a transperineal prostate biopsy setting. BJU Int. 2015, 115, 728–735. [Google Scholar] [CrossRef] [PubMed] [Green Version]
- Santoro, A.A.; Di Gianfrancesco, L.; Racioppi, M.; Pinto, F.; Palermo, G.; Sacco, E.; Campetella, M.; Scarciglia, E.; Bientinesi, R.; Di Paola, V.; et al. Multiparametric magnetic resonance imaging of the prostate: Lights and shadows. Urologia 2021, 3915603211019982. [Google Scholar] [CrossRef]
- Rapisarda, S.; Bada, M.; Crocetto, F.; Barone, B.; Arcaniolo, D.; Polara, A.; Imbimbo, C.; Grosso, G. The role of multiparametric resonance and biopsy in prostate cancer detection: Comparison with definitive histological report after laparoscopic/robotic radical prostatectomy. Abdom. Radiol. 2020, 45, 4178–4184. [Google Scholar] [CrossRef]
- Massanova, M.; Robertson, S.; Barone, B.; Dutto, L.; Caputo, V.F.; Bhatt, J.R.; Ahmad, I.; Bada, M.; Obeidallah, A.; Crocetto, F. The Comparison of Imaging and Clinical Methods to Estimate Prostate Volume: A Single-Centre Retrospective Study. Urol. Int. 2021, 1–7. [Google Scholar] [CrossRef]
- Visser, W.C.H.; de Jong, H.; Melchers, W.J.G.; Mulders, P.F.A.; Schalken, J.A. Commercialized Blood-, Urinary- and Tissue-Based Biomarker Tests for Prostate Cancer Diagnosis and Prognosis. Cancers 2020, 12, 3790. [Google Scholar] [CrossRef] [PubMed]
- Ferro, M.; De Cobelli, O.; Lucarelli, G.; Porreca, A.; Busetto, G.M.; Cantiello, F.; Damiano, R.; Autorino, R.; Musi, G.; Vartolomei, M.D.; et al. Beyond PSA: The Role of Prostate Health Index (phi). Int. J. Mol. Sci. 2020, 21, 1184. [Google Scholar] [CrossRef] [Green Version]
- White, J.; Shenoy, B.V.; Tutrone, R.F.; Karsh, L.I.; Saltzstein, D.R.; Harmon, W.J.; Broyles, D.L.; Roddy, T.E.; Lofaro, L.R.; Paoli, C.J.; et al. Clinical utility of the Prostate Health Index (phi) for biopsy decision management in a large group urology practice setting. Prostate Cancer Prostatic Dis. 2018, 21, 78–84. [Google Scholar] [CrossRef] [Green Version]
- Filella, X.; Gimenez, N. Evaluation of [−2] proPSA and Prostate Health Index (phi) for the detection of prostate cancer: A systematic review and meta-analysis. Clin. Chem. Lab. Med. 2013, 51, 729–739. [Google Scholar] [CrossRef]
- Foj, L.; Filella, X. Development and internal validation of a novel PHI-nomogram to identify aggressive prostate cancer. Clin. Chim. Acta 2020, 501, 174–178. [Google Scholar] [CrossRef]
- Ferro, M.; Bruzzese, D.; Perdona, S.; Mazzarella, C.; Marino, A.; Sorrentino, A.; Di Carlo, A.; Autorino, R.; Di Lorenzo, G.; Buonerba, C.; et al. Predicting prostate biopsy outcome: Prostate health index (phi) and prostate cancer antigen 3 (PCA3) are useful biomarkers. Clin. Chim Acta 2012, 413, 1274–1278. [Google Scholar] [CrossRef] [PubMed]
- Ferro, M.; Bruzzese, D.; Perdona, S.; Marino, A.; Mazzarella, C.; Perruolo, G.; D’Esposito, V.; Cosimato, V.; Buonerba, C.; Di Lorenzo, G.; et al. Prostate Health Index (Phi) and Prostate Cancer Antigen 3 (PCA3) significantly improve prostate cancer detection at initial biopsy in a total PSA range of 2–10 ng/mL. PLoS ONE 2013, 8, e67687. [Google Scholar] [CrossRef] [PubMed]
- Ferro, M.; Lucarelli, G.; Bruzzese, D.; Perdona, S.; Mazzarella, C.; Perruolo, G.; Marino, A.; Cosimato, V.; Giorgio, E.; Tagliamonte, V.; et al. Improving the prediction of pathologic outcomes in patients undergoing radical prostatectomy: The value of prostate cancer antigen 3 (PCA3), prostate health index (phi) and sarcosine. Anticancer Res. 2015, 35, 1017–1023. [Google Scholar]
- Perdona, S.; Bruzzese, D.; Ferro, M.; Autorino, R.; Marino, A.; Mazzarella, C.; Perruolo, G.; Longo, M.; Spinelli, R.; Di Lorenzo, G.; et al. Prostate health index (phi) and prostate cancer antigen 3 (PCA3) significantly improve diagnostic accuracy in patients undergoing prostate biopsy. Prostate 2013, 73, 227–235. [Google Scholar] [CrossRef]
- Bruzzese, D.; Mazzarella, C.; Ferro, M.; Perdona, S.; Chiodini, P.; Perruolo, G.; Terracciano, D. Prostate health index vs percent free prostate-specific antigen for prostate cancer detection in men with "gray" prostate-specific antigen levels at first biopsy: Systematic review and meta-analysis. Transl. Res. 2014, 164, 444–451. [Google Scholar] [CrossRef] [PubMed] [Green Version]
- Gnanapragasam, V.J.; Burling, K.; George, A.; Stearn, S.; Warren, A.; Barrett, T.; Koo, B.; Gallagher, F.A.; Doble, A.; Kastner, C.; et al. The Prostate Health Index adds predictive value to multi-parametric MRI in detecting significant prostate cancers in a repeat biopsy population. Sci. Rep. 2016, 6, 35364. [Google Scholar] [CrossRef] [PubMed] [Green Version]
- Hsieh, P.F.; Li, W.J.; Lin, W.C.; Chang, H.; Chang, C.H.; Huang, C.P.; Yang, C.R.; Chen, W.C.; Chang, Y.H.; Wu, H.C. Combining prostate health index and multiparametric magnetic resonance imaging in the diagnosis of clinically significant prostate cancer in an Asian population. World J. Urol. 2020, 38, 1207–1214. [Google Scholar] [CrossRef] [Green Version]
- Tosoian, J.J.; Druskin, S.C.; Andreas, D.; Mullane, P.; Chappidi, M.; Joo, S.; Ghabili, K.; Agostino, J.; Macura, K.J.; Carter, H.B.; et al. Use of the Prostate Health Index for detection of prostate cancer: Results from a large academic practice. Prostate Cancer Prostatic Dis. 2017, 20, 228–233. [Google Scholar] [CrossRef] [PubMed] [Green Version]
- Fan, Y.H.; Pan, P.H.; Cheng, W.M.; Wang, H.K.; Shen, S.H.; Liu, H.T.; Cheng, H.M.; Chen, W.R.; Huang, T.H.; Wei, T.C.; et al. The Prostate Health Index aids multi-parametric MRI in diagnosing significant prostate cancer. Sci. Rep. 2021, 11, 1286. [Google Scholar] [CrossRef] [PubMed]
- Tan, T.W.; Png, K.S.; Lee, C.H.; Yuwono, A.; Yeow, Y.; Chong, K.T.; Lee, Y.M.; Tan, C.H.; Tan, Y.K. MRI Fusion-Targeted Transrectal Prostate Biopsy and the Role of Prostate-Specific Antigen Density and Prostate Health Index for the Detection of Clinically Significant Prostate Cancer in Southeast Asian Men. J. Endourol. 2017, 31, 1111–1116. [Google Scholar] [CrossRef] [PubMed]
- Druskin, S.C.; Tosoian, J.J.; Young, A.; Collica, S.; Srivastava, A.; Ghabili, K.; Macura, K.J.; Carter, H.B.; Partin, A.W.; Sokoll, L.J.; et al. Combining Prostate Health Index density, magnetic resonance imaging and prior negative biopsy status to improve the detection of clinically significant prostate cancer. BJU Int. 2018, 121, 619–626. [Google Scholar] [CrossRef] [Green Version]
- Schwen, Z.R.; Mamawala, M.; Tosoian, J.J.; Druskin, S.C.; Ross, A.E.; Sokoll, L.J.; Epstein, J.I.; Carter, H.B.; Gorin, M.A.; Pavlovich, C.P. Prostate Health Index and multiparametric magnetic resonance imaging to predict prostate cancer grade reclassification in active surveillance. BJU Int. 2020, 126, 373–378. [Google Scholar] [CrossRef]
- Epstein, J.I.; Egevad, L.; Amin, M.B.; Delahunt, B.; Srigley, J.R.; Humphrey, P.A.; Grading, C. The 2014 International Society of Urological Pathology (ISUP) Consensus Conference on Gleason Grading of Prostatic Carcinoma: Definition of Grading Patterns and Proposal for a New Grading System. Am. J. Surg. Pathol. 2016, 40, 244–252. [Google Scholar] [CrossRef]
- Epstein, J.I.; Walsh, P.C.; Carmichael, M.; Brendler, C.B. Pathologic and clinical findings to predict tumor extent of nonpalpable (stage T1c) prostate cancer. JAMA 1994, 271, 368–374. [Google Scholar] [CrossRef]
- Van der Kwast, T.H.; Roobol, M.J. Defining the threshold for significant versus insignificant prostate cancer. Nat. Rev. Urol. 2013, 10, 473–482. [Google Scholar] [CrossRef] [PubMed]
- Semjonow, A.; Kopke, T.; Eltze, E.; Pepping-Schefers, B.; Burgel, H.; Darte, C. Pre-analytical in-vitro stability of [−2]proPSA in blood and serum. Clin. Biochem. 2010, 43, 926–928. [Google Scholar] [CrossRef]
- Stejskal, J.; Adamcova, V.; Zalesky, M.; Novak, V.; Capoun, O.; Fiala, V.; Dolejsova, O.; Sedlackova, H.; Vesely, S.; Zachoval, R. The predictive value of the prostate health index vs. multiparametric magnetic resonance imaging for prostate cancer diagnosis in prostate biopsy. World J. Urol. 2021, 39, 1889–1895. [Google Scholar] [CrossRef]
- Kim, L.; Boxall, N.; George, A.; Burling, K.; Acher, P.; Aning, J.; McCracken, S.; Page, T.; Gnanapragasam, V.J. Clinical utility and cost modelling of the phi test to triage referrals into image-based diagnostic services for suspected prostate cancer: The PRIM (Phi to RefIne Mri) study. BMC Med. 2020, 18, 95. [Google Scholar] [CrossRef] [Green Version]
- Schoots, I.G. MRI in early prostate cancer detection: How to manage indeterminate or equivocal PI-RADS 3 lesions? Transl. Androl. Urol. 2018, 7, 70–82. [Google Scholar] [CrossRef] [PubMed] [Green Version]
- Sathianathen, N.J.; Omer, A.; Harriss, E.; Davies, L.; Kasivisvanathan, V.; Punwani, S.; Moore, C.M.; Kastner, C.; Barrett, T.; Van Den Bergh, R.C.; et al. Negative Predictive Value of Multiparametric Magnetic Resonance Imaging in the Detection of Clinically Significant Prostate Cancer in the Prostate Imaging Reporting and Data System Era: A Systematic Review and Meta-analysis. Eur. Urol. 2020, 78, 402–414. [Google Scholar] [CrossRef] [PubMed]
- Norris, J.M.; Carmona Echeverria, L.M.; Bott, S.R.J.; Brown, L.C.; Burns-Cox, N.; Dudderidge, T.; El-Shater Bosaily, A.; Frangou, E.; Freeman, A.; Ghei, M.; et al. What Type of Prostate Cancer Is Systematically Overlooked by Multiparametric Magnetic Resonance Imaging? An Analysis from the PROMIS Cohort. Eur. Urol. 2020, 78, 163–170. [Google Scholar] [CrossRef] [PubMed]
- Sedlackova, H.; Dolejsova, O.; Hora, M.; Ferda, J.; Hes, O.; Topolcan, O.; Fuchsova, R.; Kucera, R. Prostate Cancer Diagnostic Algorithm as a "Road Map" from the First Stratification of the Patient to the Final Treatment Decision. Life 2021, 11, 324. [Google Scholar] [CrossRef]
- Dall’Era, M. Liquid biomarkers in active surveillance. World J. Urol. 2021, 1–6. [Google Scholar] [CrossRef]
- Pastor-Navarro, B.; Rubio-Briones, J.; Borque-Fernando, A.; Esteban, L.M.; Dominguez-Escrig, J.L.; Lopez-Guerrero, J.A. Active Surveillance in Prostate Cancer: Role of Available Biomarkers in Daily Practice. Int. J. Mol. Sci. 2021, 22, 6266. [Google Scholar] [CrossRef] [PubMed]
- Liu, J.L.; Patel, H.D.; Haney, N.M.; Epstein, J.I.; Partin, A.W. Advances in the selection of patients with prostate cancer for active surveillance. Nat. Rev. Urol 2021, 18, 197–208. [Google Scholar] [CrossRef]
- Gentile, F.; Ferro, M.; Della Ventura, B.; La Civita, E.; Liotti, A.; Cennamo, M.; Bruzzese, D.; Velotta, R.; Terracciano, D. Optimized Identification of High-Grade Prostate Cancer by Combining Different PSA Molecular Forms and PSA Density in a Deep Learning Model. Diagnostics 2021, 11, 335. [Google Scholar] [CrossRef]
- Tataru, O.S.; Vartolomei, M.D.; Rassweiler, J.J.; Virgil, O.; Lucarelli, G.; Porpiglia, F.; Amparore, D.; Manfredi, M.; Carrieri, G.; Falagario, U.; et al. Artificial Intelligence and Machine Learning in Prostate Cancer Patient Management-Current Trends and Future Perspectives. Diagnostics 2021, 11, 354. [Google Scholar] [CrossRef] [PubMed]
- Cuocolo, R.; Stanzione, A.; Faletti, R.; Gatti, M.; Calleris, G.; Fornari, A.; Gentile, F.; Motta, A.; Dell’Aversana, S.; Creta, M.; et al. MRI index lesion radiomics and machine learning for detection of extraprostatic extension of disease: A multicenter study. Eur. Radiol. 2021, 1–9. [Google Scholar] [CrossRef]
- Baltzer, P.A.T.; Clauser, P. Applications of artificial intelligence in prostate cancer imaging. Curr. Opin. Urol. 2021, 31, 416–423. [Google Scholar] [CrossRef] [PubMed]


| Parameter | Overall Cohort At Biopsy (n = 196) | Overall Cohort At RP (n = 116) |
|---|---|---|
| Age | 66.6 ± 7.8 (48 to 85) | 65.6 ± 6.9 (48 to 81) |
| PI-RADS score | ||
| 1/2 | 39 (19.9) | 13 (11.2) |
| 3 | 44 (22.4) | 13 (11.2) |
| 4 | 80 (40.8) | 63 (54.3) |
| 5 | 33 (16.8) | 27 (23.3) |
| Prostate volume (mL) | 51.8 [34.8; 68] (12 to 148) | 46 [32; 62] (12 to 120) |
| PSA (ng/mL) | 6.2 ± 2 (2 to 10.4) | 6.5 ± 2 (2.6 to 10.4) |
| PSA density | 12 [8; 16.8] (3.3 to 76) | 13 [9; 20.2] (4 to 76) |
| fPSA (ng/mL) | 0.81 [0.58; 1.2] (0.15 to 2.45) | 0.72 [0.56; 1.12] (0.17 to 2.27) |
| fPSA/tPSA ratio | 14.5 [10.7; 20.4] (3.8 to 44.3) | 12.64 [8.6; 17.2] (3.8 to 34.6) |
| p2PSA (ng/mL) | 17.6 [13.2; 25.8] (1.3 to 55.2) | 18.3 [13.7; 27.9] (3.29 to 55.2) |
| p2PSA/fPSA ratio | 1.24 [0.87; 1.84] (0.19 to 4.64) | 1.48 [1.13; 2.12] (0.7 to 4.64) |
| PHI | 51.1 [37.1; 70.1] (12.7 to 179.3) | 58.9 [48.4; 77.7] (30.7 to 179.3) |
| PHI density | 1.03 [0.6; 1.66] (0.18 to 6.61) | 1.44 [0.9; 2] (0.39 to 5.97) |
| Studied Variables | No PCa (n = 54; 27.3%) | PCa (n = 142; 72.7%) | p-Value | AUC (95% CI) | Best Threshold | Specificity (95% CI) | Sensitivity (95% CI) |
|---|---|---|---|---|---|---|---|
| Age | 65.5 ± 9 (48 to 85) | 67 ± 7.3 (49 to 85) | 0.283 | - | |||
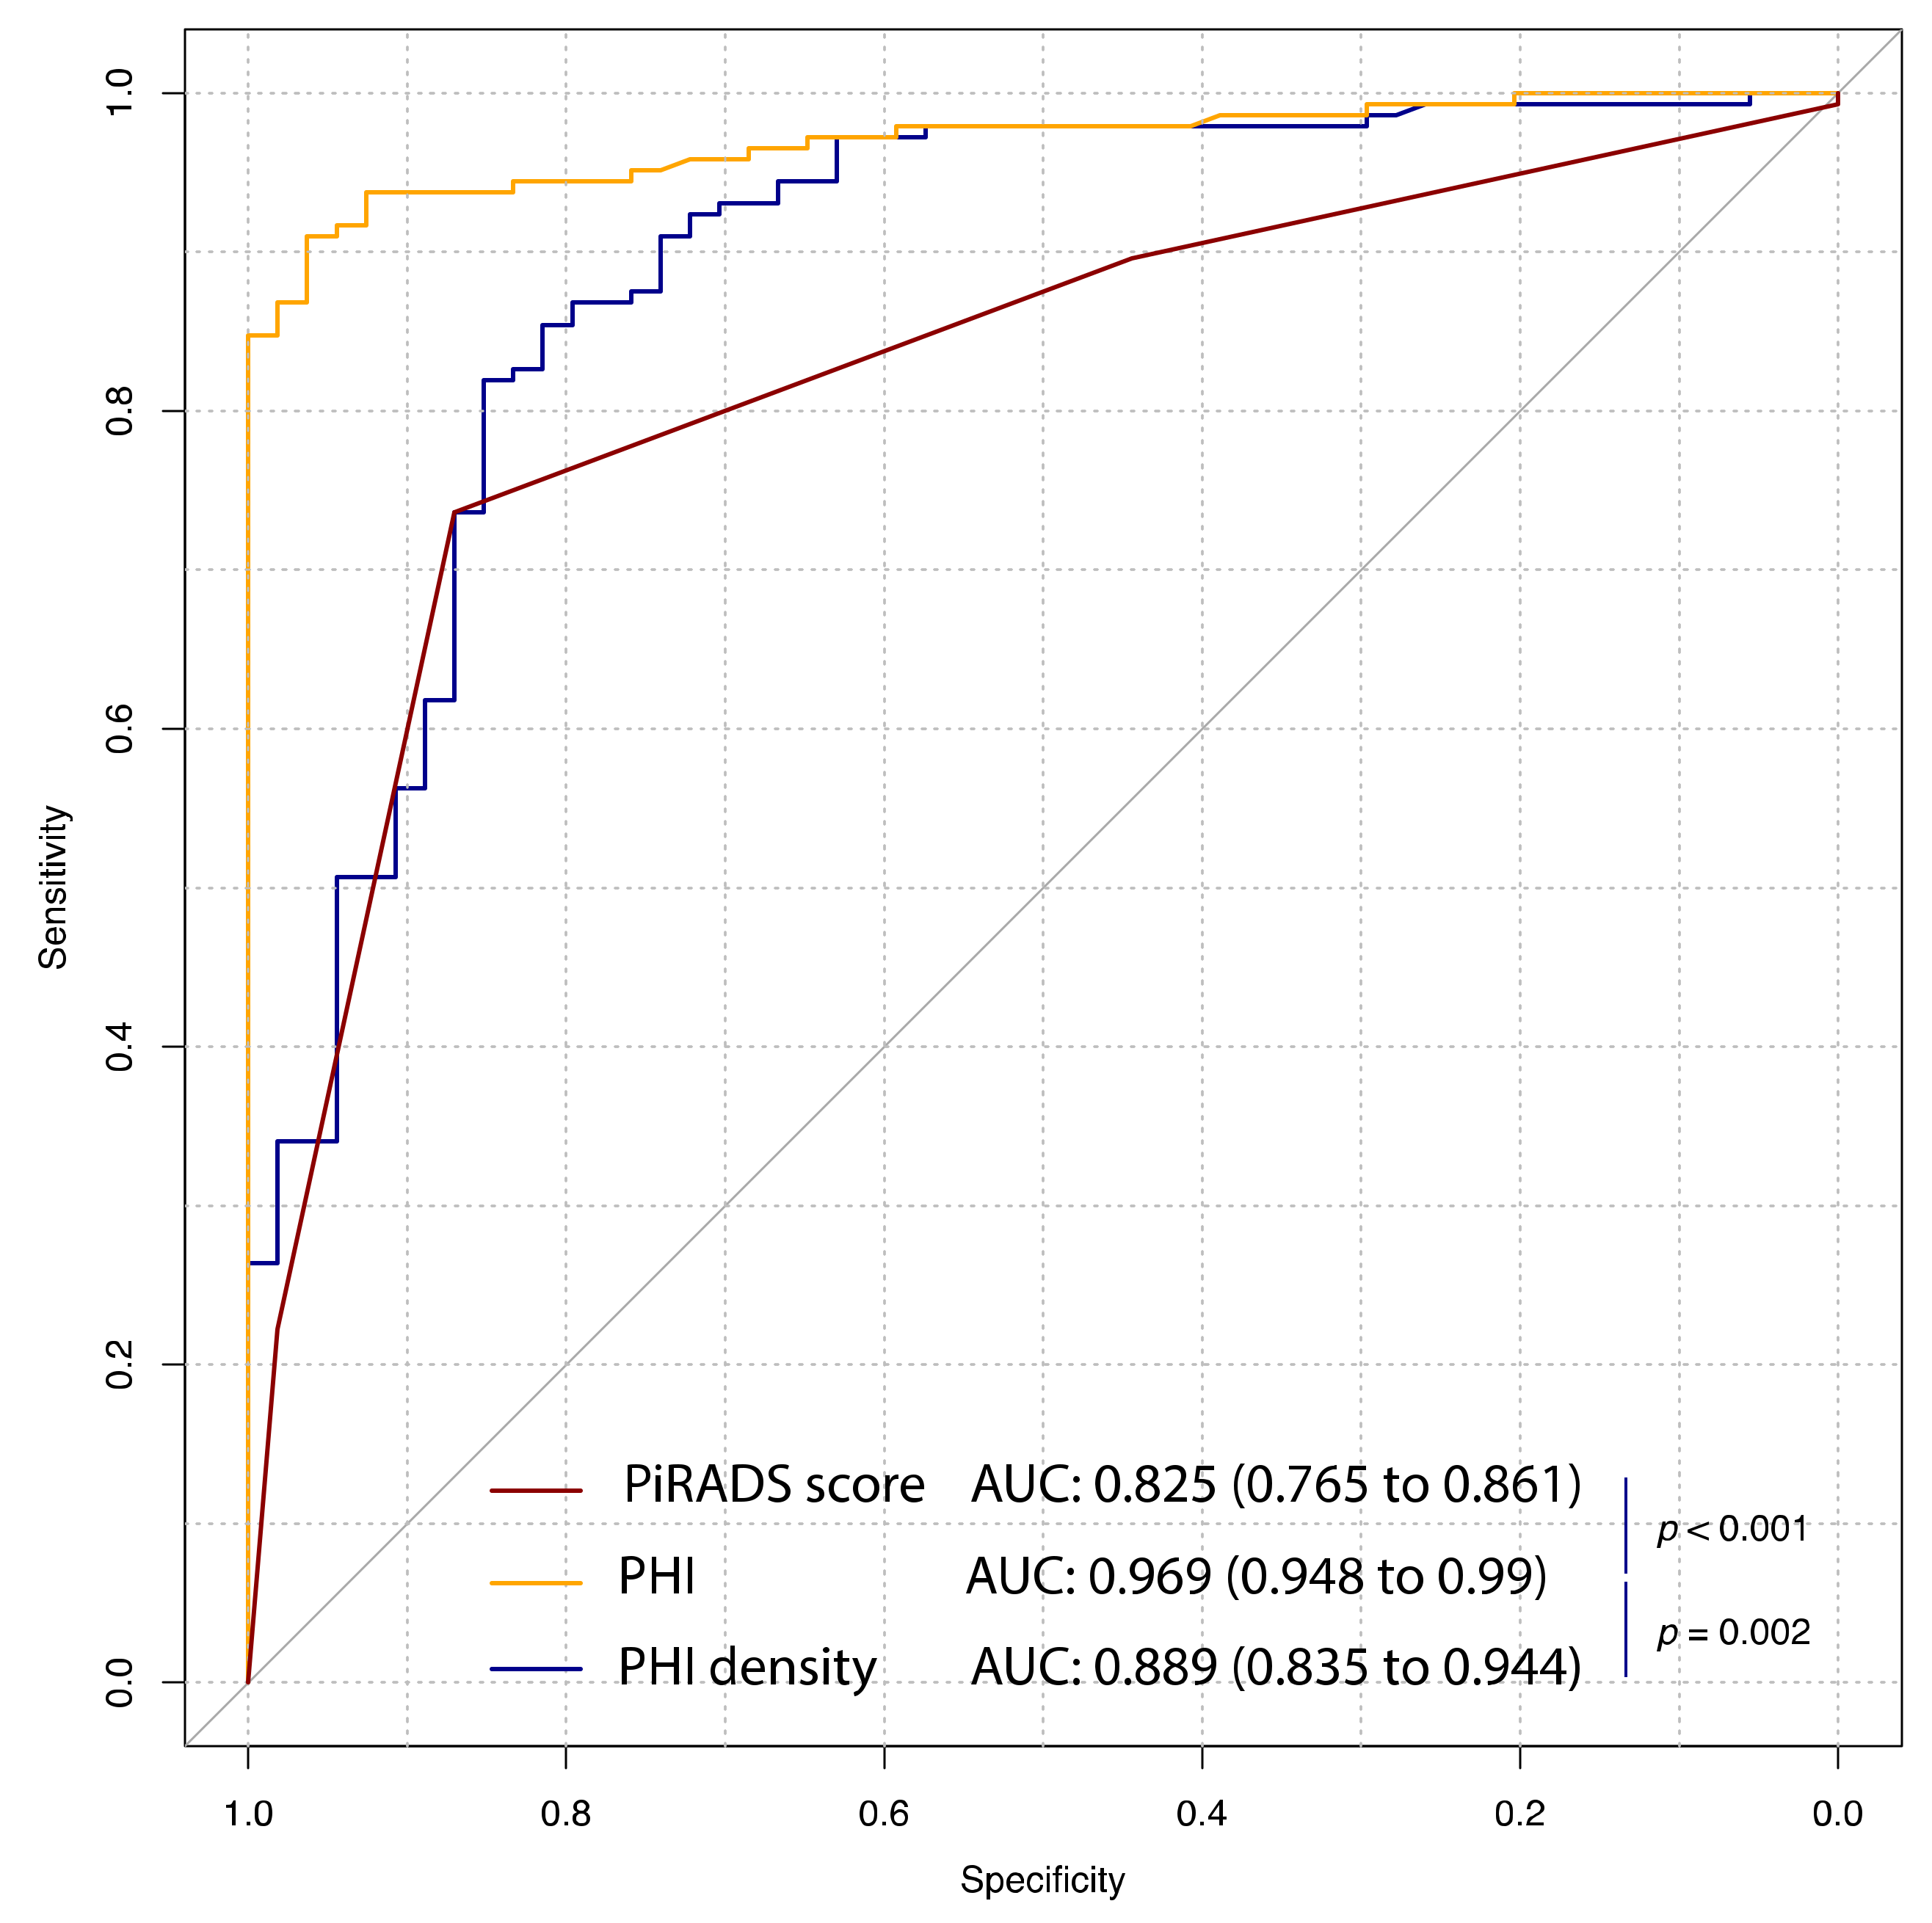
| PI-RADS score | 3 [2; 3] (2 to 5) | 4 [3; 4] (1 to 5) | <0.001 | 0.825 (0.765 to 0.861) | 4 | 87 (77.8 to 94.4) | 74.6 (67.6 to 81.7) |
| Prostate volume (mL) | 61.5 [48.8; 78] (24 to 120) | 48 [33; 62] (12 to 148) | <0.001 | 0.666 (0.578 to 0.753) | 51.8 | 74.1 (61.1 to 85.2) | 59.2 (50.7 to 66.9) |
| PSA (ng/mL) | 5.4 ± 2 (2 to 9.6) | 6.5 ± 1.9 (2.6 to 10.4) | 0.001 | 0.651 (0.563 to 0.739) | 4.745 | 48.1 (35.2 to 61.1) | 78.9 (71.8 to 85.2) |
| PSA density | 8.1 [6.1; 12.3] (3.8 to 21.0) | 13.0 [9; 19.2] (3.3 to 76) | <0.001 | 0.743 (0.668 to 0.818) | 8.95 | 59.3 (46.3 to 72.2) | 80.3 (73.9 to 86.6) |
| fPSA (ng/mL) | 1.12 [0.7; 1.47] (0.15 to 2.45) | 0.75 [0.57; 1.12] (0.24 to 2.27) | 0.001 | 0.65 (0.559 to 0.742) | 1.21 | 44.4 (31.5 to 57.4) | 83.8 (77.5 to 89.4) |
| fPSA/tPSA ratio | 20.7 [15.1; 27.9] (3.8 to 44.3) | 12.8 [9.5; 17.1] (4 to 41.9) | <0.001 | 0.757 (0.679 to 0.836) | 15.97 | 74.1 (63 to 85.2) | 69 (61.3 to 76.8) |
| p2PSA (pg/mL) | 14.8 [10.9; 19.3] (1.3 to 29.1) | 18.4 [13.9; 27.9] (6.1 to 55.2) | <0.001 | 0.687 (0.607 to 0.768) | 16.4 | 68.5 (55.6 to 79.6) | 64.8 (57 to 72.5) |
| p2PSA/fPSA ratio | 0.75 [0.56; 0.88] (0.19 to 1.85) | 1.48 [1.1; 2.1] (0.57 to 4.64) | <0.001 | 0.935 (0.898 to 0.972) | 0.93 | 87 (77.8 to 96.3) | 91.5 (86.6 to 95.8) |
| PHI | 31.6 [27.5; 36.8] (12.7 to 46.3) | 58.6 [48.5; 76.4] (25.9 to 179.3) | <0.001 | 0.969 (0.948 to 0.99) | 42.7 | 96.3 (90.7 to 100) | 90.8 (85.9 to 95.1) |
| PHI density | 0.48 [0.38; 0.67] (0.18 to 1.89) | 1.36 [0.89; 1.99] (0.25 to 6.61) | <0.001 | 0.889 (0.835 to 0.944) | 0.781 | 85.2 (75.9 to 94.4) | 81.7 (74.6 to 88) |
| Studied Variables | No csPCa (n = 26; 22.0%) | csPCa (n = 90; 78.0%) | p-Value | AUC (95% CI) | Best Threshold | Specificity (95% CI) | Sensitivity (95% CI) |
|---|---|---|---|---|---|---|---|
| Age | 64.3 ± 7.3 (48 to 79) | 65.9 ± 6.8 (49 to 81) | 0.311 | - | |||
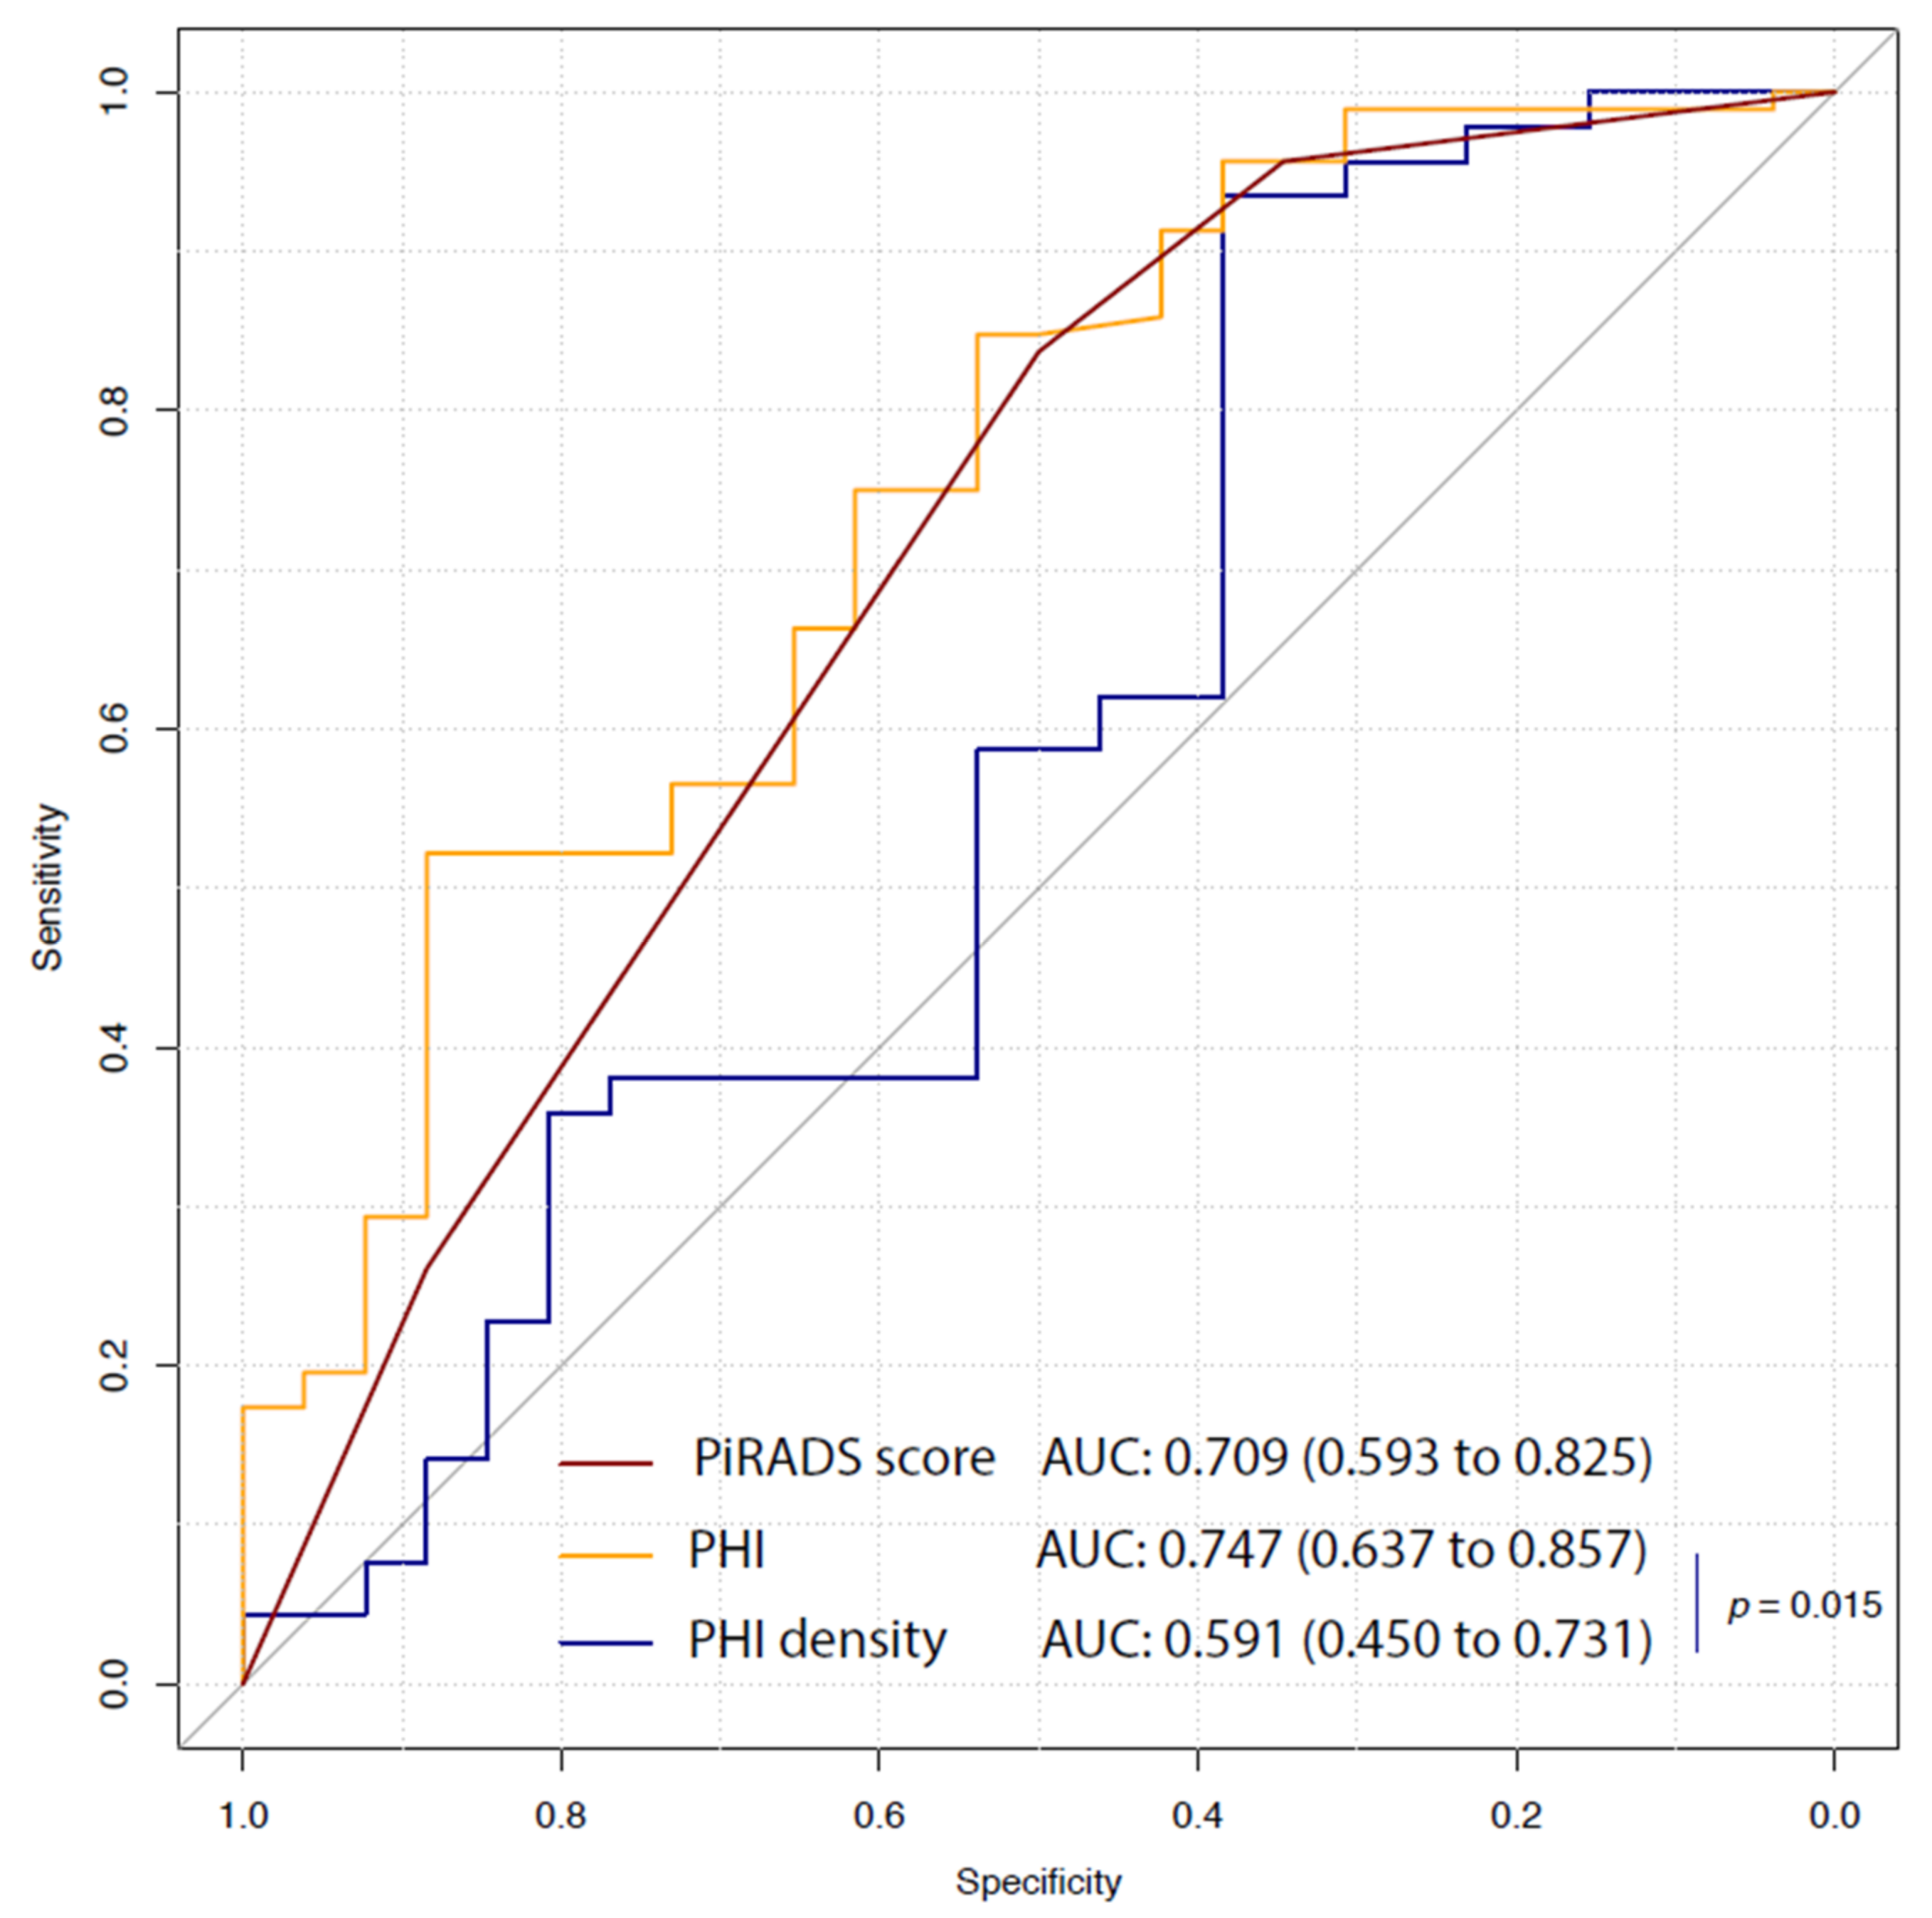
| PI-RADS score | 3.5 [2; 4] (2 to 5) | 4 [4; 5] (2 to 5) | <0.001 | 0.709 (0.593 to 0.825) | 4 | 50 (30.8 to 69.2) | 85.6 (77.8 to 92.2) |
| Prostate volume (mL) | 47 [26.5; 80] (12 to 95) | 46 [33; 61.2] (14 to 120) | 0.61 | 0.467 (0.314 to 0.62) | 77.5 | 26.9 (11.5 to 46.2) | 88.9 (82.2 to 94.4) |
| PSA (ng/mL) | 6.1 ± 1.7 (3.1 to 9.1) | 6.6 ± 2.1 (2.6 to 10.4) | 0.197 | 0.568 (0.451 to 0.685) | 6.6 | 73.1 (53.8 to 88.5) | 52.2 (42.2 to 62.2) |
| PSA density | 13.54 [7.1; 18.46] (4 to 76) | 12.97 [9; 21.32] (5 to 32) | 0.596 | 0.588 (0.448 to 0.728) | 12.3 | 38.5 (19.2 to 57.7) | 90 (83.3 to 95.6) |
| fPSA (ng/mL) | 0.95 [0.55; 1.4] (0.17 to 2.11) | 0.7 [0.56; 1.12] (0.32 to 2.27) | 0.171 | 0.466 (0.329 to 0.602) | 1.33 | 61.5 (42.3 to 80.8) | 48.9 (38.9 to 58.9) |
| fPSA/tPSA ratio | 15.1 [9.5; 25.7] (3.8 to 34.6) | 12.5 [7.9; 16.6] (4 to 26.1) | 0.061 | 0.621 (0.485 to 0.758) | 14.9 | 26.9 (11.5 to 46.2) | 97.8 (94.4 to 100) |
| p2PSA (pg/mL) | 17.7 [12.0; 27.8] (3.3 to 38.5) | 18.4 [13.9; 28.9] (8.4 to 55.2) | 0.585 | 0.535 (0.4 to 0.671) | 10.7 | 23.1 (7.7 to 42.3) | 94.4 (88.9 to 98.9) |
| p2PSA/fPSA ratio | 1.28 [0.88; 1.49] (0.7 to 2.29) | 1.73 [1.17; 2.23] (0.83 to 4.64) | 0.001 | 0.72 (0.614 to 0.826) | 1.56 | 80.8 (65.4 to 92.3) | 56.7 (46.7 to 66.7) |
| PHI | 48.3 [39.3; 60.9] (30.7 to 87.9) | 66.3 [51.9; 81.2] (34.2 to 179.3) | <0.001 | 0.747 (0.637 to 0.857) | 61.68 | 88.5 (76.9 to 100) | 53.3 (43.3 to 63.3) |
| PHI density | 1.26 [0.6; 1.67] (0.39 to 5.07) | 1.45 [0.94; 2.05] (0.54 to 5.97) | 0.161 | 0.591 (0.45 to 0.731) | 0.66 | 38.5 (19.2 to 57.7) | 93.3 (87.8 to 97.8) |
| Variables in the Model | Base Model | Base Model + PHI | Base Model + PI-RADS |
|---|---|---|---|
| Age | 1.06 (0.99 to 1.14); p = 0.112 | 1.06 (0.98 to 1.14); p = 0.158 | 1.04 (0.97 to 1.13); p = 0.276 |
| PSA | 1.05 (0.82 to 1.33); p = 0.71 | 0.92 (0.71 to 1.2); p = 0.554 | 1.07 (0.81 to 1.4); p = 0.65 |
| fPSA/tPSA | 0.9 (0.83 to 0.97); p = 0.009 | 0.94 (0.87 to 1.02); p = 0.166 | 0.88 (0.81 to 0.97); p = 0.007 |
| Prostate volume | 1 (0.98 to 1.02); p = 0.833 | 1.01 (0.99 to 1.03); p = 0.492 | 1.01 (0.99 to 1.04); p = 0.333 |
| PHI | - | 1.06 (1.02 to 1.1); p = 0.004 | - |
| PI-RADS score | - | - | 3.03 (1.7 to 5.42); p < 0.001 |
| AUC (95% CI) | 0.680 (0.557 to 0.803) | 0.784 (0.676 to 0.891) | 0.786 (0.66 to 0.912) |
| p for AUC comparison | ref | 0.045 | 0.026 |
Publisher’s Note: MDPI stays neutral with regard to jurisdictional claims in published maps and institutional affiliations. |
© 2021 by the authors. Licensee MDPI, Basel, Switzerland. This article is an open access article distributed under the terms and conditions of the Creative Commons Attribution (CC BY) license (https://creativecommons.org/licenses/by/4.0/).
Share and Cite
Ferro, M.; Crocetto, F.; Bruzzese, D.; Imbriaco, M.; Fusco, F.; Longo, N.; Napolitano, L.; La Civita, E.; Cennamo, M.; Liotti, A.; et al. Prostate Health Index and Multiparametric MRI: Partners in Crime Fighting Overdiagnosis and Overtreatment in Prostate Cancer. Cancers 2021, 13, 4723. https://doi.org/10.3390/cancers13184723
Ferro M, Crocetto F, Bruzzese D, Imbriaco M, Fusco F, Longo N, Napolitano L, La Civita E, Cennamo M, Liotti A, et al. Prostate Health Index and Multiparametric MRI: Partners in Crime Fighting Overdiagnosis and Overtreatment in Prostate Cancer. Cancers. 2021; 13(18):4723. https://doi.org/10.3390/cancers13184723
Chicago/Turabian StyleFerro, Matteo, Felice Crocetto, Dario Bruzzese, Massimo Imbriaco, Ferdinando Fusco, Nicola Longo, Luigi Napolitano, Evelina La Civita, Michele Cennamo, Antonietta Liotti, and et al. 2021. "Prostate Health Index and Multiparametric MRI: Partners in Crime Fighting Overdiagnosis and Overtreatment in Prostate Cancer" Cancers 13, no. 18: 4723. https://doi.org/10.3390/cancers13184723