
A Transcriptomic Approach Reveals Selective Ribosomal Remodelling in the Tumour Versus the Stromal Compartment of Metastatic Colorectal Cancer

 , , and
Abstract
:Simple Summary
Abstract
1. Introduction
2. Materials and Methods
2.1. Sample Preparation
2.2. RNA Extraction and Quality Control
2.3. Microarray Analysis
2.4. Data Analysis
3. Results
3.1. RNA Extraction and Array Hybridisation
3.2. Differential Gene Expression
3.3. Functional Enrichment Analysis
3.4. Ribosomal Gene Set Enrichment Analysis
4. Discussion
5. Conclusions
Supplementary Materials
Author Contributions
Funding
Institutional Review Board Statement
Informed Consent Statement
Data Availability Statement
Acknowledgments
Conflicts of Interest
References
- Bhowmick, N.A.; Neilson, E.G.; Moses, H.L. Stromal fibroblasts in cancer initiation and progression. Nature 2004, 432, 332–337. [Google Scholar] [CrossRef] [PubMed]
- Shimoda, M.; Mellody, K.T.; Orimo, A. Carcinoma-associated fibroblasts are a rate-limiting determinant for tumour progression. Semin. Cell Dev. Biol. 2010, 21, 19–25. [Google Scholar] [CrossRef] [PubMed]
- Conti, J.; Thomas, G. The Role of Tumour Stroma in Colorectal Cancer Invasion and Metastasis. Cancers 2011, 3, 2160–2168. [Google Scholar] [CrossRef] [PubMed] [Green Version]
- Arcangeli, A. Ion channels and transporters in cancer. 3. Ion channels in the tumor cell-microenvironment cross talk. Am. J. Physiol. Physiol. 2011, 301, C762–C771. [Google Scholar] [CrossRef] [PubMed] [Green Version]
- Peddareddigari, V.G.; Wang, D.; DuBois, R.N. The Tumor Microenvironment in Colorectal Carcinogenesis. Cancer Microenviron. 2010, 3, 149–166. [Google Scholar] [CrossRef] [PubMed] [Green Version]
- Fukino, K.; Shen, L.; Patocs, A.; Mutter, G.L.; Eng, C. Genomic Instability Within Tumor Stroma and Clinicopathological Characteristics of Sporadic Primary Invasive Breast Carcinoma. JAMA 2007, 297, 2103–2111. [Google Scholar] [CrossRef]
- Patocs, A.; Zhang, L.; Xu, Y.; Weber, F.; Caldes, T.; Mutter, G.L.; Platzer, P.; Eng, C. Breast-Cancer Stromal Cells withTP53Mutations and Nodal Metastases. N. Engl. J. Med. 2007, 357, 2543–2551. [Google Scholar] [CrossRef]
- Smith, M.J.F.; Coffey, J.C.; Wang, J.H.; Cotter, T.G.; Redmond, H.P.; Bezerra, J.A.; Aronow, B.J. Gene expression profiling in biliary atresia. Lancet 2003, 361, 971–972. [Google Scholar] [CrossRef]
- Sung, H.; Ferlay, J.; Siegel, R.L.; Laversanne, M.; Soerjomataram, I.; Jemal, A.; Bray, F. Global Cancer Statistics 2020: GLOBOCAN Estimates of Incidence and Mortality Worldwide for 36 Cancers in 185 Countries. CA Cancer J. Clin. 2021, 71, 209–249. [Google Scholar] [CrossRef]
- Fridman, W.H.; Miller, I.; Sautes-Fridman, C.; Byrne, A. Therapeutic Targeting of the Colorectal Tumor Stroma. Gastroenterology 2020, 158, 303–321. [Google Scholar] [CrossRef]
- Merlos-Suárez, A.; Barriga, F.; Jung, P.; Iglesias, M.; Céspedes, M.V.; Rossell, D.; Sevillano, M.; Hernando-Momblona, X.; da Silva-Diz, V.; Muñoz, P.; et al. The Intestinal Stem Cell Signature Identifies Colorectal Cancer Stem Cells and Predicts Disease Relapse. Cell Stem Cell 2011, 8, 511–524. [Google Scholar] [CrossRef] [PubMed] [Green Version]
- Dalerba, P.; Kalisky, T.; Sahoo, D.; Rajendran, P.S.; Rothenberg, M.; Leyrat, A.; Sim, S.; Okamoto, J.; Johnston, D.M.; Qian, D.; et al. Single-cell dissection of transcriptional heterogeneity in human colon tumors. Nat. Biotechnol. 2011, 29, 1120–1127. [Google Scholar] [CrossRef] [PubMed]
- Zhang, R.; Song, W.; Wang, K.; Zou, S. Tumor-stroma ratio(TSR) as a potential novel predictor of prognosis in digestive system cancers: A meta-analysis. Clin. Chim. Acta 2017, 472, 64–68. [Google Scholar] [CrossRef] [PubMed]
- Danielsen, H.; Hveem, T.; Domingo, E.; Pradhan, M.; Kleppe, A.; Syvertsen, R.; Kostolomov, I.; Nesheim, J.; Askautrud, H.; Nesbakken, A.; et al. Prognostic markers for colorectal cancer: Estimating ploidy and stroma. Ann. Oncol. 2017, 29, 616–623. [Google Scholar] [CrossRef] [PubMed]
- Van Pelt, G.W.; Sandberg, T.P.; Morreau, H.; Gelderblom, H.; van Krieken, J.; Tollenaar, R.A.E.M.; Mesker, W. The tumour-stroma ratio in colon cancer: The biological role and its prognostic impact. Histopathology 2018, 73, 197–206. [Google Scholar] [CrossRef] [Green Version]
- Sugiyama, Y.; Farrow, B.; Murillo, C.; Li, J.; Watanabe, H.; Sugiyama, K.; Evers, B.M. Analysis of differential gene expression patterns in colon cancer and cancer stroma using microdissected tissues. Gastroenterology 2005, 128, 480–486. [Google Scholar] [CrossRef]
- Smith, M.J.; Culhane, A.C.; Donovan, M.; Coffey, J.C.; Barry, B.D.; Kelly, M.; Higgins, D.G.; Wang, J.H.; Kirwan, W.; Cotter, T.G.; et al. Analysis of differential gene expression in colorectal cancer and stroma using fluorescence-activated cell sorting purification. Br. J. Cancer 2009, 100, 1452–1464. [Google Scholar] [CrossRef] [Green Version]
- Xu, L.; Wang, R.; Ziegelbauer, J.; Wu, W.W.; Shen, R.-F.; Juhl, H.; Zhang, Y.; Pelosof, L.; Rosenberg, A.S. Transcriptome analysis of human colorectal cancer biopsies reveals extensive expression correlations among genes related to cell proliferation, lipid metabolism, immune response and collagen catabolism. Oncotarget 2017, 8, 74703–74719. [Google Scholar] [CrossRef] [Green Version]
- Scarpati, G.D.V.; Calura, E.; Di Marino, M.; Romualdi, C.; Beltrame, L.; Malapelle, U.; Troncone, G.; De Stefano, A.; Pepe, S.; De Placido, S.; et al. Analysis of Differential miRNA Expression in Primary Tumor and Stroma of Colorectal Cancer Patients. BioMed. Res. Int. 2014, 2014, 840921. [Google Scholar] [CrossRef]
- Breitling, R.; Armengaud, P.; Amtmann, A.; Herzyk, P. Rank products: A simple, yet powerful, new method to detect differentially regulated genes in replicated microarray experiments. FEBS Lett. 2004, 573, 83–92. [Google Scholar] [CrossRef] [PubMed]
- Heskes, T.; Eisinga, R.; Breitling, R. A fast algorithm for determining bounds and accurate approximate p-values of the rank product statistic for replicate experiments. BMC Bioinform. 2014, 15, 367. [Google Scholar] [CrossRef] [Green Version]
- Eisinga, R.; Breitling, R.; Heskes, T. The exact probability distribution of the rank product statistics for replicated experiments. FEBS Lett. 2013, 587, 677–682. [Google Scholar] [CrossRef]
- Hong, F.; Breitling, R.; McEntee, C.W.; Wittner, B.S.; Nemhauser, J.L.; Chory, J. RankProd: A bioconductor package for detecting differentially expressed genes in meta-analysis. Bioinformatics 2006, 22, 2825–2827. [Google Scholar] [CrossRef] [Green Version]
- Del Carratore, F.; Jankevics, A.; Eisinga, R.; Heskes, T.; Hong, F.; Breitling, R. RankProd 2.0: A refactored bioconductor package for detecting differentially expressed features in molecular profiling datasets. Bioinformatics 2017, 33, 2774–2775. [Google Scholar] [CrossRef] [PubMed] [Green Version]
- Benjamini, Y.; Drai, D.; Elmer, G.; Kafkafi, N.; Golani, I. Controlling the false discovery rate in behavior genetics research. Behav. Brain Res. 2001, 125, 279–284. [Google Scholar] [CrossRef] [Green Version]
- Chen, J.; Bardes, E.E.; Aronow, B.J.; Jegga, A.G. ToppGene Suite for gene list enrichment analysis and candidate gene prioritization. Nucleic Acids Res. 2009, 37. [Google Scholar] [CrossRef] [PubMed]
- Subramanian, A.; Tamayo, P.; Mootha, V.K.; Mukherjee, S.; Ebert, B.L.; Gillette, M.A.; Paulovich, A.; Pomeroy, S.L.; Golub, T.R.; Lander, E.S.; et al. Gene set enrichment analysis: A knowledge-based approach for interpreting genome-wide expression profiles. Proc. Natl. Acad. Sci. USA 2005, 102, 15545–15550. [Google Scholar] [CrossRef] [PubMed] [Green Version]
- Shen, R.; Li, P.; Li, B.; Zhang, B.; Feng, L.; Cheng, S. Identification of Distinct Immune Subtypes in Colorectal Cancer Based on the Stromal Compartment. Front. Oncol. 2020, 9, 1497. [Google Scholar] [CrossRef] [PubMed]
- Lin, A.Y.; Chua, M.-S.; Choi, Y.-L.; Yeh, W.; Kim, Y.H.; Azzi, R.; Adams, G.A.; Sainani, K.; Van De Rijn, M.; So, S.K.; et al. Comparative Profiling of Primary Colorectal Carcinomas and Liver Metastases Identifies LEF1 as a Prognostic Biomarker. PLoS ONE 2011, 6, e16636. [Google Scholar] [CrossRef] [Green Version]
- Chlenski, A.; Cohn, S.L. Modulation of matrix remodeling by SPARC in neoplastic progression. Semin. Cell Dev. Biol. 2010, 21, 55–65. [Google Scholar] [CrossRef]
- Goldman, M.J.; Craft, B.; Hastie, M.; Repečka, K.; McDade, F.; Kamath, A.; Banerjee, A.; Luo, Y.; Rogers, D.; Brooks, A.N.; et al. Visualizing and interpreting cancer genomics data via the Xena platform. Nat. Biotechnol. 2020, 38, 675–678. [Google Scholar] [CrossRef]
- The GTEx Consortium. The GTEx Consortium atlas of genetic regulatory effects across human tissues. Science 2020, 369, 1318–1330. [Google Scholar] [CrossRef] [PubMed]
- Bradner, J.E.; Hnisz, D.; Young, R.A. Transcriptional Addiction in Cancer. Cell 2017, 168, 629–643. [Google Scholar] [CrossRef] [Green Version]
- Dang, C.V. Links between metabolism and cancer. Genes Dev. 2012, 26, 877–890. [Google Scholar] [CrossRef] [PubMed] [Green Version]
- Drygin, D.; Rice, W.G.; Grummt, I. The RNA Polymerase I Transcription Machinery: An Emerging Target for the Treatment of Cancer. Annu. Rev. Pharmacol. Toxicol. 2010, 50, 131–156. [Google Scholar] [CrossRef]
- Gaviraghi, M.; Vivori, C.; Tonon, G. How Cancer Exploits Ribosomal RNA Biogenesis: A Journey beyond the Boundaries of rRNA Transcription. Cells 2019, 8, 1098. [Google Scholar] [CrossRef] [PubMed] [Green Version]
- Bellido, F.; Sowada, N.; Mur, P.; Lázaro, C.; Pons, T.; Valdés-Mas, R.; Pineda, M.; Aiza, G.; Iglesias, S.; Soto, J.L.; et al. Association Between Germline Mutations in BRF1, a Subunit of the RNA Polymerase III Transcription Complex, and Hereditary Colorectal Cancer. Gastroenterology 2018, 154, 181–194. [Google Scholar] [CrossRef] [PubMed] [Green Version]
- Slimane, S.N.; Marcel, V.; Fenouil, T.; Catez, F.; Saurin, J.C.; Bouvet, P.; Diaz, J.J.; Mertani, H.C. Ribosome Biogenesis Altera-tions in Colorectal Cancer. Cells 2020, 9, 2361. [Google Scholar] [CrossRef] [PubMed]
- Nieminen, T.T.; O’Donohue, M.-F.; Wu, Y.; Lohi, H.; Scherer, S.; Paterson, A.D.; Ellonen, P.; Abdel-Rahman, W.M.; Valo, S.; Mecklin, J.-P.; et al. Germline Mutation of RPS20, Encoding a Ribosomal Protein, Causes Predisposition to Hereditary Nonpolyposis Colorectal Carcinoma Without DNA Mismatch Repair Deficiency. Gastroenterology 2014, 147, 595–598.e5. [Google Scholar] [CrossRef] [PubMed] [Green Version]
- Gilles, A.; Frechin, L.; Natchiar, K.; Biondani, G.; Loeffelholz, O.; von Holvec, S.; Malaval, J.L.; Winum, J.Y.; Klaholz, B.P.; Peyron, J.F. Targeting the Human 80S Ribosome in Cancer: From Structure to Function and Drug Design for Innovative Adjuvant Therapeutic Strategies. Cells 2020, 9, 629. [Google Scholar] [CrossRef] [Green Version]
- Charitou, T.; Srihari, S.; Lynn, M.A.; Jarboui, M.A.; Fasterius, E.; Moldovan, M.; Shirasawa, S.; Tsunoda, T.; Ueffing, M.; Xie, J.; et al. Transcriptional and metabolic rewiring of colorectal cancer cells expressing the oncogenic KRASG13D mutation. Br. J. Cancer 2019, 121, 37–50. [Google Scholar] [CrossRef] [Green Version]
- Warburg, O. On the Origin of Cancer Cells. Science 1956, 123, 309–314. [Google Scholar] [CrossRef] [PubMed]
- Nanda, C.S.; Venkateswaran, S.V.; Patani, N.; Yuneva, M. Defining a metabolic landscape of tumours: Genome meets metabolism. Br. J. Cancer 2019, 122, 136–149. [Google Scholar] [CrossRef] [PubMed]
- Sun, L.; Suo, C.; Li, S.-T.; Zhang, H.; Gao, P. Metabolic reprogramming for cancer cells and their microenvironment: Beyond the Warburg Effect. Biochim. Biophys. Acta Bioenerg. 2018, 1870, 51–66. [Google Scholar] [CrossRef] [PubMed]
- Ashton, T.M.; McKenna, W.G.; Kunz-Schughart, L.A.; Higgins, G.S. Oxidative Phosphorylation as an Emerging Target in Cancer Therapy. Clin. Cancer Res. 2018, 24, 2482–2490. [Google Scholar] [CrossRef] [PubMed] [Green Version]
- Magi, A.; Masselli, M.; Sala, C.; Guerriero, A.; Laise, P.; Puccini, B.; Rigacci, L.; Breschi, C.; Crociani, O.; Pillozzi, S.; et al. The ion channels and transporters gene expression profile indicates a shift in excitability and metabolisms during malignant progression of Follicular Lymphoma. Sci. Rep. 2019, 9, 8586. [Google Scholar] [CrossRef] [PubMed]


| Feature | Distribution within the Cohort |
|---|---|
| Gender | Female, 5 (83.3%) |
| Male, 1 (16.7%) | |
| Localisation | Right colon, 4 (66.6%) |
| Transverse, 1 (16.7%) | |
| Rectum, 1 (16.7%) | |
| Grading | G1, 0 (0%) |
| G2, 3 (50.0%) | |
| G3, 1 (16.7%) | |
| Undefined, 2 (33.3%) | |
| Mucinous | No, 3 (50.0%) |
| Yes, 3 (50.0%) | |
| TNM stage at diagnosis | IIa, 2 (33.3%) |
| IIIb, 1 (16.7%) | |
| IV, 3 (50.0%) | |
| Metastases | Liver, 5 |
| Lung, 2 | |
| Abdominal Lymph nodes, 3 | |
| Other, 2 | |
| Pleural effusion | No, 5 (83.3%) |
| Yes, 1 (16.7%) | |
| Ascitic effusion | No, 4 (66.7%) |
| Yes, 2 (33.3%) | |
| Local relapse | No, 6 (100%) |
| Yes, 0 (0.0%) | |
| Vascular invasion | No, 6 (100.0%) |
| Yes, 0 (0.0%) | |
| Perineural invasion | No, 6 (100%) |
| Yes, 0 (0.0%) | |
| KRAS mutations | No, 0 (0.0%) |
| Codon 12, 4 (66.7%) | |
| Codon 13, 2 (33.3%) | |
| BRAF mutations | No, 6 (100.0%) |
| Yes, 0 (0.0%) |
| Probe ID | Gene Symbol | Description | log2FC | p-Value | q-Value BH-FDR |
|---|---|---|---|---|---|
| A_33_P3323501 | PHGR1 | proline, histidine, and glycine-rich 1 | 1.95 | 1.60 × 10⁻¹³ | 4.09 × 10⁻⁹ |
| A_23_P167168 | JCHAIN | joining chain of multimeric IgA and IgM | 1.60 | 1.73 × 10⁻¹¹ | 1.47 × 10⁻⁷ |
| A_23_P61042 | IGHA2 | immunoglobulin heavy constant alpha 2 (A2m marker) | 1.58 | 8.54 × 10⁻¹⁰ | 1.82 × 10⁻⁶ |
| A_23_P46017 | KYAT3 | kynurenine aminotransferase 3 | 1.44 | 2.38 × 10⁻⁴ | 2.12 × 10⁻² |
| A_24_P181254 | OLFM4 | olfactomedin 4 | 1.35 | 2.06 × 10⁻⁹ | 3.51 × 10⁻⁶ |
| A_33_P3228460 | FXYD3 | FXYD domain containing ion transport regulator 3 | 1.27 | 8.47 × 10⁻¹¹ | 4.34 × 10⁻⁷ |
| A_23_P393099 | TFF3 | trefoil factor 3 | 1.16 | 6.16 × 10⁻¹⁰ | 1.43 × 10⁻⁶ |
| A_33_P3250443 | DUOXA2 | dual oxidase maturation factor 2 | 1.15 | 1.81 × 10⁻¹⁰ | 6.64 × 10⁻⁷ |
| A_33_P3368313 | MT1H | metallothionein 1H | 1.15 | 1.67 × 10⁻⁴ | 1.62 × 10⁻² |
| A_24_P844984 | PIGR | polymeric immunoglobulin receptor | 1.14 | 2.86 × 10⁻⁹ | 4.58 × 10⁻⁶ |
| A_33_P3362153 | TMEM238 | transmembrane protein 238 | 1.08 | 4.10 × 10⁻¹⁰ | 1.31 × 10⁻⁶ |
| A_33_P3244165 | RNA28SN5 | RNA, 28S ribosomal N5 | 1.05 | 1.31 × 10⁻⁵ | 2.40 × 10⁻³ |
| A_23_P49145 | ZG16 | zymogen granule protein 16 | 1.05 | 3.06 × 10⁻⁷ | 1.57 × 10⁻⁴ |
| A_23_P90743 | REG1A | regenerating family member 1 alpha | 1.05 | 1.55 × 10⁻⁶ | 5.23 × 10⁻⁴ |
| A_23_P208788 | C19orf33 | chromosome 19 open reading frame 33 | 1.03 | 7.92 × 10⁻¹¹ | 5.07 × 10⁻⁷ |
| A_33_P3329088 | PRSS8 | serine protease 8 | 0.99 | 1.60 × 10⁻¹⁰ | 6.81 × 10⁻⁷ |
| A_33_P3257678 | H3C15 | H3 clustered histone 15 | 0.97 | 9.43 × 10⁻⁹ | 1.15 × 10⁻⁵ |
| A_23_P402751 | TLE1 | TLE family member 1, transcriptional corepressor | 0.97 | 4.15 × 10⁻⁹ | 6.25 × 10⁻⁶ |
| A_23_P95790 | ITLN1 | intelectin 1 | 0.94 | 2.45 × 10⁻⁸ | 2.42 × 10⁻⁵ |
| A_33_P3385006 | SLC39A5 | solute carrier family 39 member 5 | 0.92 | 5.67 × 10⁻¹⁰ | 1.45 × 10⁻⁶ |
| A_23_P58266 | S100P | S100 calcium binding protein P | 0.85 | 2.02 × 10⁻⁸ | 2.15 × 10⁻⁵ |
| A_23_P79562 | FABP1 | fatty acid binding protein 1 | 0.84 | 3.30 × 10⁻⁸ | 2.91 × 10⁻⁵ |
| A_33_P3338698 | IHH | Indian hedgehog signaling molecule | 0.84 | 9.19 × 10⁻¹⁰ | 1.81 × 10⁻⁶ |
| A_23_P76961 | RPS29 | ribosomal protein S29 | 0.63 | 9.72 × 10⁻⁸ | 6.91 × 10⁻⁵ |
| A_33_P3393821 | C1R | complement C1r | −0.86 | 3.16 × 10⁻⁹ | 4.04 × 10⁻⁶ |
| A_23_P121533 | SPON2 | spondin 2 | −0.86 | 6.11 × 10⁻⁹ | 7.11 × 10⁻⁶ |
| A_33_P3239587 | MXRA7 | matrix-remodeling-associated 7 | −0.89 | 2.27 × 10⁻⁹ | 3.23 × 10⁻⁶ |
| A_23_P64873 | DCN | decorin | −0.91 | 2.86 × 10⁻⁹ | 3.86 × 10⁻⁶ |
| A_33_P3236858 | TGFB1I1 | transforming growth factor beta 1 induced transcript 1 | −0.92 | 3.07 × 10⁻¹⁰ | 7.87 × 10⁻⁷ |
| A_23_P200741 | DPT | dermatopontin | −0.94 | 2.66 × 10⁻⁸ | 2.27 × 10⁻⁵ |
| A_33_P3298159 | PTGDS | prostaglandin D2 synthase | −0.95 | 5.64 × 10⁻¹⁰ | 1.11 × 10⁻⁶ |
| A_33_P3287825 | CCDC136 | coiled-coil domain containing 136 | −0.96 | 8.63 × 10⁻⁷ | 3.40 × 10⁻⁴ |
| A_23_P211631 | FBLN1 | fibulin 1 | −0.99 | 4.03 × 10⁻¹⁰ | 9.37 × 10⁻⁷ |
| A_32_P46214 | SLC9A9 | solute carrier family 9 member A9 | −0.99 | 4.47 × 10⁻⁴ | 3.40 × 10⁻² |
| A_23_P205031 | COL4A2 | collagen type IV alpha 2 chain | −1.02 | 9.39 × 10⁻¹⁰ | 1.60 × 10⁻⁶ |
| A_23_P50946 | RAMP1 | receptor-activity-modifying protein 1 | −1.03 | 1.68 × 10⁻⁹ | 2.53 × 10⁻⁶ |
| A_33_P3361636 | MGP | matrix Gla protein | −1.04 | 1.28 × 10⁻⁸ | 1.42 × 10⁻⁵ |
| A_33_P3330039 | PLEKHO1 | pleckstrin homology domain-containing O1 | −1.09 | 9.78 × 10⁻¹¹ | 3.58 × 10⁻⁷ |
| A_33_P3233125 | PSD | pleckstrin and Sec7 domain-containing | −1.11 | 1.41 × 10⁻⁸ | 1.45 × 10⁻⁵ |
| A_32_P32254 | COL6A1 | collagen type VI alpha 1 chain | −1.13 | 1.91 × 10⁻¹⁰ | 5.44 × 10⁻⁷ |
| A_33_P3321657 | HSPG2 | heparan sulfate proteoglycan 2 | −1.16 | 9.81 × 10⁻¹¹ | 3.14 × 10⁻⁷ |
| A_33_P3333455 | EMILIN1 | elastin microfibril interfacer 1 | −1.18 | 2.99 × 10⁻¹¹ | 1.28 × 10⁻⁷ |
| A_33_P3268304 | LIMS2 | LIM zinc finger domain-containing 2 | −1.21 | 7.61 × 10⁻¹⁰ | 1.39 × 10⁻⁶ |
| A_23_P216501 | TPM2 | tropomyosin 2 | −1.21 | 1.38 × 10⁻⁹ | 2.21 × 10⁻⁶ |
| A_33_P3382177 | TIMP2 | TIMP metallopeptidase inhibitor 2 | −1.23 | 1.35 × 10⁻¹¹ | 6.89 × 10⁻⁸ |
| A_33_P3249872 | FBLN1 | fibulin 1 | −1.48 | 1.62 × 10⁻¹² | 2.07 × 10⁻⁸ |
| A_23_P125233 | CNN1 | calponin 1 | −1.56 | 5.52 × 10⁻¹⁰ | 1.18 × 10⁻⁶ |
| A_23_P394064 | CAVIN1 | Caveolae-associated protein 1 | −1.64 | 4.54 × 10⁻¹³ | 1.16 × 10⁻⁸ |
| A_23_P39955 | ACTG2 | actin gamma 2, smooth muscle | −1.85 | 1.21 × 10⁻¹¹ | 7.74 × 10⁻⁸ |
| A_33_P3275801 | DES | desmin | −1.92 | 1.07 × 10⁻¹¹ | 9.12 × 10⁻⁸ |
| Gene Symbol | Gene Name | log2FC | p-Value | q-Value | # Probes |
|---|---|---|---|---|---|
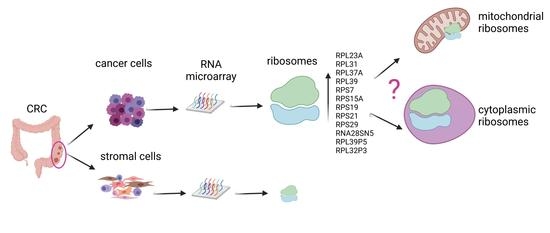
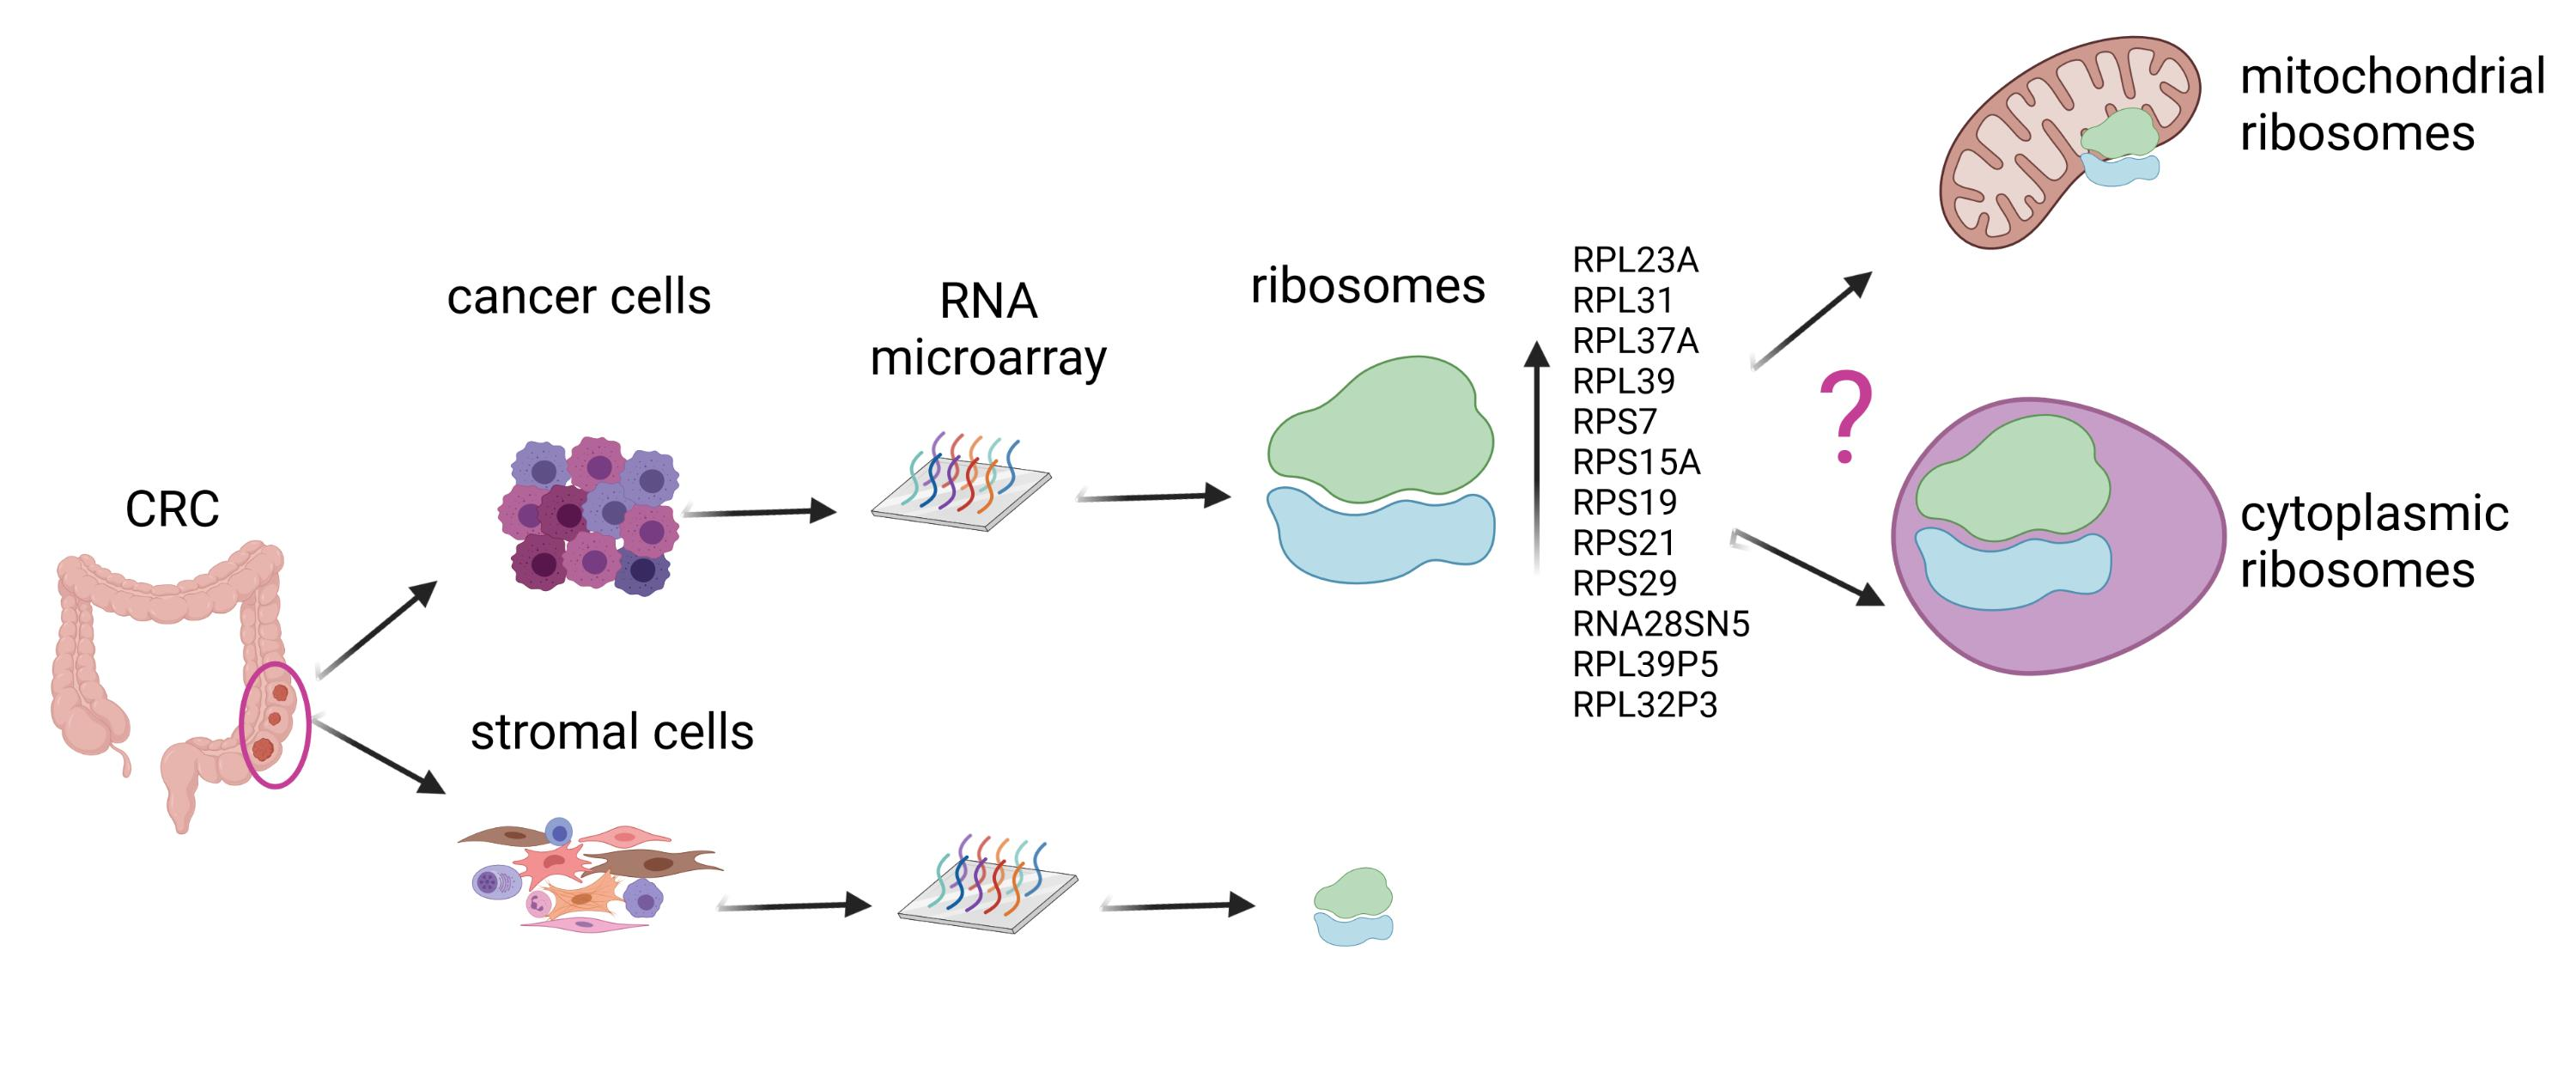
| RPL23A | ribosomal protein L23a | 0.54 | 7.08 × 10⁻⁶ | 1.56 × 10⁻³ | 1 |
| RPL31 | ribosomal protein L31 | 0.58 | 1.77 × 10⁻⁵ | 2.95 × 10⁻³ | 1 |
| RPL37A | ribosomal protein L37a | 0.62 | 5.67 × 10⁻⁶ | 1.37 × 10⁻³ | 1 |
| RPL39 | ribosomal protein L39 | 0.62 | 2.02 × 10⁻⁵ | 3.28 × 10⁻³ | 1 |
| RPS7 | ribosomal protein S7 | 0.57 | 2.14 × 10⁻⁴ | 1.98 × 10⁻² | 1 |
| RPS15A | ribosomal protein S15a | 0.59 | 3.29 × 10⁻⁷ | 1.56 × 10⁻⁴ | 2 |
| RPS19 | ribosomal protein S19 | 0.59 | 1.55 × 10⁻⁶ | 5.17 × 10⁻⁴ | 1 |
| RPS21 | ribosomal protein S21 | 0.63 | 1.88 × 10⁻⁷ | 1.07 × 10⁻⁴ | 2 |
| RPS29 | ribosomal protein S29 | 0.63 | 9.72 × 10⁻⁸ | 6.91 × 10⁻⁵ | 2 |
| RNA28SN5 | RNA, 28S ribosomal N5 | 1.05 | 1.31 × 10⁻⁵ | 2.40 × 10⁻³ | 2 |
| RPL39P5 | ribosomal protein L39 pseudogene 5 | 0.61 | 3.49 × 10⁻⁵ | 5.11 × 10⁻³ | 1 |
| RPL32P3 | ribosomal protein L32 pseudogene 3 | 0.56 | 1.61 × 10⁻⁴ | 1.59 × 10⁻² | 1 |
| Gene Set | Size | ES | NES | Nominal p-Value | q-Value BH-FDR | Leading Edge |
|---|---|---|---|---|---|---|
| CytoRibo_FullSet_80S | 75 | 0.47 | 4.84 | <10−3 | <10−3 | 58 (77.3%) |
| CytoRibo_LargeSU_60S | 45 | 0.52 | 4.10 | <10−3 | <10−3 | 36 (80.0%) |
| CytoRibo_SmallSU_40S | 30 | 0.43 | 2.81 | <10−3 | <10−3 | 22 (73.3%) |
| MitoRibo_FullSet_55S | 66 | 0.18 | 1.68 | 0.029 | 0.048 | 19 (28.8%) |
| MitoRibo_LargeSU_39S | 39 | 0.20 | 1.45 | 0.092 | 0.108 | 11 (28.2%) |
| MitoRibo_SmallSU_28S | 27 | 0.23 | 1.41 | 0.111 | 0.107 | -- |
Publisher’s Note: MDPI stays neutral with regard to jurisdictional claims in published maps and institutional affiliations. |
© 2021 by the authors. Licensee MDPI, Basel, Switzerland. This article is an open access article distributed under the terms and conditions of the Creative Commons Attribution (CC BY) license (https://creativecommons.org/licenses/by/4.0/).
Share and Cite
Lastraioli, E.; Ruffinatti, F.A.; Di Costanzo, F.; Sala, C.; Munaron, L.; Arcangeli, A. A Transcriptomic Approach Reveals Selective Ribosomal Remodelling in the Tumour Versus the Stromal Compartment of Metastatic Colorectal Cancer. Cancers 2021, 13, 4188. https://doi.org/10.3390/cancers13164188
Lastraioli E, Ruffinatti FA, Di Costanzo F, Sala C, Munaron L, Arcangeli A. A Transcriptomic Approach Reveals Selective Ribosomal Remodelling in the Tumour Versus the Stromal Compartment of Metastatic Colorectal Cancer. Cancers. 2021; 13(16):4188. https://doi.org/10.3390/cancers13164188
Chicago/Turabian StyleLastraioli, Elena, Federico Alessandro Ruffinatti, Francesco Di Costanzo, Cesare Sala, Luca Munaron, and Annarosa Arcangeli. 2021. "A Transcriptomic Approach Reveals Selective Ribosomal Remodelling in the Tumour Versus the Stromal Compartment of Metastatic Colorectal Cancer" Cancers 13, no. 16: 4188. https://doi.org/10.3390/cancers13164188