
Targeting BRF2 in Cancer Using Repurposed Drugs

 , ,
, ,  and
and
Abstract
:Simple Summary
Abstract

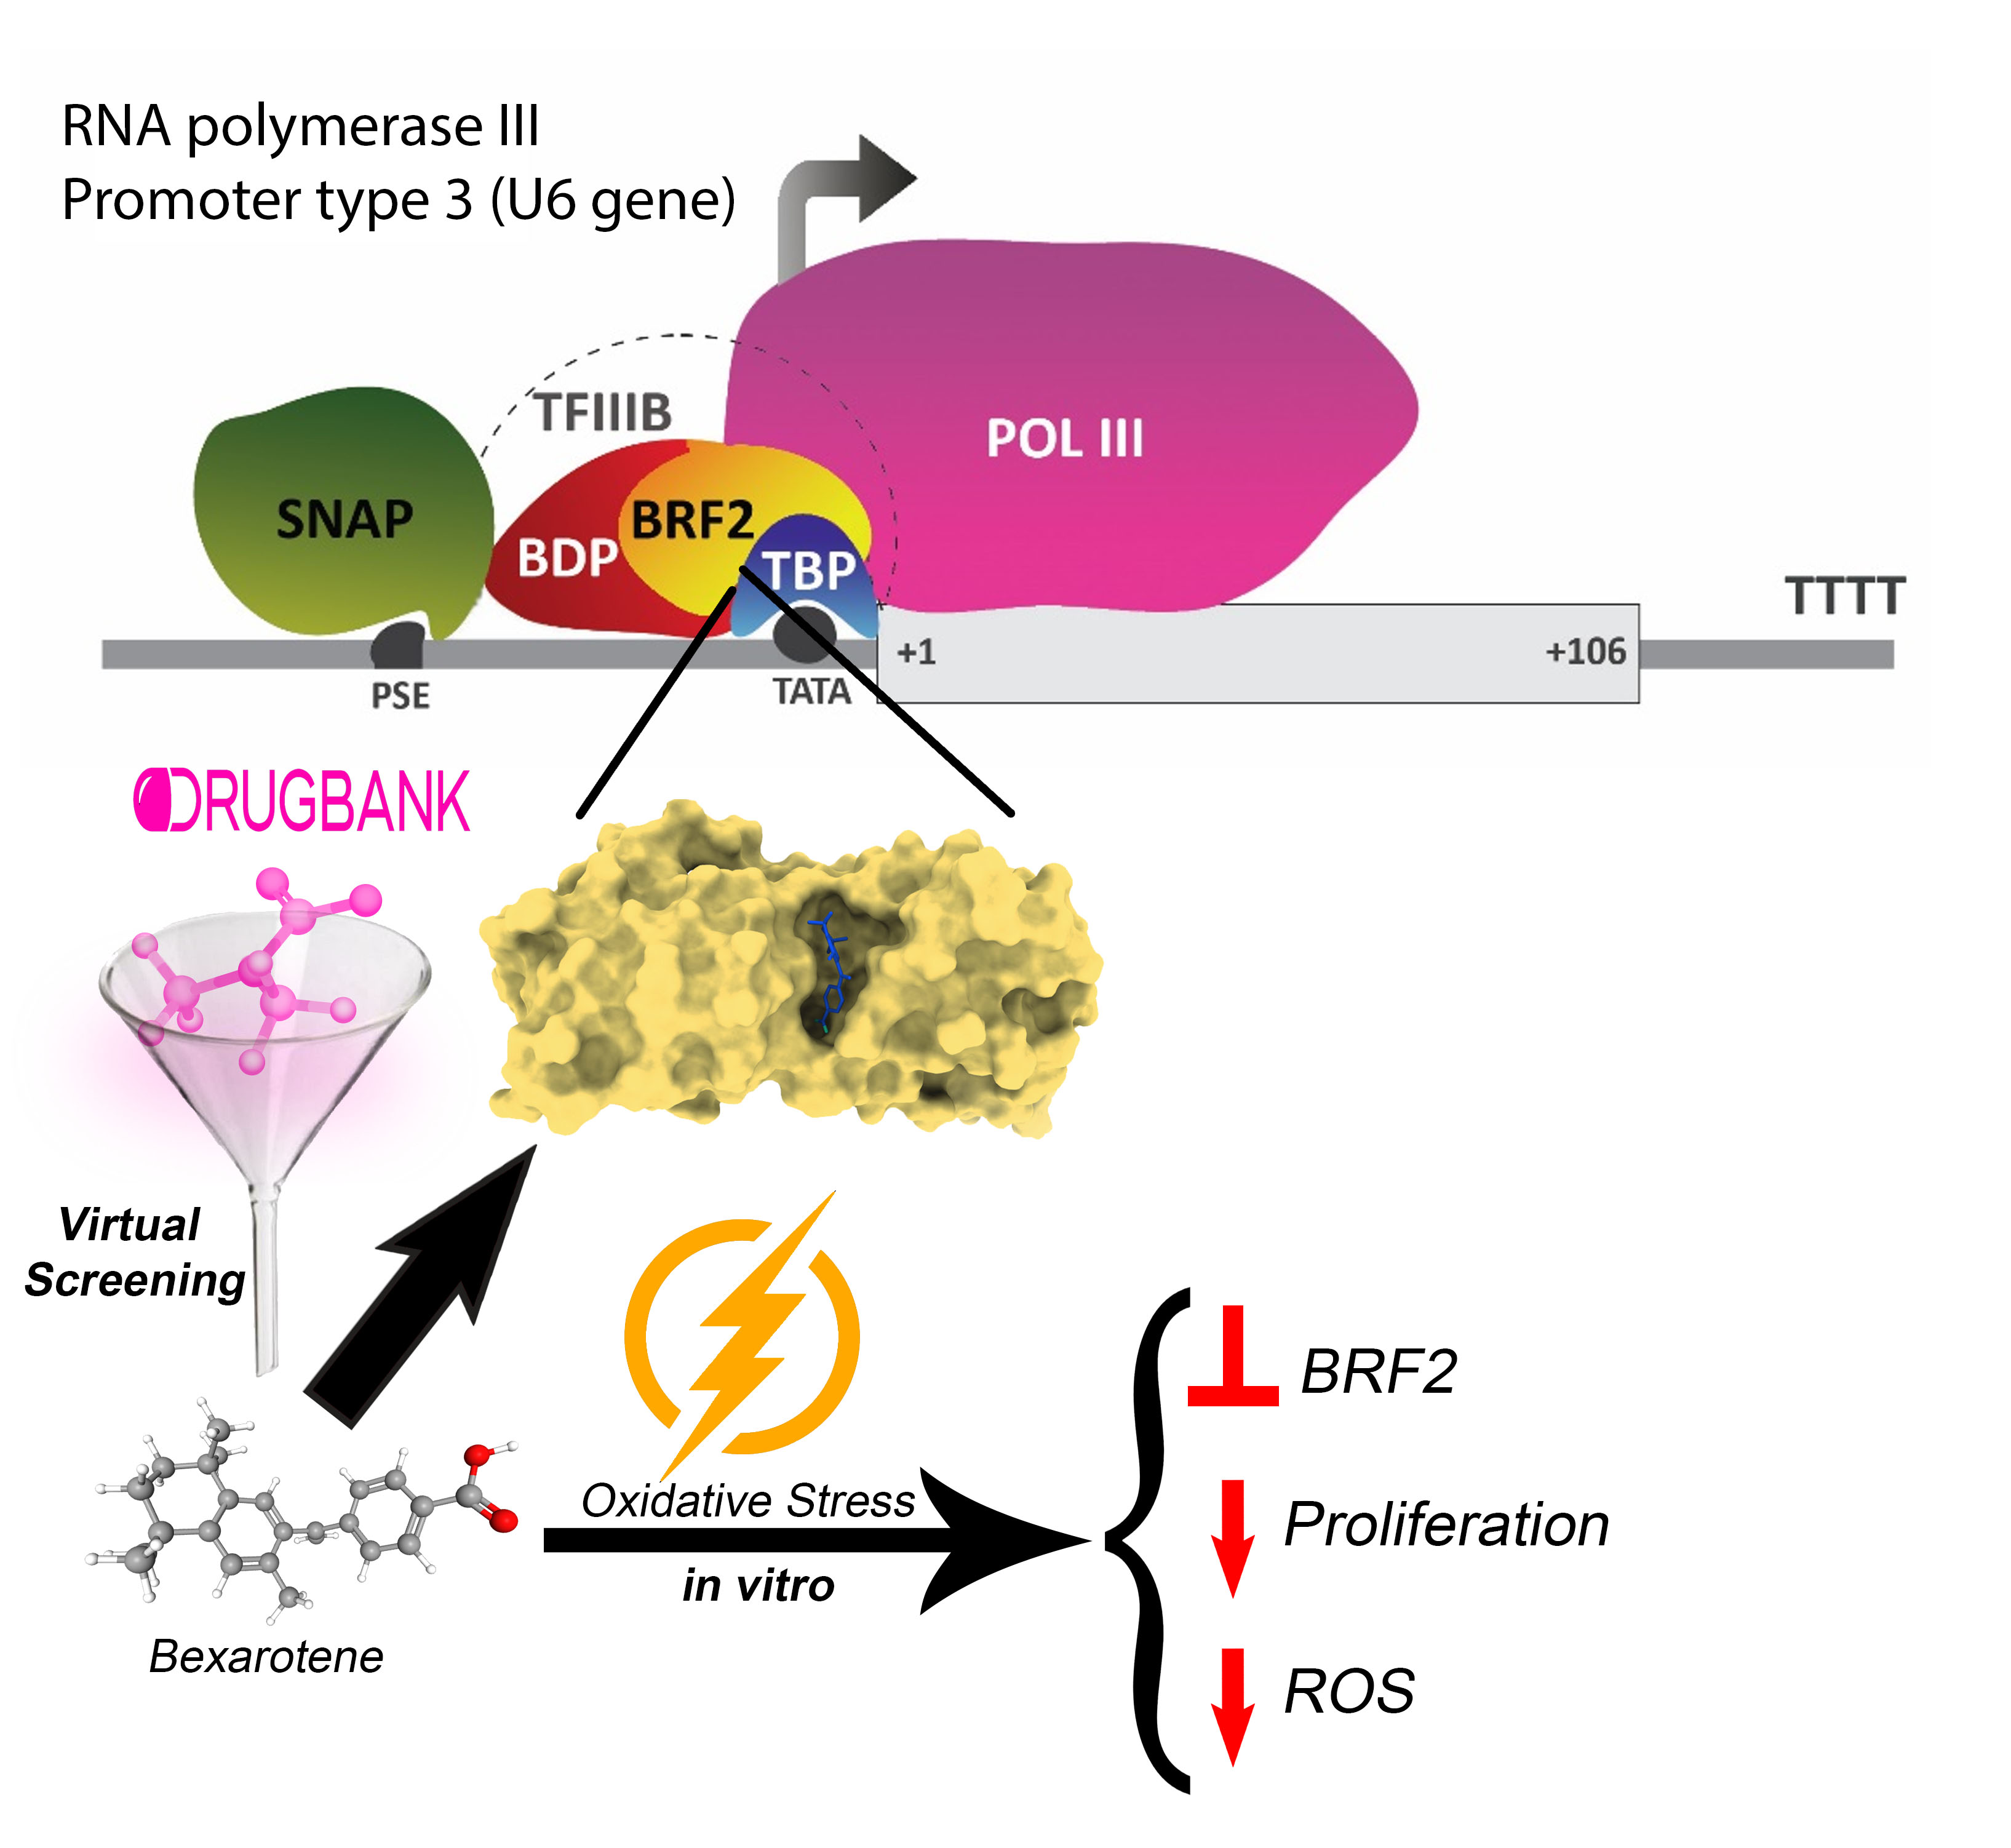
1. Introduction
2. Materials and Methods
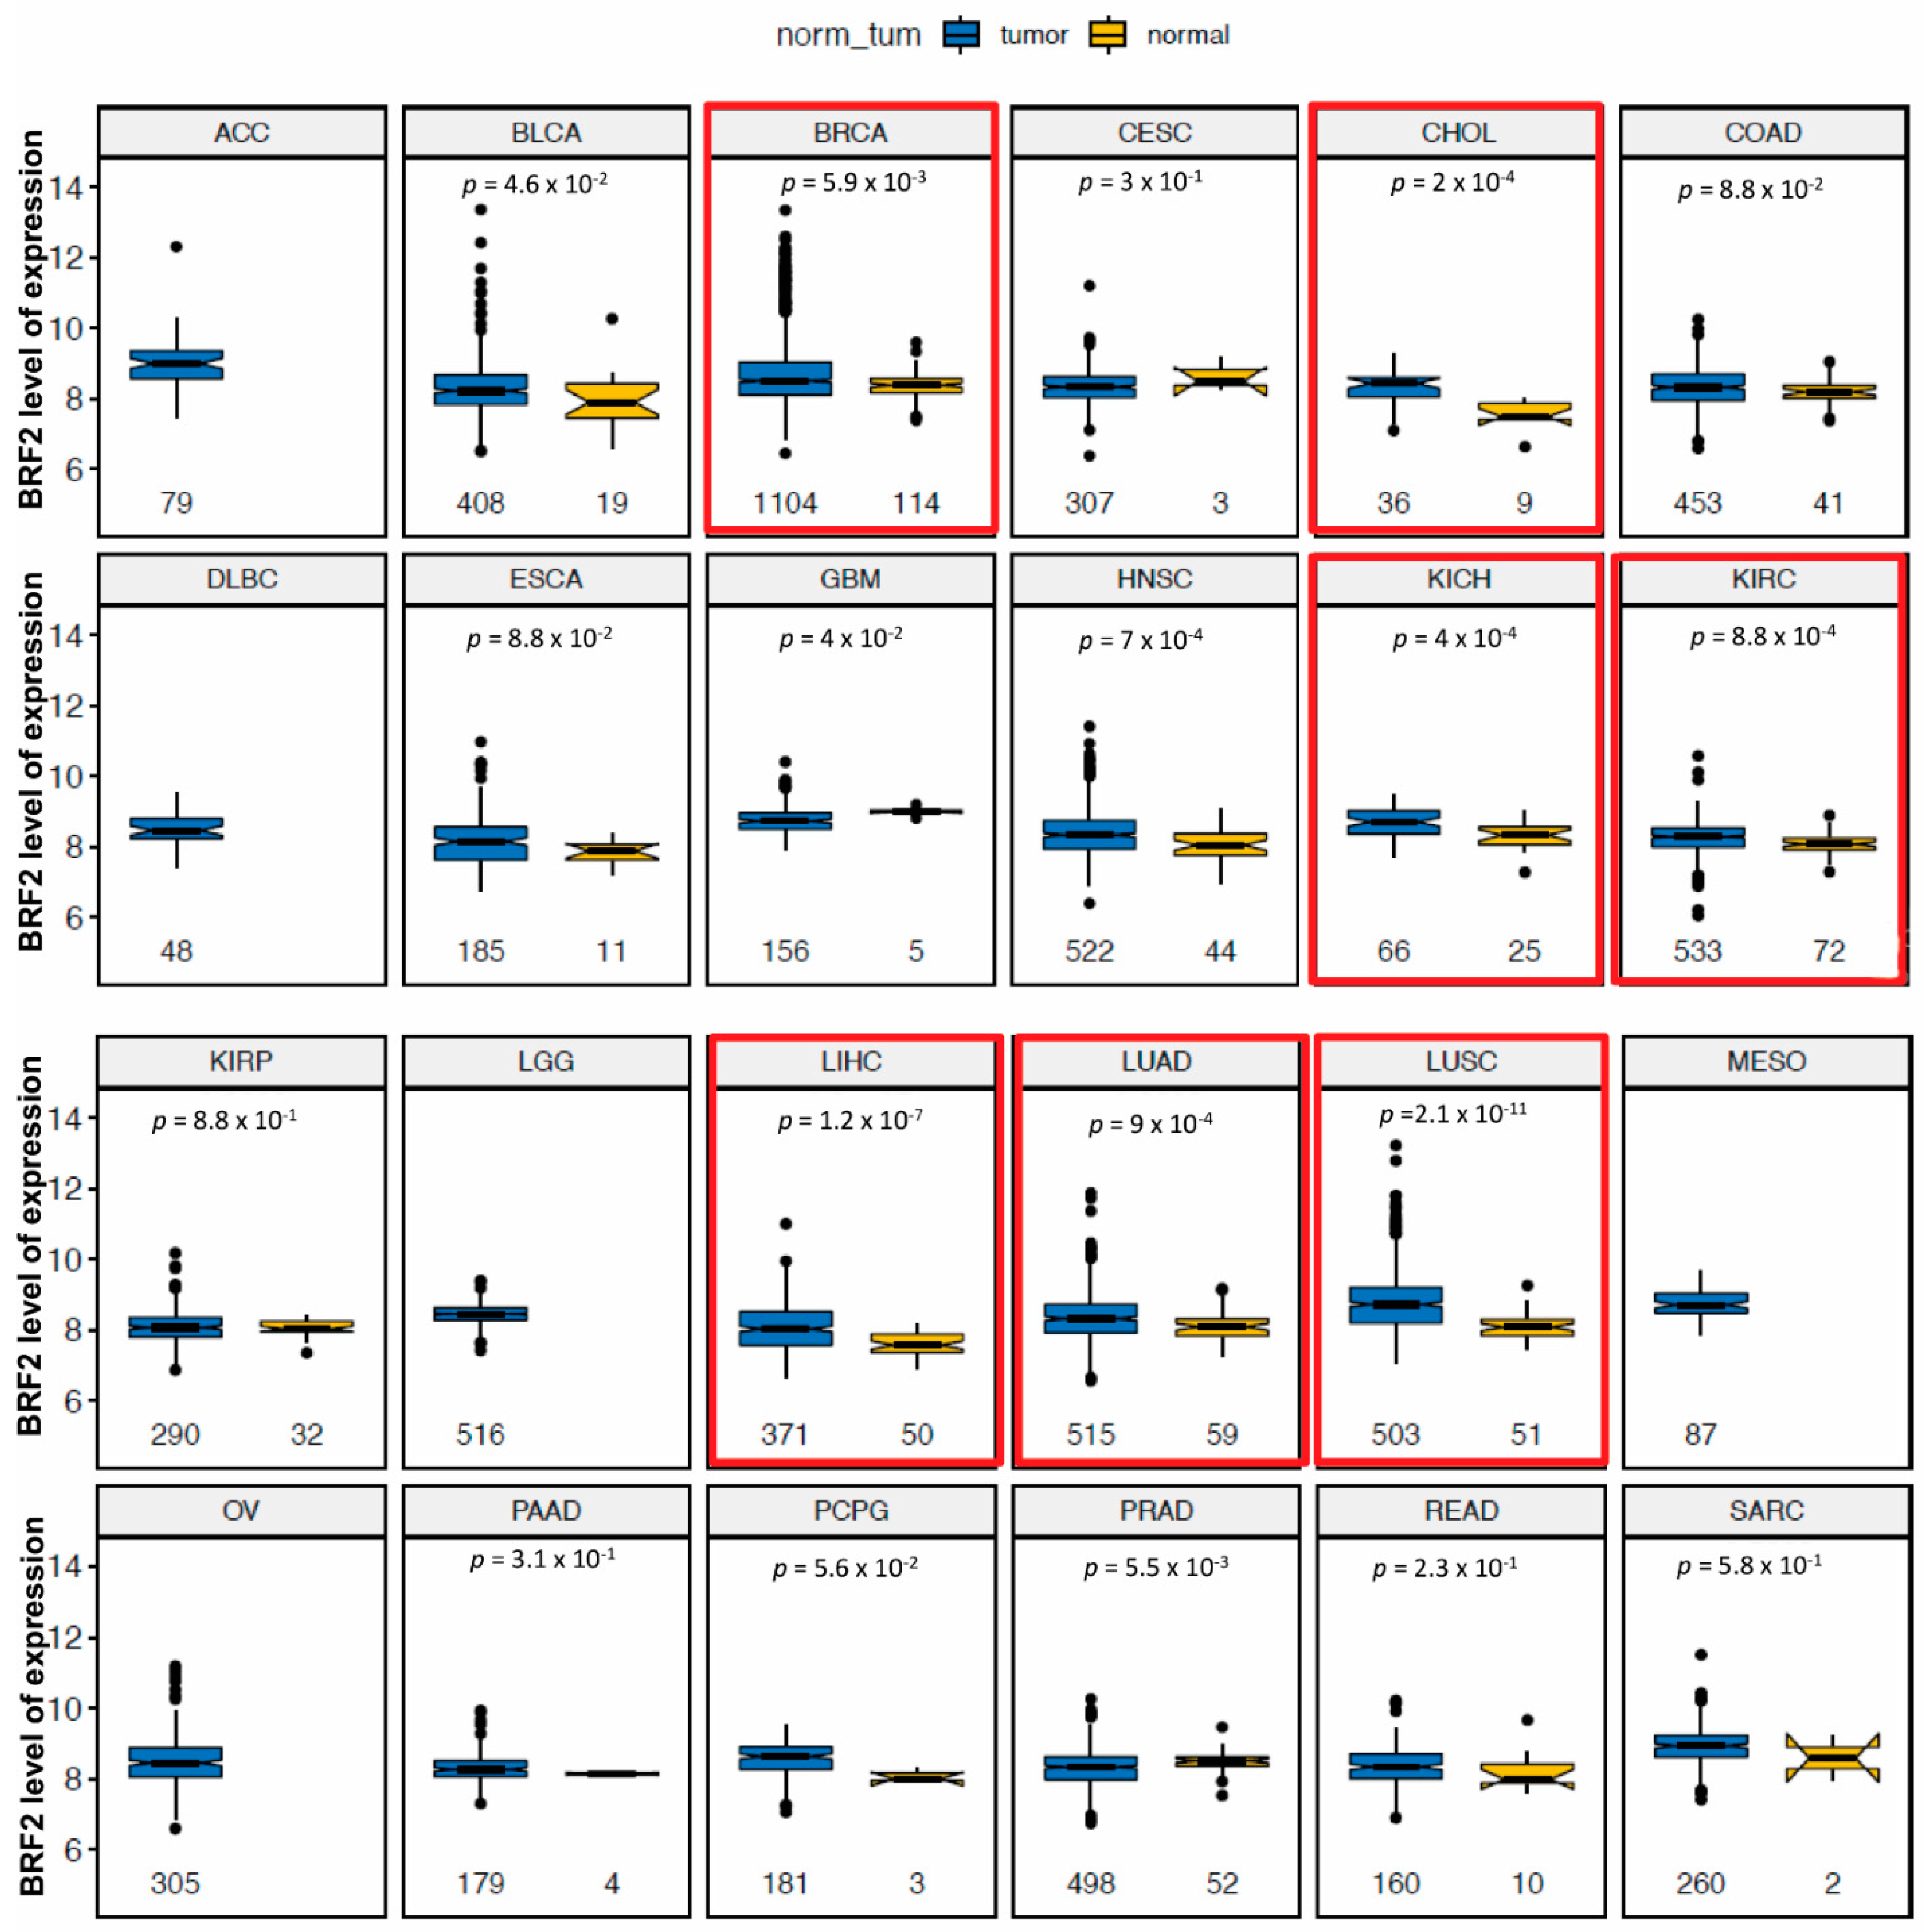
2.1. TCGA Analyses for Genomic Instability
2.2. TCGA Analyses for Cellular Signaling and Immunoregulation
2.3. Virtual Screening Procedure
2.4. Molecular Dynamics Simulations for Protein–Ligand Complexes
2.5. Binding Free Energy Calculations
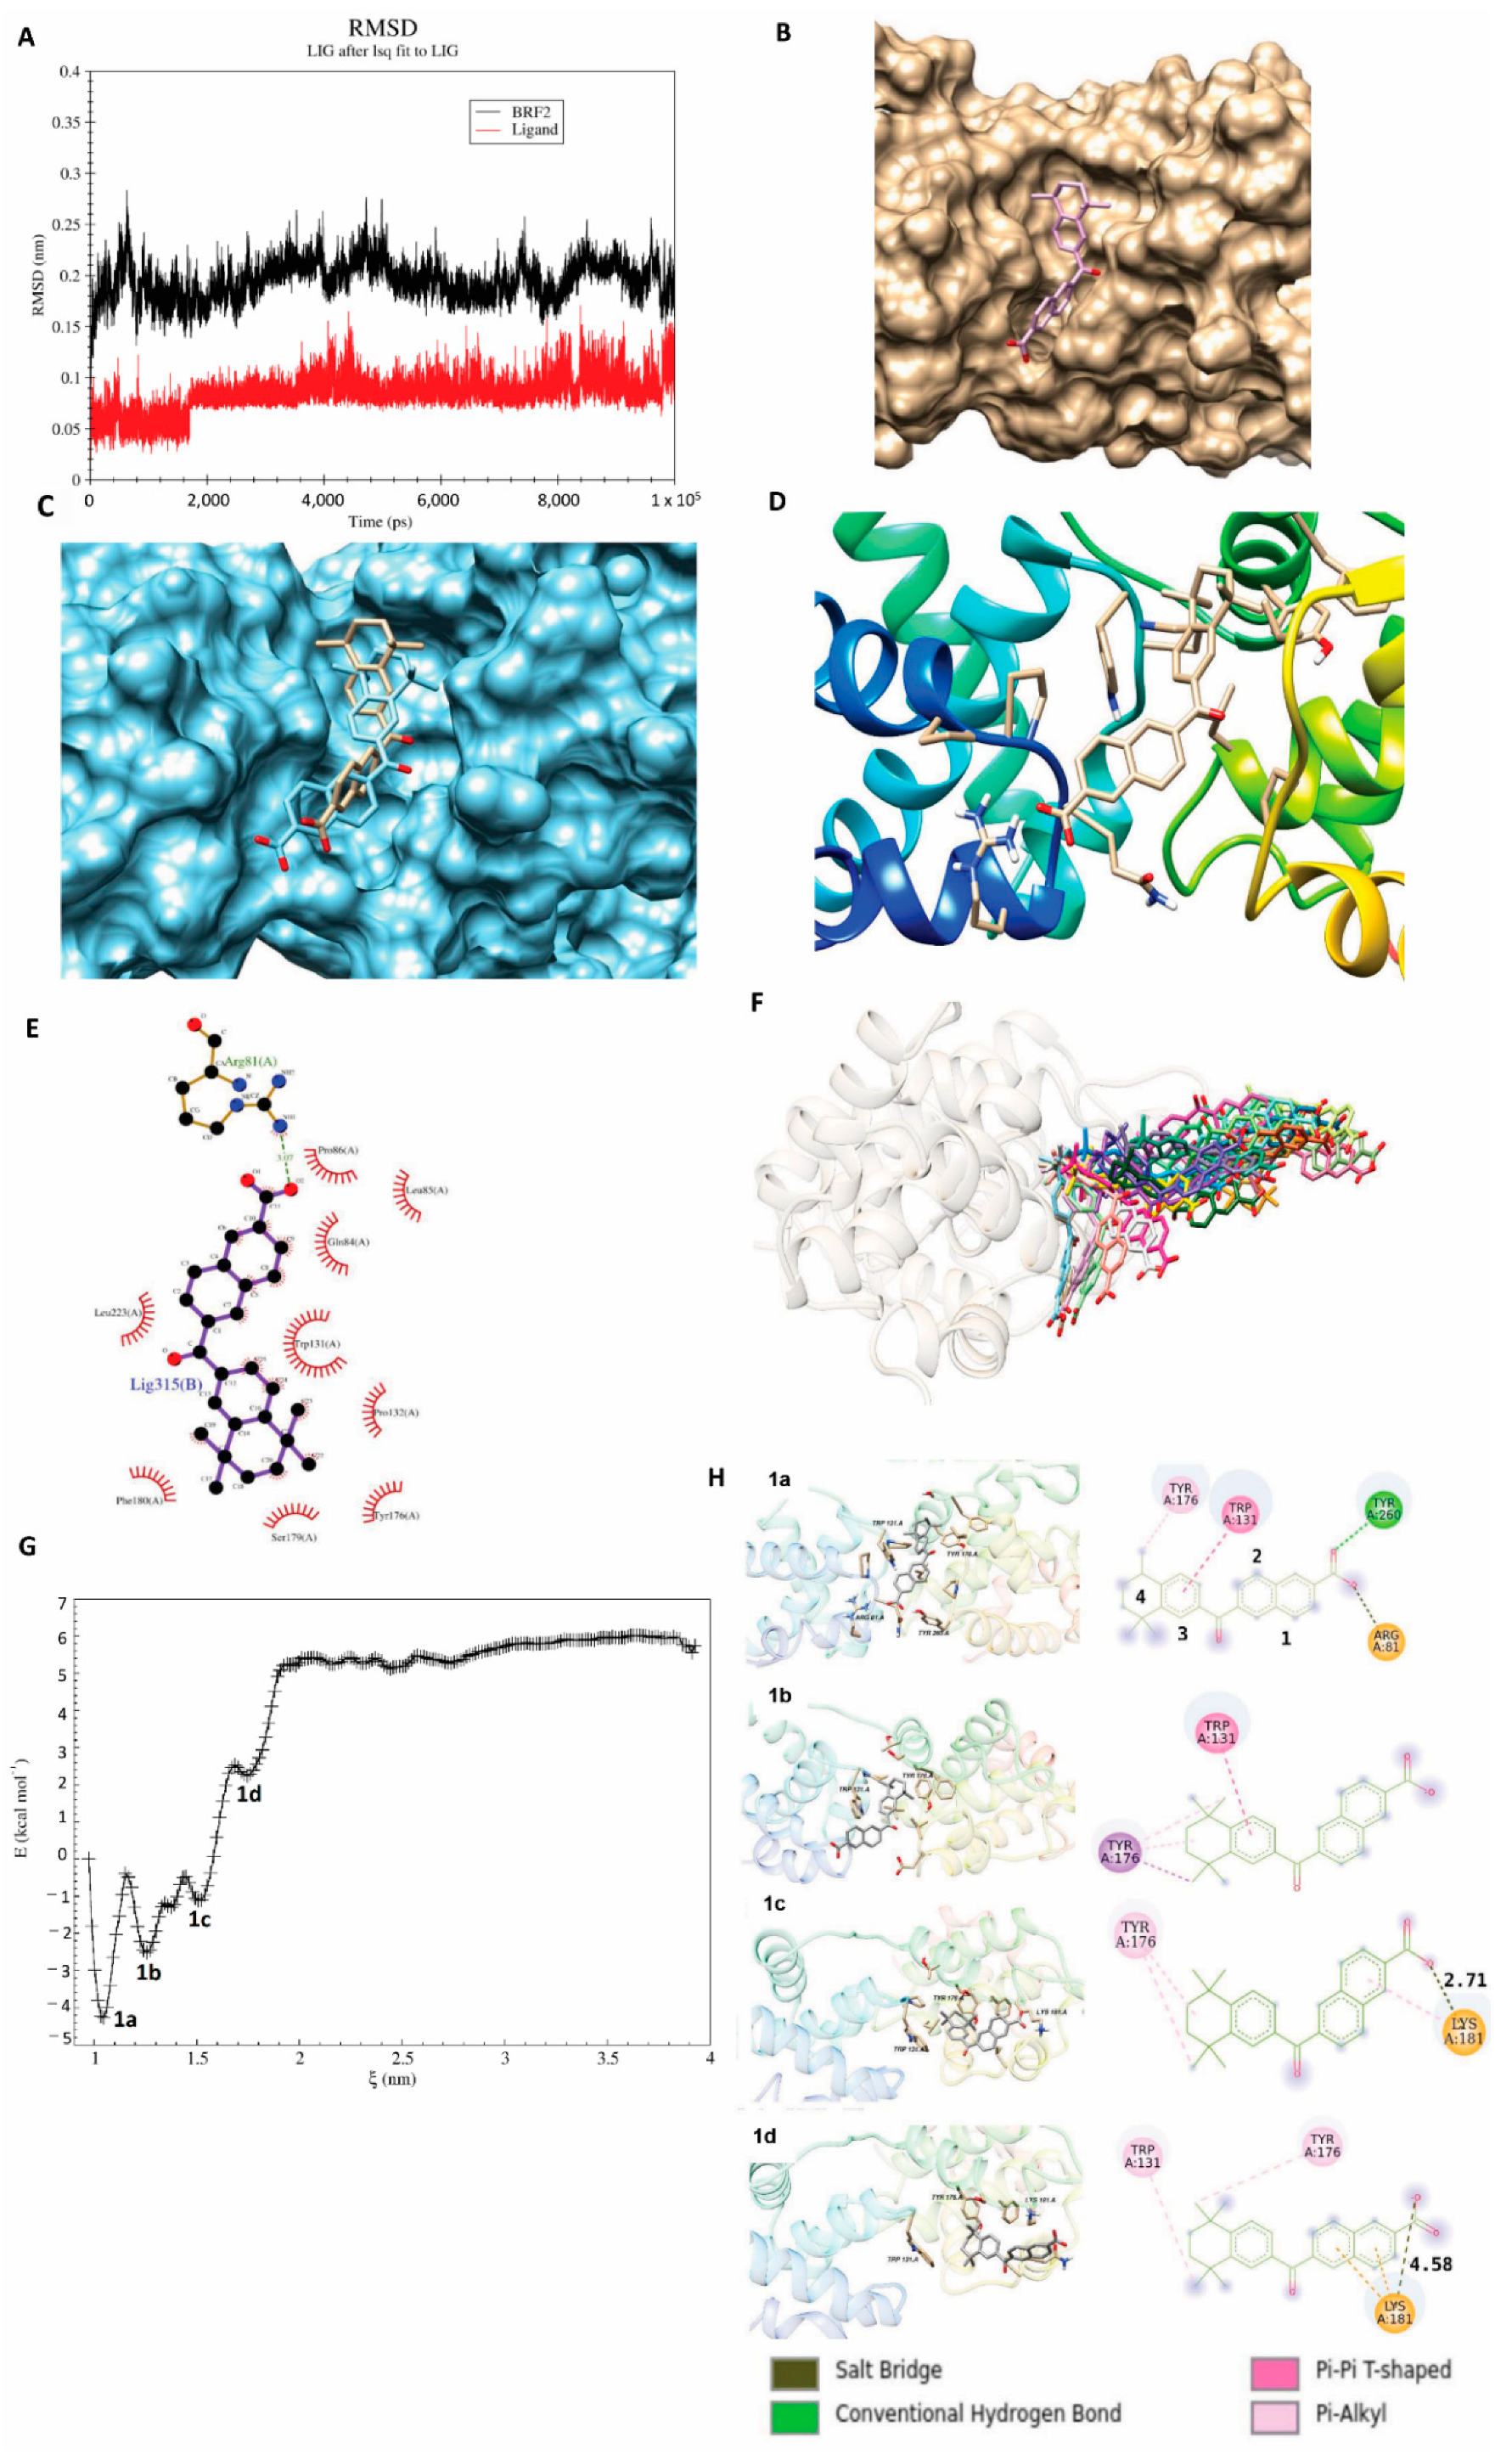
2.6. Umbrella Sampling (US) Simulation
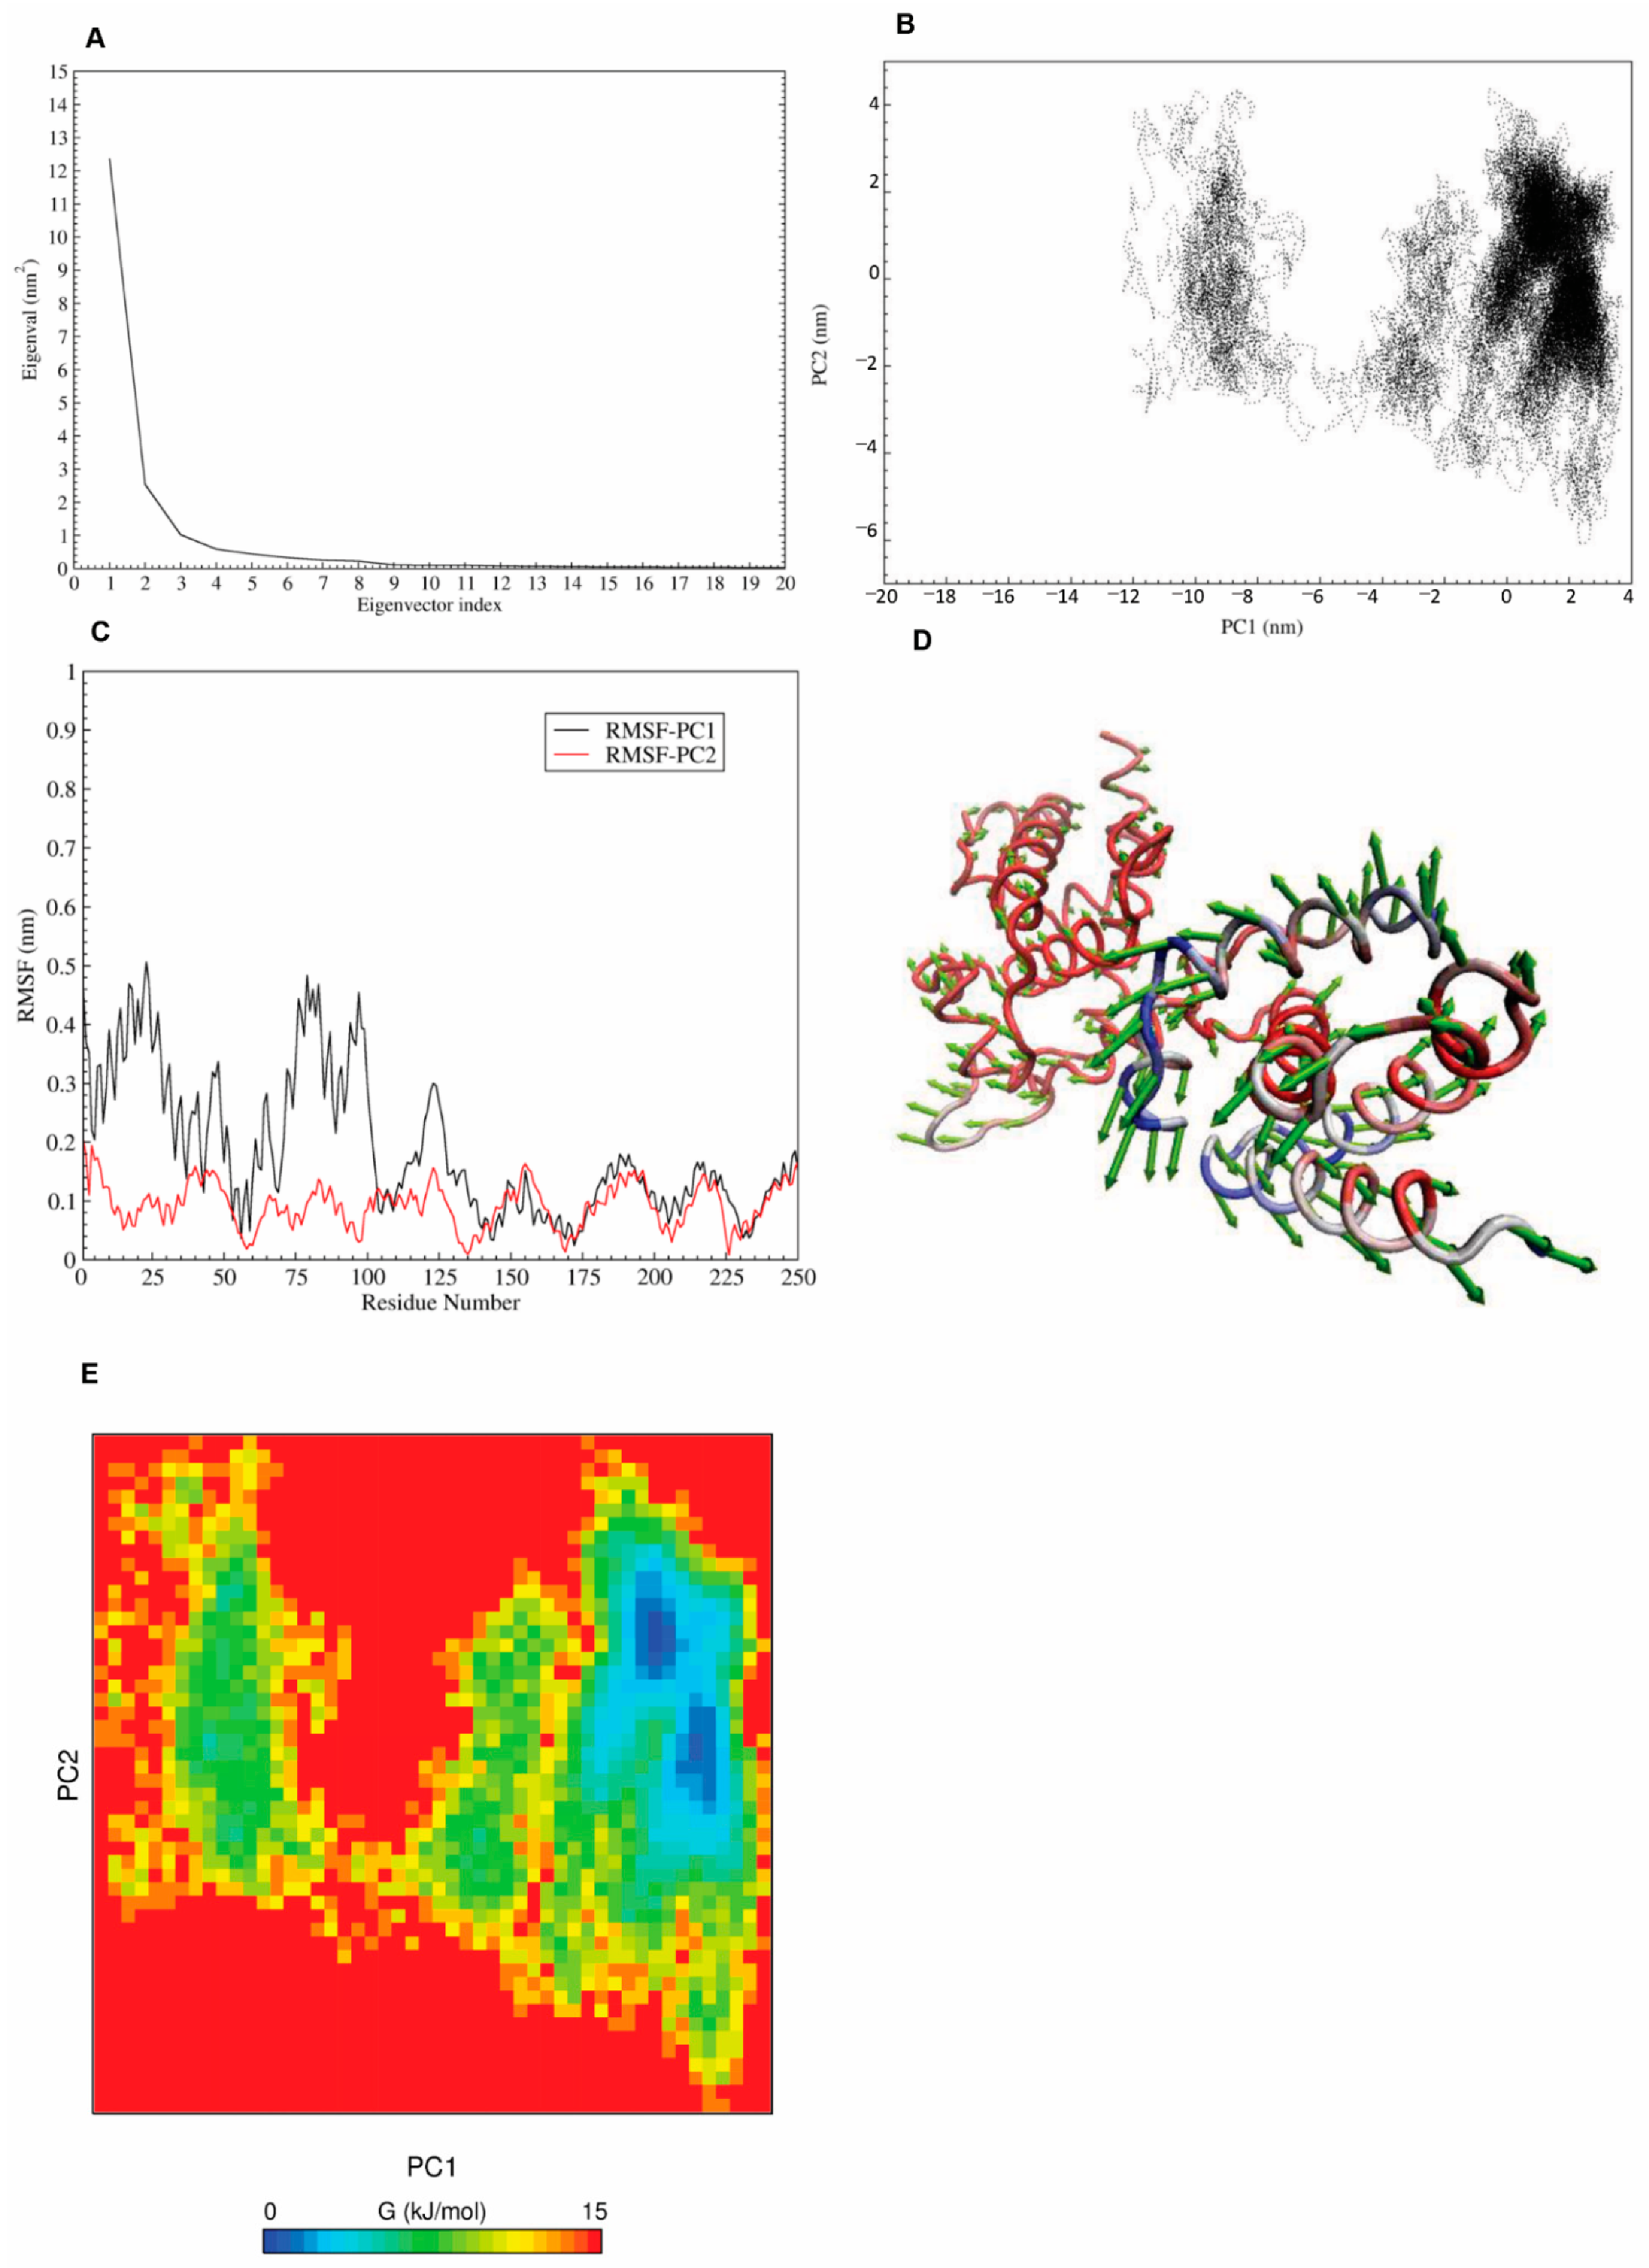
2.7. Principal Component Analysis (PCA) and Free Energy Landscape (FEL)
2.8. Cell Culture and Reagents
2.9. Gene Transduction and Transfection
2.10. CRISPR/Cas9-Mediated Genome Editing
2.11. Western Blot and Immunoblotting
2.12. MTS Assay
2.13. Proliferation Assay
2.14. Reactive Oxygen Species (ROS) Activity Assay
2.15. Statistical Analyses
3. Results
3.1. Bioinformatics Analysis Identifies BRF2 as a Promising Target in Cancer Treatment
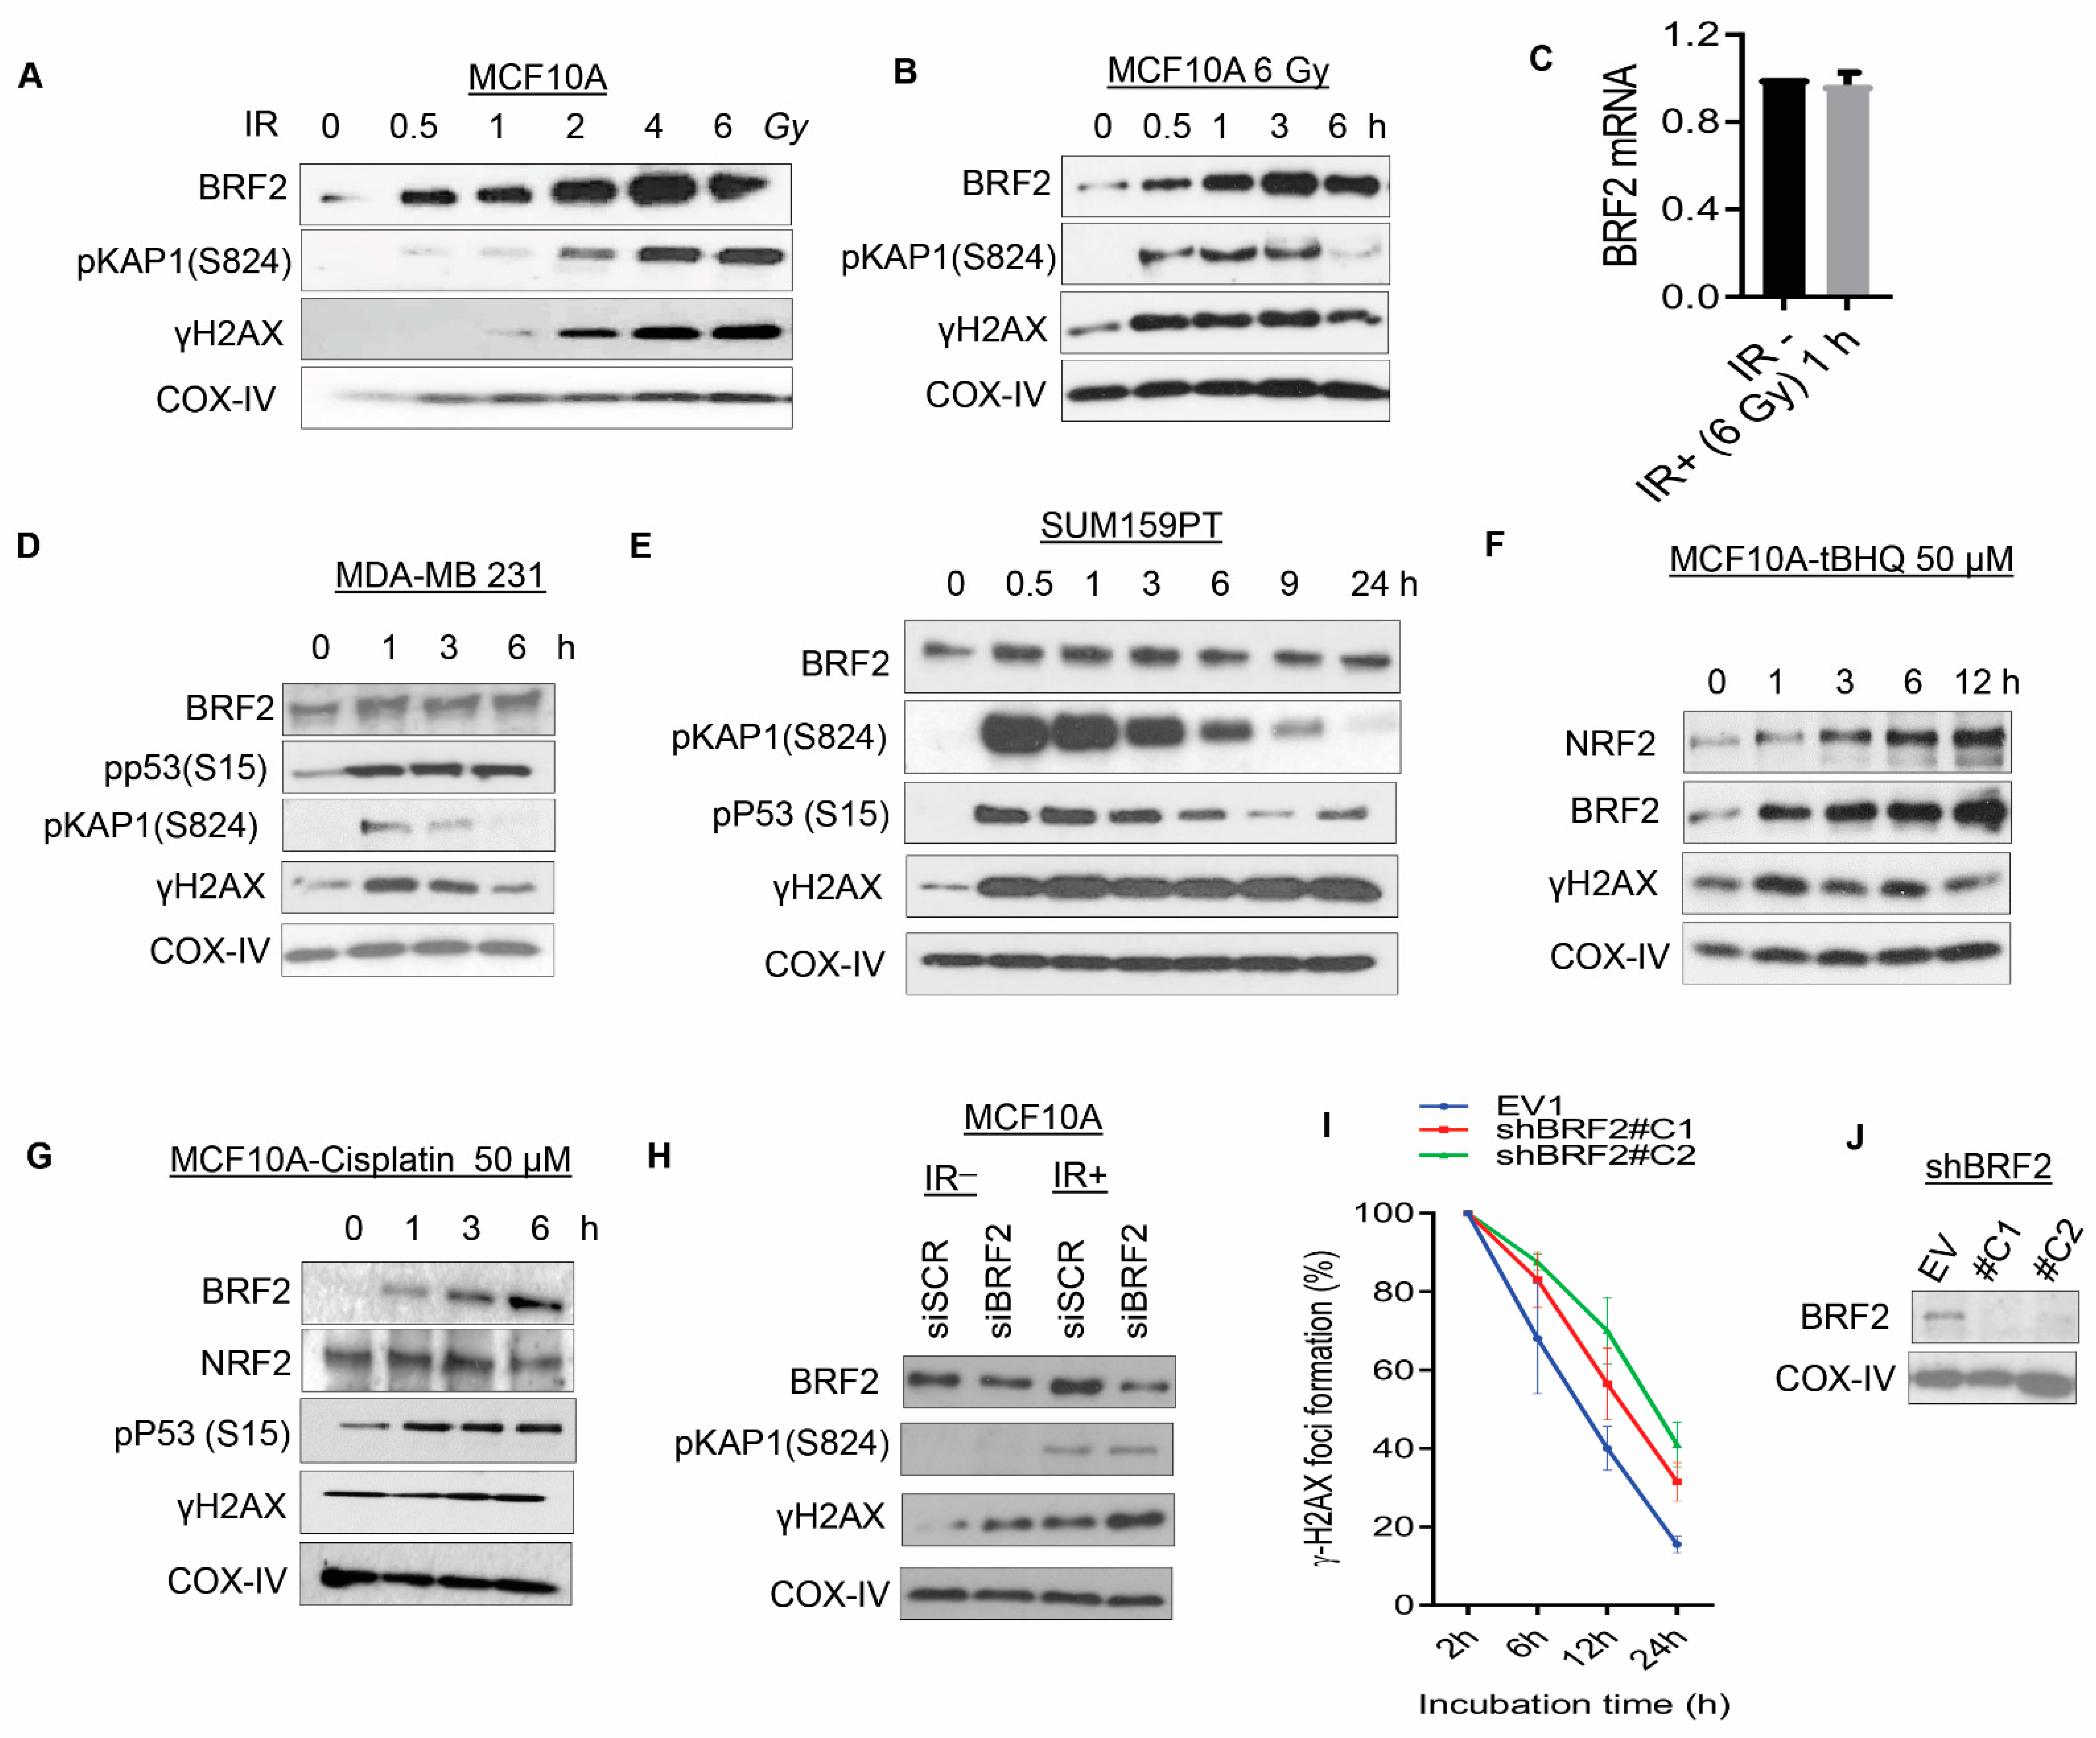
3.2. Evaluation of the Role of BRF2 in the Regulation of the DNA Damage Response Pathway, Utilizing Normal Mammary Epithelial Cells and Breast Cancer Lines
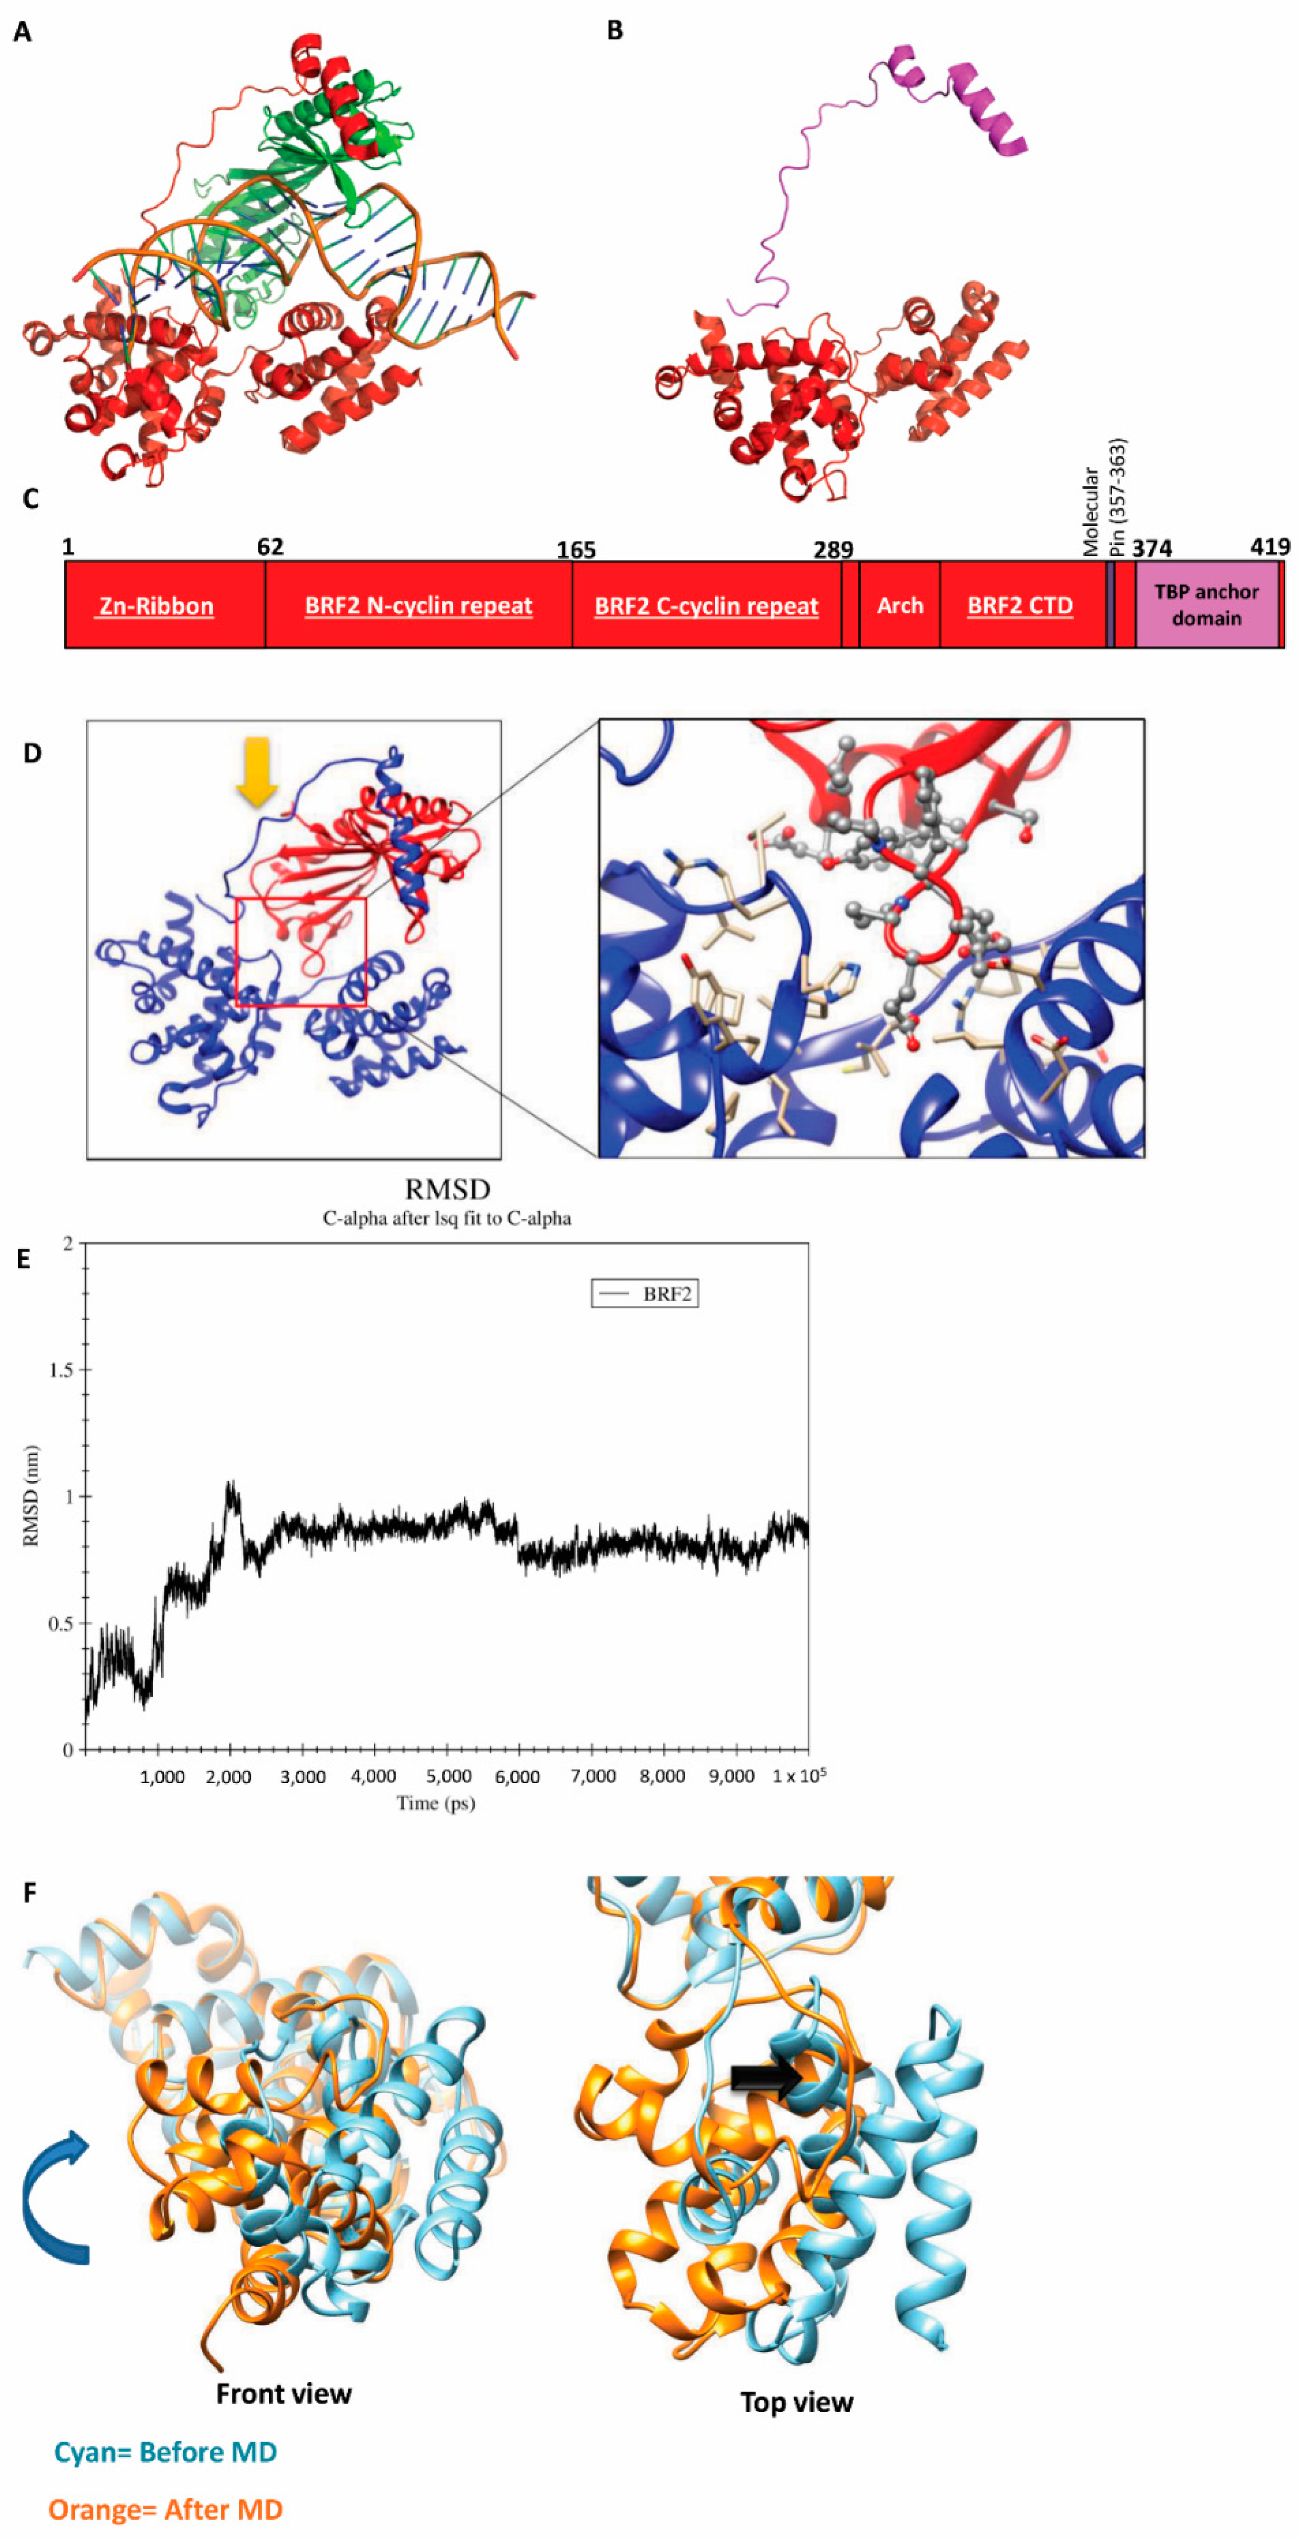
3.3. Targeting BRF2 to Interrupt Its DNA Binding
3.4. Principle Component Analysis (PCA) and Free-Energy Landscape
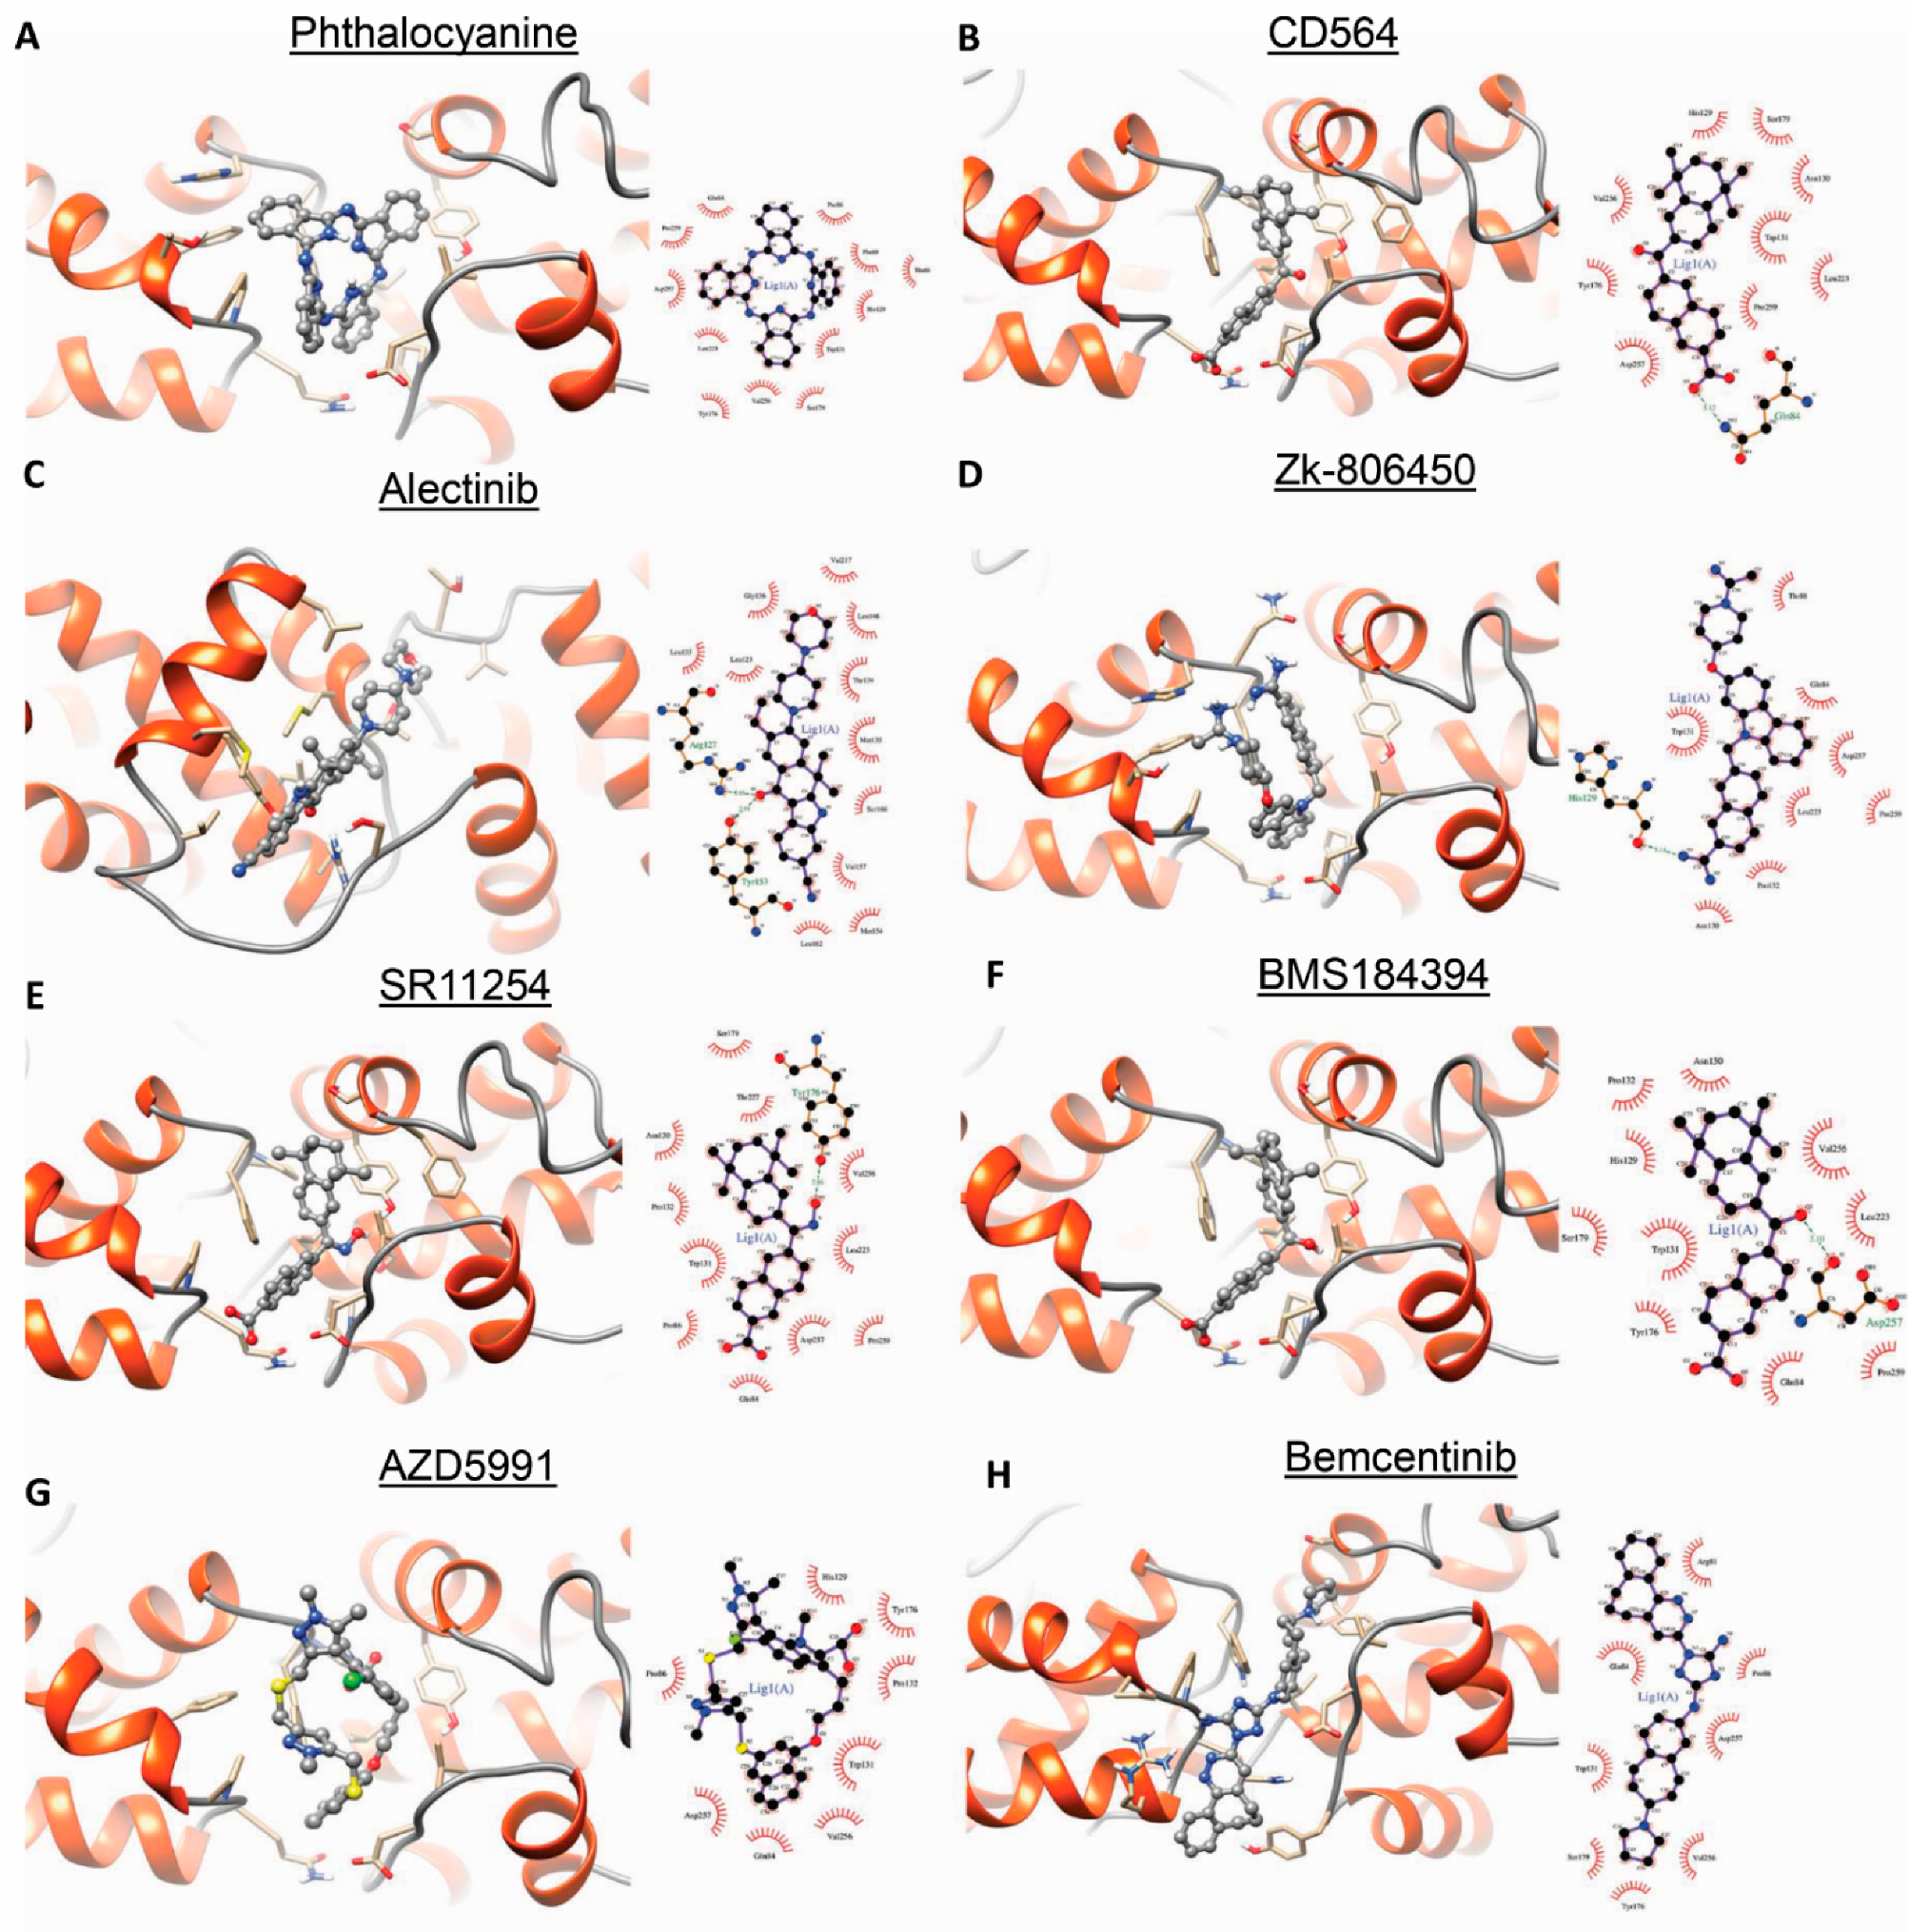
3.5. Targeting BRF2–TBP Binding Using Drugbank Ligands
3.6. Thermodynamic Parameter Calculations
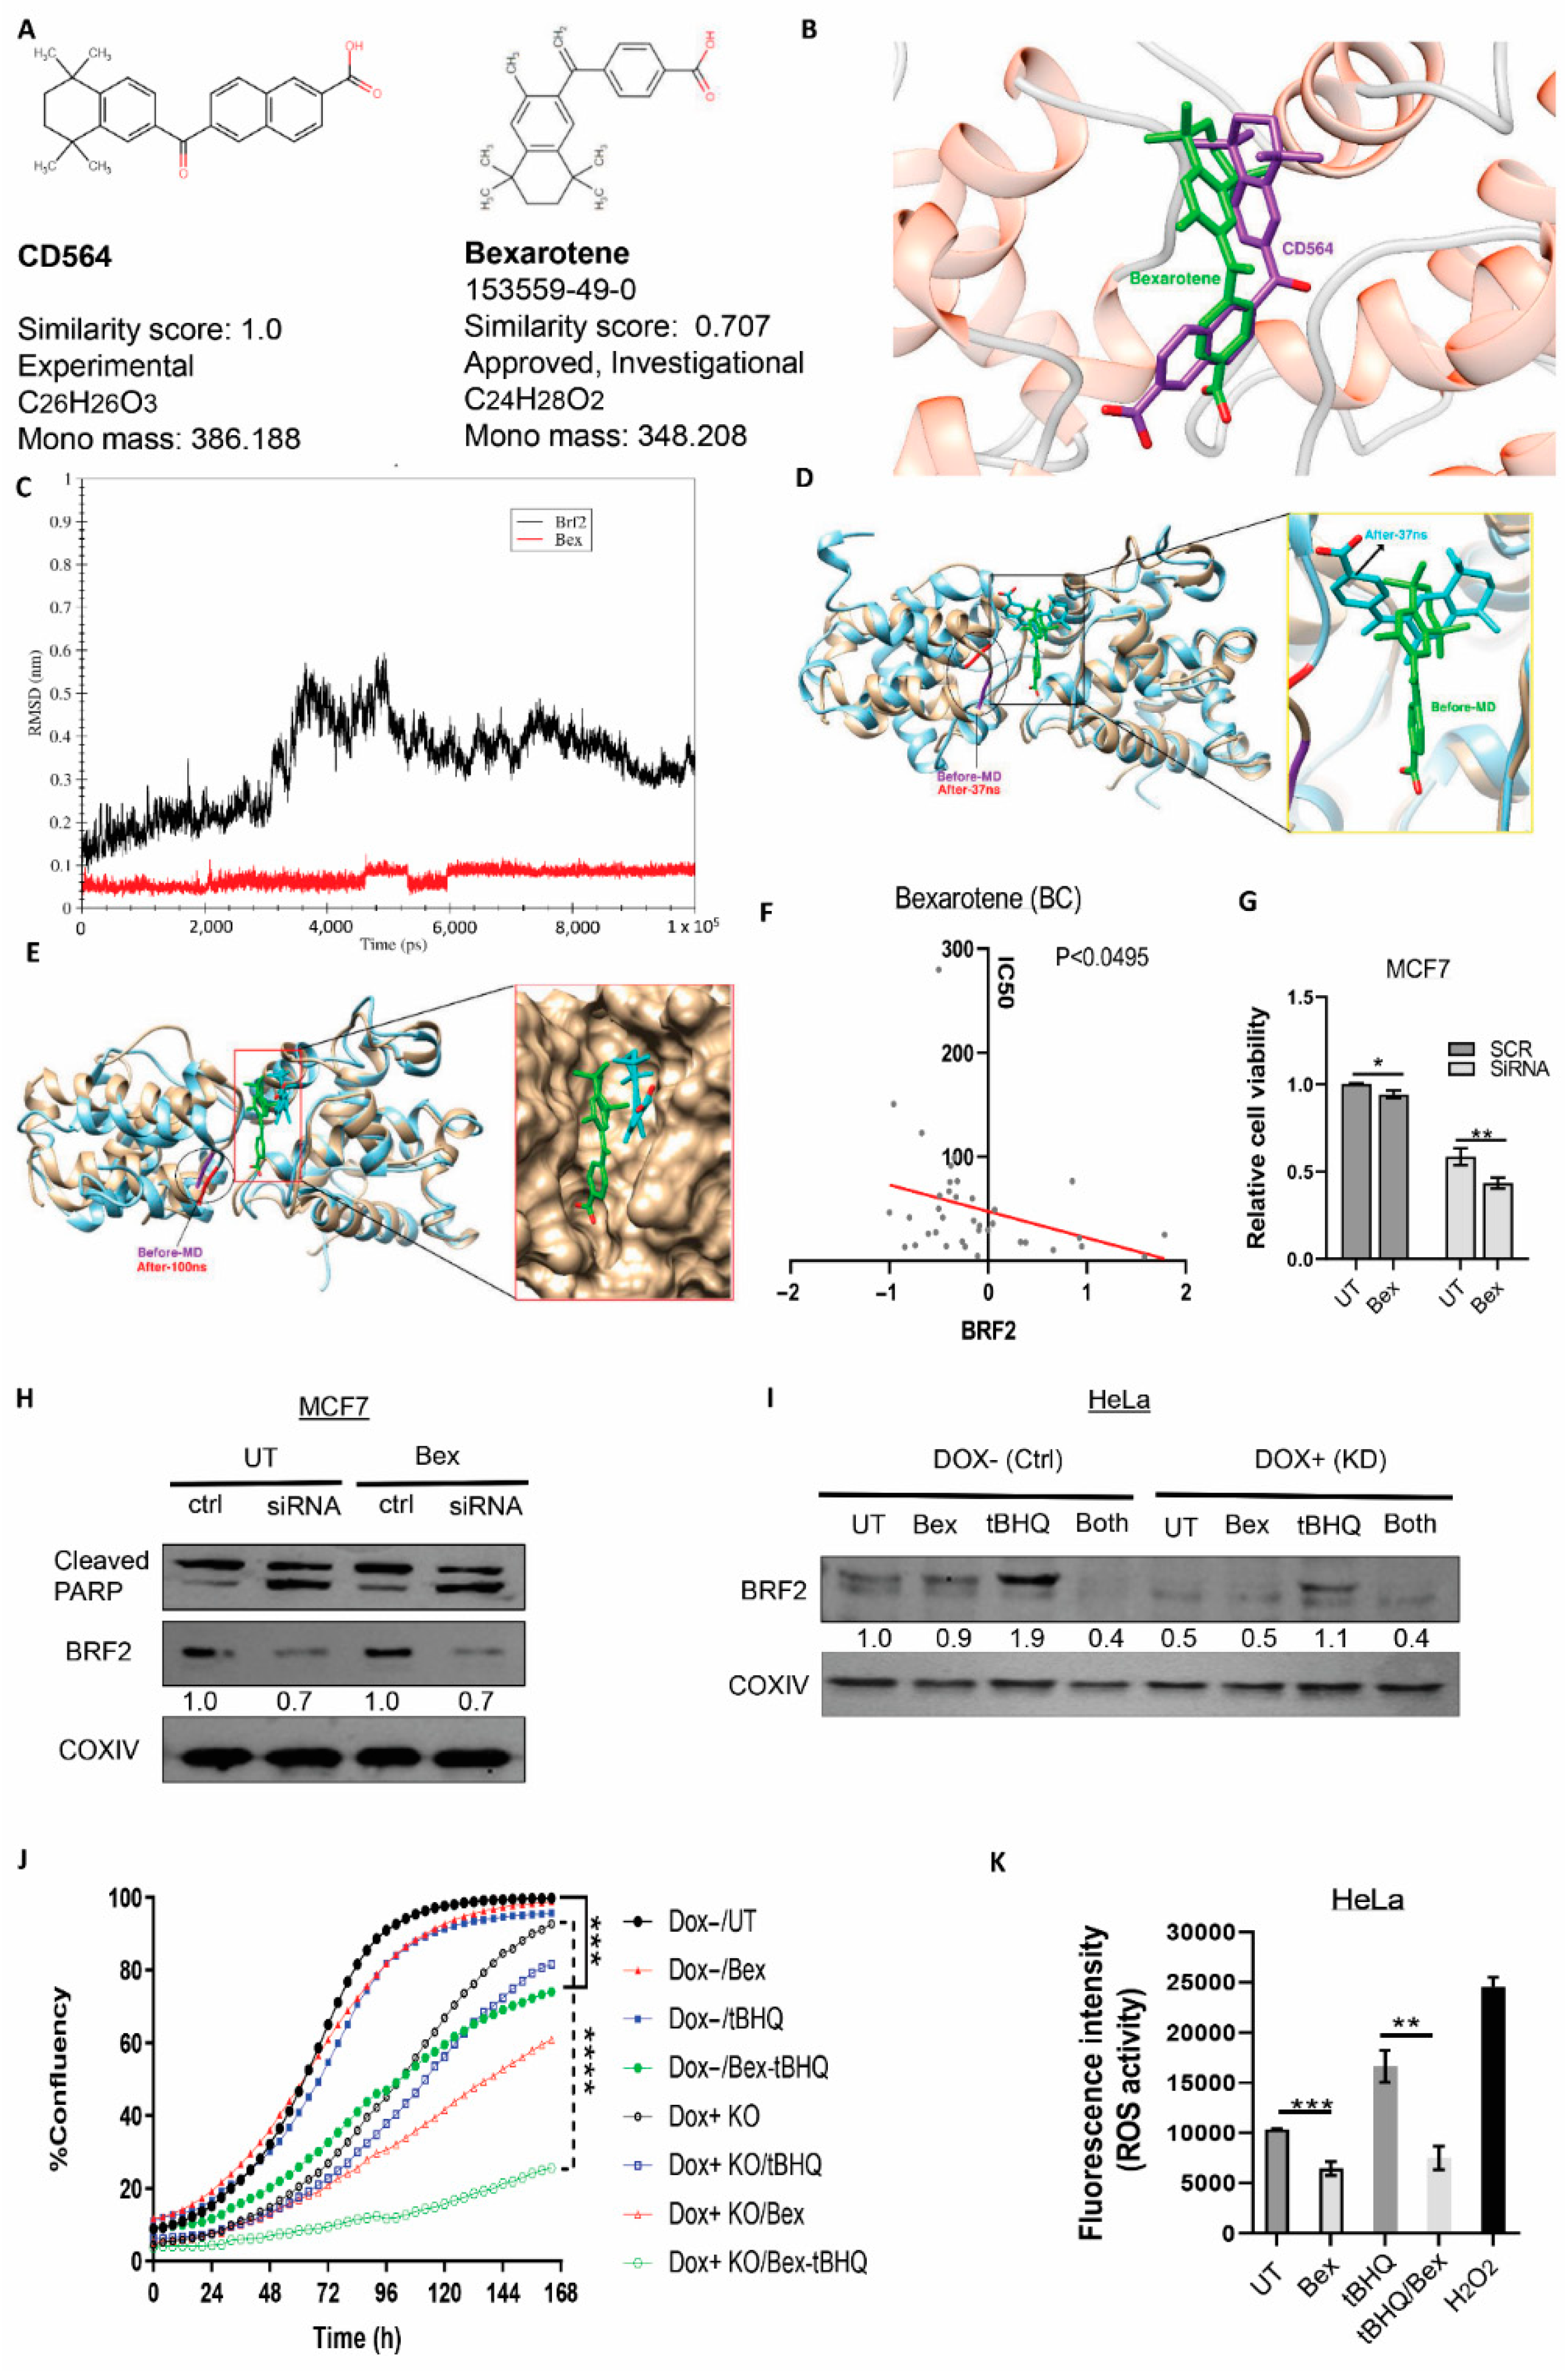
3.7. Experimental Validation of the Drug
4. Discussion
5. Conclusions
Supplementary Materials
Author Contributions
Funding
Institutional Review Board Statement
Data Availability Statement
Acknowledgments
Conflicts of Interest
References
- Gouge, J.; Satia, K.; Guthertz, N.; Widya, M.; Thompson, A.J.; Cousin, P.; Dergai, O.; Hernandez, N.; Vannini, A. Redox signaling by the RNA polymerase III TFIIB-related factor Brf2. Cell 2015, 163, 1375–1387. [Google Scholar] [CrossRef] [Green Version]
- Srihari, S.; Kalimutho, M.; Lal, S.; Singla, J.; Patel, D.; Simpson, P.T.; Khanna, K.K.; Ragan, M.A. Understanding the functional impact of copy number alterations in breast cancer using a network modeling approach. Mol. Biosyst. 2016, 12, 963–972. [Google Scholar] [CrossRef] [PubMed] [Green Version]
- Ng, C.K.Y.; Martelotto, L.G.; Gauthier, A.; Wen, H.-C.; Piscuoglio, S.; Lim, R.S.; Cowell, C.F.; Wilkerson, P.M.; Wai, P.; Rodrigues, D.N.; et al. Intra-tumor genetic heterogeneity and alternative driver genetic alterations in breast cancers with heterogeneous HER2 gene amplification. Genome Biol. 2015, 16, 107. [Google Scholar] [CrossRef] [PubMed] [Green Version]
- Lockwood, W.W.; Chari, R.; Coe, B.P.; Thu, K.L.; Garnis, C.; Malloff, C.A.; Campbell, J.; Williams, A.C.; Hwang, D.; Zhu, C.-Q. Integrative genomic analyses identify BRF2 as a novel lineage-specific oncogene in lung squamous cell carcinoma. PLoS Med. 2010, 7, e1000315. [Google Scholar] [CrossRef] [PubMed] [Green Version]
- Garcia, M.J.; Pole, J.C.M.; Chin, S.-F.; Teschendorff, A.; Naderi, A.; Ozdag, H.; Vias, M.; Kranjac, T.; Subkhankulova, T.; Paish, C. A 1 Mb minimal amplicon at 8p11–12 in breast cancer identifies new candidate oncogenes. Oncogene 2005, 24, 5235–5245. [Google Scholar] [CrossRef] [PubMed] [Green Version]
- Lu, M.; Tian, H.; Yue, W.; Li, L.; Li, S.; Qi, L.; Hu, W.; Gao, C.; Si, L. Overexpression of TFIIB-related factor 2 is significantly correlated with tumor angiogenesis and poor survival in patients with esophageal squamous cell cancer. Med. Oncol. 2013, 30, 553. [Google Scholar] [CrossRef]
- Tian, Y.; Lu, M.; Yue, W.; Li, L.; Li, S.; Gao, C.; Si, L.; Qi, L.; Hu, W.; Tian, H. TFIIB-related factor 2 is associated with poor prognosis of nonsmall cell lung cancer patients through promoting tumor epithelial-mesenchymal transition. Biomed. Res. Int. 2014, 2014, 530786. [Google Scholar] [CrossRef]
- Cabarcas, S.; Schramm, L. RNA polymerase III transcription in cancer: The BRF2 connection. Mol. Cancer 2011, 10, 47. [Google Scholar] [CrossRef] [Green Version]
- Felton-Edkins, Z.A.; Kenneth, N.S.; Brown, T.R.P.; Daly, N.L.; Gomez-Roman, N.; Grandori, C.; Eisenman, R.N.; White, R.J. Direct regulation of RNA polymerase III transcription by RB, p53 and c-Myc. Cell Cycle 2003, 2, 180–183. [Google Scholar] [CrossRef] [Green Version]
- Felton-Edkins, Z.A.; White, R.J. Multiple mechanisms contribute to the activation of RNA polymerase III transcription in cells transformed by papovaviruses. J. Biol. Chem. 2002, 277, 48182–48191. [Google Scholar] [CrossRef] [Green Version]
- Willis, I.M. Rna polymerase iii. In Ejb Reviews 1993; Springer: Berlin/Heidelberg, Germany, 1994; pp. 29–39. [Google Scholar]
- Schramm, L.; Hernandez, N. Recruitment of RNA polymerase III to its target promoters. Genes Dev. 2002, 16, 2593–2620. [Google Scholar] [CrossRef] [Green Version]
- Birkbak, N.J.; Wang, Z.C.; Kim, J.-Y.; Eklund, A.C.; Li, Q.; Tian, R.; Bowman-Colin, C.; Li, Y.; Greene-Colozzi, A.; Iglehart, J.D. Telomeric allelic imbalance indicates defective DNA repair and sensitivity to DNA-damaging agents. Cancer Discov. 2012, 2, 366–375. [Google Scholar] [CrossRef] [Green Version]
- Popova, T.; Manié, E.; Rieunier, G.; Caux-Moncoutier, V.; Tirapo, C.; Dubois, T.; Delattre, O.; Sigal-Zafrani, B.; Bollet, M.; Longy, M. Ploidy and large-scale genomic instability consistently identify basal-like breast carcinomas with BRCA1/2 inactivation. Cancer Res. 2012, 72, 5454–5462. [Google Scholar] [CrossRef] [Green Version]
- Abkevich, V.; Timms, K.M.; Hennessy, B.T.; Potter, J.; Carey, M.S.; Meyer, L.A.; Smith-McCune, K.; Broaddus, R.; Lu, K.H.; Chen, J. Patterns of genomic loss of heterozygosity predict homologous recombination repair defects in epithelial ovarian cancer. Br. J. Cancer 2012, 107, 1776–1782. [Google Scholar] [CrossRef] [Green Version]
- Marquard, A.M.; Eklund, A.C.; Joshi, T.; Krzystanek, M.; Favero, F.; Wang, Z.C.; Richardson, A.L.; Silver, D.P.; Szallasi, Z.; Birkbak, N.J. Pan-cancer analysis of genomic scar signatures associated with homologous recombination deficiency suggests novel indications for existing cancer drugs. Biomark. Res. 2015, 3, 1–10. [Google Scholar] [CrossRef] [Green Version]
- Burrell, R.A.; McClelland, S.E.; Endesfelder, D.; Groth, P.; Weller, M.-C.; Shaikh, N.; Domingo, E.; Kanu, N.; Dewhurst, S.M.; Gronroos, E. Replication stress links structural and numerical cancer chromosomal instability. Nature 2013, 494, 492–496. [Google Scholar] [CrossRef] [PubMed] [Green Version]
- Carter, S.L.; Cibulskis, K.; Helman, E.; McKenna, A.; Shen, H.; Zack, T.; Laird, P.W.; Onofrio, R.C.; Winckler, W.; Weir, B.A. Absolute quantification of somatic DNA alterations in human cancer. Nat. Biotechnol. 2012, 30, 413–421. [Google Scholar] [CrossRef]
- Van Loo, P.; Nordgard, S.H.; Lingjærde, O.C.; Russnes, H.G.; Rye, I.H.; Sun, W.; Weigman, V.J.; Marynen, P.; Zetterberg, A.; Naume, B. Allele-specific copy number analysis of tumors. Proc. Natl. Acad. Sci. USA 2010, 107, 16910–16915. [Google Scholar] [CrossRef] [PubMed] [Green Version]
- Shukla, A.; Nguyen, T.H.M.; Moka, S.B.; Ellis, J.J.; Grady, J.P.; Oey, H.; Cristino, A.S.; Khanna, K.K.; Kroese, D.P.; Krause, L. Chromosome arm aneuploidies shape tumour evolution and drug response. Nat. Commun. 2020, 11, 1–14. [Google Scholar] [CrossRef] [PubMed] [Green Version]
- Thangavelu, P.U.; Lin, C.-Y.; Vaidyanathan, S.; Nguyen, T.H.M.; Dray, E.; Duijf, P.H.G. Overexpression of the E2F target gene CENPI promotes chromosome instability and predicts poor prognosis in estrogen receptor-positive breast cancer. Oncotarget 2017, 8, 62167. [Google Scholar] [CrossRef] [PubMed] [Green Version]
- Carter, S.L.; Eklund, A.C.; Kohane, I.S.; Harris, L.N.; Szallasi, Z. A signature of chromosomal instability inferred from gene expression profiles predicts clinical outcome in multiple human cancers. Nat. Genet. 2006, 38, 1043–1048. [Google Scholar] [CrossRef]
- Taylor, A.M.; Shih, J.; Ha, G.; Gao, G.F.; Zhang, X.; Berger, A.C.; Schumacher, S.E.; Wang, C.; Hu, H.; Liu, J. Genomic and functional approaches to understanding cancer aneuploidy. Cancer Cell 2018, 33, 676–689. [Google Scholar] [CrossRef] [PubMed] [Green Version]
- Bailey, M.H.; Tokheim, C.; Porta-Pardo, E.; Sengupta, S.; Bertrand, D.; Weerasinghe, A.; Colaprico, A.; Wendl, M.C.; Kim, J.; Reardon, B. Comprehensive characterization of cancer driver genes and mutations. Cell 2018, 173, 371–385. [Google Scholar] [CrossRef] [Green Version]
- Peng, G.; Lin, C.C.-J.; Mo, W.; Dai, H.; Park, Y.-Y.; Kim, S.M.; Peng, Y.; Mo, Q.; Siwko, S.; Hu, R. Genome-wide transcriptome profiling of homologous recombination DNA repair. Nat. Commun. 2014, 5, 1–11. [Google Scholar] [CrossRef] [PubMed] [Green Version]
- Cortes-Ciriano, I.; Lee, S.; Park, W.-Y.; Kim, T.-M.; Park, P.J. A molecular portrait of microsatellite instability across multiple cancers. Nat. Commun. 2017, 8, 1–12. [Google Scholar] [CrossRef] [PubMed] [Green Version]
- Cortés-Ciriano, I.; Lee, J.J.-K.; Xi, R.; Jain, D.; Jung, Y.L.; Yang, L.; Gordenin, D.; Klimczak, L.J.; Zhang, C.-Z.; Pellman, D.S. Comprehensive analysis of chromothripsis in 2658 human cancers using whole-genome sequencing. Nat. Genet. 2020, 52, 331–341. [Google Scholar] [CrossRef] [Green Version]
- Hoadley, K.A.; Yau, C.; Wolf, D.M.; Cherniack, A.D.; Tamborero, D.; Ng, S.; Leiserson, M.D.M.; Niu, B.; McLellan, M.D.; Uzunangelov, V. Multiplatform analysis of 12 cancer types reveals molecular classification within and across tissues of origin. Cell 2014, 158, 929–944. [Google Scholar] [CrossRef] [Green Version]
- Masiero, M.; Simões, F.C.; Han, H.D.; Snell, C.; Peterkin, T.; Bridges, E.; Mangala, L.S.; Wu, S.Y.-Y.; Pradeep, S.; Li, D. A core human primary tumor angiogenesis signature identifies the endothelial orphan receptor ELTD1 as a key regulator of angiogenesis. Cancer Cell 2013, 24, 229–241. [Google Scholar] [CrossRef] [Green Version]
- Winter, S.C.; Buffa, F.M.; Silva, P.; Miller, C.; Valentine, H.R.; Turley, H.; Shah, K.A.; Cox, G.J.; Corbridge, R.J.; Homer, J.J. Relation of a hypoxia metagene derived from head and neck cancer to prognosis of multiple cancers. Cancer Res. 2007, 67, 3441–3449. [Google Scholar] [CrossRef] [PubMed] [Green Version]
- Eustace, A.; Mani, N.; Span, P.N.; Irlam, J.J.; Taylor, J.; Betts, G.N.J.; Denley, H.; Miller, C.J.; Homer, J.J.; Rojas, A.M. A 26-gene hypoxia signature predicts benefit from hypoxia-modifying therapy in laryngeal cancer but not bladder cancer. Clin. Cancer Res. 2013, 19, 4879–4888. [Google Scholar] [CrossRef] [Green Version]
- Sørensen, B.S.; Toustrup, K.; Horsman, M.R.; Overgaard, J.; Alsner, J. Identifying pH independent hypoxia induced genes in human squamous cell carcinomas in vitro. Acta Oncol. 2010, 49, 895–905. [Google Scholar] [CrossRef] [PubMed]
- Seigneuric, R.; Starmans, M.H.W.; Fung, G.; Krishnapuram, B.; Nuyten, D.S.A.; van Erk, A.; Magagnin, M.G.; Rouschop, K.M.; Krishnan, S.; Rao, R.B. Impact of supervised gene signatures of early hypoxia on patient survival. Radiother. Oncol. 2007, 83, 374–382. [Google Scholar] [CrossRef]
- Ragnum, H.B.; Vlatkovic, L.; Lie, A.K.; Axcrona, K.; Julin, C.H.; Frikstad, K.M.; Hole, K.H.; Seierstad, T.; Lyng, H. The tumour hypoxia marker pimonidazole reflects a transcriptional programme associated with aggressive prostate cancer. Br. J. Cancer 2015, 112, 382–390. [Google Scholar] [CrossRef] [PubMed] [Green Version]
- Hu, Z.; Fan, C.; Livasy, C.; He, X.; Oh, D.S.; Ewend, M.G.; Carey, L.A.; Subramanian, S.; West, R.; Ikpatt, F. A compact VEGF signature associated with distant metastases and poor outcomes. BMC Med. 2009, 7, 1–14. [Google Scholar] [CrossRef] [Green Version]
- An, Y.; Bi, F.; You, Y.; Liu, X.; Yang, Q. Development of a novel autophagy-related prognostic signature for serous ovarian cancer. J. Cancer 2018, 9, 4058. [Google Scholar] [CrossRef] [PubMed] [Green Version]
- Malta, T.M.; Sokolov, A.; Gentles, A.J.; Burzykowski, T.; Poisson, L.; Weinstein, J.N.; Kamińska, B.; Huelsken, J.; Omberg, L.; Gevaert, O. Machine learning identifies stemness features associated with oncogenic dedifferentiation. Cell 2018, 173, 338–354. [Google Scholar] [CrossRef] [Green Version]
- Hess, K.R.; Anderson, K.; Symmans, W.F.; Valero, V.; Ibrahim, N.; Mejia, J.A.; Booser, D.; Theriault, R.L.; Buzdar, A.U.; Dempsey, P.J. Pharmacogenomic predictor of sensitivity to preoperative chemotherapy with paclitaxel and fluorouracil, doxorubicin, and cyclophosphamide in breast cancer. J. Clin. Oncol. 2006, 24, 4236–4244. [Google Scholar] [CrossRef] [Green Version]
- Wolf, D.M.; Lenburg, M.E.; Yau, C.; Boudreau, A.; van’t Veer, L.J. Gene co-expression modules as clinically relevant hallmarks of breast cancer diversity. PLoS ONE 2014, 9, e88309. [Google Scholar] [CrossRef] [Green Version]
- Li, B.; Severson, E.; Pignon, J.-C.; Zhao, H.; Li, T.; Novak, J.; Jiang, P.; Shen, H.; Aster, J.C.; Rodig, S. Comprehensive analyses of tumor immunity: Implications for cancer immunotherapy. Genome Biol. 2016, 17, 1–16. [Google Scholar] [CrossRef] [Green Version]
- Wishart, D.S.; Feunang, Y.D.; Guo, A.C.; Lo, E.J.; Marcu, A.; Grant, J.R.; Sajed, T.; Johnson, D.; Li, C.; Sayeeda, Z. DrugBank 5.0: A major update to the DrugBank database for 2018. Nucleic Acids Res. 2018, 46, D1074–D1082. [Google Scholar] [CrossRef]
- Morris, G.M.; Huey, R.W.; Strong, L.; Sanner, M.F.; Belew, R.K.; Goodsell, D.S.; Olson, A.J. Software News and Updates AutoDock4 and AutoDockTools4: Automated Docking with Selective Receptor Flexibility. J. Comput. Chem. 2009, 16, 2785–2791. [Google Scholar] [CrossRef] [Green Version]
- Österberg, F.; Morris, G.M.; Sanner, M.F.; Olson, A.J.; Goodsell, D.S. Automated docking to multiple target structures: Incorporation of protein mobility and structural water heterogeneity in AutoDock. Proteins Struct. Funct. Bioinform. 2002, 46, 34–40. [Google Scholar] [CrossRef]
- Trott, O.; Olson, A.J. AutoDock Vina: Improving the speed and accuracy of docking with a new scoring function, efficient optimization, and multithreading. J. Comput. Chem. 2010, 31, 455–461. [Google Scholar] [CrossRef] [Green Version]
- Liu, P.-F.; Tsai, K.-L.; Hsu, C.-J.; Tsai, W.-L.; Cheng, J.-S.; Chang, H.-W.; Shiau, C.W.; Goan, Y.G.; Tseng, H.H.; Wu, C.H.; et al. Drug repurposing screening identifies tioconazole as an ATG4 inhibitor that suppresses autophagy and sensitizes cancer cells to chemotherapy. Theranostics 2018, 8, 830–845. [Google Scholar] [CrossRef]
- Assadollahi, V.; Rashidieh, B.; Alasvand, M.; Abdolahi, A.; Lopez, J.A. Interaction and molecular dynamics simulation study of Osimertinib (AstraZeneca 9291) anticancer drug with the EGFR kinase domain in native protein and mutated L844V and C797S. J. Cell. Biochem. 2019, 120, 13046–13055. [Google Scholar] [CrossRef]
- Rashidieh, B.; Valizadeh, M.; Assadollahi, V.; Ranjbar, M.M. Molecular dynamics simulation on the low sensitivity of mutants of NEDD-8 activating enzyme for MLN4924 inhibitor as a cancer drug. Am. J. Cancer Res. 2015, 5, 3400–3406. [Google Scholar]
- Verma, S.; Grover, S.; Tyagi, C.; Goyal, S.; Jamal, S.; Singh, A.; Grover, A. Hydrophobic interactions are a key to MDM2 inhibition by polyphenols as revealed by molecular dynamics simulations and MM/PBSA free energy calculations. PLoS ONE 2016, 11, e0149014. [Google Scholar] [CrossRef] [PubMed]
- Maisuradze, G.G.; Liwo, A.; Scheraga, H.A. Relation between free energy landscapes of proteins and dynamics. J. Chem. Theory Comput. 2010, 6, 583–595. [Google Scholar] [CrossRef] [PubMed] [Green Version]
- McKinley, K.L.; Cheeseman, I.M. Large-scale analysis of CRISPR/Cas9 cell-cycle knockouts reveals the diversity of p53-dependent responses to cell-cycle defects. Dev. Cell 2017, 40, 405–420. [Google Scholar] [CrossRef] [PubMed] [Green Version]
- Hart, T.; Tong, A.H.Y.; Chan, K.; Van Leeuwen, J.; Seetharaman, A.; Aregger, M.; Chandrashekhar, M.; Hustedt, N.; Seth, S.; Noonan, A. Evaluation and design of genome-wide CRISPR/SpCas9 knockout screens. G3 Genes Genomes Genet. 2017, 7, 2719–2727. [Google Scholar] [CrossRef] [PubMed] [Green Version]
- Rummukainen, J.; Kytölä, S.; Karhu, R.; Farnebo, F.; Larsson, C.; Isola, J.J. Aberrations of chromosome 8 in 16 breast cancer cell lines by comparative genomic hybridization, fluorescence in situ hybridization, and spectral karyotyping. Cancer Genet. Cytogenet. 2001, 126, 1–7. [Google Scholar] [CrossRef]
- Olgudóttir, E. Potential Oncogenes within the 8p12-p11 Amplicon. Identification and Functional Testing in Breast Cancer Cell Lines. MSc Thesis, University of Iceland, Reykjavík, Iceland, 2012. [Google Scholar]
- Network, C.G.A. Comprehensive molecular portraits of human breast tumours. Nature 2012, 490, 61. [Google Scholar] [CrossRef] [Green Version]
- Ma, H.; Wu, Y.; Dang, Y.; Choi, J.-G.; Zhang, J.; Wu, H. Pol III promoters to express small RNAs: Delineation of transcription initiation. Mol. Ther. Acids 2014, 3, e161. [Google Scholar] [CrossRef] [PubMed]
- Papaleo, E.; Mereghetti, P.; Fantucci, P.; Grandori, R.; De Gioia, L. Free-energy landscape, principal component analysis, and structural clustering to identify representative conformations from molecular dynamics simulations: The myoglobin case. J. Mol. Graph. Model. 2009, 27, 889–899. [Google Scholar] [CrossRef] [PubMed]
- Chopra, N.; Wales, T.E.; Joseph, R.E.; Boyken, S.E.; Engen, J.R.; Jernigan, R.L.; Andreotti, A.H. Dynamic allostery mediated by a conserved tryptophan in the Tec family kinases. PLoS Comput. Biol. 2016, 12, e1004826. [Google Scholar] [CrossRef]
- Lowe, M.N.; Plosker, G.L. Bexarotene. Am. J. Clin. Dermatol. 2000, 1, 245–250. [Google Scholar] [CrossRef]
- Gniadecki, R.; Assaf, C.; Bagot, M.; Dummer, R.; Duvic, M.; Knobler, R.; Ranki, A.; Schwandt, P.; Whittaker, S. The optimal use of bexarotene in cutaneous T-cell lymphoma. Br. J. Dermatol. 2007, 157, 433–440. [Google Scholar] [CrossRef]
- Yang, W.; Soares, J.; Greninger, P.; Edelman, E.J.; Lightfoot, H.; Forbes, S.; Bindal, N.; Beare, D.; Smith, J.A.; Thompson, I.R. Genomics of Drug Sensitivity in Cancer (GDSC): A resource for therapeutic biomarker discovery in cancer cells. Nucleic Acids Res. 2012, 41, D955–D961. [Google Scholar] [CrossRef] [PubMed] [Green Version]
- Lambert, J.M.; Berkenblit, A. Antibody–drug conjugates for cancer treatment. Annu. Rev. Med. 2018, 69, 191–207. [Google Scholar] [CrossRef]
- Wright, W.E.; Pereira-Smith, O.M.; Shay, J.W. Reversible cellular senescence: Implications for immortalization of normal human diploid fibroblasts. Mol. Cell. Biol. 1989, 9, 3088–3092. [Google Scholar] [CrossRef] [PubMed] [Green Version]
- Dobbelstein, M.; Moll, U. Targeting tumour-supportive cellular machineries in anticancer drug development. Nat. Rev. Drug Discov. 2014, 13, 179–196. [Google Scholar] [CrossRef]
- Thomas, M.C.; Chiang, C.-M. The general transcription machinery and general cofactors. Crit. Rev. Biochem. Mol. Biol. 2006, 41, 105–178. [Google Scholar] [CrossRef]
- Ghosh, D.; Papavassiliou, A.G. Transcription factor therapeutics: Long-shot or lodestone. Curr. Med. Chem. 2005, 12, 691–701. [Google Scholar] [CrossRef]
- Drygin, D.; Lin, A.; Bliesath, J.; Ho, C.B.; O’Brien, S.E.; Proffitt, C.; Omori, M.; Haddach, M.; Schwaebe, M.K.; Siddiqui-Jain, A.; et al. Targeting RNA polymerase I with an oral small molecule CX-5461 inhibits ribosomal RNA synthesis and solid tumor growth. Cancer Res. 2011, 71, 1418–1430. [Google Scholar] [CrossRef] [Green Version]
- Quin, J.; Chan, K.T.; Devlin, J.R.; Cameron, D.P.; Diesch, J.; Cullinane, C.; Ahern, J.; Khot, A.; Hein, N.; George, A.J. Inhibition of RNA polymerase I transcription initiation by CX-5461 activates non-canonical ATM/ATR signaling. Oncotarget 2016, 7, 49800. [Google Scholar] [CrossRef] [PubMed] [Green Version]
- Xu, H.; Di Antonio, M.; McKinney, S.; Mathew, V.; Ho, B.; O’Neil, N.J.; Dos Santos, N.; Silvester, J.; Wei, V.; Garcia, J. CX-5461 is a DNA G-quadruplex stabilizer with selective lethality in BRCA1/2 deficient tumours. Nat. Commun. 2017, 8, 1–18. [Google Scholar] [CrossRef]
- Bruno, P.M.; Lu, M.; Dennis, K.A.; Inam, H.; Moore, C.J.; Sheehe, J.; Elledge, S.J.; Hemann, M.T.; Pritchard, J.R. The primary mechanism of cytotoxicity of the chemotherapeutic agent CX-5461 is topoisomerase II poisoning. Proc. Natl. Acad. Sci. USA 2020, 117, 4053–4060. [Google Scholar] [CrossRef]
- Moir, R.D.; Willis, I.M. Regulation of pol III transcription by nutrient and stress signaling pathways. Biochim. Biophys. Acta (BBA) Gene Regul. Mech. 2013, 1829, 361–375. [Google Scholar] [CrossRef] [PubMed] [Green Version]
- Gjidoda, A.; Henry, R.W. RNA polymerase III repression by the retinoblastoma tumor suppressor protein. Biochim. Biophys. Acta (BBA) Gene Regul. Mech. 2013, 1829, 385–392. [Google Scholar] [CrossRef] [Green Version]
- Hirsch, H.A.; Jawdekar, G.W.; Lee, K.-A.; Gu, L.; Henry, R.W. Distinct mechanisms for repression of RNA polymerase III transcription by the retinoblastoma tumor suppressor protein. Mol. Cell. Biol. 2004, 24, 5989–5999. [Google Scholar] [CrossRef] [PubMed] [Green Version]
- Guerra, B.; Issinger, O.-G. Protein kinase CK2 in human diseases. Curr. Med. Chem. 2008, 15, 1870–1886. [Google Scholar] [CrossRef]
- Hockman, D.J.; Schultz, M.C. Casein kinase II is required for efficient transcription by RNA polymerase III. Mol. Cell. Biol. 1996, 16, 892–898. [Google Scholar] [CrossRef] [Green Version]
- Ghavidel, A.; Schultz, M.C. TATA binding protein-associated CK2 transduces DNA damage signals to the RNA polymerase III transcriptional machinery. Cell 2001, 106, 575–584. [Google Scholar] [CrossRef] [Green Version]
- Felton-Edkins, Z.A.; Fairley, J.A.; Graham, E.L.; Johnston, I.M.; White, R.J.; Scott, P.H. The mitogen-activated protein (MAP) kinase ERK induces tRNA synthesis by phosphorylating TFIIIB. EMBO J. 2003, 22, 2422–2432. [Google Scholar] [CrossRef] [Green Version]
- Carracedo, A.; Pandolfi, P.P. The PTEN–PI3K pathway: Of feedbacks and cross-talks. Oncogene 2008, 27, 5527–5541. [Google Scholar] [CrossRef] [PubMed] [Green Version]
- Woiwode, A.; Johnson, S.A.S.; Zhong, S.; Zhang, C.; Roeder, R.G.; Teichmann, M.; Johnson, D.L. PTEN represses RNA polymerase III-dependent transcription by targeting the TFIIIB complex. Mol. Cell. Biol. 2008, 28, 4204–4214. [Google Scholar] [CrossRef] [PubMed] [Green Version]
- Dasari, S.; Tchounwou, P.B. Cisplatin in cancer therapy: Molecular mechanisms of action. Eur. J. Pharmacol. 2014, 740, 364–378. [Google Scholar] [CrossRef] [PubMed] [Green Version]
- Basu, A.; Krishnamurthy, S. Cellular responses to Cisplatin-induced DNA damage. J. Nucleic Acids 2010, 2010, 201367. [Google Scholar] [CrossRef] [Green Version]
- Sears, C.R.; Turchi, J.J. Complex cisplatin-double strand break (DSB) lesions directly impair cellular non-homologous end-joining (NHEJ) independent of downstream damage response (DDR) pathways. J. Biol. Chem. 2012, 287, 24263–24272. [Google Scholar] [CrossRef] [Green Version]
- Martins, N.M.; Santos, N.; Curti, C.; Bianchi, M.; Santos, A. Cisplatin induces mitochondrial oxidative stress with resultant energetic metabolism impairment, membrane rigidification and apoptosis in rat liver. J. Appl. Toxicol. An Int. J. 2008, 28, 337–344. [Google Scholar] [CrossRef]
- Gavande, N.S.; VanderVere-Carozza, P.S.; Hinshaw, H.D.; Jalal, S.I.; Sears, C.R.; Pawelczak, K.S.; Turchi, J.J. DNA repair targeted therapy: The past or future of cancer treatment? Pharmacol. Ther. 2016, 160, 65–83. [Google Scholar] [CrossRef] [PubMed]
- Brozovic, A.; Ambriović-Ristov, A.; Osmak, M. The relationship between cisplatin-induced reactive oxygen species, glutathione, and BCL-2 and resistance to cisplatin. Crit. Rev. Toxicol. 2010, 40, 347–359. [Google Scholar] [CrossRef] [PubMed]
- Ma, Q. Role of nrf2 in oxidative stress and toxicity. Annu. Rev. Pharmacol. Toxicol. 2013, 53, 401–426. [Google Scholar] [CrossRef] [PubMed] [Green Version]
- Li, Y.; Xing, Q.; Wei, Y.; Zhao, L.; Zhang, P.; Han, X.; Wang, J. Activation of RXR by bexarotene inhibits inflammatory conditions in human rheumatoid arthritis fibroblast-like synoviocytes. Int. J. Mol. Med. 2019, 44, 1963–1970. [Google Scholar] [CrossRef]


| Primary Antibodies | |
| Polyclonal rabbit anti-COX IV (WB-1:1000) | Millennium Science Mulgrave, Vic, Australia |
| Monoclonal Mouse anti-yH2AX (WB, IF-1:1000) | Merck Millipore, Darmstadt, Germany |
| Polyclonal rabbit anti-BRF2 (WB-1:1000, IF-1:400) | Sapphire Bioscience, Redfern, NSW, Australia |
| Polyclonal rabbit anti-p53-s15 (WB-1:1000) | Sapphire Bioscience, Redfern, NSW Australia |
| Polyclonal rabbit anti-phospho KAP1 (WB-1:1000) | Bethyl laboratories, Inc. USA |
| Monoclonal Mouse anti-RAD51 (WB-1:1000) | GenTex Inc., USA |
| Polyclonal Rabbit anti-NRF2 (WB-1:1000) | Santa Cruz Biotechnology Dallas, Texas, USA |
| Monoclonal Mouse anti-NBS1 (WB-1:1000) | Becton Dickinson Biosciences, USA |
| Polyclonal Rabbit anti-MRE11 (WB-1:1000) | Becton Dickinson Biosciences, USA |
| Polyclonal Rabbit anti-H3 (WB-1:1000) | Abcam®, Cambridge, MA, USA |
| Secondary Antibodies | |
| Polyclonal anti-rabbit-antibody (IgG) Peroxidase-conjugate (from goat) (WB-1:3000) | Merck Millipore, Darmstadt, Germany |
| Polyclonal anti-mouse-antibody (IgG) Peroxidase-conjugate (from goat) (WB-1:3000) | Merck Millipore, Darmstadt, Germany |
| Target | Best Ligands | Binding Energy (kcal/mol) | Function |
|---|---|---|---|
| Protein: BRF2 PDB: 4ROC | Phthalocyanine | −10.5 | An drug that is under investigation in clinical trial NCT00103246 for the treatment of patients with skin cancer, Bowen’s disease, actinic keratosis, and stage I/II mycosis fungoides. |
| CD564 | −10.1 | Under investigation | |
| Alectinib | −9.9 | A second-generation oral drug that selectively inhibits the activity of anaplastic lymphoma kinase (ALK) tyrosine kinase. | |
| Zk-806450 | −9.8 | Under investigation | |
| SR11254 | −9.7 | Under investigation | |
| BMS184394 | −9.7 | Under investigation | |
| AZD-5991 | −9.7 | An drug under investigation in clinical trial NCT03218683 for relapsed or refractory hematologic malignancies. | |
| Bemcentinib | −9.6 | Bemcentinib has been investigated for the treatment of non-small cell lung cancer. | |
| Pranlukast | −9.6 | A cysteinyl leukotriene receptor-1 antagonist which antagonises/reduces bronchospasm caused in asthmatics by an allergic reaction to accidentally or inadvertently encountered allergens. | |
| DB07456 | −9.5 | Under investigation | |
| TMC-647055 | −9.5 | TMC647055 has been used in trials studying the treatment of hepatitis C, chronic hepatitis C virus | |
| Aleplasinin | −9.5 | Aleplasinin has been investigated in the treatment of Alzheimer’s disease. | |
| Orvepitant | −9.5 | Orvepitant has been used in trials studying the treatment of depressive disorder and post-traumatic stress disorder (PTSD). | |
| Galicaftor | −9.4 | A drug under investigation in clinical trial NCT03540524 with or without GLPG2737 in patients with cystic fibrosis. | |
| Baloxavir | −9.3 | A drug under investigation in clinical trial NCT04327791 in combination therapy with baloxavir/oseltamavir 1 for patients with influenza. |
| (kCal/mol) | ∆Gvdw | ∆Gelec | ∆Gsolv-polar | ∆Gsolv-nonpol | ∆GMMPBSA |
|---|---|---|---|---|---|
| Native | −163.389 | −427.767 | 197.664 | −18.567 | −412.059 |
Publisher’s Note: MDPI stays neutral with regard to jurisdictional claims in published maps and institutional affiliations. |
© 2021 by the authors. Licensee MDPI, Basel, Switzerland. This article is an open access article distributed under the terms and conditions of the Creative Commons Attribution (CC BY) license (https://creativecommons.org/licenses/by/4.0/).
Share and Cite
Rashidieh, B.; Molakarimi, M.; Mohseni, A.; Tria, S.M.; Truong, H.; Srihari, S.; Adams, R.C.; Jones, M.; Duijf, P.H.G.; Kalimutho, M.; et al. Targeting BRF2 in Cancer Using Repurposed Drugs. Cancers 2021, 13, 3778. https://doi.org/10.3390/cancers13153778
Rashidieh B, Molakarimi M, Mohseni A, Tria SM, Truong H, Srihari S, Adams RC, Jones M, Duijf PHG, Kalimutho M, et al. Targeting BRF2 in Cancer Using Repurposed Drugs. Cancers. 2021; 13(15):3778. https://doi.org/10.3390/cancers13153778
Chicago/Turabian StyleRashidieh, Behnam, Maryam Molakarimi, Ammar Mohseni, Simon Manuel Tria, Hein Truong, Sriganesh Srihari, Rachael C. Adams, Mathew Jones, Pascal H. G. Duijf, Murugan Kalimutho, and et al. 2021. "Targeting BRF2 in Cancer Using Repurposed Drugs" Cancers 13, no. 15: 3778. https://doi.org/10.3390/cancers13153778