Article

Prediction of Microvascular Invasion in Hepatocellular Carcinoma via Deep Learning: A Multi-Center and Prospective Validation Study

1
Key Laboratory of Molecular Imaging, Institute of Automation, Chinese Academy of Sciences, Beijing 100190, China
2
Beijing Key Laboratory of Molecular Imaging, Beijing 100190, China
3
Department of Radiology, West China Hospital, Sichuan University, Chengdu 610041, China
4
Department of Radiology, Zhongshan Hospital, Fudan University, Shanghai 200032, China
5
Shanghai Institute of Medical Imaging, Shanghai 200032, China
6
Department of Medical Imaging, Henan Provincial People’s Hospital, Zhengzhou 450003, China
7
Department of Medical Imaging, People’s Hospital of Zhengzhou University, Zhengzhou 450003, China
8
Department of Interventional Radiology, The First Affiliated Hospital of China Medical University, Shenyang 110000, China
9
Department of Radiology, Beijing Youan Hospital, Capital Medical Universtiy, Beijing 100069, China
10
SenseBrain Research, Santa Clara, CA 95131, USA
11
Department of Pathology, Beijing Youan Hospital, Capital Medical Universtiy, Beijing 100069, China
12
Department of Radiology, Duke University Medical Center, Durham, NC 27710, USA
13
School of Bioengineering, Beihang University, Beijing 100191, China
14
Beijing Advanced Innovation Center for Big Data-Based Precision Medicine, School of Medicine, Beihang University, Beijing 100191, China
15
Engineering Research Center of Molecular and Neuro Imaging of Ministry of Education, School of Life Science and Technology, Xidian University, Xi’an 710126, China
*
Authors to whom correspondence should be addressed.
These authors contributed equally to this work.
Cancers 2021, 13(10), 2368; https://doi.org/10.3390/cancers13102368
Submission received: 26 March 2021 / Revised: 6 May 2021 / Accepted: 9 May 2021 / Published: 14 May 2021
(This article belongs to the Collection Artificial Intelligence in Oncology)

Abstract

:

Simple Summary

Microvascular invasion (MVI) is an independent risk factor for postoperative recurrence of hepatocellular carcinoma (HCC). Preoperative knowledge of MVI would assist with tailored surgical strategy making to prolong patient survival. Previous radiological studies proved the role of noninvasive medical imaging in MVI prediction. However, hitherto, deep learning methods remained unexplored for this clinical task. As an end-to-end self-learning strategy, deep learning may not only achieve improved prediction accuracy, but may also visualize high-risk areas of invasion by generating attention maps. In this multicenter study, we developed deep learning models to perform MVI preoperative assessments using two imaging modalities—computed tomography (CT) and gadoxetic acid-enhanced magnetic resonance imaging (EOB-MRI). A head-to-head prospective validation was conducted to verify the validity of deep learning models and achieve a comparison between CT and EOB-MRI for MVI assessment. The findings put forward a better understanding of MVI preoperative prediction in HCC management.

Abstract

Microvascular invasion (MVI) is a critical risk factor for postoperative recurrence of hepatocellular carcinoma (HCC). Preknowledge of MVI would assist tailored surgery planning in HCC management. In this multicenter study, we aimed to explore the validity of deep learning (DL) in MVI prediction using two imaging modalities—contrast-enhanced computed tomography (CE-CT) and gadoxetic acid-enhanced magnetic resonance imaging (EOB-MRI). A total of 750 HCCs were enrolled from five Chinese tertiary hospitals. Retrospective CE-CT (n = 306, collected between March, 2013 and July, 2019) and EOB-MRI (n = 329, collected between March, 2012 and March, 2019) data were used to train two DL models, respectively. Prospective external validation (n = 115, collected between July, 2015 and February, 2018) was performed to assess the developed models. Furthermore, DL-based attention maps were utilized to visualize high-risk MVI regions. Our findings revealed that the EOB-MRI-based DL model achieved superior prediction outcome to the CE-CT-based DL model (area under receiver operating characteristics curve (AUC): 0.812 vs. 0.736, p = 0.038; sensitivity: 70.4% vs. 57.4%, p = 0.015; specificity: 80.3% vs. 86.9%, p = 0.052). DL attention maps could visualize peritumoral high-risk areas with genuine histopathologic confirmation. Both DL models could stratify high and low-risk groups regarding progression free survival and overall survival (p < 0.05). Thus, DL can be an efficient tool for MVI prediction, and EOB-MRI was proven to be the modality with advantage for MVI assessment than CE-CT.

1. Introduction

Hepatocellular carcinoma (HCC) is globally the sixth most prevalent malignancy and third leading cause of cancer-related death [1]. Despite extensive efforts made in the surveillance and treatment of HCC, postoperative recurrence at five years still remains a major challenge [2,3]. Microvascular invasion (MVI), a histological feature indicative of more aggressive biological behavior, is an independent risk factor for the postoperative recurrence [4,5]. The presence of MVI suggests an extended surgical margin in early-stage HCCs, and prompts bridging therapy/resection in patients awaiting liver transplantation [6,7,8,9,10]. Thus, gaining preoperative knowledge of MVI is of great clinical relevance in HCC treatment management.
Current diagnosis of MVI relies on histopathologic examination, which hinders its influence on preoperative treatment planning [11]. Additionally, noninvasive imaging plays an increasingly important role in MVI assessment. Radiological indicators including non-smooth tumor margins, incomplete capsule and peritumoral hypointensity on hepatobiliary phase (HBP) were proven to be correlated with MVI [9,10,11]. Quantitative radiomics analysis via extracting textural features improves the predictive accuracy using either contrast-enhanced computed tomography (CE-CT) or gadoxetic acid-enhanced magnetic resonance imaging (EOB-MRI) [12,13,14,15]. These efforts showed the potential of noninvasive imaging for MVI preoperative prediction.
Deep learning (DL) has shown excellent performance in liver mass differentiation and fibrosis classification, providing comparable diagnostic accuracy with the pathological gold standard [16,17]. However, this technique has not yet been tried for MVI histopathologic outcome prediction. Other than traditional radiological and radiomics methods, DL is worth being explored to heighten MVI predictive accuracy. Furthermore, DL could provide a novel way for visualization of MVI-related high-risk areas via generation of attention maps [18]. Previous studies mainly focused on prediction of whether MVI exists. DL may detail the radiological characteristics of MVI and offer additional fundamental information for oncologists or surgeons [6,7]. However, to the best of our knowledge, visualization of high-risk areas of MVI is unrealized in current phase studies.
In addition, although CE-CT and EOB-MRI were both proven to be efficient for MVI prediction, rare evidence was achieved to weigh their assessment powers [9,10,11,12,13,14,15]. Compared with CE-CT, EOB-MRI was preferable for detection of subtle morphological and functional changes but was more time and cost-consuming [19,20]. So far, whether quantitative imaging analysis on CE-CT would compete EOB-MRI for MVI prediction is still unrevealed. Considering patient benefit and cost efficiency, a head-to-head comparison between the two imaging modalities is necessary to optimize the pretreatment management for MVI assessment.
To address above challenges, we totally enrolled 750 HCCs from five independent hospitals in China to construct DL models for MVI preoperative assessment using CE-CT and EOB-MRI, respectively. A head-to-head comparison between CE-CT and EOB-MRI was performed on a prospective cohort with dual-modality imaging acquisition. To the best of our knowledge, this was the first study to achieve MVI prediction via DL, which would push forward the role of noninvasive imaging in MVI preoperative management.

2. Materials and Methods
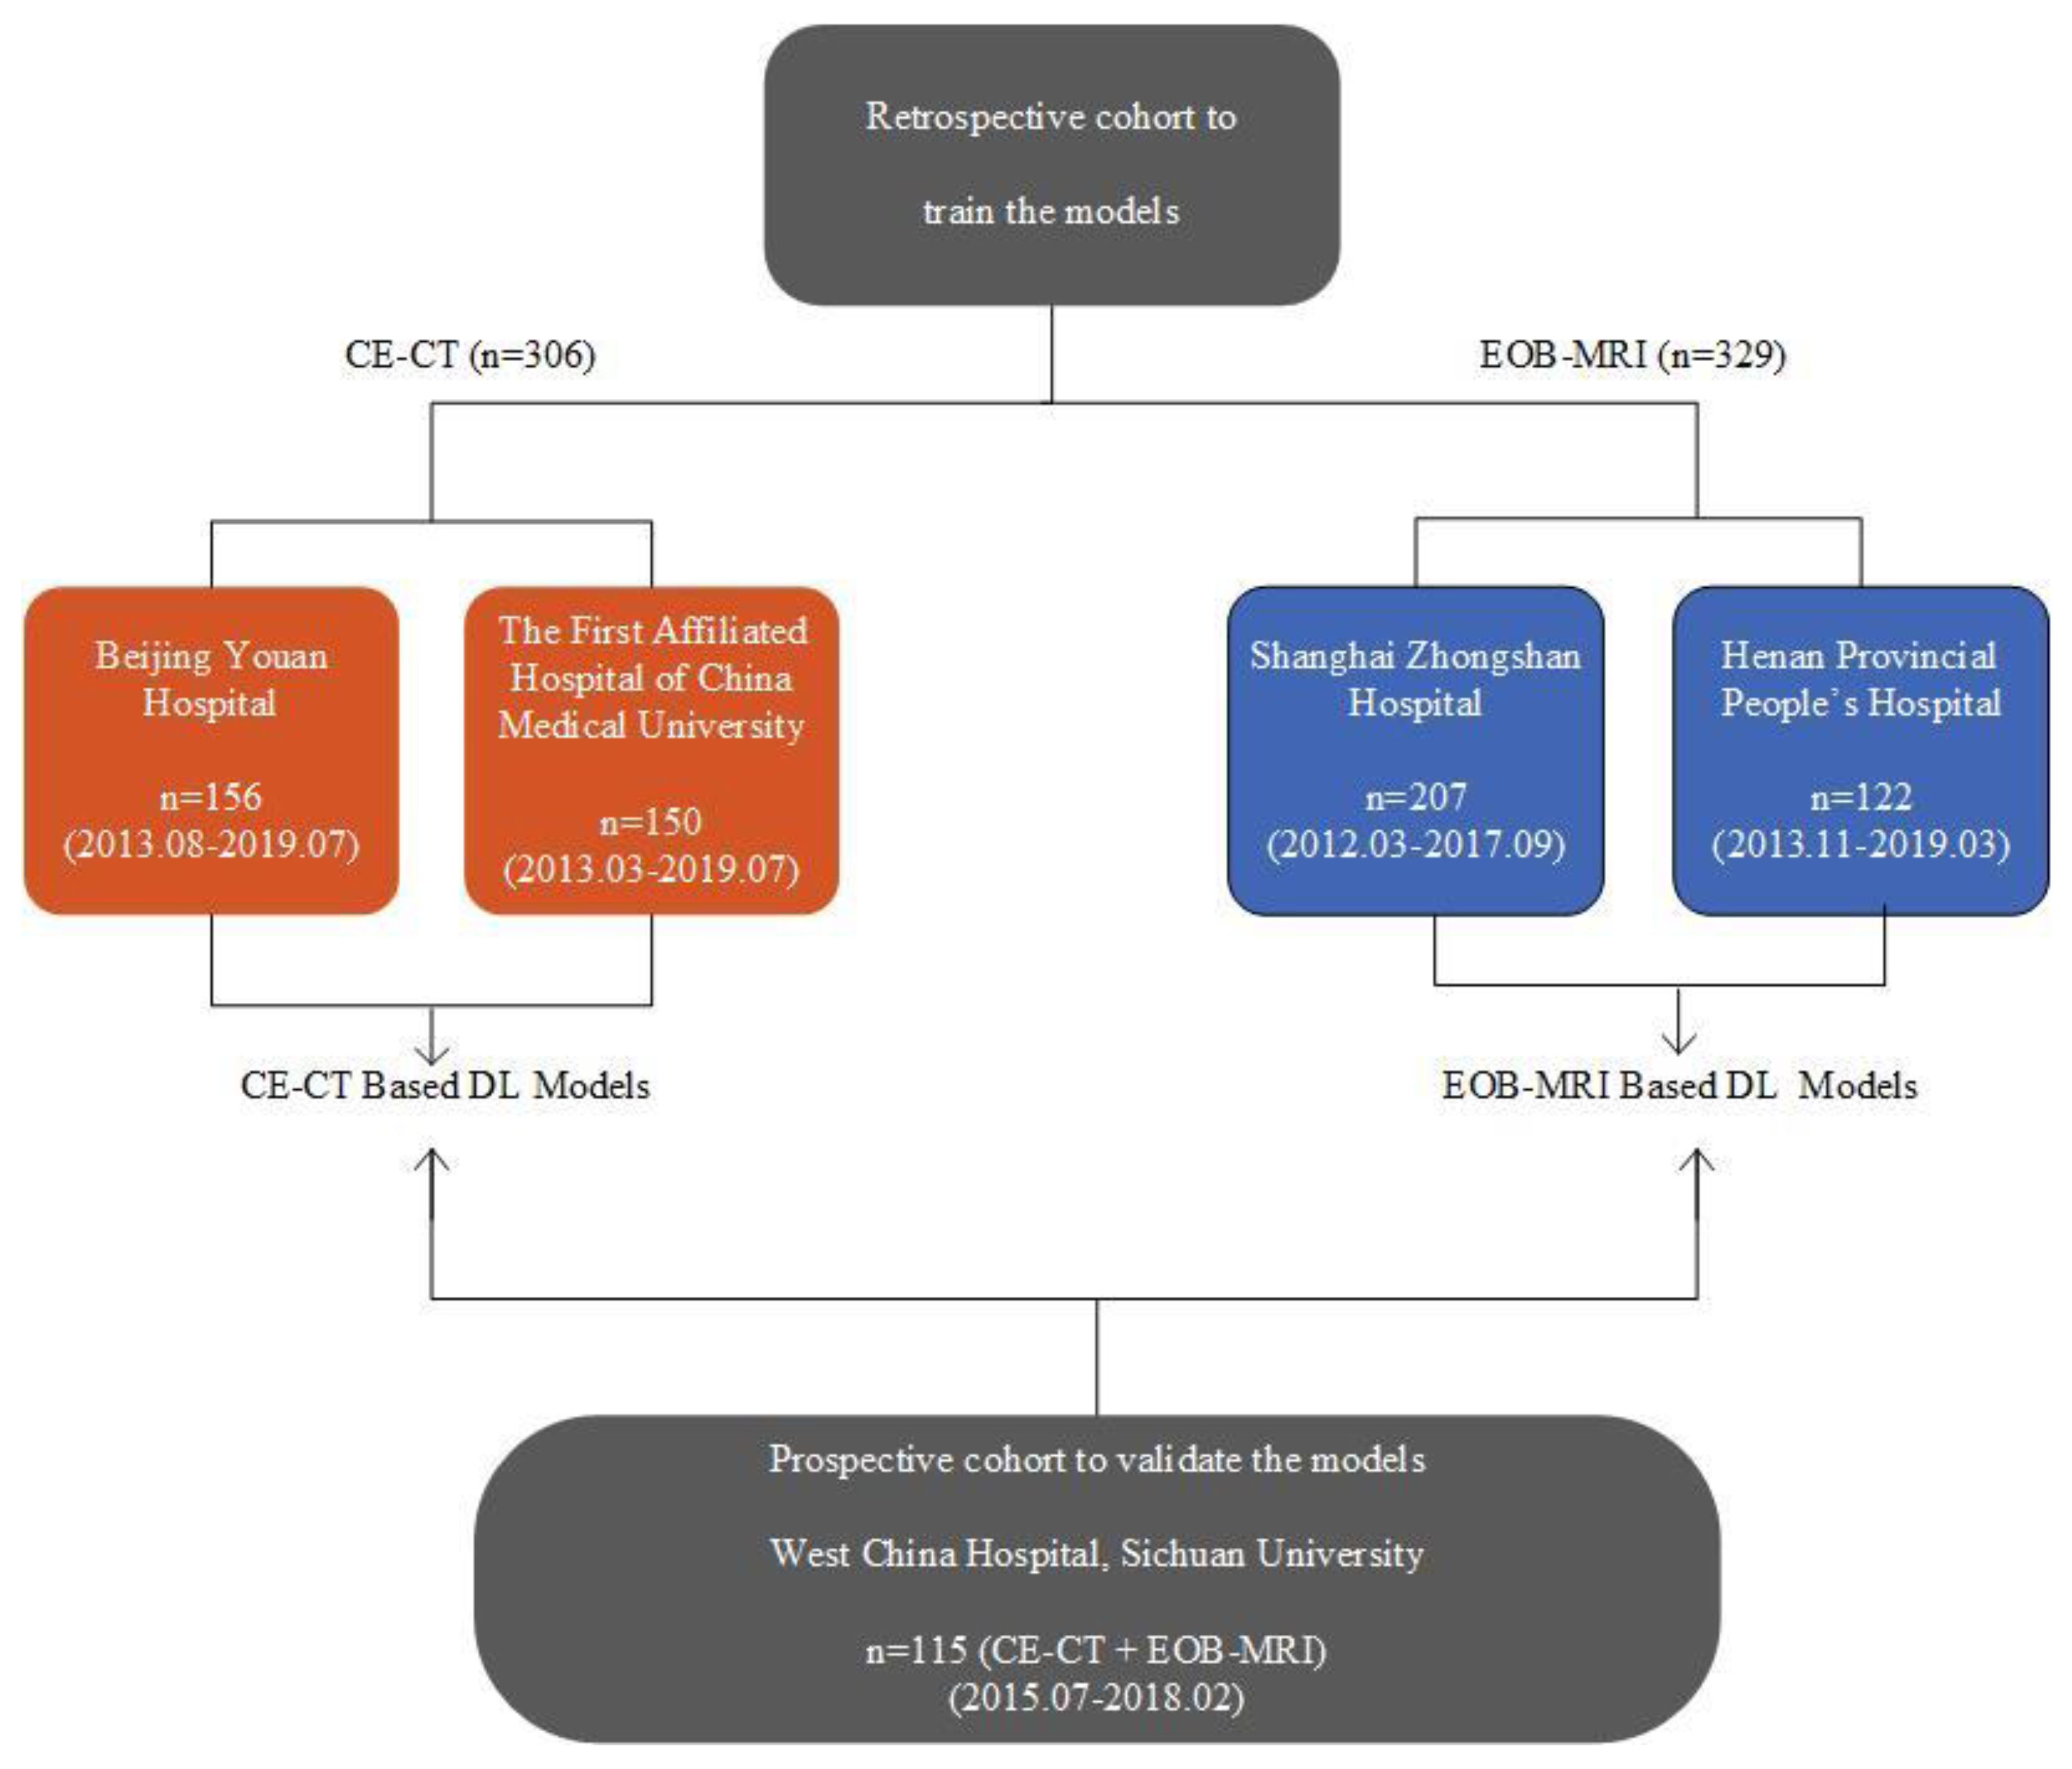
2.1. Patients

This was a multi-institutional study conducted at 5 independent hospitals with a total collection of 750 patients. The clinical trial was registered at Chinese Clinical Trial Registry (ChiCTR1900027103). The institutional review boards approved the retrospective collection of the data and the requirements for informed consent were waived. Prospective patient enrollment was approved by the ethics committee and informed consent from all patients was obtained before the start of the recruitment. The inclusion and exclusion criteria for the retrospective and prospective data collection are shown in Table 1. The retrospective and prospective data were used for model development and independent external validation, respectively (Figure 1).
Clinical data, including patient age, gender and etiology of liver disease were recorded. Serological examinations within two weeks prior to the surgery, including total bilirubin, alanine aminotransferase, aspartate aminotransaminase, platelets and α-fetoprotein (AFP), were performed.

2.2. Histopathologic Diagnosis of MVI

Histopathologic examinations of the surgical specimens were conducted by two experienced pathologists at each site. Using a multiple-site sampling method, MVI was defined as the presence of tumor thrombi within small peritumoral vessels (branches of portal vein, hepatic vein or a large capsular vessel of the surrounding hepatic tissue lined by endothelium) detected only on microscopy. The sites of positive MVI were documented. All disagreements were resolved by consensus. Details of histopathologic diagnosis for MVI are shown in Supplementary File S1.

2.3. Imaging Acquisition

Liver CE-CT scans were obtained using various multi-detector CT scanners. CT images were acquired before and after administration of contrast medium during arterial phase (AP), portal venous phase (PVP) and delayed phase. Among them, pre-contrast, AP and PVP images were used for subsequent analyses.
All EOB-MRI examinations were performed with either 1.5T or 3.0T scanners. A total of 5 MR sequences, including T2-weighted imaging (T2WI) and T1-weighted imaging (T1WI) before and after intravenous injection of EOB at AP, PVP, transitional phase (TP) and hepatobiliary phase (HBP) were used for subsequent analyses.
Detailed descriptions of imaging acquisition protocols are summarized in Supplementary File S2.

2.4. Image Analysis

All CE-CT and EOB-MRI images were evaluated by experienced abdominal radiologists at each site (at least 2 radiologists for the retrospective cohorts and 3 for the prospective cohort), who were blinded to the clinical information and the final histopathologic diagnosis of MVI. The reviewers independently annotated a total of 14 MVI-related descriptors of the largest measurable intrahepatic lesion, including multifocality, tumor margin, peritumoral enhancement, etc. (complete descriptor list in Supplementary File S3).
For patients in the prospective cohort who underwent both preoperative CE-CT and EOB-MRI examinations, CT and MRI images were assessed in a random order in two sets, with at least a one-month washout period between sets to minimize recall bias. All disagreements between the reviewers were resolved via consensus by majority vote.

2.5. Development of DL Models

We adopted the ResNet18 convolutional neural network (CNN) as the primary branch for DL modelling. Each ResNet18 branch was pretrained by ImageNet dataset and retrained by retrospective CE-CT cohort on three CT phases, respectively [21,22]. The input region of interest (ROI) was defined as follows: The manually placed squared ROIs that contained the entire tumor on three continuous maximum axial planes. Thereafter, three corresponding single CT phased based DL signatures were generated. Fully connected layers were then added to integrate the three single signatures with clinical and radiological factors to construct the final combined DL model, CDLMCE-CT. Predictive clinical and radiological factors were selected via uni- and multi-variable logistic regression. An EOB-MRI-based model, CDLMEOB-MRI, was constructed in a similar process based on 5 MRI sequences. The detailed architecture and construction process of the CDLMs are provided in Supplementary File S4.

2.6. Model Assessment and Inter-Modality Comparison

A prospectively collected cohort was used to assess the two constructed CDLMs. The comparison between CDLMCE-CT and CDLMEOB-MRI was conducted on paired CE-CT and EOB-MRI images. Stratification analyses in subgroups were performed to explore whether different age, gender, level of AFP and tumor size influenced the predictive abilities of the CDLMs.

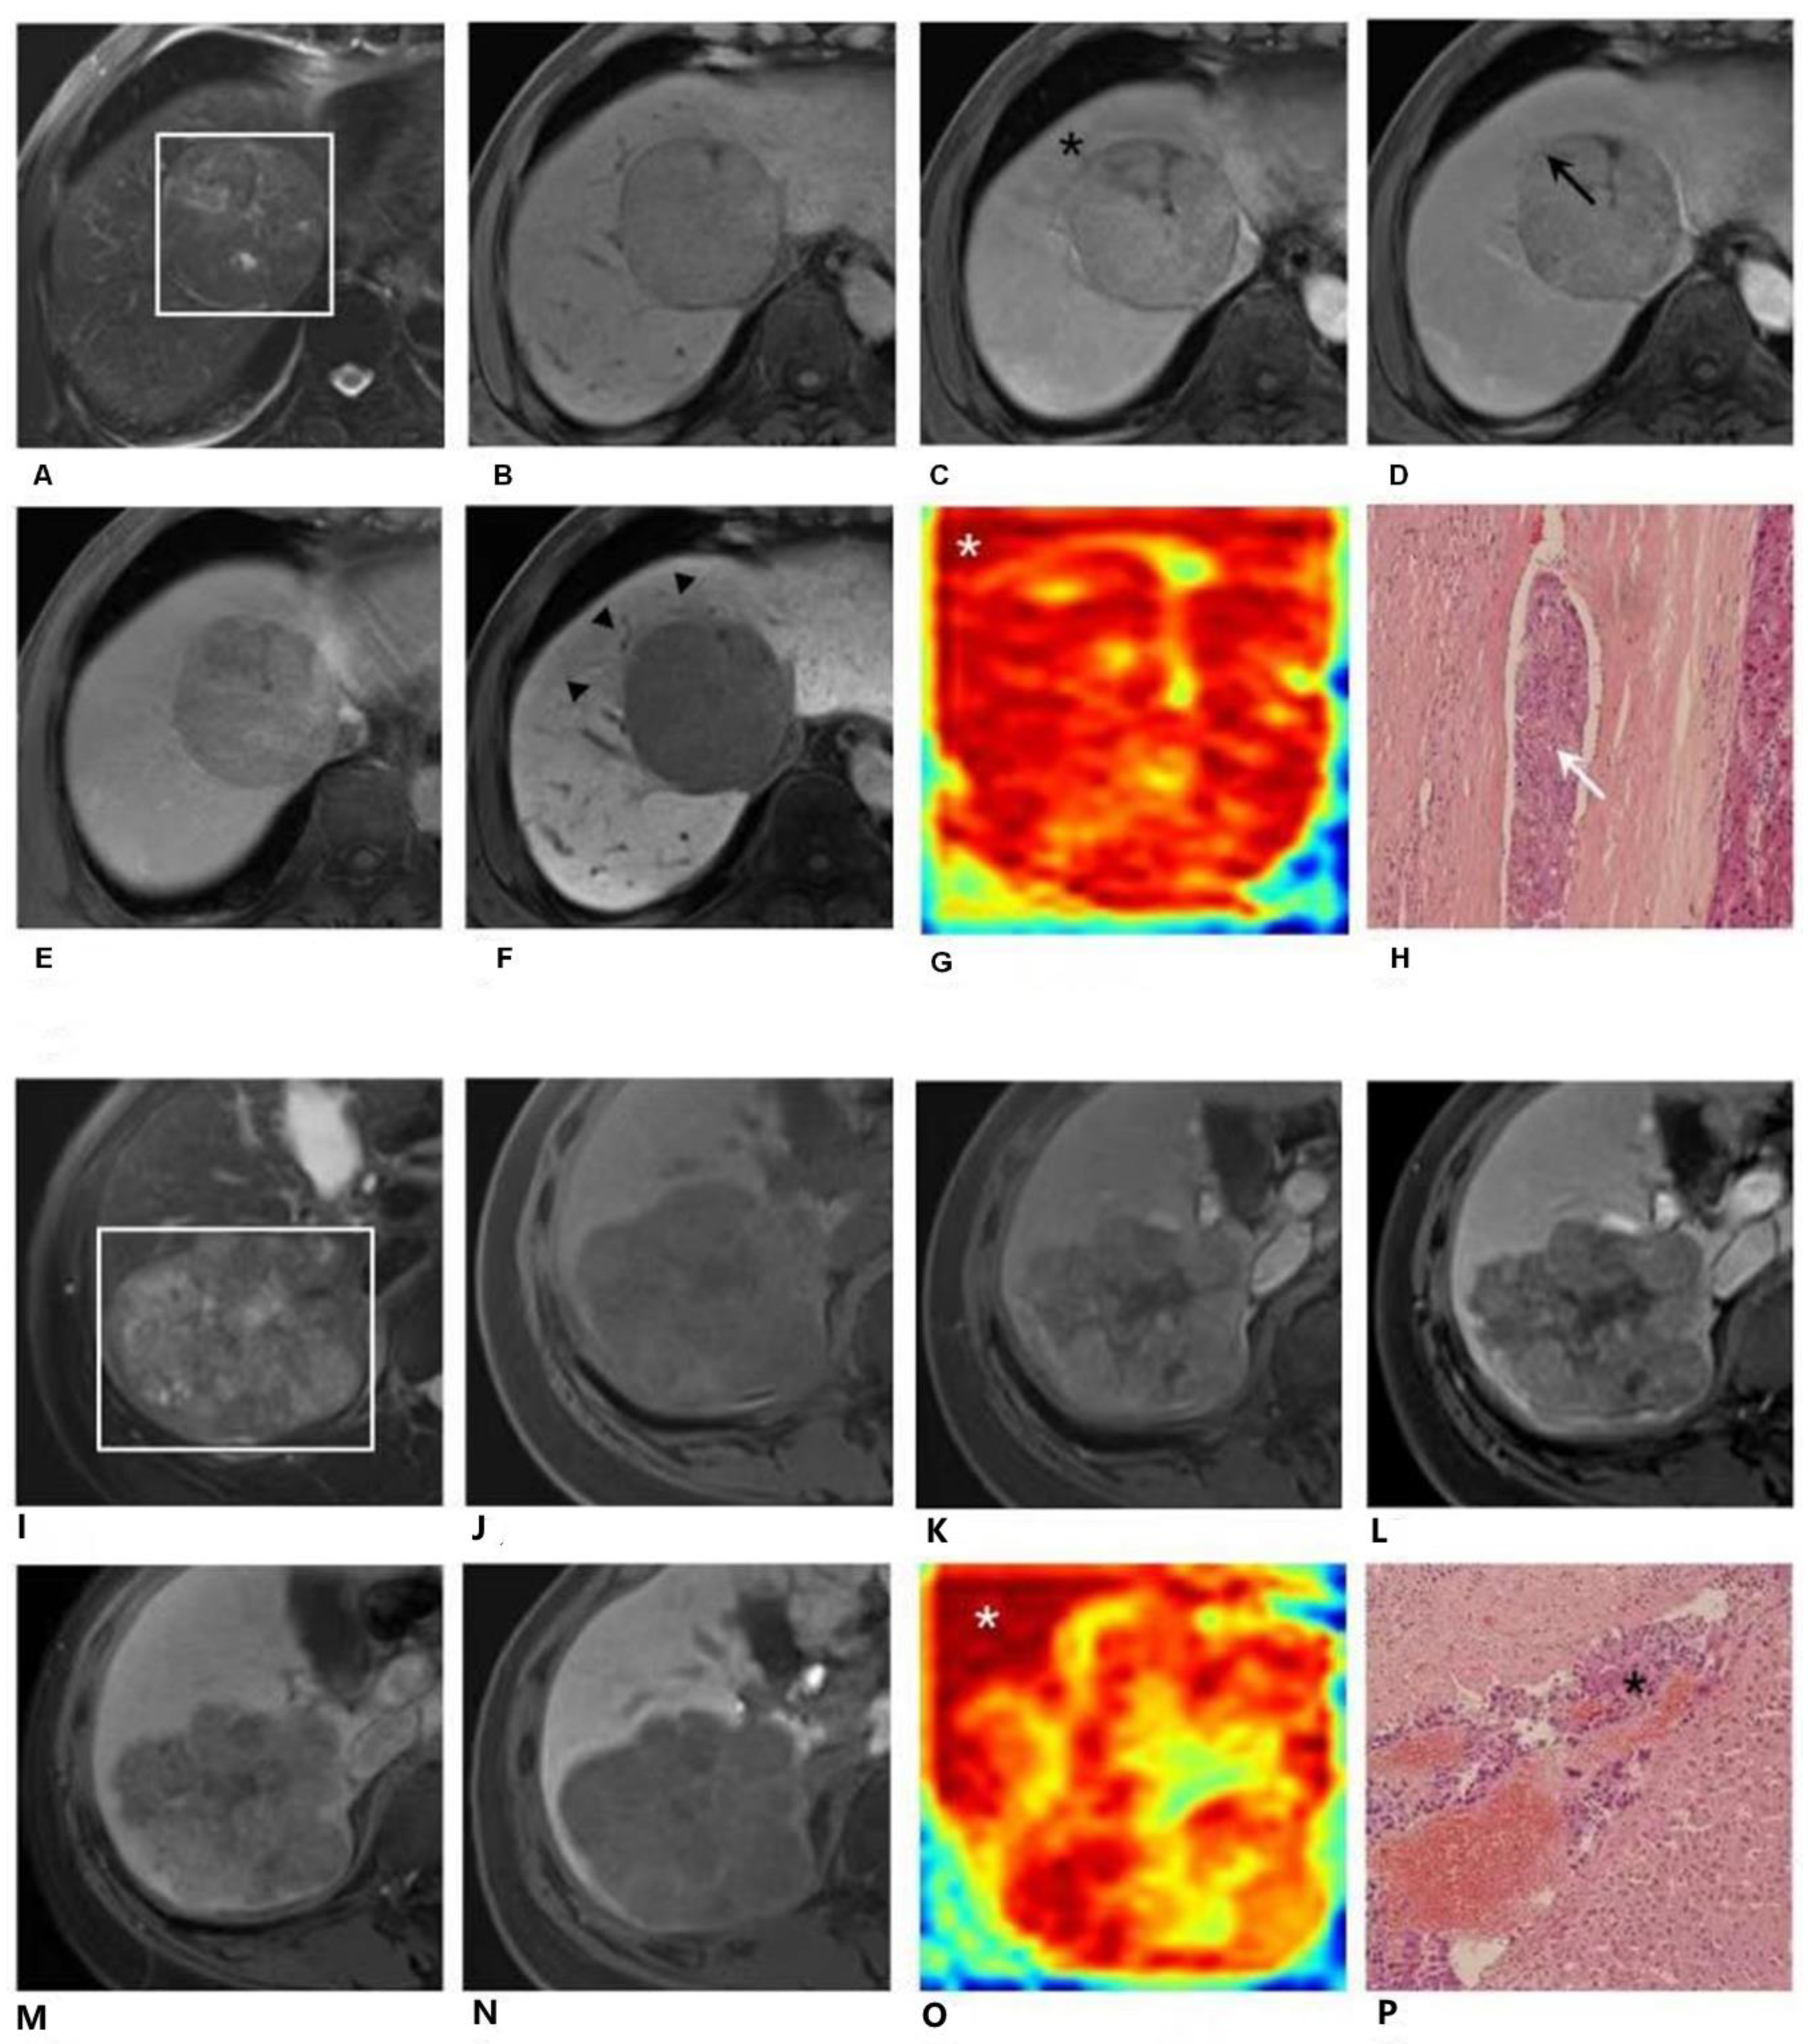
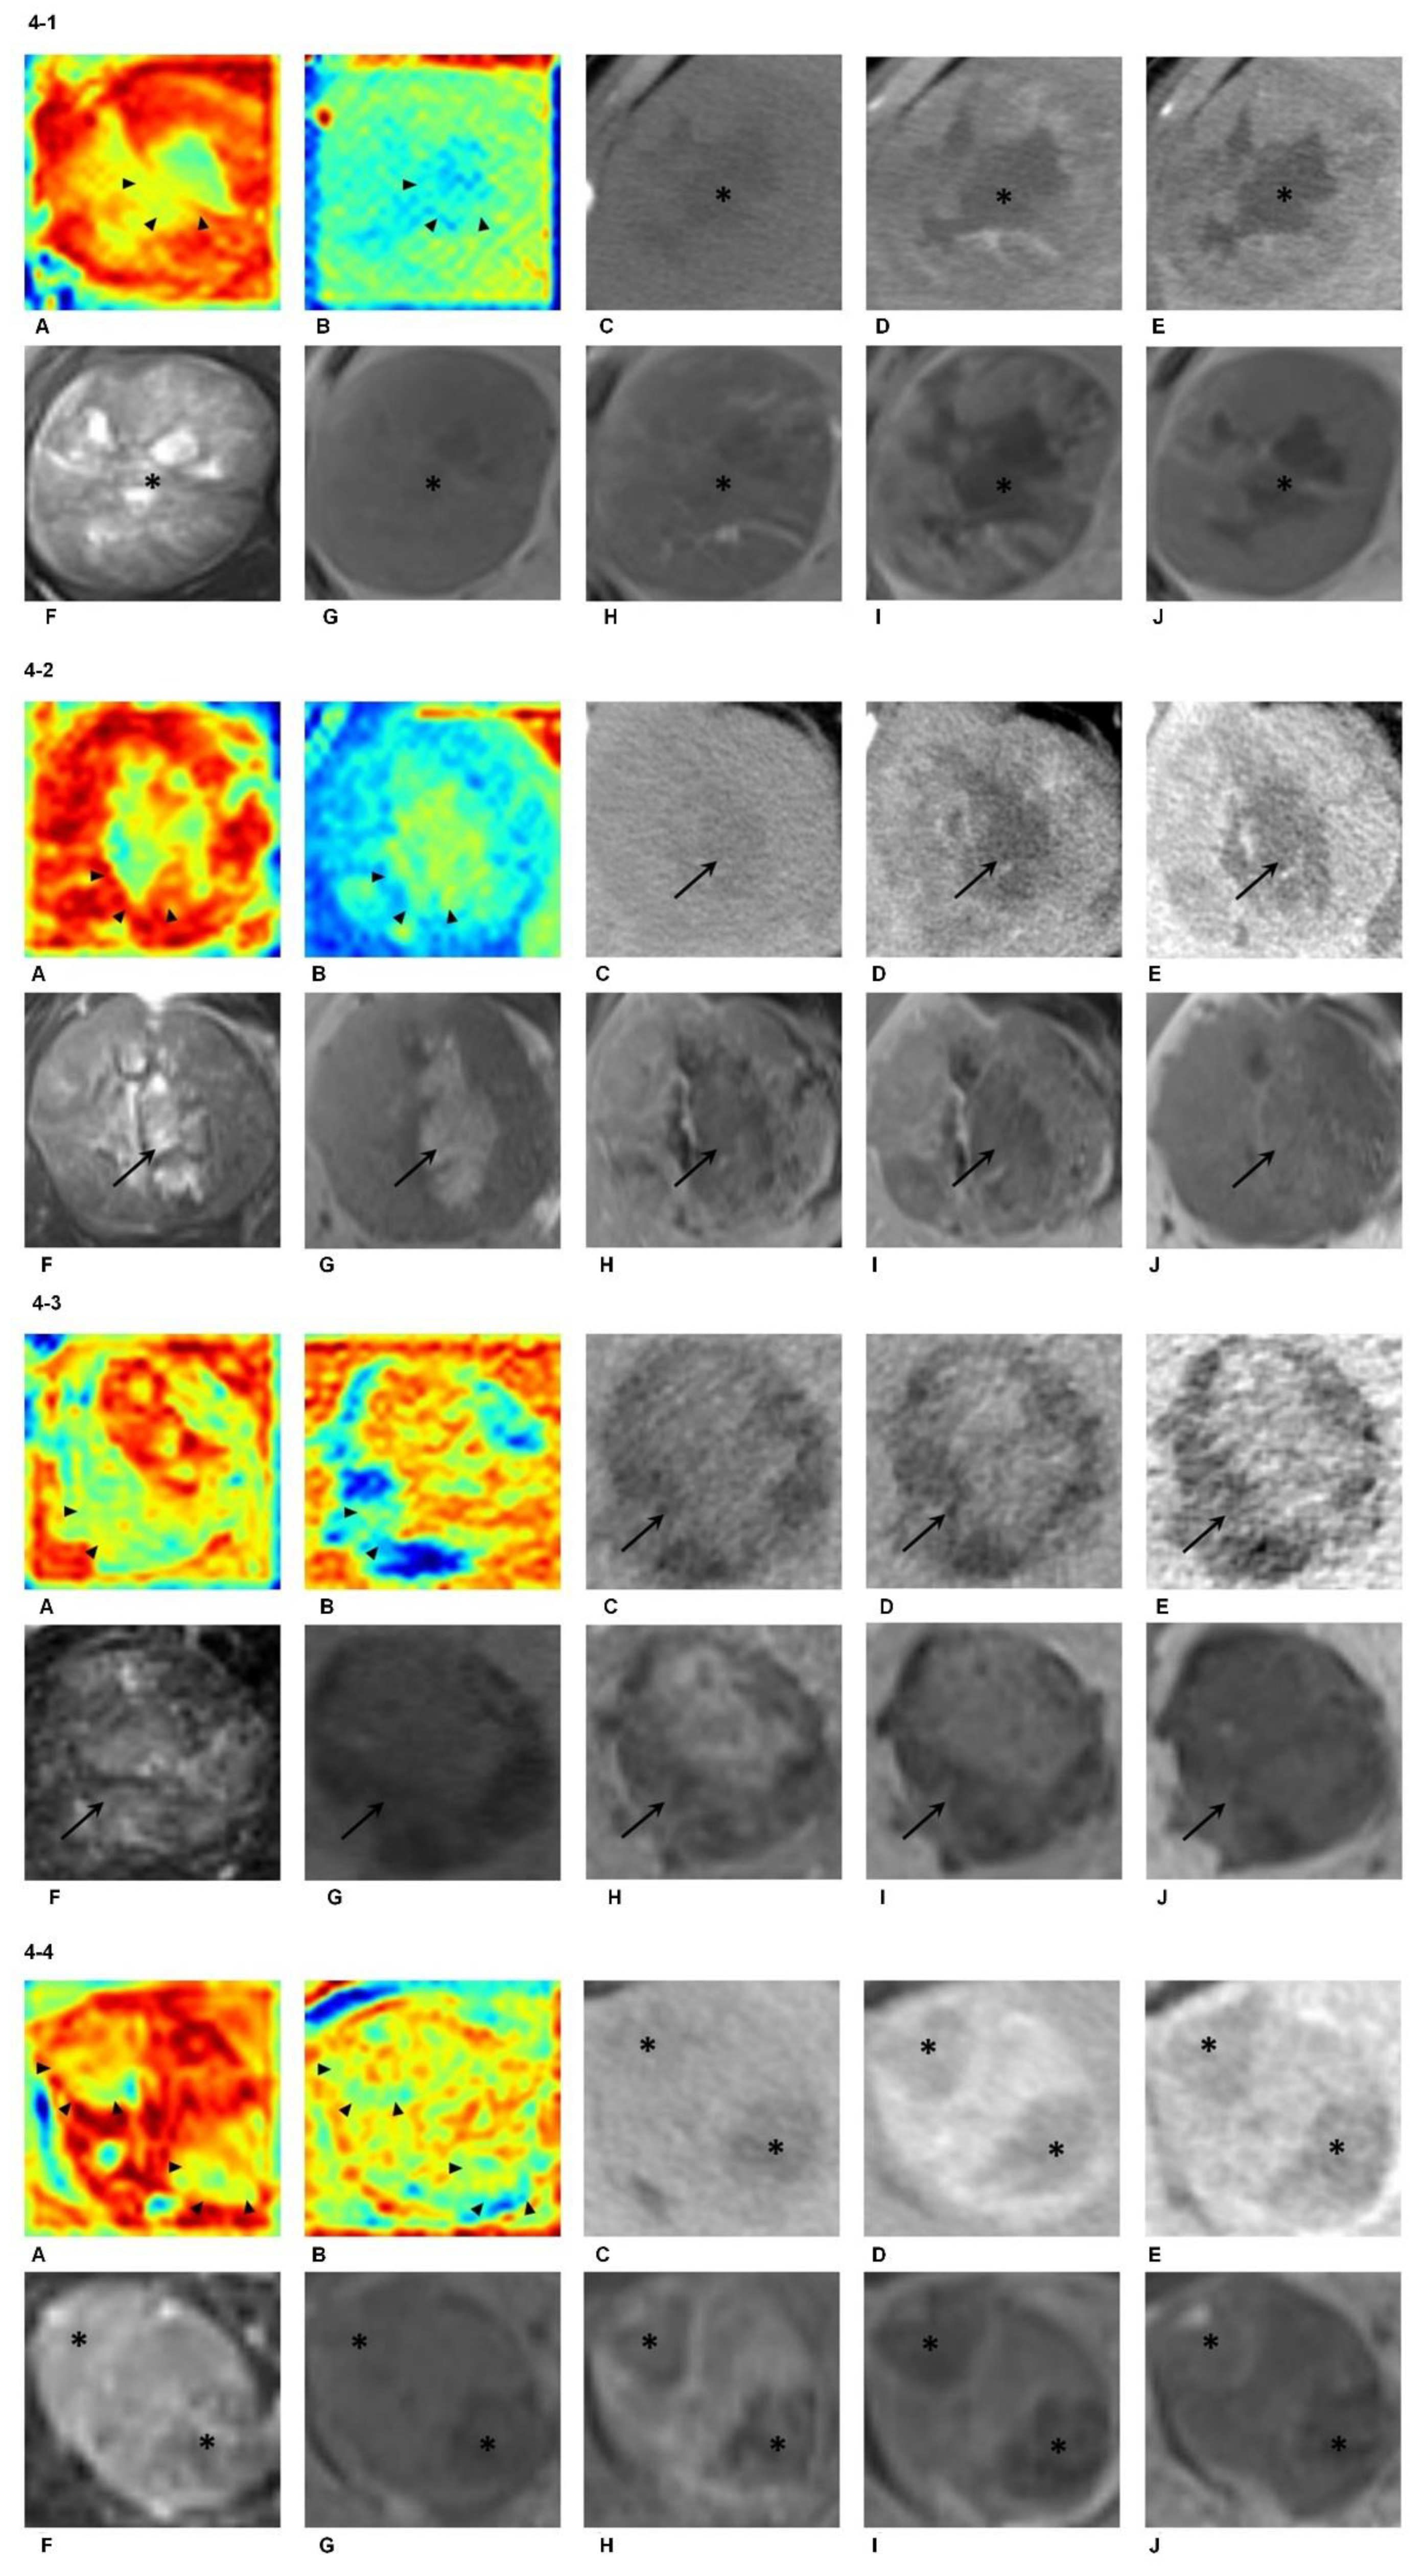
2.7. Visualization and Confirmation of the MVI High-Risk Areas

To visualize regions at high risk of MVI, we applied a gradient-based localization method to generate attention maps in the validation cohort [23,24]. The calculated gradients of the predicted values with respect to the input image would infer areas that contributed most to MVI prediction, and were shown as hot-spots on the attention maps, which was defined as CDLM-predicted high-risk areas.
To further validate CDLM-predicted high-risk areas, we performed true histopathologic confirmations. In patients of whom the postoperative sampling sites could be rigorously co-localized on preoperative radiological images, histopathologic results were used as referable confirmation for the predicted high-risk areas.

2.8. Prognostic Power Evaluation

Prospective collected patients were followed-up after surgery every three to six months with AFP and imaging modalities (CT, MRI or ultrasound). The time after resection of disease-specific progression (local recurrence or distant metastasis) or death was recorded. Patients were censored in case of death, loss to follow-up or on 1 July 2019, whichever came first. Cox proportional hazard regression models were constructed based on outputs of the CDLMCE-CT and CDLMEOB-MRI, respectively, regarding progression free survival (PFS) and overall survival (OS). Kaplan Meier curve was plotted based on cox regression models, in order to stratify the PFS and OS. The log-rank test was used to determine statistical differences between the low-risk and high-risk groups.

2.9. Statistical Analysis

We applied area under the receiver operating characteristic (ROC) curve (AUC), specificity and sensitivity for model evaluation. DeLong and McNemar tests were used to compare the diagnostic measures, where applicable. Decision curve analysis (DCA) was applied to estimate the clinical usefulness of all developed models. All statistical analyses were performed with PASW Statistics, version 18.0 (SPSS Inc., Chicago, IL, USA) and R software, version 3.4.1 (www.R-project.org (accessed on 30 June 2017)). The threshold for statistical significance was a 2-sided p < 0.05.

3. Results

3.1. Baseline Characteristics

In the training cohorts, 43.7% (114/329) and 33.3% (102/306) of lesions were histopathologically confirmed as MVI-positive in the EOB-MRI and CE-CT groups, respectively. In the validation cohort, 47% (54/115) HCC lesions were confirmed as MVI-positive. There was no significant difference in MVI either between the retrospective and prospective cohorts in CT group (both p > 0.05), or between EOB-MRI and CE-CT groups within the retrospective cohort (p > 0.05). There was a slight difference in MVI distribution between training and validation cohorts in EOB-MRI group (p = 0.025). Baseline characteristics of the cohorts included are summarized in Table 2.

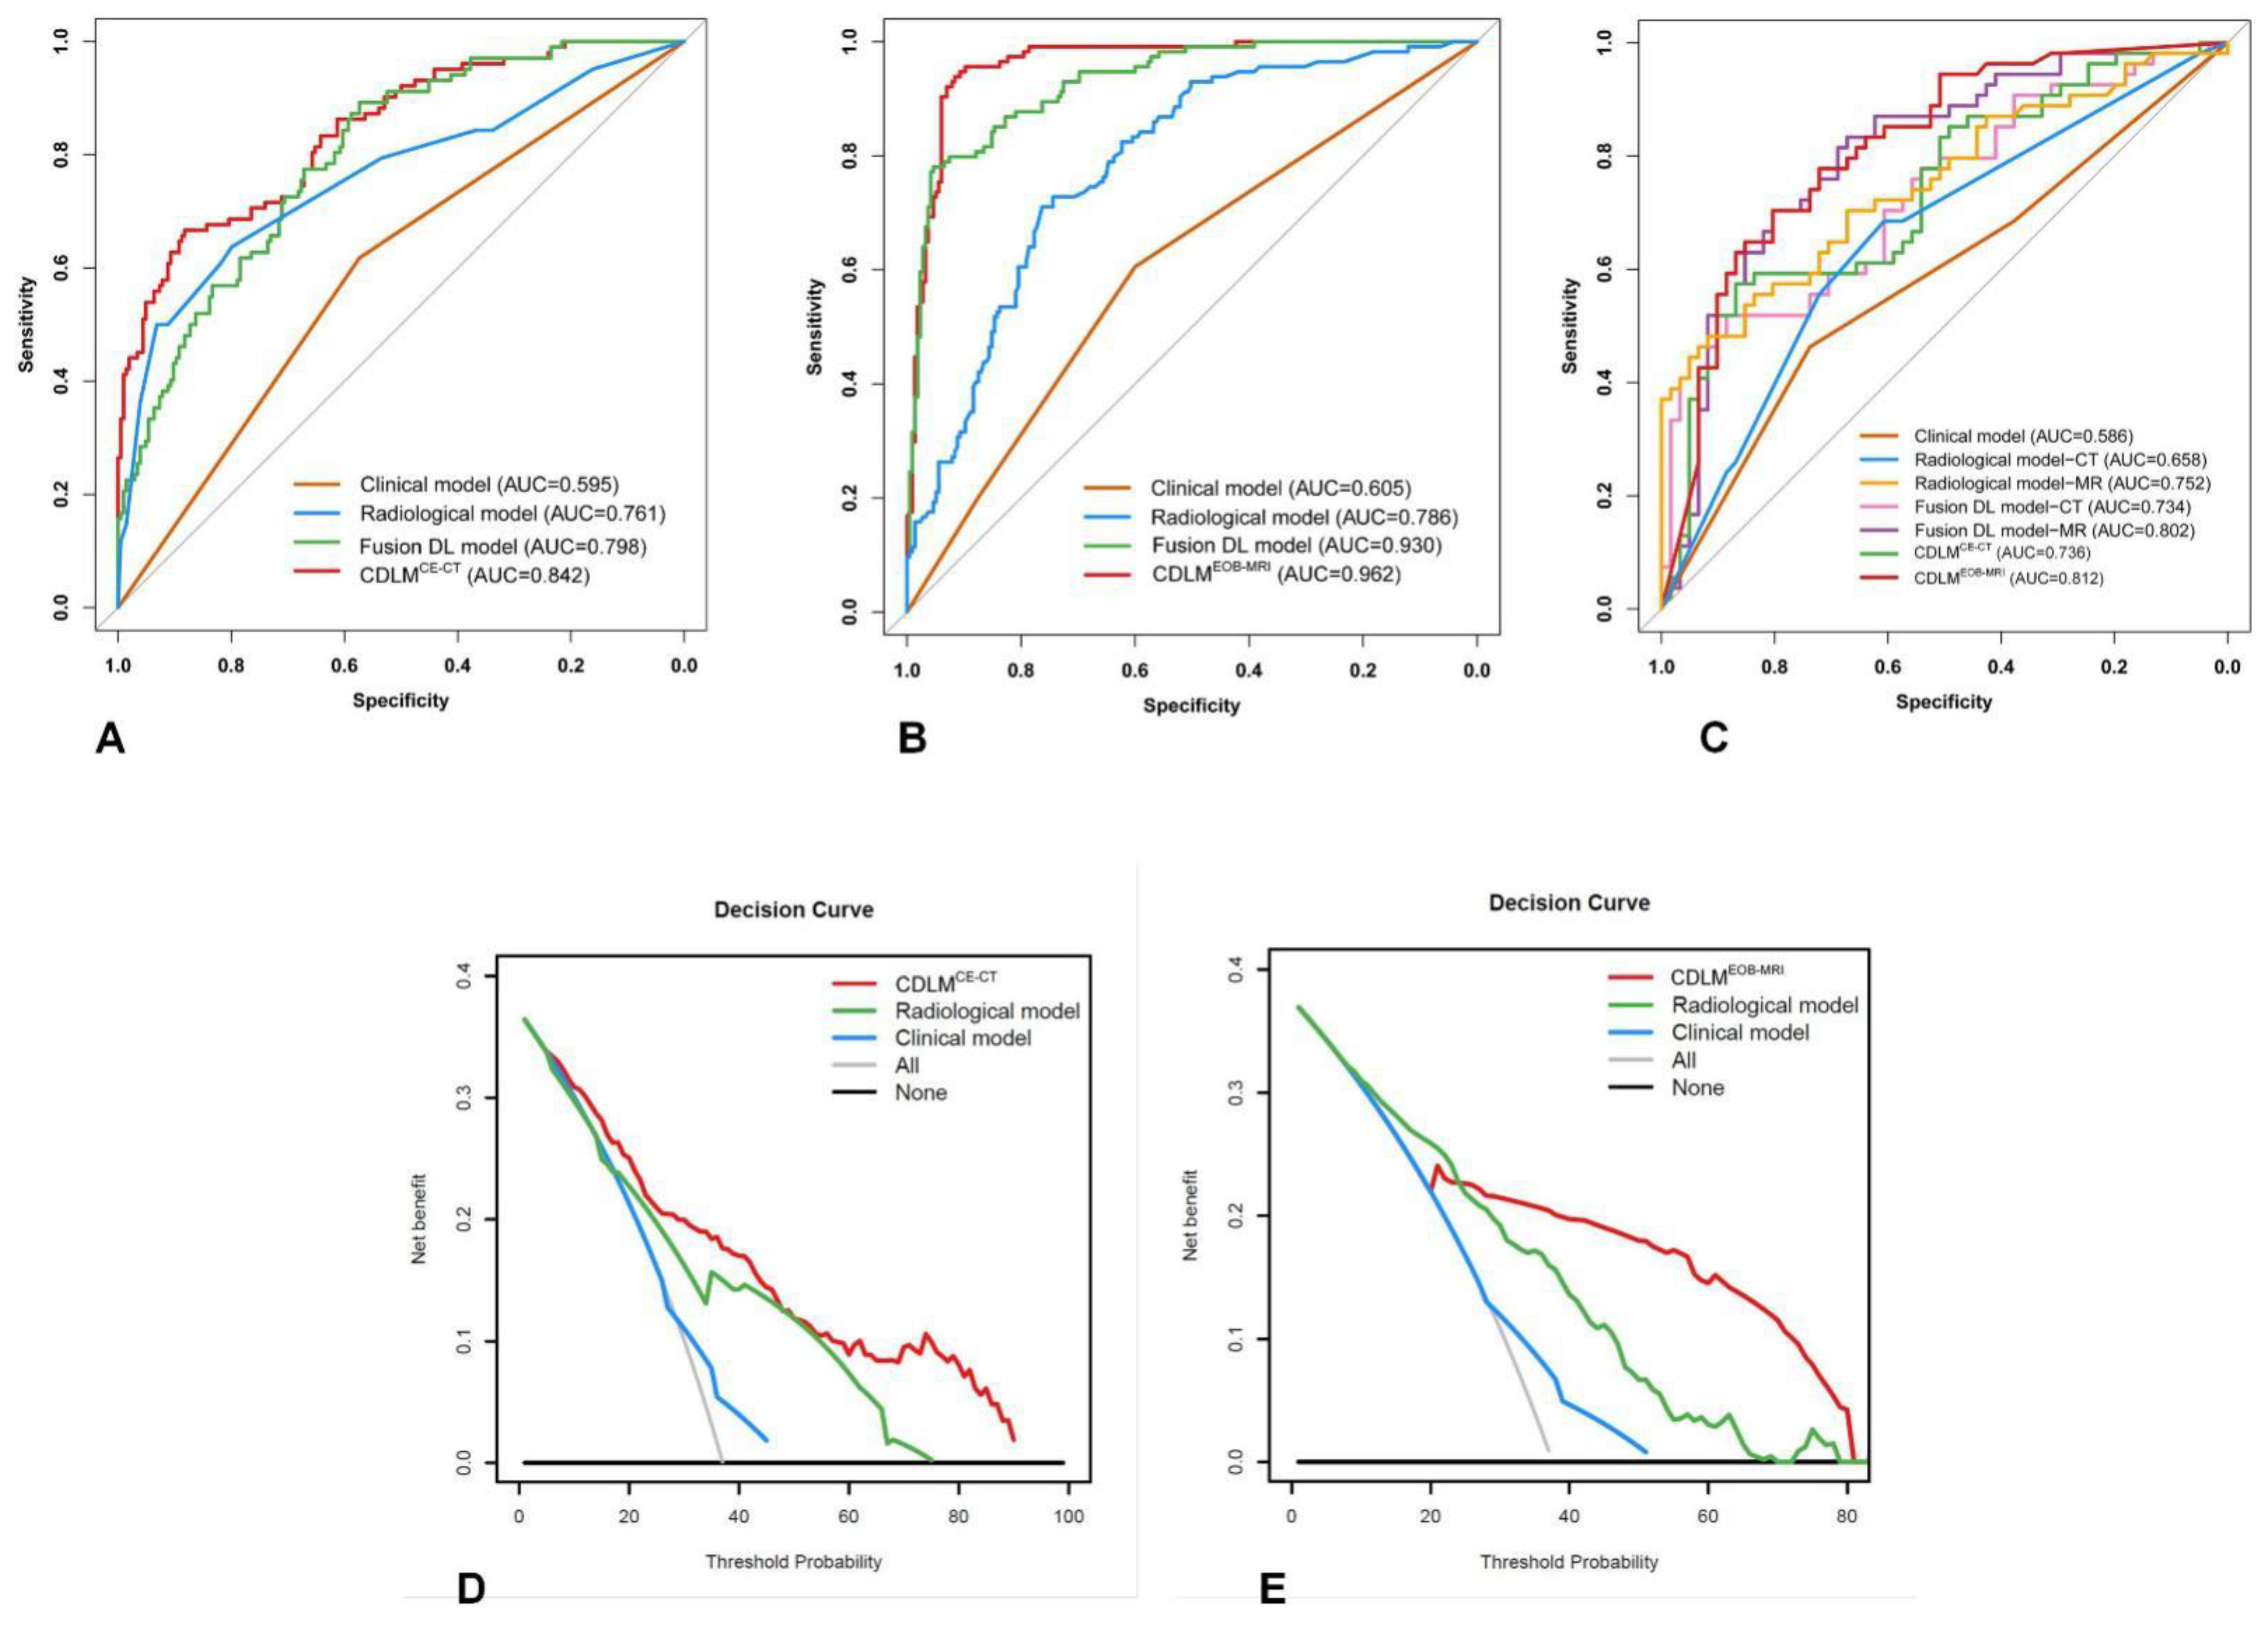
3.2. Predictive Performances of Clinical and Qualitative Radiological Models

AFP was selected as the only effective clinical indicator. The AFP-based clinical model presented with AUCs of 0.595 and 0.605 in the training CE-CT and EOB-MRI cohorts, respectively. The AUC in the validation cohort for APF-based clinical model was 0.586 (Table 3).
Regarding to predictive radiological indicators, effective CE-CT radiological features including number of tumors, peritumoral enhancement and enhancement pattern were identified as MVI predictive. The combined CE-CT radiological model demonstrated AUCs of 0.761 and 0.658 in the training and head-to-head validation cohorts, respectively. EOB-MRI features including tumor size, tumor margin, peritumoral enhancement and tumor hypointensity on HBP were predictive for MVI. The radiological model integrating all four EOB-MRI features achieved AUCs of 0.786 and 0.793 in the training and head-to-head validation cohorts, respectively (Table 3).

3.3. Predictive Performances of CDLMs

For CE-CT, the PVP-based signature yielded the best predictive power among three single-phase-derived DL signatures with AUCs of 0.785 and 0.723 in the training and validation cohorts, respectively. The fusion CE-CT DL model reached AUCs of 0.798 and 0.734 in the training and validation cohorts, respectively. The CDLMCE-CT presented optimal predictive ability for MVI in both the training (AUC: 0.842) and validation (AUC: 0.736) cohorts.
For EOB-MRI, the AP-based signature showed the best predictive power among five single MRI-sequence-based signatures with AUCs of 0.865 and 0.788 in the training and validation cohorts, respectively. The fusion EOB-MRI DL model achieved remarkably increased AUCs of 0.930 and 0.802 in the training and validation cohorts, respectively. The CDLMEOB-MRI demonstrated the highest AUCs in both the training (0.962) and validation (0.812) cohorts.
The head-to-head comparison revealed superior performance of CDLMEOB-MRI over CDLMCE-CT, with significantly higher AUCs (0.812 vs. 0.736, p = 0.039). The sensitivities of CDLMEOB-MRI were significantly higher than those of CE-CT (70.4% vs. 57.4%, p = 0.015), and CDLMCE-CT showed a slight advantage in specificity (86.9% vs. 80.3%, p = 0.052).
Detailed diagnostic measures of all CE-CT and EOB-MRI-based models are shown in Table 3. The ROC curves of the developed models are shown in Figure 2. The DCA analysis showed the net benefit of 33.4% (threshold probability: 6%) for CDLMCE-CT, and 22.6% (threshold probability: 25%) for CDLMEOB-MRI in the whole cohort. The DCA curves of the developed CDLMs are plotted in Figure 2.
According to the stratification analyses, tumor size was identified as a significant clinical factor which has a substantial impact on the predictive power of CDLMCE-CT and CDLMEOB-MRI. For EOB-MRI, large tumor size (>5 cm) was associated with significantly reduced specificities (p < 0.001), slightly increased sensitivities (p > 0.05) and comparable AUCs (p > 0.05) in both the training and validation cohorts. However, for CE-CT, the specificity (81.1% vs. 57.1%, p = 0.020) and AUC (0.962 vs. 0.784, p = 0.001) increased significantly in the subgroup comprising tumors >5 cm in the training cohort, but were comparable across different tumor sizes in the validation cohort. Detailed results of the stratification analyses regarding to related factors are shown in Table S1.

3.4. Identification and Confirmation of the MVI High-Risk Areas

The gradient-based attention maps obtained from EOB-MRI DL network enabled detection of suspicious portions, which were difficult to identify in traditional radiological ways. Figure 3 depicted suspicious areas found by the DL network. Figure 3A–H demonstrates EOB-MRI images, am attention map generated via DL and the histopathological examination result of a 57-year-old male patient. A 7.0 cm hepatocellular carcinoma with histopathologically proven microvascular invasion (MVI) was located predominantly in segment VIII. A distinctive high-risk area of MVI could be identified by heterogenous peritumoral hypoenhancement (black star) on the AP image (C), by interrupted capsule (black arrow) on the PVP image (D), and by peritumoral hypointensity (black arrowhead) on the HBP image (F). However, it was not captured on T2WI (A), T1WI pre-contrast (B) or TP (E) images. This area could be clearly demonstrated on the attention map (G) along the tumor periphery (white star). This high-risk area was proved as MVI-positive by postoperative histopathologic examination with hematoxylin eosin (HE) staining at 100× magnification (H, white arrow). A more typical case is shown in Figure 3I–P. It demonstrates EOB-MRI images, an attention map generated via DL and the histopathological examination result of a 51-year-old female patient. An 8.6 cm hepatocellular carcinoma with histopathologically proven microvascular invasion (MVI) was located predominantly in segments VI and VII. None of radiological characteristics on T2WI(I), T1WI pre-contrast (J), AP (K), PVP (L), TP (M) or HBP (N) images suggest high-risk areas of MVI, which inferred that the invasion area could not be located and tagged in traditional radiological manner. However, a distinctive high-risk area was detected on the DL attention map (O) along the tumor periphery (white star). This high-risk area was proved as MVI-positive by postoperative histopathologic HE staining at 100× magnification (P, black star).
Furthermore, the DL network showed good ability to automatically recognize intratumoral areas in accordance with biological pre-knowledge, including necrosis, intralesional iron deposition, fat accumulation and hemorrhage. Figure 4-1 illustrates a 7.1 cm hepatocellular carcinoma with histopathologically proven microvascular invasion that was located in segments VI and VII. The attention maps of both MR (A) and CT (B) were able to identify these necrotic areas within the tumor (arrowhead). Figure 4-2 illustrates an 8.2 cm hepatocellular carcinoma without microvascular invasion that was located predominantly in segment V. The attention maps of both MR (A) and CT (B) were able to identify these hemorrhagic areas within the tumor (arrowhead). Figure 4-3 illustrates a 5.0 cm hepatocellular carcinoma without microvascular invasion that was located in segments VI and VII. The attention maps of both MR (A) and CT (B) were able to identify these fat-rich areas within the tumor (arrowhead). Figure 4-4 illustrates a 3.5 cm hepatocellular carcinoma with histopathologically proven microvascular invasion that was located predominantly in segment IV. The attention maps of both MR (A) and CT (B) were able to identify these smaller inner nodules presenting different imaging features within the tumor (arrowhead). Note that all the biological/radiological characteristics were better depicted on the attention map of EOB-MRI compared with CE-CT.

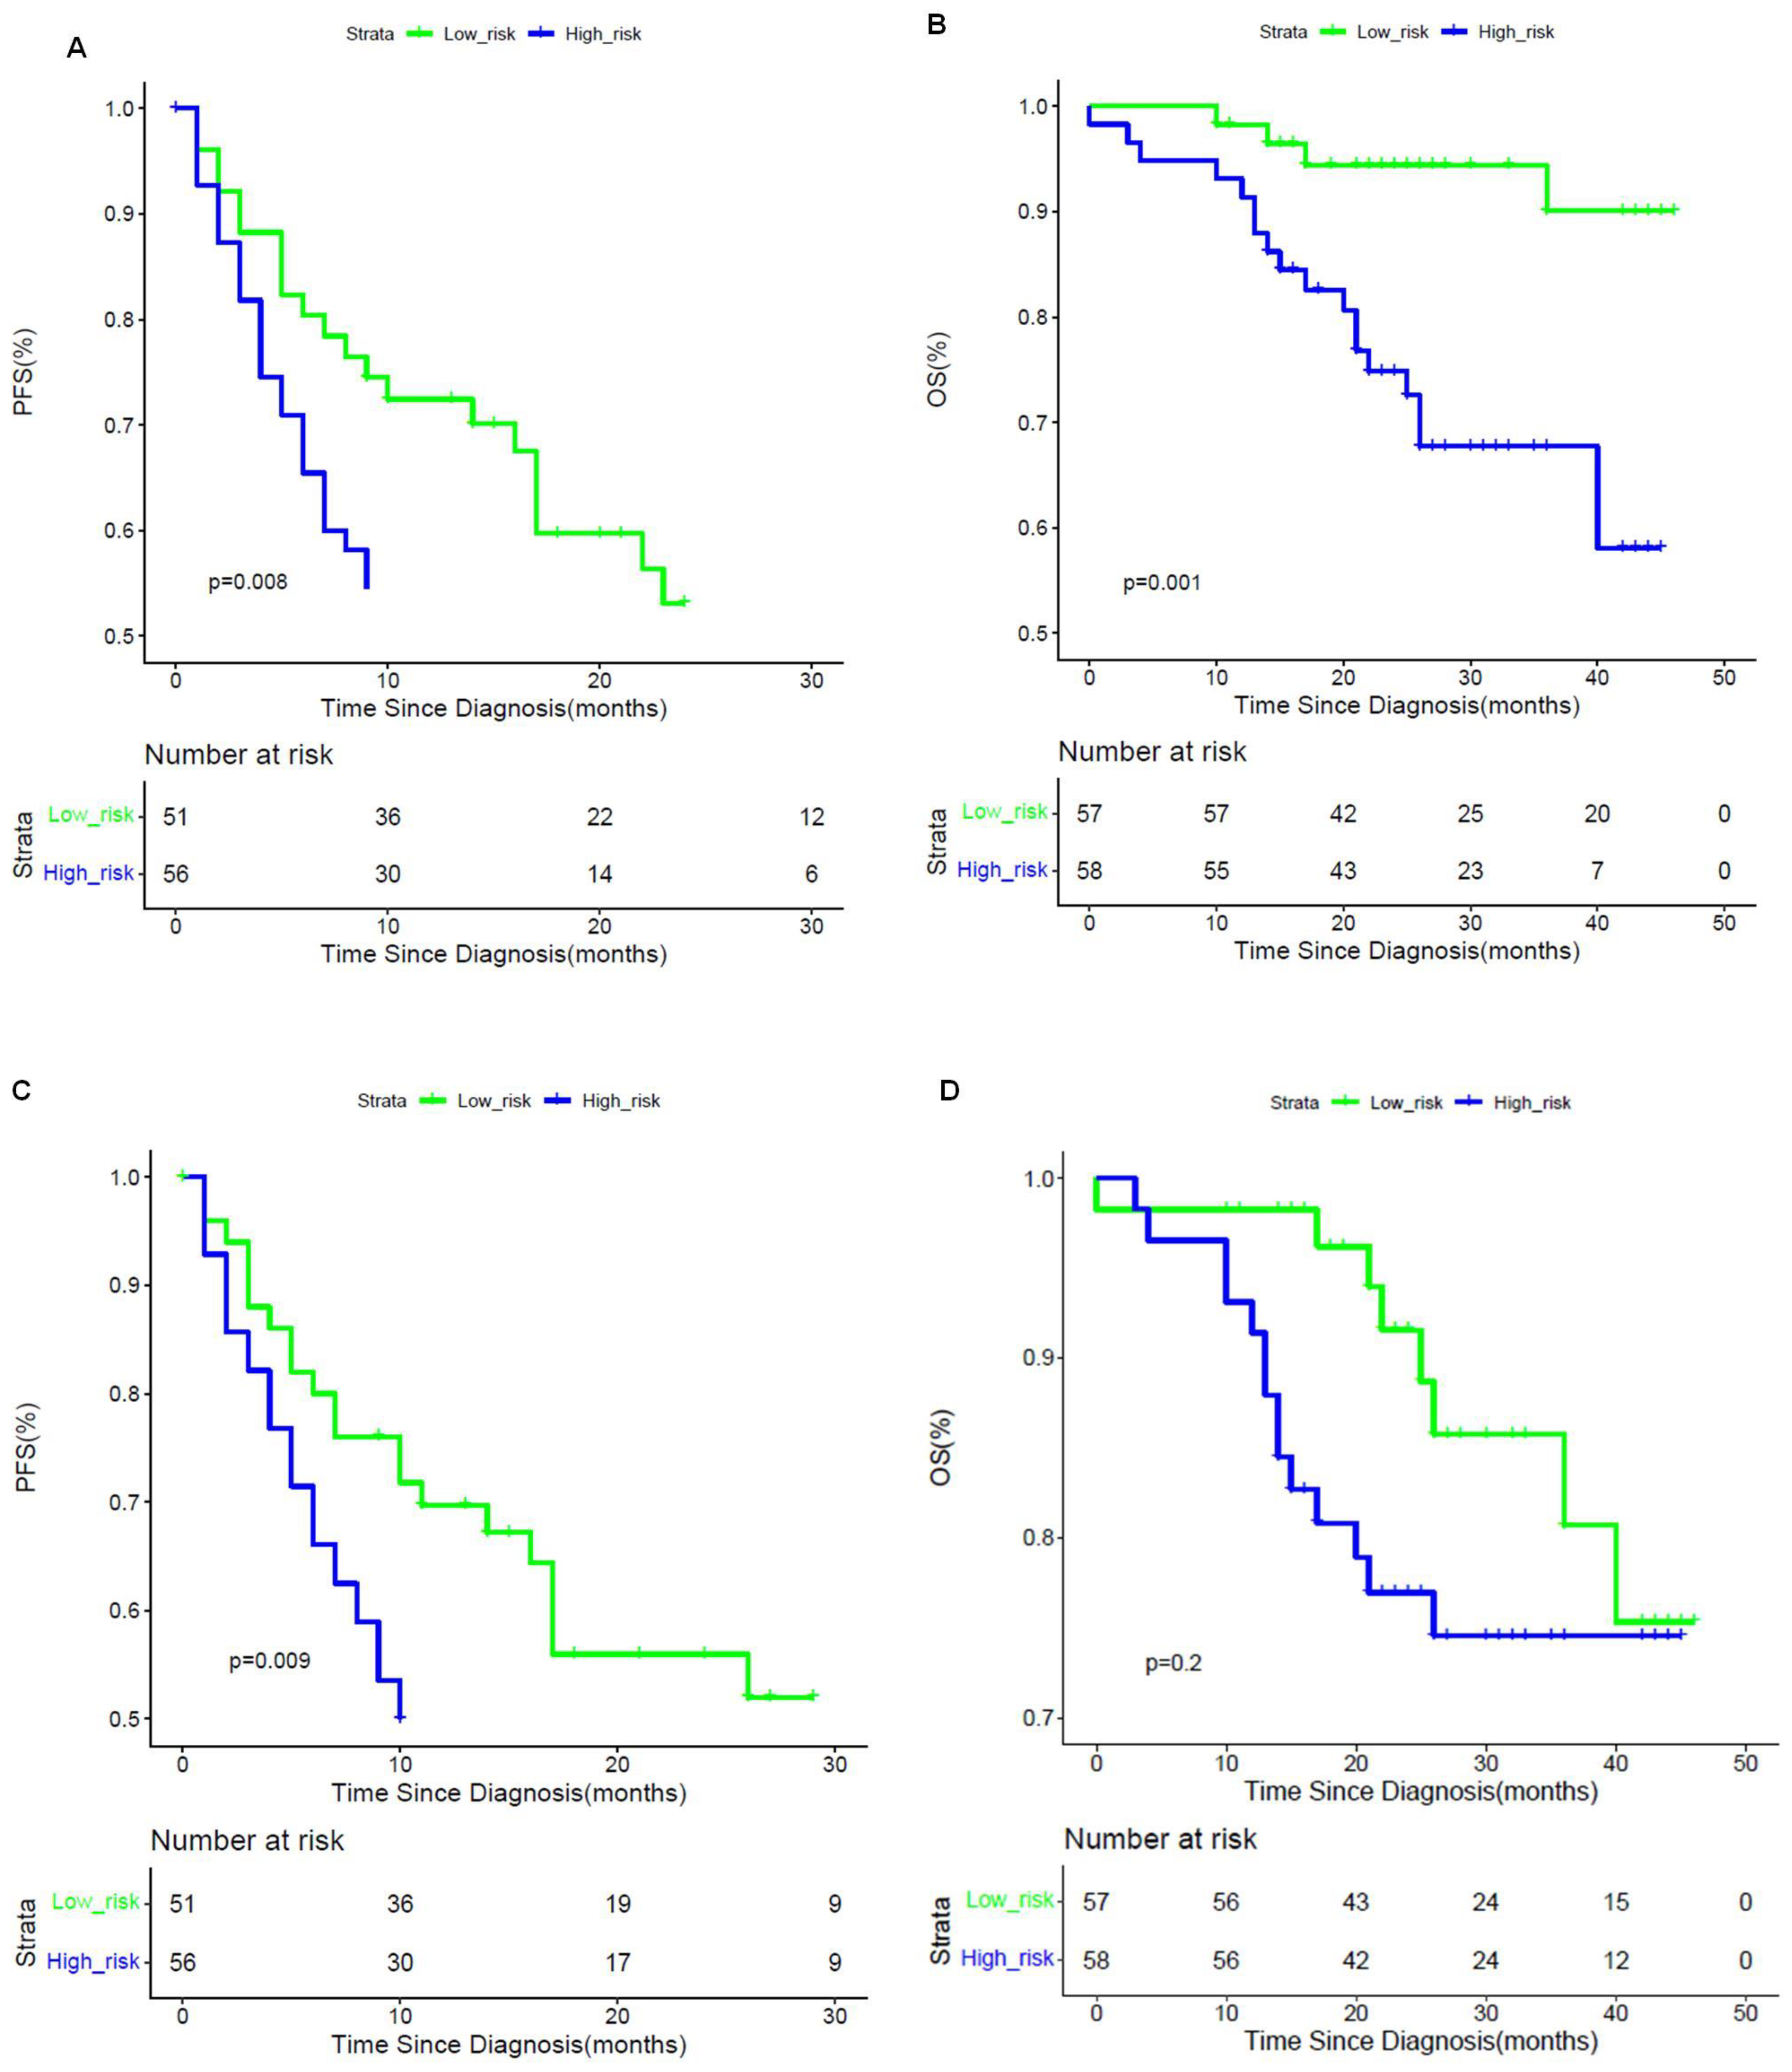
3.5. Prognostic Implications of CDLMs

The median follow-up period for the patients in the validation cohort was 26.3 months (range: 1–46 months). Eight patients dropped out during the follow-up period. Therefore, complete PFS data were available in 107 (93%) patients. The overall progression rate of the 115 prospectively collected patients was 66.4% (71/107) with a median PFS of 13.0 months. In MVI-positive subpopulation, the median PFS was 10.0 months, and in MVI-negative subpopulation, it was 15.5 months (p = 0.019). The overall death rate was 19.1% (22/115) with a median OS of 26.0 months. For patients with MVI, the median OS was 26.5 months, whereas for those without MVI, the median OS was 26.0 months (p = 0.585).
According to the output scores of the developed CDLMs, patients could be stratified into MVI-present and MVI-absent subpopulations. The postoperative PFS and OS were significantly different between CDLM-predicted MVI-present and MVI-absent groups in the prospective cohort for both EOB-MRI (median PFS, 13 vs. 19 months, p = 0.024; median OS: 25 vs. 30 months, p = 0.005) and CE-CT (median PFS, 12 vs. 18 months, p = 0.006; median OS: 25 vs. 29 months, p = 0.003). The Kaplan–Meier curves are shown in Figure 5.

4. Discussion

In this multicenter study, we performed a DL analysis to realize preoperative prediction of MVI against histopathologic results based on CE-CT and EOB-MRI images. The head-to-head comparison revealed that EOB-MRI showed superior predictive power over CE-CT. In parallel with predicting whether MVI existed, we further achieved localization of high-risk portions of the tumor for MVI with true histopathologic confirmations. Substantial prognostic power of CDLMs in stratifying both PFS and OS may also offer potential to aid in personalized management in HCC.
Remarkable efforts have been undertaken to achieve noninvasive imaging prediction of MVI, in which the most promising results came from studies on CE-CT and multi-parametric MRI—in particular, EOB-MRI [12,13,14,15,18,19,20,25,26,27,28]. The AUCs of CE-CT-based conventional radiological/radiomics models ranged between 0.801 and 0.889 [19,20,25]. As for EOB-MRI, several qualitative features, including large tumor size, non-smooth tumor margin, peritumoral enhancement and HBP peritumoral hypointensity have shown correlations with MVI, and radiomics models integrating EOB-MRI-based features could achieve predictive AUCs of up to 0.864 [12,13,14,18]. In our study, the head-to-head collected prospective cohort provided solid evidence for the comparison, which manifested that EOB-MRI presented superior MVI assessment power over CE-CT via the DL models. The underpinnings for the higher sensitivity and predictive power of the developed CDLMEOB-MRI may be that MVI can block minute peritumoral vessels and result in hemodynamic changes and impaired function of the hepatocytes surrounding the tumor, hence giving rise to decreased EOB uptake via the organic anion-transporting polypeptide transporters in the tumor periphery [13,14]. EOB-MRI could better capture these perfusion and functional alterations, and hence be more sensitive and accurate in predicting MVI compared with CE-CT.
We also found that quantitative DL models yielded significantly higher specificities, but relatively lower sensitivities compared with qualitative radiological models. These results revealed the complementary roles of conventional qualitative imaging analysis and quantitative DL analysis in MVI assessment. Qualitative radiological features can be used together as a sensitive screening method for MVI, whereas DL-based evaluation is required to ensure an adequate positive predictive value. This comparison sheds light on a potential synergistic effect when integrating the multilayered imaging data at qualitative and quantitative levels to achieve improved preoperative MVI prediction.
Besides identification of high-risk MVI areas, DL models could also capture areas with characteristic HCC imaging features including necrosis, iron deposition and blood products (Figure 4) [29]. Most of these regions were identified as “low-risk” areas for MVI status in color blue, which underscored the remarkable learning capacity of the DL models for distinguishing the genuine high-risk tumors and peritumoral compartments from the relatively “normal” ones. It manifested that, even with hundred-level data driven, the deep learning network was still “smart” enough to dig out the underlying knowledge from the radiological images, which was perfectly matched with clinical pre-knowledge.
Previous studies have validated the adverse impact of MVI on prognosis in HCC patients [4,5,11,14,15,20,25], and analogous results were obtained in our study. Interestingly, albeit a significantly shorter median PFS was observed in patients with histopathologically-confirmed MVI than those without, no difference in OS was detected between these two groups. Nonetheless, postoperative PFS and OS were significantly different between CDLM-predicted MVI-present and MVI-absent groups for both EOB-MRI and CE-CT. These results revealed a superior capacity of the CDLMs for stratifying postoperative survival than histopathology, likely due to the improved capability of CDLMs in profiling the entire tumor and tumor periphery. Collectively, these underscored the potential prognostic values of the developed CDLMs for personalized risk-stratification and long-term management.
Towards a goal of goof interpretation of deep learning models, we visualized the feature patterns extracted via the convolutional layers [23,24,30]. The feature pattern maps of CDLMCE-CT and CDLMEOB-MRI are shown in Figure S3. They showed that shallow convolutional filters reflected simple imaging characteristics, such as horizontal or vertical texture (Conv_1), whereas deeper convolutional layers otherwise figured out features closer to radiological pre-knowledge, such as tumor shape and more complex and detailed textural patterns (Con_13). More specifically, filter Conv_13 reflected circle or arch characteristics of the tumor’s shape. Earlier findings revealed that MVI-positive HCCs were characterized with a more aggressive tendency to invade the tumor capsule and peritumoral liver parenchyma, and hence were more frequently observed with irregular tumor shapes and non-smooth margins [14,18]. This may in part help to better understand the underlying patterns that the deep network has learnt for the MVI prediction.
This study had several limitations. First, even though the multi-institutional nature of this study ensured the application of DL techniques, the included patient population had an inevitable bias in the inter-center distribution. To explore the impact of the baseline bias, we performed stratification analyses in subgroups on our developed DL models regarding tumor size, AFP and hepatic function. Future larger-scale studies with more balanced populations are needed to validate our findings. Second, patients that acquired histopathological samples to perfectly match with radiological images in location were few. Since this was the first study to establish point-to-point correlations between histopathologic and DL predicted high-risk MVI areas, continuous efforts are needed to explore underlying histopathologic explanations for DL findings. Third, considering collecting scalable medical imaging data was difficult, we here adopted shallow networks to avoid overfitting. If provided with larger medical imaging dataset, deep networks would likely increase the predictive accuracy via more powerful model training.

5. Conclusions

In conclusion, our study demonstrated that the DL method was useful for preoperative MVI prediction in HCC. EOB-MRI presented overall superiority over CE-CT. In addition, DL-based attention maps provided insights into detecting the high-risk MVI areas, leading to aiding the personalized treatment decision-making of HCC patients. Importantly, the established CDLMs showed ability in stratifying postoperative survival regarding both PFS and OS. These comprehensive results offered the great potential of DL-based analysis—in particular, using EOB-MRI, for MVI assessment and HCC patient management.

Supplementary Materials

The following are available online at https://www.mdpi.com/article/10.3390/cancers13102368/s1, File S1: Histopathological diagnosis of microvascular invasion (MVI), File S2: Detailed imaging acquisition protocols, File S3. Definitions regarding radiological indicators for microvascular invasion (MVI) and radiological confirmation of high-risk MVI areas, File S4. Detailed architecture and construction process of the CDLMs, Figure S1: The architecture of ResNet18 branch, Figure S2: The architecture of fusion deep learning model, Figure S3: The feature pattern maps of CDLMCE-CT and CDLMEOB-MRI, Table S1: Stratification analysis CDLMEOB-MRI and CDLMCE-CT.

Author Contributions

Conceptualization, J.W., H.J., and M.Z. (Mengsu Zeng); Methodology: J.W., D.G, M.W., and M.N.; Software: J.W. and D.G.; Formal Analysis: J.W., D.G., and H.J.; Investigation: J.W. and H.J.; Resources: M.Z. (Mengsu Zeng), M.W., and M.N.; Data Curation: H.C., Y.Z., F.F., J.C., F.L., and H.W.; Writing-Original Draft: J.W. and H.J.; Writing- Review & Editing: M.Z. (Mu Zhou), M.R.B., and B.S.; Visualization: J.W., H.J., D.G.; Supervision: H.L., and J.T.; Funding Acquisition: J.T. and J.W. All authors have read and agreed to the published version of the manuscript.

Funding

This work was supported by Ministry of Science and Technology of China under grant number 2017YFA0205200; the National Natural Science Foundation of China under grant numbers 82001917, 81930053, 81227901 and 81527805; the Chinese Academy of Sciences under grant numbers GJJSTD20170004 and QYZDJ-SSW-JSC005; the Beijing Municipal Science and Technology Commission under grant numbers Z161100002616022 and Z171100000117023.

Institutional Review Board Statement

The study was conducted according to the guidelines of the Declaration of Helsinki. The institutional review boards of Beijing Youan Hospital, The First Affiliated Hospital of China Medical University, Shanghai Zhongshan Hospital, Henan Provincial People’s Hospital and West China Hospital approved the retrospective collection of the data. Prospective patient enrollment was approved by the ethics committee of West China Hospital. Ethic code: LL-2019-139-K (Beijing Youan Hospital), 2019-215-2 (The First Affiliated Hospital of China Medical University), B2018-236 (Shanghai Zhongshan Hospital), 2019-68 (Henan Provincial People’s Hospital), and 2016-297 (West China Hospital).

Informed Consent Statement

For retrospective data collection, the requirements for informed consent were waived due to noninvasive nature of the study. For prospective data, informed consent from all patients was obtained before the start of the recruitment.

Data Availability Statement

The dataset is available for sharing upon request from Jie Tian.

Conflicts of Interest

The authors declare no conflict of interest.

References

  1. Forner, A.; Reig, M.; Bruix, J. Hepatocellular carcinoma. Lancet 2019, 391, 1301–1314. [Google Scholar] [CrossRef]
  2. Tabrizian, P.; Jibara, G.; Shrager, B. Recurrence of hepatocellular cancer after resection: Patterns, treatments, and prognosis. Ann. Surg. 2015, 261, 947–955. [Google Scholar] [CrossRef] [PubMed]
  3. Marrero, J.A.; Kulik, L.M.; Sirlin, C.B.; Zhu, A.X.; Finn, R.S.; Abecassis, M.M.; Roberts, L.R.; Heimbach, J.K. Diagnosis, staging, and management of hepatocellular carcinoma: 2018 practice guidance by the American Association for the Study of Liver Diseases. Hepatology 2018, 68, 723–750. [Google Scholar] [CrossRef] [Green Version]
  4. Imamura, H.; Matsuyama, Y.; Tanaka, E.; Ohkubo, T.; Hasegawa, K.; Miyagawa, S.; Sugawara, Y.; Minagawa, M.; Takayama, T.; Kawasaki, S.; et al. Risk factors contributing to early and late phase intrahepatic recurrence of hepatocellular carcinoma after hepatectomy. J. Hepatol. 2003, 38, 200–207. [Google Scholar] [CrossRef]
  5. Lim, K.C.; Chow, P.K.H.; Allen, J.C. Microvascular invasion is a better predictor of tumor recurrence and overall survival following surgical resection for hepatocellular carcinoma compared to the Milan criteria. Ann. Surg. 2011, 254, 108–113. [Google Scholar] [CrossRef] [PubMed]
  6. Sumie, S.; Nakashima, O.; Okuda, K.; Kuromatsu, R.; Kawaguchi, A.; Nakano, M.; Satani, M.; Yamada, S.; Okamura, S.; Hori, M.; et al. The significance of classifying microvascular invasion in patients with hepatocellular carcinoma. Ann. Surg. Oncol. 2014, 21, 1002–1009. [Google Scholar] [CrossRef] [PubMed]
  7. Erstad, D.J.; Tanabe, K.K. Prognostic and therapeutic implications of microvascular invasion in hepatocellular carcinoma. Ann. Surg. Oncol. 2019, 26, 1474–1493. [Google Scholar] [CrossRef]
  8. Mazzaferro, V.; Llovet, J.M.; Miceli, R. Predicting survival after liver transplantation in patients with hepatocellular carcinoma beyond the Milan criteria: A retrospective, exploratory analysis. Lancet Oncol. 2009, 10, 35–43. [Google Scholar] [CrossRef]
  9. Piardi, T.; Gheza, F.; Ellero, B.; Woehl-Jaegle, M.L.; Ntourakis, D.; Cantu, M.; Marzano, E.; Audet, M.; Wolf, P.; Pessaux, P. Number and tumor size are not sufficient criteria to select patients for liver transplantation for hepatocellular carcinoma. Ann. Surg. Oncol. 2012, 19, 2020–2026. [Google Scholar] [CrossRef]
  10. Iguchi, T.; Shirabe, K.; Aishima, S. New pathologic stratification of microvascular invasion in hepatocellular carcinoma: Predicting prognosis after living-donor liver transplantation. Transplantation 2015, 99, 1236–1242. [Google Scholar] [CrossRef] [PubMed]
  11. Rodríguez-Perálvarez, M.; Luong, T.V.; Andreana, L.; Meyer, T.; Dhillon, A.P.; Burroughs, A.K. A systematic review of microvascular invasion in hepatocellular carcinoma: Diagnostic and prognostic variability. Ann. Surg. Oncol. 2013, 20, 325–339. [Google Scholar] [CrossRef]
  12. Renzulli, M.; Brocchi, S.; Cucchetti, A. Can current preoperative imaging be used to detect microvascular invasion of hepatocellular carcinoma? Radiology 2015, 279, 432–442. [Google Scholar] [CrossRef]
  13. Kim, K.A.; Kim, M.J.; Jeon, H.M. Prediction of microvascular invasion of hepatocellular carcinoma: Usefulness of peritumoral hypointensity seen on gadoxetate disodium-enhanced hepatobiliary phase images. J. Magn. Reson. Imaging 2012, 35, 629–634. [Google Scholar] [CrossRef] [PubMed]
  14. Lee, S.; Kim, S.H.; Lee, J.E. Preoperative gadoxetic acid–enhanced MRI for predicting microvascular invasion in patients with single hepatocellular carcinoma. J. Hepatol. 2017, 67, 526–534. [Google Scholar] [CrossRef]
  15. Lei, Z.; Li, J.; Wu, D.; Xia, Y.; Wang, Q.; Si, A.; Wang, K.; Wan, X.; Lau, W.Y.; Wu, M.; et al. Nomogram for preoperative estimation of microvascular invasion risk in hepatitis B virus–related hepatocellular carcinoma within the milan criteria. JAMA Surg. 2016, 151, 356–363. [Google Scholar] [CrossRef]
  16. Yasaka, K.; Akai, H.; Abe, O. Deep learning with convolutional neural network for differentiation of liver masses at dynamic contrast-enhanced CT: A preliminary study. Radiology 2017, 286, 887–896. [Google Scholar] [CrossRef] [Green Version]
  17. Wang, K.; Lu, X.; Zhou, H. Deep learning Radiomics of shear wave elastography significantly improved diagnostic performance for assessing liver fibrosis in chronic hepatitis B: A prospective multicentre study. Gut 2019, 68, 729–741. [Google Scholar] [CrossRef] [PubMed]
  18. Yang, L.; Gu, D.; Wei, J. A Radiomics Nomogram for Preoperative Prediction of Microvascular Invasion in Hepatocellular Carcinoma. Liver Cancer 2019, 8, 373–386. [Google Scholar] [CrossRef] [PubMed]
  19. Ma, X.; Wei, J.; Gu, D. Preoperative radiomics nomogram for microvascular invasion prediction in hepatocellular carcinoma using contrast-enhanced CT. Eur. Radiol. 2019, 29, 1–11. [Google Scholar] [CrossRef] [PubMed]
  20. Xu, X.; Zhang, H.-L.; Liu, Q.-P.; Sun, S.-W.; Zhang, J.; Zhu, F.-P.; Yang, G.; Yan, X.; Zhang, Y.-D.; Liu, X.-S. Radiomic analysis of contrast-enhanced CT predicts microvascular invasion and outcome in hepatocellular carcinoma. J. Hepatol. 2019, 70, 1133–1144. [Google Scholar] [CrossRef]
  21. He, K.; Zhang, X.; Ren, S. Deep residual learning for image recognition. In Proceedings of the IEEE Conference on Computer Vision and Pattern Recognition, Las Vegas, NV, USA, 27–30 July 2016; pp. 770–778. [Google Scholar]
  22. Huang, G.; Liu, Z.; Van Der Maaten, L. Densely connected convolutional networks. In Proceedings of the IEEE Conference on Computer Vision and Pattern Recognition, Honolulu, HI, USA, 21–26 July 2017; pp. 4700–4708. [Google Scholar]
  23. Selvaraju, R.R.; Cogswell, M.; Das, A. Grad-cam: Visual explanations from deep networks via gradient-based localization. In Proceedings of the IEEE International Conference on Computer Vision, Venice, Italy, 22–29 October 2017; pp. 618–626. [Google Scholar]
  24. Kotikalapudi, R. Keras-Vis. GitHub. Available online: https://github.com/raghakot/keras-vis (accessed on 10 May 2021).
  25. Banerjee, S.; Wang, D.S.; Kim, H.J.; Sirlin, C.B.; Chan, M.G.; Korn, R.L.; Rutman, A.M.; Siripongsakun, S.; Lu, D.; Imanbayev, G.; et al. A computed tomography radiogenomic biomarker predicts microvascular invasion and clinical outcomes in hepatocellular carcinoma. Hepatology 2015, 62, 792–800. [Google Scholar] [CrossRef]
  26. Cucchetti, A.; Piscaglia, F.; Grigioni, A.D.E. Preoperative prediction of hepatocellular carcinoma tumour grade and micro-vascular invasion by means of artificial neural network: A pilot study. J. Hepatol. 2010, 52, 880–888. [Google Scholar] [CrossRef]
  27. Renzulli, M.; Buonfiglioli, F.; Conti, F.; Brocchi, S.; Serio, I.; Foschi, F.G.; Caraceni, P.; Mazzella, G.; Verucchi, G.; Golfieri, R.; et al. Imaging features of microvascular invasion in hepatocellular carcinoma developed after direct-acting antiviral therapy in HCV-related cirrhosis. Eur. Radiol. 2018, 28, 506–513. [Google Scholar] [CrossRef] [PubMed]
  28. Wang, W.T.; Yang, L.; Yang, Z.X. Assessment of microvascular invasion of hepatocellular carcinoma with diffusion kurtosis imaging. Radiology 2017, 286, 571–580. [Google Scholar] [CrossRef] [PubMed]
  29. Chernyak, V.; Fowler, K.J.; Kamaya, A.; Kielar, A.Z.; Elsayes, K.M.; Bashir, M.R.; Kono, Y.; Do, R.K.; Mitchell, D.G.; Singal, A.G.; et al. Liver Imaging Reporting and Data System (LI-RADS) version 2018: Imaging of hepatocellular carcinoma in at-risk patients. Radiology 2018, 289, 816–830. [Google Scholar] [CrossRef] [PubMed]
  30. LeCun, Y.; Bengio, Y.; Hinton, G. Deep learning. Nature 2015, 521, 436–444. [Google Scholar] [CrossRef]
Figure 1. Distribution of the enrolled cohorts. The collected cohorts included two retrospective training cohorts (n = 635) and one external prospective validation cohort (n = 115). The retrospective training cohort for CE-CT based models was collected from Beijing Youan Hospital (n = 156) and the first affiliated hospital of China Medical University (n = 150); for EOB-MRI-based model training, it was collected from Shanghai Zhongshan Hospital (n = 207) and Henan Provincial People’s Hospital (n = 122). The prospective cohort contained 115 patients who underwent both CE-CT and EOB-MRI. The validation cohort was used for model validation, as well as the head-to-head comparison.
Cancers 13 02368 g001
Figure 2. Predictive performance of the developed models. (AC) ROC curves of the developed models in the CE-CT training cohort, EOB-MRI training cohort and prospective validation cohort 2; (D,E) decision curves of CDLMCE-CT and CDLMEOB-MRI.
Cancers 13 02368 g002
Figure 3. EOB-MRI images and EOB-MRI-based attention map. 3-1. Gadoxetic acid (EOB)-enhanced MR images (AF) and the attention map (G) of a 57-year-old male patient. A 7.0 cm hepatocellular carcinoma (HCC) with histopathologically proven microvascular invasion (MVI) was detected in segment VIII. A distinctive high-risk area was detected on the attention map (G) along the tumor’s periphery (white star). This high-risk area could be confirmed radiologically by peritumoral enhancement (black star) of the arterial phase image (C), by interrupted capsule (black arrow) on the portal venous phase image (D) and by peritumoral hypointensity (F, black arrowhead) on the hepatobiliary phase image (G). However, it was not captured on T2-weighted (A), T1-weighted pre-contrast (B), or transitional phase (E) images. This high-risk area was proved as MVI-positive by postoperative histopathologic examination with hematoxylin eosin (HE) staining at 100× magnification (H, white arrow). EOB-MR images (IP) and the attention map (O) of a 51-year-old female patient. An 8.6cm HCC with a histopathologically proven MVI was detected in segments VI and VII. A distinctive high-risk area was detected on the attention map (O) along the tumor periphery (white star). However, this high-risk area was not captured on T2-weighted (I), T1-weighted pre-contrast (J), arterial phase (K), portal venous phase (L), transitional phase (M) or hepatobiliary phase (N) images. This high-risk area was proved as MVI-positive by postoperative histopathologic examination with hematoxylin eosin (HE) staining at 100× magnification (P, black star).
Cancers 13 02368 g003
Figure 4. Attention maps derived from EOB-MRI and CE-CT. (4-1). Attention maps (A,B), contrast-enhanced CT (CE-CT; CE) and gadoxetic acid-MRI (EOB-MRI; FJ) of a 43-year-old male patient with hepatocellular carcinoma (HCC). Distinctive intratumoral necrosis (black star) was demonstrated on the pre-contrast (C), arterial phase (D) and portal venous phase (E) images of CE-CT, as well as on the T2-weighted (F), T1-weighted pre-contrast (G), arterial phase (H), portal venous phase (I) and hepatobiliary phase (J) images of EOB-MRI, respectively. The attention maps of both EOB-MRI (A) and CE-CT (B) were able to identify these necrotic areas within the tumor (arrowhead). Note that both the tumor and intratumoral necrotic areas were better depicted on the attention map of EOB-MRI (A) compared with CE-CT (B). (4-2). Attention maps (A,B), CE-CT(CE) and EOB-MRI (FJ) of a 38-year-old male patient with HCC. Distinctive intratumoral hemorrhage (arrow) was demonstrated on the pre-contrast (C), arterial phase (D) and portal venous phase (E) images of CE-CT, as well as on the T2-weighted (F), T1-weighted pre-contrast (G), arterial phase (H), portal venous phase (I) and hepatobiliary phase (J) images of EOB-MRI, respectively. The attention maps of both EOB-MRI (A) and CE-CT (B) were able to identify these hemorrhagic areas within the tumor (arrowhead). Note that both the tumor and intratumoral hemorrhagic areas were better depicted on the attention map of EOB-MRI (A) compared with CE-CT (B). (4-3). Attention maps (A,B), CE-CT (CE) and EOB-MRI (FJ) of a 59-year-old male patient with HCC. Distinctive intratumoral fat accumulation (arrow) was demonstrated on the pre-contrast (C), arterial phase (D) and portal venous phase (E) images of CE-CT, as well as on the T2-weighted (F), T1-weighted pre-contrast (G), arterial phase (H), portal venous phase (I) and hepatobiliary phase (J) images of EOB-MRI, respectively. The attention maps of both EOB-MRI (A) and CE-CT (B) were able to identify these fat-rich areas within the tumor (arrowhead). (4-4). Attention maps (A,B), CE-CT (CE) and EOB-MRI (FJ) of a 35-year-old female patient with HCC. Distinctive “nodule-in-nodule” appearance (star) was demonstrated on the pre-contrast (C), arterial phase (D) and portal venous phase (E) images of CE-CT, as well as on the T2-weighted (F), T1-weighted pre-contrast (G), arterial phase (H), portal venous phase (I) and hepatobiliary phase (J) images of EOB-MRI, respectively. The attention maps of both EOB-MRI (A) and CE-CT (B) were able to identify these smaller inner nodules presenting different imaging features within the tumor (arrowhead). Note that both the tumor and smaller inner nodules were better depicted on the attention map of EOB-MRI (A) compared with CE-CT (B).
Cancers 13 02368 g004
Figure 5. Prognostic analysis using Kaplan–Meier curves on PFS and OS via CDLMEOB-MRI and CDLMCE-CT. PFS (A,C) and OS (B,D) Kaplan–Meier curves scaled by CDLMEOB-MRI and CDLMCE-CT, respectively. The optimal threshold of CDLM models was determined by the maximum Youden index of ROC curve.
Cancers 13 02368 g005
Table 1. Eligibility criteria.
Prospective Cohort.Retrospective Cohort (EOB-MRI or CE-CT)
Inclusion Criteria
1. Age ≥ 18 years1. Age ≥ 18 years
2. High risk for HCC (cirrhosis and/or chronic hepatitis B virus infection)2. Patients with surgically confirmed HCC
3. No previous treatment for hepatic lesions3. Histopathological examination with proven MVI status recorded
4. Patients with Child-Pugh class A liver function4. Preoperative EOB-MRI or CE-CT were performed within one month prior to surgery
Exclusion Criteria
1. Non-HCC patients1. Patients without important clinical data
2. Patients with any previous antitumoral treatment2. Patients with any previous antitumoral treatment
3. Patients with any contraindication of gadoxetate disodium-enhanced MRI3. Patients without conclusive histopathological confirmation of MVI status
4. Patients with insufficient image quality to perform reliable qualitative or radiomics analysis4. Patients with unequivocal macrovascular invasion
5. Patients without conclusive histopathological confirmation of MVI status5. Patients with insufficient image quality to perform reliable qualitative or radiomics analysis
6. Patients with unequivocal macrovascular invasion
7. The time interval between preoperative EOB-MRI and surgery exceeded one month
CE-CT, contrast-enhanced computed tomography; EOB-MRI, gadoxetic acid-enhanced magnetic resonance imaging; HCC, hepatocellular carcinoma.
Table 2. Baseline characteristics of enrolled cohorts.
CE-CT Cohort
CharacteristicsTraining Dataset (n = 306)Validation Dataset (n = 115)
MVI PresentMVI Absentp ValueMVI PresentMVI Absentp Value
Age (years)55 ± 1159 ± 90.54448 ± 1152 ± 110.288
Gender 0.630 0.140
Male77 (75.5)159 (77.9) 39 (72.2)51 (83.6)
Female25 (24.5)45 (22.1) 15 (27.8)10 (16.4)
Etiology of liver disease 0.850 0.286
HBV95 (93.1)191 (93.6) 53 (98.1)61 (100)
HCV3 (2.9)4 (2.0) 1 (1.9)0
None or other4 (3.9)9 (4.4) 00
Total bilirubin 0.05 0.926
<20.4 μmol/L52 (51.0)128 (62.7) 43 (79.6)49 (80.3)
>20.4 μmol/L50 (49.0)76 (37.3) 11 (20.4)12 (19.7)
Alanine aminotransferase 0.515 0.485
<40 U/L42 (41.2)92 (45.1) 32 (59.3)40 (65.6)
>40 U/L60 (58.8)112 (54.9) 22 (40.7)21 (34.4)
Aspartate aminotransaminase 0.001 0.019
<35 U/L25 (24.5)90 (44.1) 20 (37.0)36 (59.0)
>35 U/L77 (75.5)114 (55.9) 34 (63.0)25 (41.0)
Platelet 0.001 0.067
<125 × 109/L14 (13.7)63 (30.9) 5 (9.3)1 (1.6)
>125×109/L88 (86.3)141 (69.1) 49 (90.7)60 (98.4)
α-fetoprotein 0.007 0.067
<20 ng/mL39 (38.2)117 (57.4) 17 (31.5)23 (37.7)
20–400 ng/mL32 (31.4)44 (21.6) 12 (22.2)22 (36.1)
>400 ng/mL31 (30.4)43 (21.1) 25 (46.3)16 (26.2)
Edmondson–Steiner grade * 0.356 0.002
Grade I4 (9.5)24 (15.3) 05 (8.2)
Grade II21 (50.0)86 (54.8) 29 (53.7)44 (72.1)
Grade III17 (40.5)47 (29.9) 25 (46.3)12 (19.7)
CT imaging features
Cirrhosis of background liver 0.001 0.902
Absent31 (30.4)30 (14.7) 18 (33.3)21 (34.4)
Present71 (69.6)174 (85.3) 36 (66.7)40 (65.6)
Number of tumors <0.001 0.210
Solitary70 (68.6)181 (88.7) 33 (61.1)44 (72.1)
Multiple32 (31.4)23 (11.3) 21 (38.9)17 (27.9)
Tumor size (cm)5.8 ± 4.34.0 ± 3.6<0.0017.6 ± 3.34.7 ± 2.0<0.001
Tumor margin 0.019 0.014
Smooth margin29 (28.4)86 (42.2) 25 (46.3)42 (68.9)
Non-smooth margin73 (71.6)118 (57.8) 29 (53.7)19 (31.1)
Peritumoral enhancement 0.001 0.003
Absent49 (48.0)139 (68.1) 24 (44.4)44 (72.1)
Present53 (52.0)65 (31.9) 30 (55.6)17 (27.9)
Enhancement pattern <0.001 0.851
Typical77 (75.5)113 (55.4) 51 (81.9)56 (87.2)
Atypical25 (24.5)91 (44.6) 3 (18.1)5 (12.8)
Radiologic capsule 0.931 0.512
Absent32 (31.4)65 (31.9) 13 (24.1)18 (29.5)
Present70 (68.6)139 (68.1) 41 (75.9)43 (70.5)
EOB-MRI Cohort
CharacteristicsTraining Dataset (n = 329)Validation Dataset (n = 115)
MVI PresentMVI Absentp ValueMVI PresentMVI Absentp Value
Age (years)55 ± 1054 ± 100.54448 ± 1152 ± 110.567
Gender 0.331 0.140
Male97 (85.1)188 (87.4) 39 (72.2)51 (83.6)
Female17 (14.9)27 (12.6) 15 (27.8)10 (16.4)
Etiology of liver disease 0.637 0.286
HBV103 (90.4)200 (93.0) 53 (98.1)61 (100)
HCV5 (4.4)8 (3.7) 1 (1.9)0
None or other6 (5.3)7 (3.3) 00
Total bilirubin 0.358 0.926
<20.4 μmol/L98 (86.0)180 (83.7) 43 (79.6)49 (80.3)
>20.4 μmol/L16 (14.0)35 (16.3) 11 (20.4)12 (19.7)
Alanine aminotransferase 0.293 0.485
<40 U/L76 (66.7)151 (70.2) 32 (59.3)40 (65.6)
>40 U/L38 (33.3)64 (29.8) 22 (40.7)21 (34.4)
Aspartate aminotransaminase 0.095 0.019
<35 U/L74 (64.9)156 (72.6) 20 (37.0)36 (59.0)
>35 U/L40 (35.1)59 (27.4) 34 (63.0)25 (41.0)
Platelet 0.262 0.067
<125 × 109/L56 (49.1)115 (53.5) 5 (9.3)1 (1.6)
>125 × 109/L58 (50.9)100 (46.5) 49 (90.7)60 (98.4)
α-fetoprotein 0.002 0.067
<20 ng/mL45 (39.5)129 (60.0) 17 (31.5)23 (37.7)
20–400 ng/mL46 (40.4)59 (27.4) 12 (22.2)22 (36.1)
>400 ng/mL23 (20.2)27 (12.6) 25 (46.3)16 (26.2)
Edmondson–Steiner grade <0.001 0.002
Grade I1 (0.9)16 (7.4) 05 (8.2)
Grade II58 (50.9)140 (65.1) 29 (53.7)44 (72.1)
Grade III55 (48.2)59 (27.4) 25 (46.3)12 (19.7)
MR imaging features
Cirrhosis of background liver 0.720 0.902
Absent37 (32.5)74 (34.4) 18 (33.3)21 (34.4)
Present77 (67.5)141 (65.6) 36 (66.7)40 (65.6)
Number of tumors <0.001 0.210
Solitary75 (65.8)178 (82.8) 33 (61.1)44 (72.1)
Multiple39 (34.2)37 (17.2) 21 (38.9)17 (27.9)
Tumor size (cm)4.1 ± 3.02.3 ± 1.5<0.0017.6 ± 3.34.7 ± 2.0<0.001
Tumor margin <0.001 0.014
Smooth margin34 (29.8)110 (51.2) 25 (46.3)42 (68.9)
Non-smooth margin80 (70.2)105 (48.8) 29 (53.7)19 (31.1)
Peritumoral enhancement <0.001 0.021
Absent61 (53.5)170 (79.1) 22 (40.7)38 (62.3)
Present53 (46.5)45 (20.9) 32 (59.3)23 (37.7)
Enhancement pattern <0.001 0.190
Typical50 (43.9)141 (65.6) 43 (79.6)54 (88.5)
Atypical64 (56.1)74 (34.4) 11 (20.4)7 (11.5)
Radiologic capsule 0.370 0.743
Absent34 (29.8)59 (27.4) 6 (11.1)8 (13.1)
Present80 (70.2)156 (72.6) 48 (88.9)53 (86.9)
Tumor hypointensity on HBP <0.001 0.550
Absent53 (46.5)152 (70.7) 3 (5.6)2 (3.3)
Present61 (53.5)63 (29.3) 51 (94.4)59 (96.7)
Peritumoral hypointensity on HBP image <0.001 <0.001
Absent80 (70.2)194 (90.7) 11 (20.4)36 (59.0)
Present34 (29.8)20 (9.3) 43 (79.6)25 (41.0)
Qualitative variables are in n (%), and quantitative variables are in medians with interquartile ranges in parentheses, when appropriate. p values were calculated between MVI-positive and MVI-negative groups via uni-variable analysis. CE-CT, contrast-enhanced computational tomography; EOB-MRI, gadoxetic acid-enhanced magnetic resonance imaging; MVI, microvascular invasion; HBP, hepatobiliary phase. * Note: for the retrospective cohort in CE-CT, 107 out of 156 (68.6%) of patients from Beijing Youan Hospital lacked histopathological results of Edmondson–Steiner grade; thus, the statistical result of Edmondson–Steiner grade was calculated based on patients who had records.
Table 3. Predictive performances of the developed models.
Developed ModelsRetrospective Training Cohort
(EOB-MRI n = 329; CE-CT n = 306)
Prospective Validation Cohort 2
(n = 115)
SENSPEACCAUC (95% CI)SENSPEACCAUC (95% CI)
Clinical modelCE-CT61.8%57.4%58.8%0.595
(0.533–0.657)
68.5%37.7%52.2%0.586
(0.485–0.686)
EOB-MRI60.5%60.0%60.2%0.605
(0.546–0.664)
68.5%37.7%52.2%0.586
(0.485–0.686)
Radiological modelCE-CT63.7%79.9%74.5%0.761
(0.700–0.822)
68.5%57.4%62.6%0.658
(0.561–0.754)
EOB-MRI71.1%76.3%74.5%0.786
(0.736–0.836)
88.9%31.2%58.3%0.752
(0.662–0.842)
Single CT-phase-based signatureArterial phase68.6%73.5%71.9%0.742
(0.690–0.789)
44.4%86.9%67.0%0.703
(0.619–0.779)
Venous phase75.5%69.6%71.6%0.785
(0.738–0.828)
75.9%62.3%68.7%0.723
(0.642–0.799)
Plain phase67.6%72.1%70.6%0.759
(0.716–0.805)
66.7%63.9%65.2%0.689
(0.602–0.771)
Single MR-sequence-based signatureArterial phase71.1%87.9%82.1%0.865
(0.824–0.905)
74.1%75.4%74.8%0.780
(0.695–0.865)
Venous phase70.2%70.2%70.2%0.766
(0.712–0.820)
61.1%72.1%67.0%0.699
(0.604–0.795)
Transitional phase68.4%70.2%69.6%0.746
(0.690–0.803)
66.7%67.2%67.0%0.672
(0.573–0.772)
T2WI78.9%64.7%69.6%0.775
(0.723–0.827)
77.8%62.3%69.6%0.732
(0.639–0.824)
HBP T1WI64.0%79.1%73.9%0.768
(0.714–0.822)
63.0%75.4%69.6%0.710
(0.614–0.806)
Fusion DL modelCE-CT89.2%57.4%68.0%0.798
(0.753–0.840)
51.9%88.5%71.3%0.734
(0.654–0.806)
EOB-MRI78.1%95.3%89.4%0.930
(0.902-0.957)
70.4%80.3%75.7%0.802
(0.720–0.885)
CDLMCDLMCE-CT66.7%88.2%81.0%0.842
(0.803–0.883)
57.4%86.9%73.0%0.736
(0.662–0.805)
CDLMEOB-MRI93.9%91.6%92.4%0.962
(0.857–0.927)
70.4%80.3%75.7%0.812
(0.721–0.880)
SEN, sensitivity; SPE, specificity; ACC, accuracy; AUC, area under the curve; 95% CI, 95% confidence interval, CE-CT, contrast-enhanced computational tomography; EOB-MRI, gadoxetic acid-enhanced magnetic resonance imaging; T2WI, T2-weighted imaging; HBP, hepatobiliary phase; T1WI, T1-weighed imaging; CDLM, combined deep learning model.
Publisher’s Note: MDPI stays neutral with regard to jurisdictional claims in published maps and institutional affiliations.

