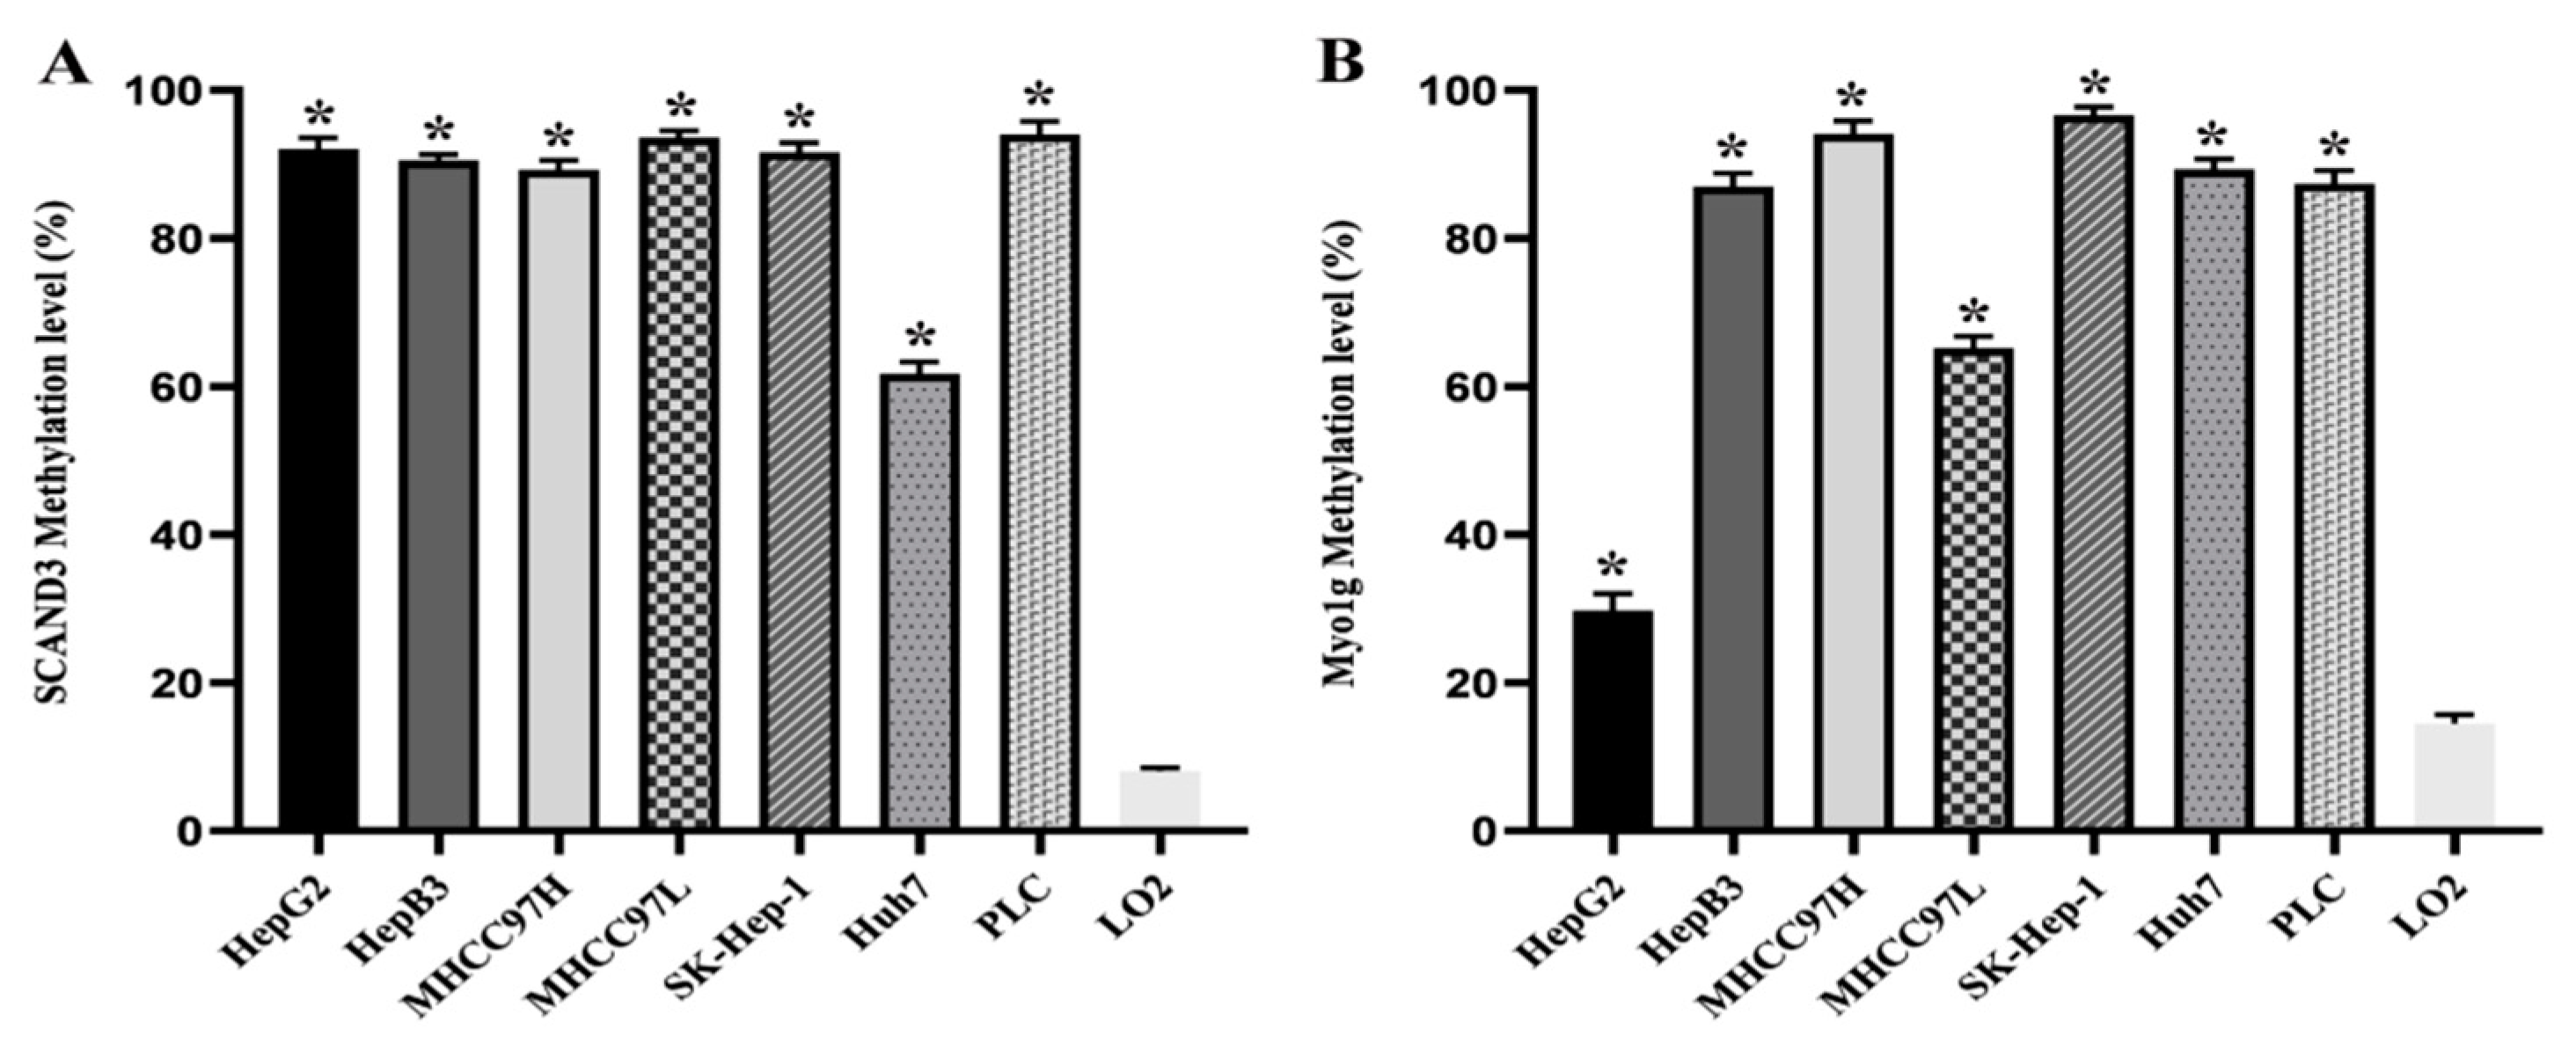
Figure 1.
The methylation levels of SCAND3 and Myo1g in seven hepatocellular carcinoma (HCC) cell lines and the normal hepatocyte cell line LO2. (A) SCAND3 average methylation levels in seven HCC cell lines (HepG2, HepB3, MHCC97H, MHCC97L, SK-Hep-1, Huh7, PLC) and LO2 were 92.07%, 90.53%, 89.23%, 93.64%, 91.60%, 61.73%, 94.07%, 8.07%, respectively. (B) Myo1g average methylation levels in seven HCC cell lines (HepG2, HepB3, MHCC97H, MHCC97L, SK-Hep-1, Huh7, PLC) and LO2 were 29.73%, 87.00%, 94.10%, 65.17%, 96.96%, 89.30%, 87.37%, 14.47%, respectively. SCAND3 and Myo1g hypermethylation were more prominent in seven HCC cell lines than in LO2. Statistical comparisons were computed using the unpaired t-test, * p < 0.05.
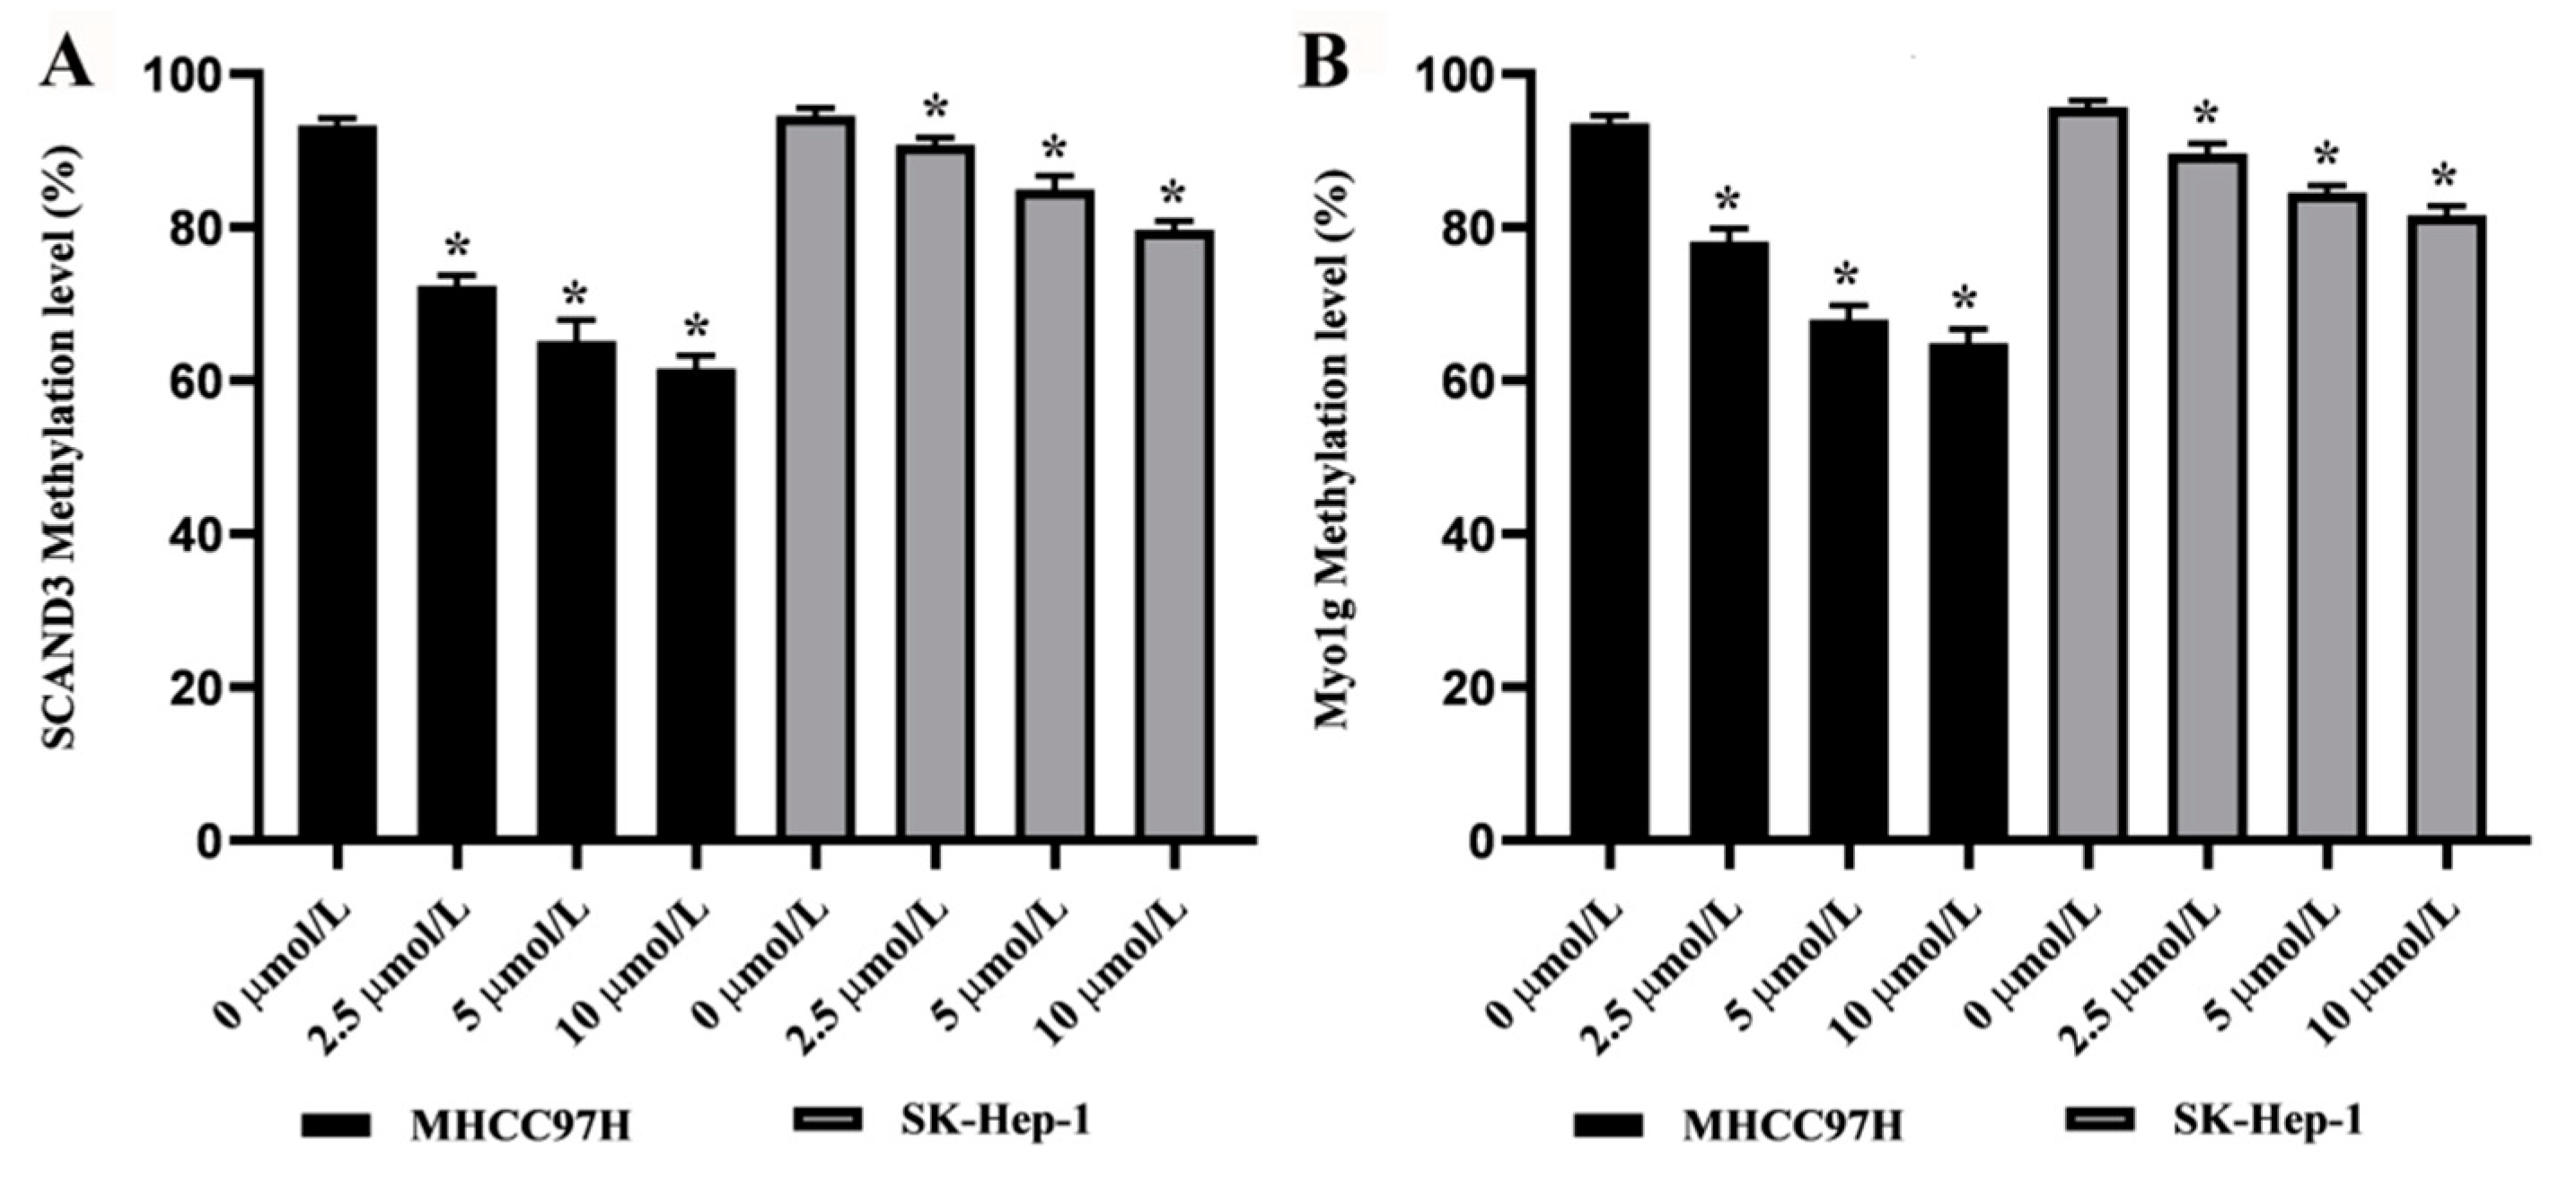
Figure 2.
The methylation levels of SCAND3 and Myo1g in HCC cell lines treated with demethylating agent 5-Aza-2′-deoxycytidine (5-AZC). (A) After 0.0, 2.5, 5.0, or 10.0 µM of 5-AZC treatment, the average methylation levels of SCAND3 were 93.30%, 72.40%, 65.17%, and 61.57% in the MHCC97H cell line, and 94.57%, 90.76%, 84.93%, and 79.67% in the SK-Hep-1 cell line, respectively. (B) After 0.0, 2.5, 5.0, or 10.0 µM of 5-AZC treatment, the average methylation levels of Myo1g were 93.6%, 78.17%, 67.96%, and 64.90% in the MHCC97H cell line, and 95.70%, 89.67%, 84.50%, and 81.56% in the SK-Hep-1 cell line, respectively. Statistical comparisons were computed using the unpaired t-test, * p < 0.05.
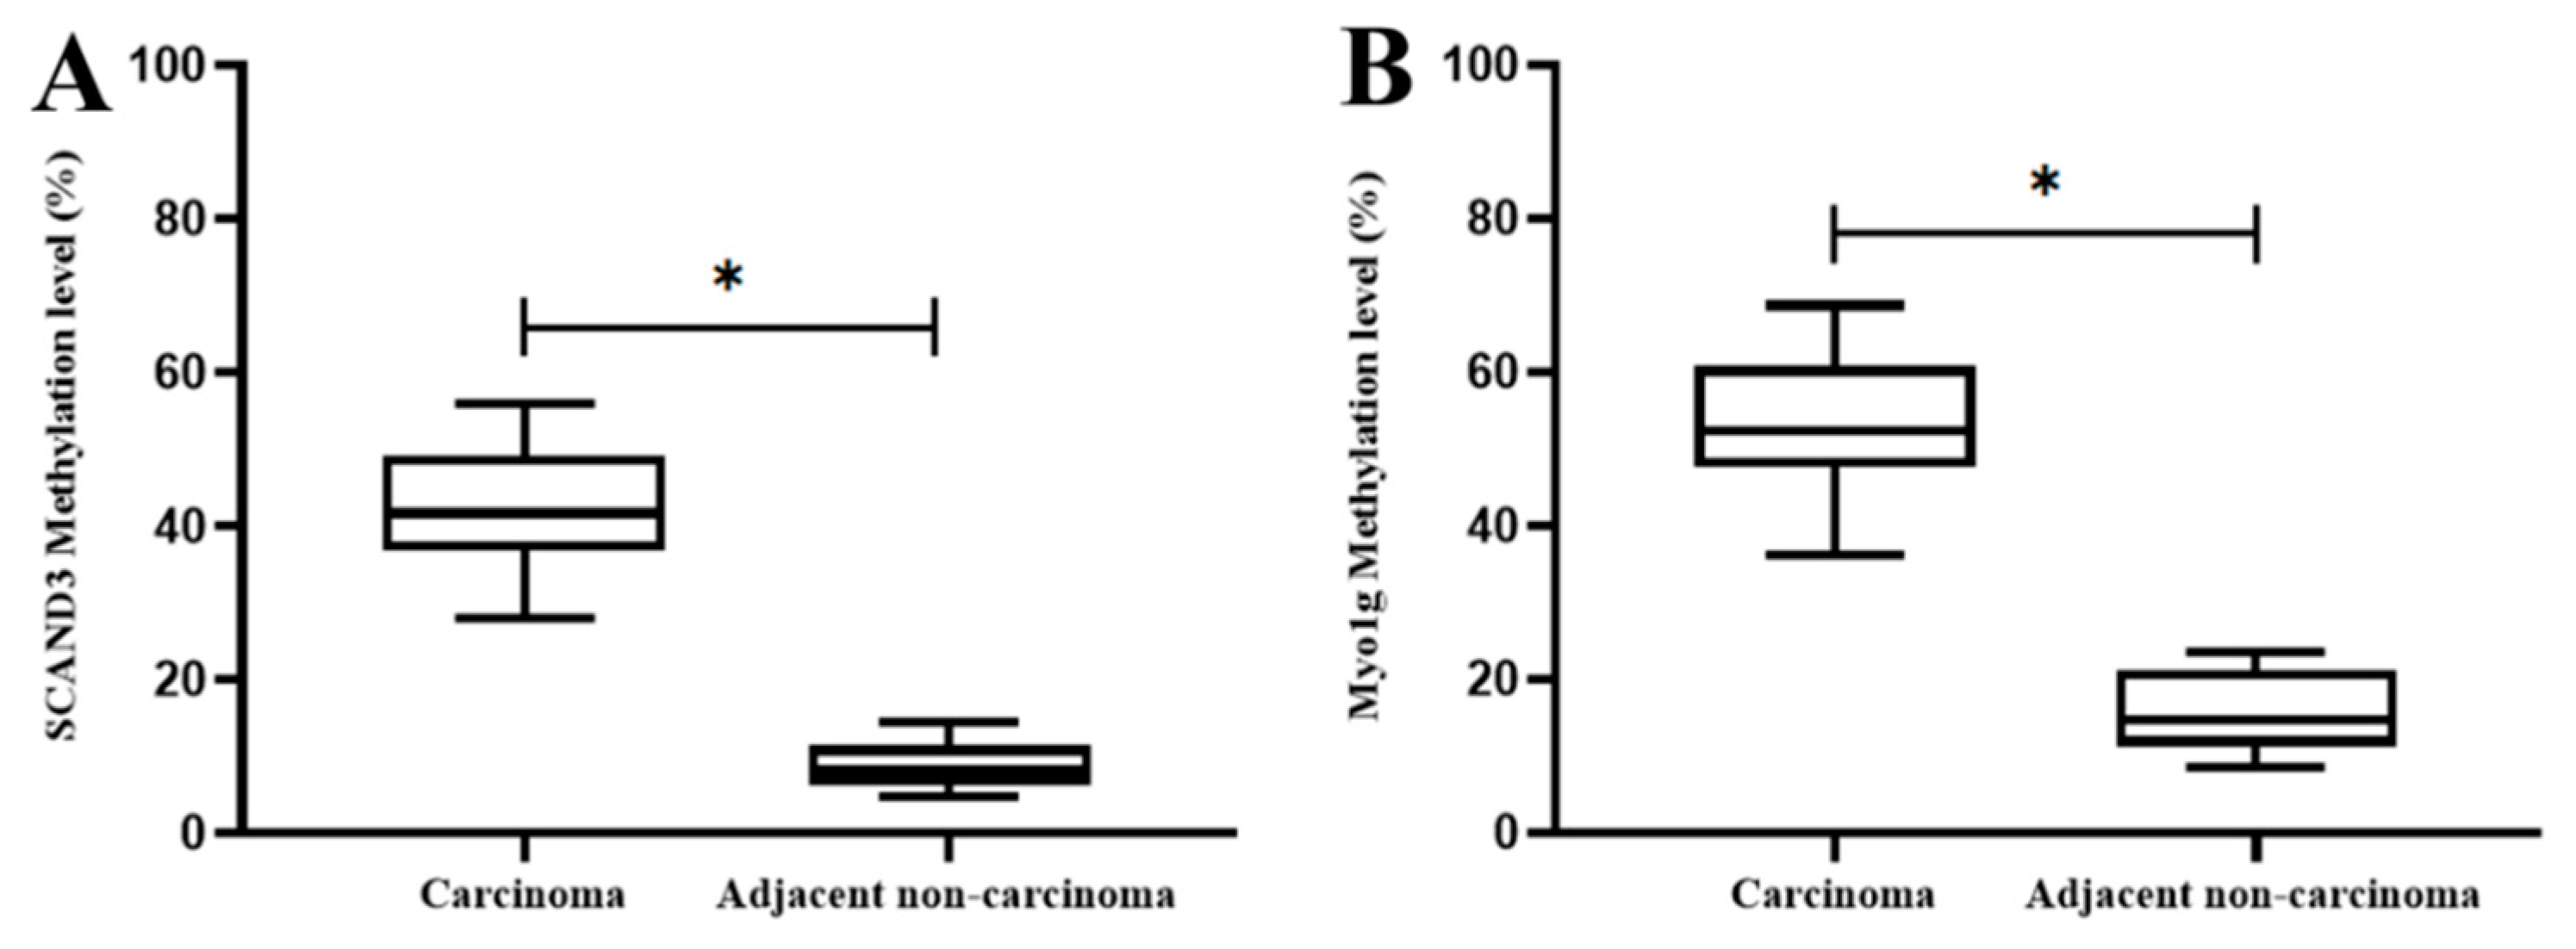
Figure 3.
The methylation levels of SCAND3 and Myo1g in HCC tissues and adjacent non-cancerous tissues. (A) SCAND3 methylation ratios in cancerous tissues and adjacent noncancerous tissues were 41.79% and 8.73%, respectively; (B) Myo1g methylation ratios in cancerous tissues and adjacent noncancerous tissues were 53.43% and 15.67%, respectively. Statistical comparisons were computed using the unpaired t-test, * p < 0.05.
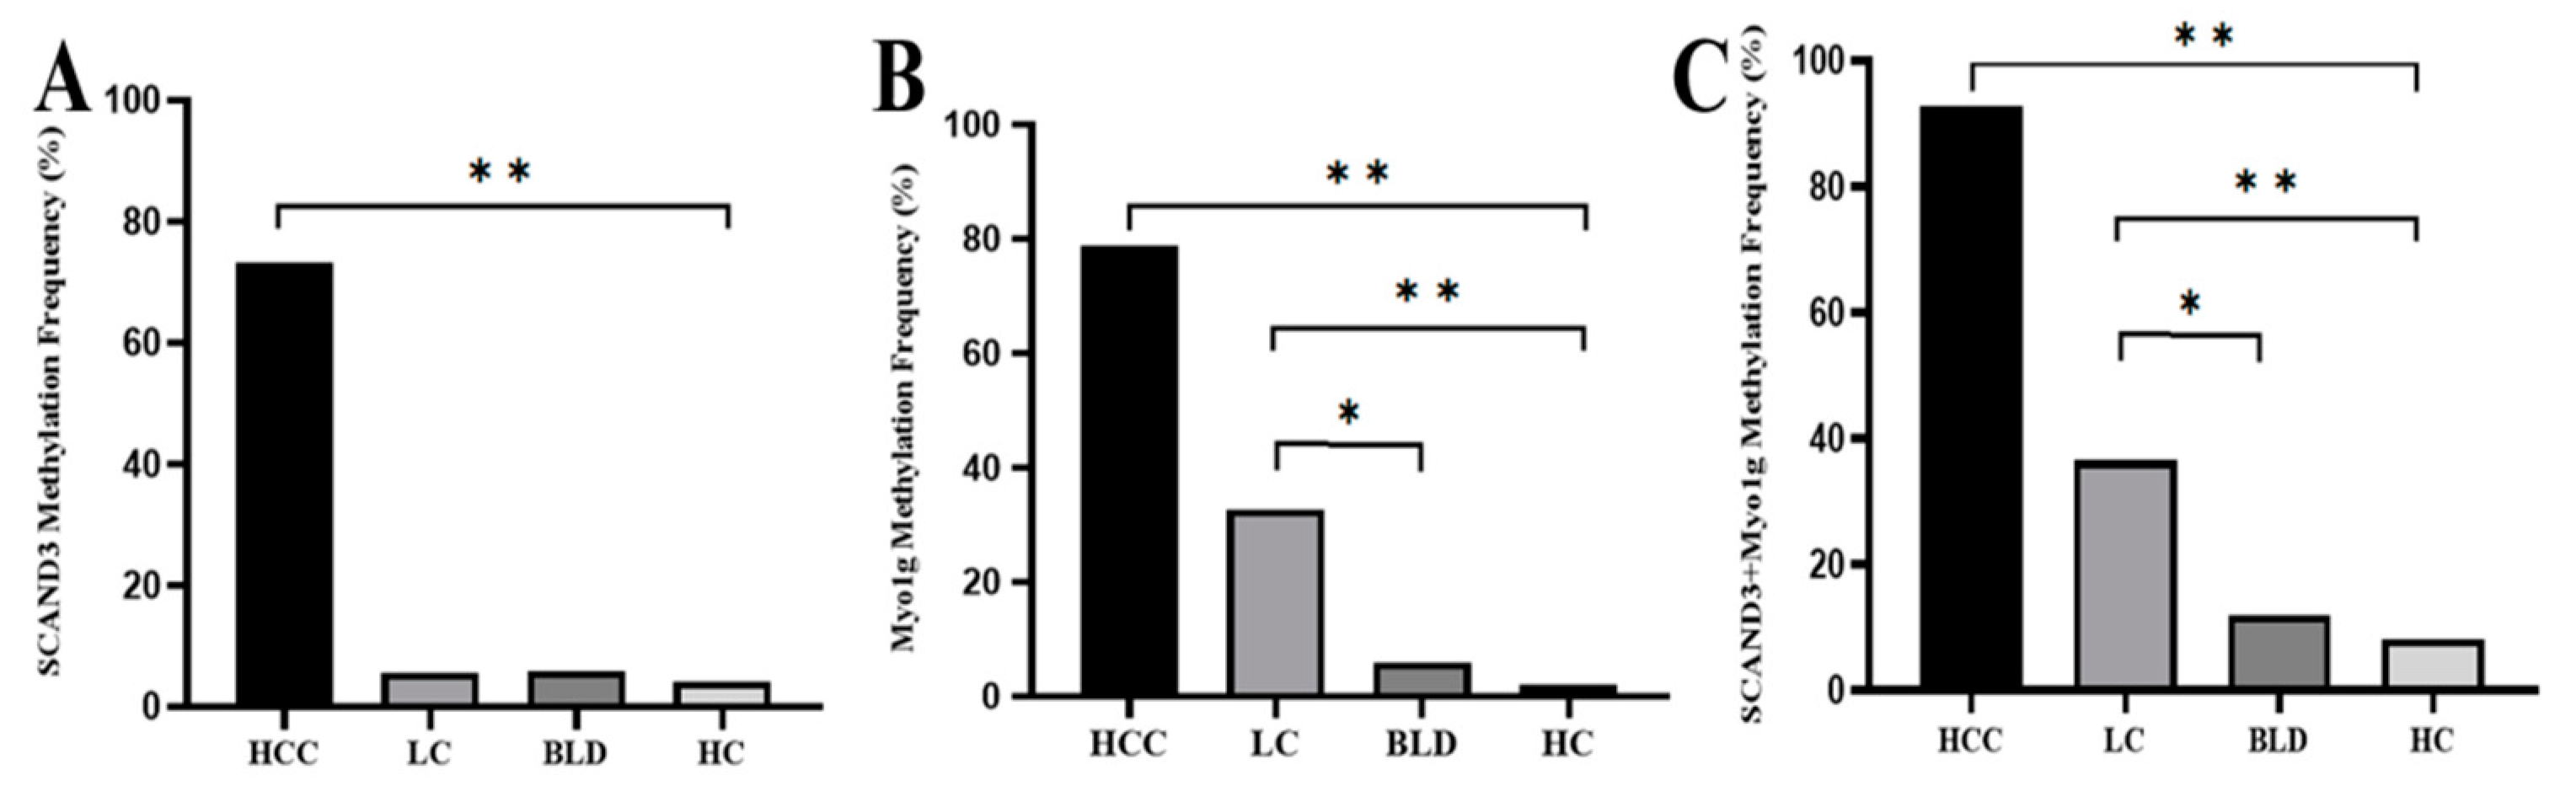
Figure 4.
The methylation frequency of serum SCAND3, Myo1g, and SCAND3 + Myo1g in the HCC, HBV (hepatitis B virus)-related liver cirrhosis (LC), benign liver disease (BLD), and healthy controls (HC) groups. (A) The SCAND3 methylation ratio among HCC patients (73.33%) was significantly higher than that of LC patients (5.7%), BLD cases (6%), and HC (4.1%) (χ2 = 151.12, p < 0.0001). There were no significant differences between the SCAND3 methylation levels in LC patients, BLD cases, and HC (χ2 = 0.217, p = 0.897). (B) The Myo1g methylation ratio among the HCC patients (78.79%) was significantly higher than that of the LC patients (32.69%), BLD cases (6%), and HC (2%) (χ2 = 137.8, p < 0.001). The methylation levels in the LC patients were higher than that in the BLD cases (χ2 = 7.76, p < 0.05) and HC (χ2 = 16.18, p < 0.001). (C) The “SCAND3 + Myo1g” methylation ratio among the HCC patients (92.73%) was significantly higher than that of the LC patients (36.53%), BLD cases (12%), and HC (8%) respectively, (χ2 = 132.47, p < 0.001). The “SCAND3 + Myo1g” methylation levels in the LC patients were higher than those in the BLD cases (χ2 = 5.524, p < 0.05) and HC (χ2 = 11.55, p < 0.001). * p < 0.05, ** p < 0.01.
![Cancers 12 02332 g004]()
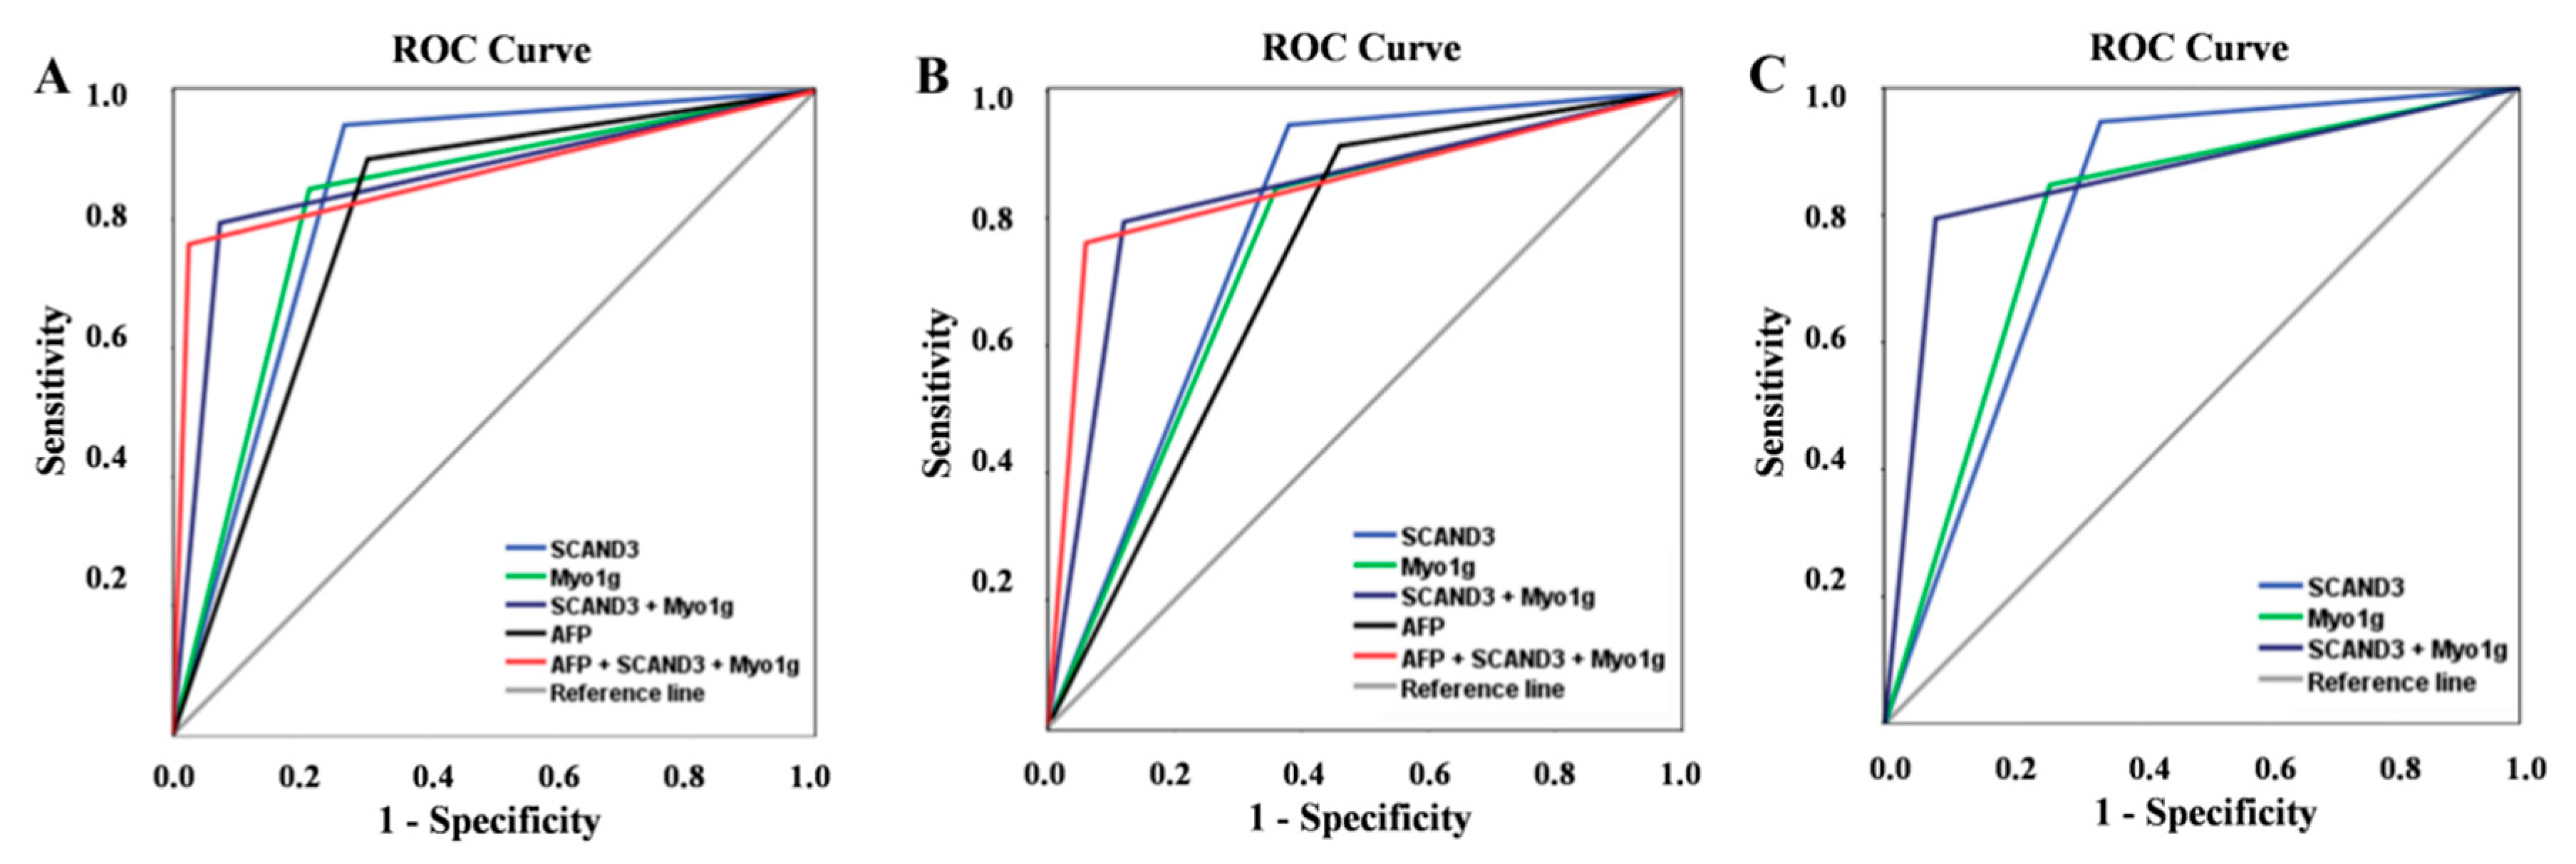
Figure 5.
Diagnostic values of serum gene methylation makers and AFP for HCC patients. The receiver operating characteristic (ROC) of SCAND3, Myo1g, SCAND3 + Myo1g, AFP, and AFP + SCAND3 + Myo1g for HCC diagnosis in the whole HCC cohort (A), early-stage HCC patients (B), and AFP-negative HCC patients (C).
Table 1.
Diagnostic values of serum gene methylation markers and AFP in predicting HCC.
Table 1.
Diagnostic values of serum gene methylation markers and AFP in predicting HCC.
| Markers | Se (%) | Sp (%) | PPV (%) | NPV (%) | Accuracy (%) | AUC (95% CI) | Kappa |
|---|
| AFP | 69.7 | 89.4 | 87.8 | 73.0 | 79.1 | 0.796 (0.744–0.847) | 0.585 |
| SCAND3 | 73.3 | 94.7 | 93.8 | 76.5 | 83.6 | 0.840 (0.794–0.886) | 0.674 |
| Myo1g | 78.8 | 84.8 | 85.0 | 78.5 | 81.6 | 0.818 (0.769–0.867) | 0.633 |
| SCAND3 + Myo1g | 92.2 | 79.5 | 83.2 | 90.2 | 86.2 | 0.861 (0.816–0.906) | 0.720 |
| AFP + SCAND3 + Myo1g | 97.6 | 76.2 | 81.7 | 96.6 | 87.3 | 0.869 (0.825–0.912) | 0.744 |
Table 2.
Diagnostic values of serum gene methylation markers and AFP in predicting early-stage HCC.
Table 2.
Diagnostic values of serum gene methylation markers and AFP in predicting early-stage HCC.
| Markers | Se (%) | Sp (%) | PPV (%) | NPV (%) | Accuracy (%) | AUC (95% CI) | Kappa |
|---|
| AFP | 54 | 89.4 | 62.8 | 85.4 | 80.6 | 0.727 (0.636–0.818) | 0.455 |
| SCAND3 | 62 | 94.7 | 79.5 | 88.3 | 87.1 | 0.784 (0.697–0.870) | 0.612 |
| Myo1g | 64 | 84.8 | 58.2 | 87.7 | 79.6 | 0.744 (0.658–0.830) | 0.472 |
| SCAND3 + Myo1g | 88 | 79.5 | 58.7 | 95.2 | 81.6 | 0.837 (0.773–0.902) | 0.578 |
| AFP + SCAND3 + Myo1g | 94 | 76.2 | 56.6 | 97.5 | 80.6 | 0.851 (0.794–0.908) | 0.575 |
Table 3.
Diagnostic values of SCAND3 and Myo1g methylation levels in AFP-negative HCC patients.
Table 3.
Diagnostic values of SCAND3 and Myo1g methylation levels in AFP-negative HCC patients.
| Markers | Se (%) | Sp (%) | PPV (%) | NPV (%) | Accuracy (%) | AUC (95% CI) | Kappa |
|---|
| SCAND3 | 66 | 94.7 | 80.5 | 89.4 | 87.5 | 0.804 (0.720–0.887) | 0.646 |
| Myo1g | 74 | 84.8 | 61.7 | 90.8 | 82.1 | 0.794 (0.715–0.872) | 0.551 |
| SCAND3 + Myo1g | 92 | 79.5 | 59.7 | 96.8 | 82.6 | 0.857 (0.799–0.916) | 0.605 |
Table 4.
Correlation between the methylation status and clinicopathological characteristics of the HCC patients.
Table 4.
Correlation between the methylation status and clinicopathological characteristics of the HCC patients.
| Characteristic | N | SCAND3 | X2 | P | Myo1g | X2 | P | SCAND3 + Myo1g | X2 | P |
|---|
| UM | M | | | UM | M | | | UM | M | | |
|---|
| Age (years) | | | | | | | | | | | | | |
| ≤50 | 73 | 20 | 53 | 0.036 | 0.850 | 16 | 57 | 0.039 | 0.843 | 4 | 69 | 0.624 | 0.429 |
| >50 | 92 | 24 | 68 | | | 19 | 73 | | | 8 | 84 | | |
| Sex | | | | | 0.498 | | | | 0.183 | | | | |
| Male | 147 | 38 | 109 | 0.459 | | 29 | 118 | 1.776 | | 11 | 136 | 0.088 | 0.766 |
| Female | 18 | 6 | 12 | | | 6 | 12 | | | 1 | 17 | | |
| Tumor size (cm) | | | | | 0.032 * | | | | 0.001 * | | | | |
| ≤5 | 64 | 23 | 41 | 4.595 | | 22 | 42 | 10.839 | | 7 | 57 | 2.082 | 0.149 |
| >5 | 101 | 21 | 80 | | | 13 | 88 | | | 5 | 96 | | |
| Tumor number | | | | | | | | | | | | | |
| Single | 93 | 28 | 65 | 1.29 | 0.256 | 22 | 71 | 0.762 | 0.383 | 9 | 84 | 1.827 | 0.176 |
| multiple | 72 | 16 | 56 | | | 13 | 59 | | | 3 | 69 | | |
| Lymphatic metastasis | | | | | | | | | | | | | |
| no | 146 | 42 | 107 | 2.860 | 0.091 | 34 | 112 | 3.268 | 0.071 | 11 | 135 | 0.129 | 0.720 |
| yes | 19 | 2 | 17 | | | 1 | 18 | | | 1 | 18 | | |
| Distant metastasis | | | | | | | | | | | | | |
| no | 149 | 41 | 108 | 0.568 | 0.451 | 32 | 117 | 0.064 | 0.800 | 11 | 138 | 0.027 | 0.868 |
| yes | 16 | 3 | 13 | | | 3 | 13 | | | 1 | 15 | | |
| BCLC stage | | | | | | | | | | | | | |
| 0 + A | 50 | 19 | 31 | 6.760 | 0.080 | 18 | 32 | 10.277 | 0.016 * | 6 | 44 | 3.177 | 0.365 |
| B + C | 115 | 25 | 90 | | | 17 | 98 | | | 6 | 109 | | |
| Tumor differentiation | | | | | | | | | | | | | |
| Well-differentiated | 14 | 4 | 10 | 0.072 | 0.789 | 6 | 8 | 0.570 | | 1 | 13 | 0.209 | 0.648 |
| Moderately/poorly differentiated | 62 | 20 | 42 | | | 20 | 42 | | 0.450 | 7 | 55 | | |
| Vascular invasion | | | | | | | | | | | | | |
| Microvascular invasion | | | | | | | | | | | | | |
| no | 51 | 14 | 37 | 1.233 | 0.269 | 19 | 32 | 0.638 | | 4 | 47 | 1.185 | 0.276 |
| yes | 25 | 10 | 15 | | | 7 | 18 | | 0.424 | 4 | 21 | | |
| PVTT | | | | | | | | | | | | | |
| no | 122 | 40 | 82 | 8.967 | 0.003 * | 29 | 93 | 1.833 | | 11 | 111 | 2.111 | 0.146 |
| yes | 43 | 4 | 39 | | | 6 | 37 | | 0.176 | 1 | 42 | | |
Table 5.
Multivariate logistic regression analysis of the clinicopathological characteristics of serum gene methylation markers in HCC.
Table 5.
Multivariate logistic regression analysis of the clinicopathological characteristics of serum gene methylation markers in HCC.
| Parameters | SCAND3 | Myo1g | SCAND3+Myo1g |
|---|
| Univariate Analysis | Multivariate Analysis | Univariate Analysis | Multivariate Analysis | Univariate Analysis | Multivariate Analysis |
|---|
| OR (95% CI) | P | OR (95% CI) | P | OR (95% CI) | P | OR (95% CI) | P | OR (95% CI) | P | | |
|---|
| Age | 1.069 (0.534–2.139) | 0.850 | | | 1.003 (0.971–1.035) | 0.874 | | | 0.609 (0.176–2.107) | 0.433 | | |
| Sex (Male vs. Female) | 0.697 (0.245–1.987) | 0.500 | | | 0.492 (0.170–1.420) | 0.189 | | | 1.375 (0.167–11.322) | 0.767 | | |
| AST | 1.007 (0.999–1.014) | 0.086 | | | 1.004 (0.997–1.011) | 0.277 | | | 1.014 (0.994–1.035) | 0.169 | | |
| ALT | 1.006 (0.998–1.015) | 0.158 | | | 1.001 (0.997–1.005) | 0.674 | | | 1.006 (0.990–1.022) | 0.465 | | |
| ALB | 0.979 (0.904–1.060) | 0.598 | | | 0.924 (0.843–1.013) | 0.093 | | | 0.984 (0.859–1.127) | 0.813 | | |
| TBIL | 1.050 (0.997–1.107) | 0.067 | | | 1.070 (1.004–1.139) | 0.036 | 1.061 (0.996–1.131) | 0.066 | 1.063 (0.961–1.175) | 0.233 | | |
| PT-INR | 0.460 (0.016–13.646) | 0.653 | | | 0.443 (0.011–17.114) | 0.663 | | | 0.406 (0.001–118.815) | 0.756 | | |
| Tumor size | 2.137 (1.060–4.309) | 0.034 | 2.066 (0.750–5.687) | 0.160 | 3.546 (1.629–7.719) | 0.001 | 2.851 (0.958–8.481) | 0.050 | 2.358 (0.175–7.778) | 0.159 | | |
| Tumor differentiation | 1.762 (0.642–4.834) | 0.271 | | | 0.635 (0.194–2.076) | 0.452 | | | 1.655 (0.187–14.647) | 0.651 | | |
| Tumor multiplicity | 1.508 (0.741–3.069) | 0.357 | | | 1.406 (0.653–3.030) | 0.384 | | | 2.464 (0.642–9.457) | 0.189 | | |
| BCLC staging | 1.540 (1.024–2.318) | 0.038 | 0.838 (0.435–1.615) | 0.597 | 1.948 (1.241–3.058) | 0.004 | 1.182 (0.626–2.230) | 0.607 | 1.687 (0.863–3.296) | 0.126 | | |
| Microvascular invasion | 1.190 (0.332–4.264) | 0.789 | | | 0.655 (0.231–1.856) | 0.426 | | | 2.238 (0.510–9.815) | 0.285 | | |
| PVTT | 4.756 (1.589–14.235) | 0.005 | 4.74 (1.387–16.240) | 0.013 * | 1.923 (0.738–5.012) | 0.181 | | | 4.162 (0.521–33.239) | 0.126 | | |
| AFP | 1.000 (1.000–1.000) | 0.166 | | | 1.000 (1.000–1.000) | 0.184 | | | 1.000 (1.000–1.000) | 0.471 | | |
| HBV DNA (copies/mL) | 1.000 (1.000–1.000) | 0.732 | | | 1.000 (1.000–1.000) | 0.218 | | 1.000 (1.000–1.000) | 0.594 | | |
Table 6.
Baseline characteristics of all the participants.
Table 6.
Baseline characteristics of all the participants.
| Variable | HCC (n = 165) | LC (n = 52) | BLD (n = 50) | HC (n = 49) |
|---|
| Age (years) | 52.08 ± 11.74 | 51.58 ± 12.68 | 47.46 ± 14.67 | 39.57 ± 13.40 |
| Gender (male/female) | 147/18 | 42/10 | 32/18 | 21/28 |
| AST (U/L) | 51.80 (14.80–1193.90) | 65.50 (12.00–317.00) | 17.70 (11.50–1.80) | 18.60 (11.60–42.10) |
| ALT (U/L) | 43.40 (9.6–1344.7) | 40.10 (4.00–205.00) | 17.45 (5.00–47.40) | 15.30 (7.00–107.00) |
| TBIL (mg/dl) | 14.90 (4.80–78.30) | 41.85 (7.10–618.00) | NA | NA |
| ALB (g/L) | 42.20 (27.70–52.50) | 37.55 (23.90–50.20) | NA | NA |
| PT-INR | 1.05 (0.65–1.44) | NA | NA | NA |
| HBV DNA (copies/mL) | 2127 (0–1.07E8) | 1259 (0–2.32E8) | NA | NA |
| AFP (ng/mL) | 225.3 (1.38–121.00) | 25.86 (0.5–324.50) | 4.99 (0.60–31.78) | 3.45 (0.56–32.00) |

 ,
, 


