Characterisation of Ovarian Cancer Cell Line NIH-OVCAR3 and Implications of Genomic, Transcriptomic, Proteomic and Functional DNA Damage Response Biomarkers for Therapeutic Targeting

 and
and 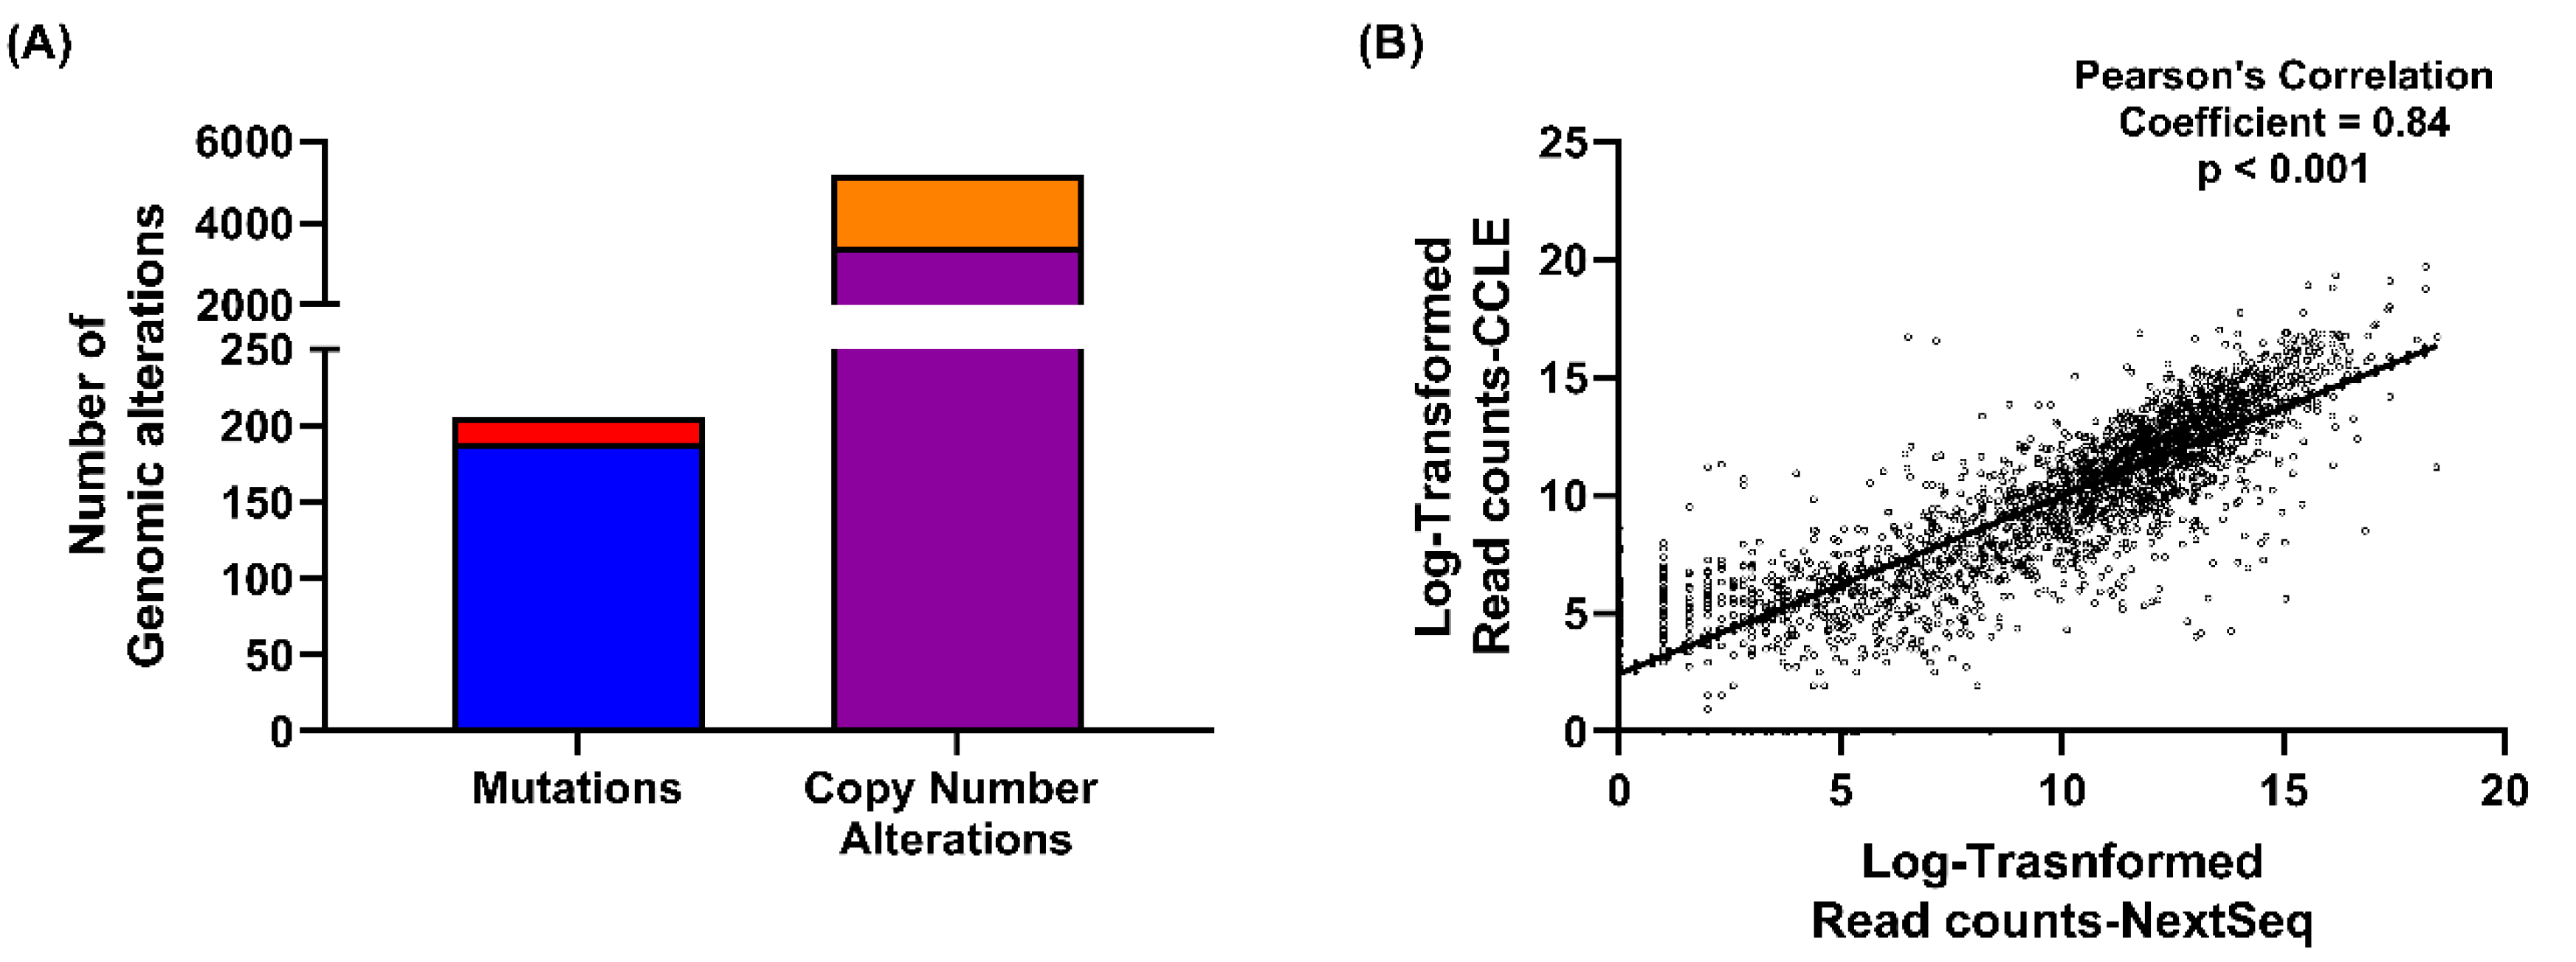
Abstract
:1. Introduction
2. Results
2.1. NIH-OVCAR3 Cells Are Representative of HGSOC, with TP53 Mutation, a Low Number of Mutations and High Frequency of Copy Number Alterations
2.2. NIH-OVCAR3 Cells Are Resistant to ATR Inhibitor VE-821, but Sensitive to Carboplatin and the PARP Inhibitor, Rucaparib
2.3. NIH-OVCAR3 Cells Are Resistant to VE-821 Despite Functional Loss of p53 and Significant ATR Inhibition
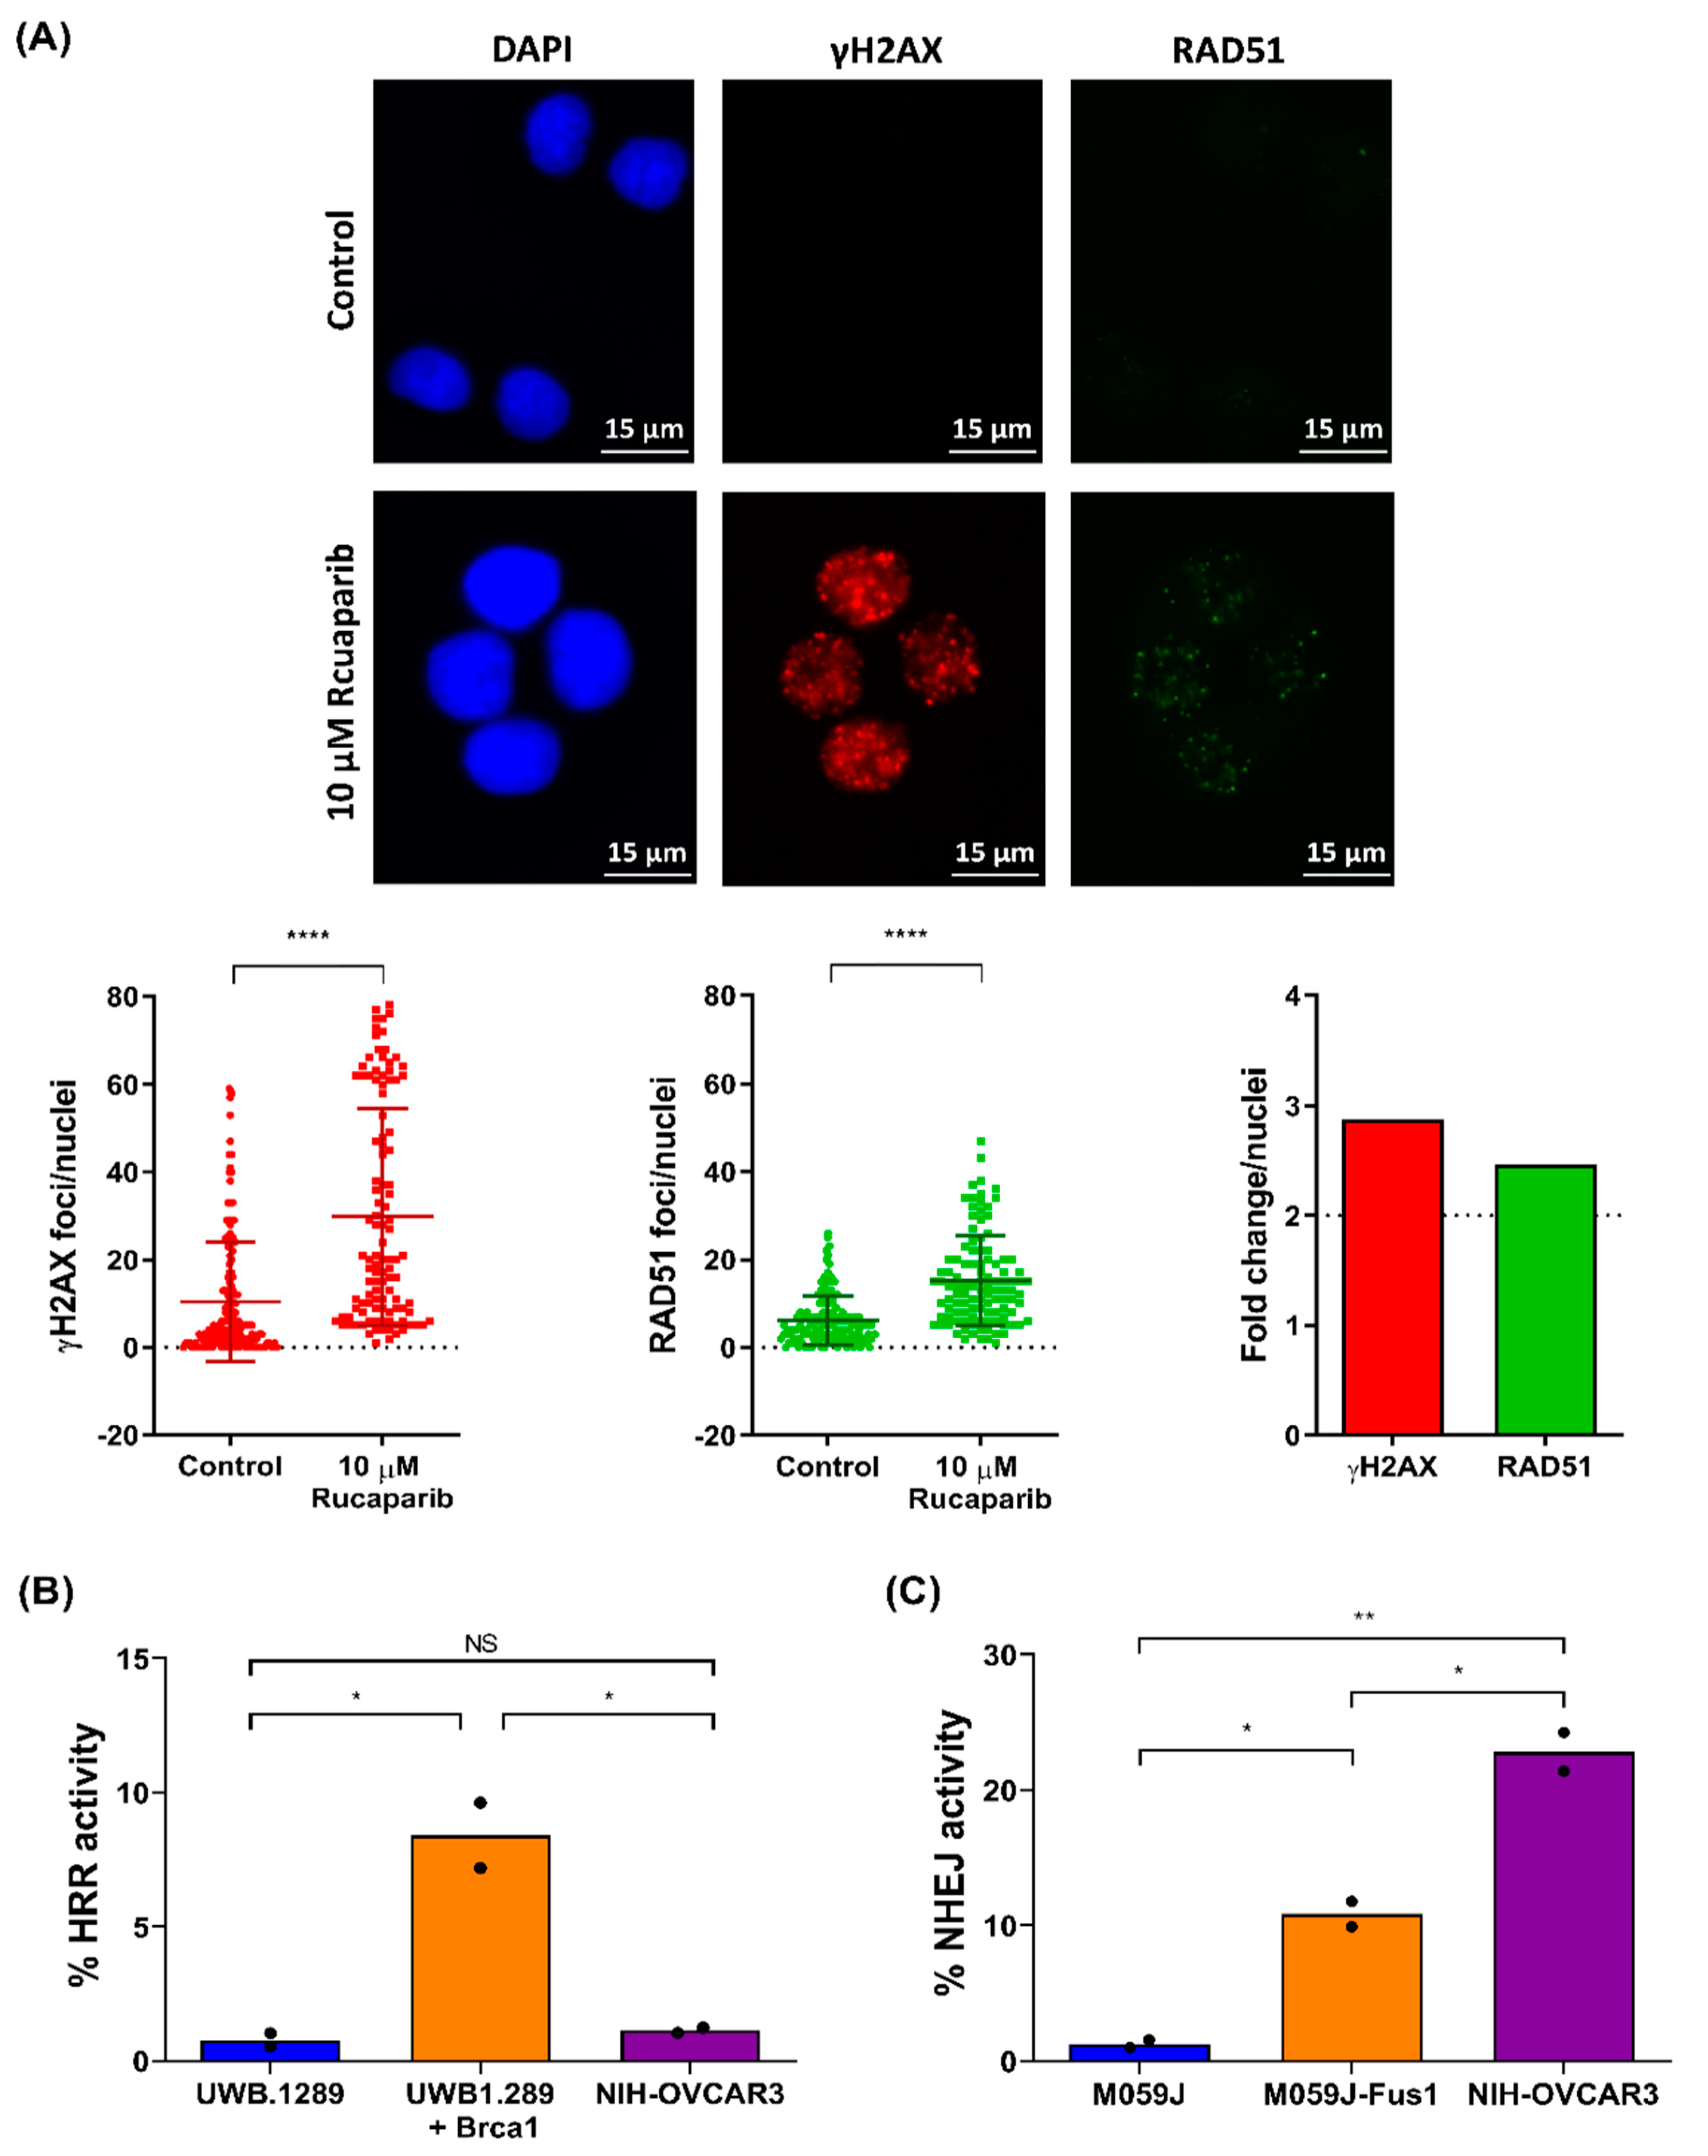
2.4. NIH-OVCAR3 Cells Display a Complex HRR Phenotype and Show High Level of NHEJ Activity
2.5. Genomic and Transcriptomic Alterations of DDR Genes among High Grade Serous Ovarian Cancers
3. Discussion
4. Materials and Methods
4.1. Cell Line and Culture Conditions
4.2. Chemicals and Reagents
4.3. Colony Formation Assay
4.4. Homologous Recombination Repair (HRR) Assay
4.4.1. Immunofluorescence Based γH2AX-RAD51 Assay
4.4.2. Plasmid Re-Joining Assay
4.5. Non-Homologous End Joining (NHEJ) Plasmid Re-Joining Assay
4.6. Western Blot Analysis
4.6.1. TP53 Functional Analysis
4.6.2. VE-821 ATR Inhibition Analysis
4.6.3. Antibodies Used for Baseline Protein Expression Analysis
4.7. Targeted RNA-Sequencing of the Cell Line Panel
4.8. Bioinformatics Analysis
4.9. Statistical Analysis
5. Conclusions
6. Patents
- Helleday, T.; Curtin NJ. Therapeutic Compounds (PARP inhibitors in homologous repair/BRCA defective cancer) WO 2005/012305 A2.
- Boritzki, T.J.; Calvert, A.H.; Curtin, N.J.; Dewji, M.R.; Hostomsky, Z.; Jones, C.; Kaufman, R.; Klamerus, K.J.; Newell, D.R.; Plummer, E.R.; Reich, S.D.; Steinfeldt, H.M.; Stratford, I.J.; Thomas, H.R.; Williams, K.J. Therapeutic Combinations Comprising PARP inhibitor WO/2006/033006.
- Falcon, S.; Reaper, P.; Pollard, J.; Curtin, N.J.; Middleton, F.K.; Chen, T. Method for measuring ATR inhibition mediated increases in DNA damage. WO2014055756A1.
Supplementary Materials
Author Contributions
Funding
Acknowledgments
Conflicts of Interest
References
- Hanahan, D.; Weinberg, R.A. Hallmarks of Cancer: The Next Generation. Cell 2011, 144, 646–674. [Google Scholar] [CrossRef] [Green Version]
- Curtin, N.J. DNA repair dysregulation from cancer driver to therapeutic target. Nat. Rev. Cancer 2012, 12, 801–817. [Google Scholar] [CrossRef]
- Sachdev, E.; Tabatabai, R.; Roy, V.; Rimel, B.J.; Mita, M.M. PARP Inhibition in Cancer: An Update on Clinical Development. Target. Oncol. 2019, 14, 657–679. [Google Scholar] [CrossRef]
- Cancer Genome Atlas Research Network. Integrated genomic analyses of ovarian carcinoma. Nature 2011, 474, 609–615. [Google Scholar] [CrossRef] [PubMed]
- Bray, F.; Ferlay, J.; Soerjomataram, I.; Siegel, R.L.; Torre, L.A.; Jemal, A. Global cancer statistics 2018: GLOBOCAN estimates of incidence and mortality worldwide for 36 cancers in 185 countries. CA Cancer J. Clin. 2018, 68, 394–424. [Google Scholar] [CrossRef] [Green Version]
- Franzese, E.; Centonze, S.; Diana, A.; Carlino, F.; Guerrera, L.P.; Di Napoli, M.; De Vita, F.; Pignata, S.; Ciardiello, F.; Orditura, M. PARP inhibitors in ovarian cancer. Cancer Treatment Rev. 2019, 73, 1–9. [Google Scholar] [CrossRef] [PubMed] [Green Version]
- Huang, X.Z.; Jia, H.; Xiao, Q.; Li, R.-Z.; Wang, X.-S.; Yin, H.-Y.; Zhou, X. Efficacy and Prognostic Factors for PARP Inhibitors in Patients With Ovarian Cancer. Front. Oncol. 2020, 10, 958. [Google Scholar] [CrossRef]
- Poveda, A. Final overall survival (OS) results from SOLO2/ENGOT-ov21: A phase III trial assessing maintenance olaparib in patients (pts) with platinum-sensitive, relapsed ovarian cancer and a BRCA mutation. ASCO Virtual Sci. Program Am. Soc. Clin. Oncol. 2020. [Google Scholar] [CrossRef]
- Postel-Vinay, S.; Bajrami, I.; Friboulet, L.; Elliott, R.; Fontebasso, Y.; Dorvault, N.; Olaussen, K.A.; André, F.; Soria, J.C.; Lord, C.J.; et al. A high-throughput screen identifies PARP1/2 inhibitors as a potential therapy for ERCC1-deficient non-small cell lung cancer. Oncogene 2013, 32, 5377–5387. [Google Scholar] [CrossRef] [Green Version]
- Beaufort, C.M.; Helmijr, J.C.A.; Piskorz, A.M.; Hoogstraat, M.; Ruigrok-Ritstier, K.; Besselink, N.; Murtaza, M.; van Ijcken, W.F.J.; Heine, A.A.J.; Smid, M.; et al. Ovarian Cancer Cell Line Panel (OCCP): Clinical Importance of In Vitro Morphological Subtypes. PLoS ONE 2014, 9, e103988. [Google Scholar] [CrossRef] [PubMed]
- Bradbury, A.; Hall, S.; Curtin, N.; Drew, Y. Targeting ATR as Cancer Therapy: A new era for synthetic lethality and synergistic combinations? Pharmacol. Ther. 2020, 207, 107450. [Google Scholar] [CrossRef] [PubMed]
- Mohiuddin, I.S.; Kang, M.H. DNA-PK as an Emerging Therapeutic Target in Cancer. Front. Oncol. 2019, 9. [Google Scholar] [CrossRef] [PubMed]
- Matheson, C.J.; Backos, D.S.; Reigan, P. Targeting WEE1 Kinase in Cancer. Trends Pharmacol. Sci. 2016, 37, 872–881. [Google Scholar] [CrossRef] [PubMed]
- Smith, H.; Southgate, H.; Tweddle, D.; Curtin, J.N. DNA damage checkpoint kinases in cancer. Expert Rev. Mol. Med. 2020, 22, e2. [Google Scholar] [CrossRef]
- Middleton, F.K.; Patterson, M.J.; Elstob, C.J.; Fordham, S.; Herriott, A.; Wade, M.A.; McCormick, A.; Edmondson, R.; May, F.E.B.; Allan, J.M.; et al. Common cancer-associated imbalances in the DNA damage response confer sensitivity to single agent ATR inhibition. Oncotarget 2015, 6, 32396–32409. [Google Scholar] [CrossRef] [Green Version]
- Barretina, J.; Caponigro, G.; Stransky, N.; Venkatesan, K.; Margolin, A.A.; Kim, S.; Wilson, C.J.; Lehár, J.; Kryukov, G.V.; Sonkin, D.; et al. The Cancer Cell Line Encyclopedia enables predictive modelling of anticancer drug sensitivity. Nature 2012, 483, 603–607. [Google Scholar] [CrossRef]
- Garnett, M.J.; Edelman, E.J.; Heidorn, S.J.; Greenman, C.D.; Dastur, A.; Lau, K.W.; Greninger, P.; Thompson, I.R.; Luo, X.; Soares, J.; et al. Systematic identification of genomic markers of drug sensitivity in cancer cells. Nature 2012, 483, 570–575. [Google Scholar] [CrossRef] [Green Version]
- Wilding, J.L.; Bodmer, W.F. Cancer Cell Lines for Drug Discovery and Development. Cancer Res. 2014, 74, 2377. [Google Scholar] [CrossRef] [Green Version]
- Haibe-Kains, B.; El-Hachem, N.; Birkbak, N.J.; Jin, A.C.; Beck, A.H.; Aerts, H.J.W.L.; Quackenbush, J. Inconsistency in large pharmacogenomic studies. Nature 2013, 504, 389–393. [Google Scholar] [CrossRef] [PubMed] [Green Version]
- Hamilton, T.C.; Young, R.C.; McKoy, W.M.; Grotzinger, K.R.; Green, J.A.; Chu, E.W.; Whang-Peng, J.; Rogan, A.M.; Green, W.R.; Ozols, R.F. Characterization of a Human Ovarian Carcinoma Cell Line (NIH:OVCAR-3) with Androgen and Estrogen Receptors. Cancer Res. 1983, 43, 5379. [Google Scholar]
- Domcke, S.; Sinha, R.; Levine, D.A.; Sander, C.; Schultz, N. Evaluating cell lines as tumour models by comparison of genomic profiles. Nat. Commun. 2013, 4, 2126. [Google Scholar] [CrossRef] [PubMed]
- Anglesio, M.S.; Wiegand, K.C.; Melnyk, N.; Chow, C.; Salamanca, C.; Prentice, L.M.; Senz, J.; Yang, W.; Spillman, M.A.; Cochrane, D.R.; et al. Type-specific cell line models for type-specific ovarian cancer research. PLoS ONE 2013, 8, e72162. [Google Scholar] [CrossRef]
- Godwin, A.K.; Meister, A.; O’Dwyer, P.J.; Huang, C.S.; Hamilton, T.C.; Anderson, M.E. High resistance to cisplatin in human ovarian cancer cell lines is associated with marked increase of glutathione synthesis. Proc. Natl. Acad. Sci. USA 1992, 89, 3070–3074. [Google Scholar] [CrossRef] [PubMed] [Green Version]
- Cerami, E.; Gao, J.; Dogrusoz, U.; Gross, B.E.; Sumer, S.O.; Aksoy, B.A.; Jacobsen, A.; Byrne, C.J.; Heuer, M.L.; Larsson, E.; et al. The cBio cancer genomics portal: An open platform for exploring multidimensional cancer genomics data. Cancer Discov. 2012, 2, 401–404. [Google Scholar] [CrossRef] [PubMed] [Green Version]
- Geiger, T.; Cox, J.; Mann, M. Proteomic changes resulting from gene copy number variations in cancer cells. PLoS Genet. 2010, 6, e1001090. [Google Scholar] [CrossRef] [PubMed]
- Chen, T.; Middleton, F.K.; Falcon, S.; Reaper, P.M.; Pollard, J.R.; Curtin, N.J. Development of pharmacodynamic biomarkers for ATR inhibitors. Mol. Oncol. 2015, 9, 463–472. [Google Scholar] [CrossRef] [PubMed]
- Peasland, A.; Wang, L.Z.; Rowling, E.; Kyle, S.; Chen, T.; Hopkins, A.; Cliby, W.A.; Sarkaria, J.; Beale, G.; Edmondson, R.J.; et al. Identification and evaluation of a potent novel ATR inhibitor, NU6027, in breast and ovarian cancer cell lines. Br. J. Cancer 2011, 105, 372–381. [Google Scholar] [CrossRef] [Green Version]
- Rundle, S.; Bradbury, A.; Drew, Y.; Curtin, N.J. Targeting the ATR-CHK1 Axis in Cancer Therapy. Cancers 2017, 9, 41. [Google Scholar] [CrossRef]
- Min, A.; Im, S.-A.; Jang, H.; Kim, S.; Lee, M.; Kim, D.K.; Yang, Y.; Kim, H.-J.; Lee, K.-H.; Kim, J.W.; et al. AZD6738, A Novel Oral Inhibitor of ATR, Induces Synthetic Lethality with ATM Deficiency in Gastric Cancer Cells. Mol. Cancer Ther. 2017, 16, 566. [Google Scholar] [CrossRef] [Green Version]
- Sultana, R.; Abdel-Fatah, T.; Perry, C.; Moseley, P.; Albarakti, N.; Mohan, V.; Seedhouse, C.; Chan, S.; Madhusudan, S. Ataxia telangiectasia mutated and Rad3 related (ATR) protein kinase inhibition is synthetically lethal in XRCC1 deficient ovarian cancer cells. PLoS ONE 2013, 8, e57098. [Google Scholar] [CrossRef] [Green Version]
- Munck, J.M.; Batey, M.A.; Zhao, Y.; Jenkins, H.; Richardson, C.J.; Cano, C.; Tavecchio, M.; Barbeau, J.; Bardos, J.; Cornell, L.; et al. Chemosensitization of cancer cells by KU-0060648, a dual inhibitor of DNA-PK and PI-3K. Mol. Cancer Ther. 2012, 11, 1789–1798. [Google Scholar] [CrossRef] [PubMed] [Green Version]
- Kwok, M.; Davies, N.; Agathanggelou, A.; Smith, E.; Petermann, E.; Yates, E.; Brown, J.; Lau, A.; Stankovic, T. Synthetic lethality in chronic lymphocytic leukaemia with DNA damage response defects by targeting the ATR pathway. Lancet 2015, 385, S58. [Google Scholar] [CrossRef]
- Dillon, M.T.; Barker, H.E.; Pedersen, M.; Hafsi, H.; Bhide, S.A.; Newbold, K.L.; Nutting, C.M.; McLaughlin, M.; Harrington, K.J. Radiosensitization by the ATR Inhibitor AZD6738 through Generation of Acentric Micronuclei. Mol. Cancer Ther. 2017, 16, 25–34. [Google Scholar] [CrossRef] [PubMed] [Green Version]
- Middleton, F.K.; Pollard, J.R.; Curtin, N.J. The Impact of p53 Dysfunction in ATR Inhibitor Cytotoxicity and Chemo- and Radiosensitisation. Cancers 2018, 10, 275. [Google Scholar] [CrossRef] [PubMed] [Green Version]
- Menezes, D.L.; Holt, J.; Tang, Y.; Feng, J.; Barsanti, P.; Pan, Y.; Ghoddusi, M.; Zhang, W.; Thomas, G.; Holash, J.; et al. A Synthetic Lethal Screen Reveals Enhanced Sensitivity to ATR Inhibitor Treatment in Mantle Cell Lymphoma with ATM Loss-of-Function. Mol. Cancer Res. 2015, 13, 120. [Google Scholar] [CrossRef] [PubMed] [Green Version]
- Hocke, S.; Guo, Y.; Job, A.; Orth, M.; Ziesch, A.; Lauber, K.; De Toni, E.N.; Gress, T.M.; Herbst, A.; Göke, B.; et al. A synthetic lethal screen identifies ATR-inhibition as a novel therapeutic approach for POLD1-deficient cancers. Oncotarget 2016, 7, 7080–7095. [Google Scholar] [CrossRef] [Green Version]
- Hustedt, N.; Álvarez-Quilón, A.; McEwan, A.; Yuan, J.Y.; Cho, T.; Koob, L.; Hart, T.; Durocher, D. A consensus set of genetic vulnerabilities to ATR inhibition. Open Biol. 2019, 9, 190156. [Google Scholar] [CrossRef] [Green Version]
- Mohni, K.N.; Kavanaugh, G.M.; Cortez, D. ATR pathway inhibition is synthetically lethal in cancer cells with ERCC1 deficiency. Cancer Res. 2014, 74, 2835–2845. [Google Scholar] [CrossRef] [Green Version]
- Mukhopadhyay, A.; Plummer, E.R.; Elattar, A.; Soohoo, S.; Uzir, B.; Quinn, J.E.; McCluggage, W.G.; Maxwell, P.; Aneke, H.; Curtin, N.J.; et al. Clinicopathological Features of Homologous Recombination–Deficient Epithelial Ovarian Cancers: Sensitivity to PARP Inhibitors, Platinum, and Survival. Cancer Res. 2012, 72, 5675. [Google Scholar] [CrossRef] [Green Version]
- Birkelbach, M.; Ferraiolo, N.; Gheorghiu, L.; Pfaffle, H.N.; Daly, B.; Ebright, M.I.; Spencer, C.; O’Hara, C.; Whetstine, J.R.; Benes, C.H.; et al. Detection of impaired homologous recombination repair in NSCLC cells and tissues. J. Thorac. Oncol. 2013, 8, 279–286. [Google Scholar] [CrossRef] [Green Version]
- Jarvis, M.C.; Ebrahimi, D.; Temiz, N.A.; Harris, R.S. Mutation Signatures Including APOBEC in Cancer Cell Lines. JNCI Cancer Spectr. 2018, 2. [Google Scholar] [CrossRef] [Green Version]
- Ghandi, M.; Huang, F.W.; Jane-Valbuena, J.; Kryukov, G.V.; Lo, C.C.; McDonald, E.R., 3rd; Barretina, J.; Gelfand, E.T.; Bielski, C.M.; Li, H.; et al. Next-generation characterization of the Cancer Cell Line Encyclopedia. Nature 2019, 569, 503–508. [Google Scholar] [CrossRef] [PubMed]
- Patel, A.G.; Sarkaria, J.N.; Kaufmann, S.H. Nonhomologous end joining drives poly(ADP-ribose) polymerase (PARP) inhibitor lethality in homologous recombination-deficient cells. Proc. Natl. Acad. Sci. USA 2011, 108, 3406–3411. [Google Scholar] [CrossRef] [PubMed] [Green Version]
- Anderson, C.W.; Dunn, J.J.; Freimuth, P.I.; Galloway, A.M.; Allalunis-Turner, M.J. Frameshift mutation in PRKDC, the gene for DNA-PKcs, in the DNA repair-defective, human, glioma-derived cell line M059J. Radiat. Res. 2001, 156, 2–9. [Google Scholar] [CrossRef]
- Virsik-Kopp, P.; Rave-Frank, M.; Hofman-Huther, H.; Schmidberger, H. Role of DNA-dependent protein kinase in the process of radiation-induced aberration formation. Int. J. Radiat. Biol. 2004, 80, 125–133. [Google Scholar] [CrossRef] [PubMed]
- Pierce, A.J.; Johnson, R.D.; Thompson, L.H.; Jasin, M. XRCC3 promotes homology-directed repair of DNA damage in mammalian cells. Genes Dev. 1999, 13, 2633–2638. [Google Scholar] [CrossRef] [PubMed] [Green Version]
- Richardson, C.; Moynahan, M.E.; Jasin, M. Double-strand break repair by interchromosomal recombination: Suppression of chromosomal translocations. Genes Dev. 1998, 12, 3831–3842. [Google Scholar] [CrossRef] [PubMed] [Green Version]
- Bennardo, N.; Cheng, A.; Huang, N.; Stark, J.M. Alternative-NHEJ is a mechanistically distinct pathway of mammalian chromosome break repair. PLoS Genet. 2008, 4, e1000110. [Google Scholar] [CrossRef] [PubMed] [Green Version]
- Gao, J.; Aksoy, B.A.; Dogrusoz, U.; Dresdner, G.; Gross, B.; Sumer, S.O.; Sun, Y.; Jacobsen, A.; Sinha, R.; Larsson, E.; et al. Integrative analysis of complex cancer genomics and clinical profiles using the cBioPortal. Sci. Signal. 2013, 6, pl1. [Google Scholar] [CrossRef] [PubMed] [Green Version]
- Gelmon, K.A.; Tischkowitz, M.; Mackay, H.; Swenerton, K.; Robidoux, A.; Tonkin, K.; Hirte, H.; Huntsman, D.; Clemons, M.; Gilks, B.; et al. Olaparib in patients with recurrent high-grade serous or poorly differentiated ovarian carcinoma or triple-negative breast cancer: A phase 2, multicentre, open-label, non-randomised study. Lancet. Oncol. 2011, 12, 852–861. [Google Scholar] [CrossRef]


© 2020 by the authors. Licensee MDPI, Basel, Switzerland. This article is an open access article distributed under the terms and conditions of the Creative Commons Attribution (CC BY) license (http://creativecommons.org/licenses/by/4.0/).
Share and Cite
Bradbury, A.; O’Donnell, R.; Drew, Y.; Curtin, N.J.; Sharma Saha, S. Characterisation of Ovarian Cancer Cell Line NIH-OVCAR3 and Implications of Genomic, Transcriptomic, Proteomic and Functional DNA Damage Response Biomarkers for Therapeutic Targeting. Cancers 2020, 12, 1939. https://doi.org/10.3390/cancers12071939
Bradbury A, O’Donnell R, Drew Y, Curtin NJ, Sharma Saha S. Characterisation of Ovarian Cancer Cell Line NIH-OVCAR3 and Implications of Genomic, Transcriptomic, Proteomic and Functional DNA Damage Response Biomarkers for Therapeutic Targeting. Cancers. 2020; 12(7):1939. https://doi.org/10.3390/cancers12071939
Chicago/Turabian StyleBradbury, Alice, Rachel O’Donnell, Yvette Drew, Nicola J. Curtin, and Sweta Sharma Saha. 2020. "Characterisation of Ovarian Cancer Cell Line NIH-OVCAR3 and Implications of Genomic, Transcriptomic, Proteomic and Functional DNA Damage Response Biomarkers for Therapeutic Targeting" Cancers 12, no. 7: 1939. https://doi.org/10.3390/cancers12071939