8th Edition Tumor, Node, and Metastasis T-Stage Prognosis Discrepancies: Solid Component Diameter Predicts Prognosis Better than Invasive Component Diameter


Abstract
:
1. Introduction
2. Result
3. Discussion
4. Materials and Method
4.1. Patients Selection
4.2. Pathological Evaluation
4.3. Radiological Evaluation
4.4. Patient Follow-up
4.5. Statistical Analysis
5. Conclusions
Author Contributions
Funding
Conflicts of Interest
References
- Rami-Porta, R.; Bolejack, V.; Crowley, J.; Ball, D.; Kim, J.; Lyons, G.; Rice, T.; Suzuki, K.; Thomas, C.F.; Travis, W.D.; et al. The IASLC Lung Cancer Staging Project: Proposals for the Revisions of the T Descriptors in the Forthcoming Eighth Edition of the TNM Classification for Lung Cancer. J. Thorac. Oncol. 2015, 10, 990–1003. [Google Scholar] [CrossRef] [PubMed] [Green Version]
- Travis, W.D.; Bankier, A.A.; Beasley, M.B.; Flieder, U.B.; Goo, J.M.; MacMahon, H.; Naidich, D.P.; Powell, C.A.; Prokop, M.; Yatabe, Y.; et al. The IASLC Lung Cancer Staging Project: Proposals for Coding T Categories for Subsolid Nodules and Assessment of Tumor Size in Part-Solid Tumors in the Forthcoming Eighth Edition of the TNM Classification of Lung Cancer. J. Thorac. Oncol. 2016, 11, 1204–1223. [Google Scholar] [CrossRef] [PubMed] [Green Version]
- Urer, H.N.; Ahiskali, R.; Arda, N.; Batur, S.; Cinel, L.; Dekan, G.; Fener, N.; Firat, P.; Geleff, S.; Oz, B.; et al. Interobserver agreement among histological patterns and diagnosis in lung adenocarcinomas. Turk. J. Pathol. 2013, 30, 105–110. [Google Scholar] [CrossRef] [PubMed]
- Boland, J.M.; Froemming, A.T.; Wampfler, J.A.; Maldonado, F.; Peikert, T.D.; Hyland, C.; Andrade, M.D.; Aubry, M.C.; Yang, P.; Yi, E.S. Adenocarcinoma in situ, minimally invasive adenocarcinoma, and invasive pulmonary adenocarcinoma—Analysis of interobserver agreement, survival, radiographic characteristics, and gross pathology in 296 nodules. Hum. Pathol. 2016, 51, 41–50. [Google Scholar] [CrossRef] [PubMed]
- Travis, W.D.; Brambilla, E.; Burke, A.; Marx, A.; Nicholson, A.G. WHO classification of tumours of the lung, pleura, thymus and heart. Int. Agency Res. Cancer 2015. [Google Scholar] [CrossRef] [Green Version]
- Goldstraw, P.; Chansky, K.; Crowley, J.; Rami-Porta, R.; Asamura, H.; Eberhardt, W.E.E.; Nicholson, A.G.; Groome, P.; Mitchell, A.; Bolejack, V.; et al. The IASLC Lung Cancer Staging Project: Proposals for Revision of the TNM Stage Groupings in the Forthcoming (Eighth) Edition of the TNM Classification for Lung Cancer. J. Thorac. Oncol. 2016, 11, 39–51. [Google Scholar] [CrossRef] [PubMed] [Green Version]
- Aokage, K.; Miyoshi, T.; Ishii, G.; Kusumoto, M.; Nomura, S.; Katsumata, S.; Sekihara, K.; Hishida, T.; Tsuboi, M. Clinical and Pathological Staging Validation in the Eighth Edition of the TNM Classification for Lung Cancer: Correlation between Solid Size on Thin-Section Computed Tomography and Invasive Size in Pathological Findings in the New T Classification. J. Thorac. Oncol. 2017, 12, 1403–1412. [Google Scholar] [CrossRef] [Green Version]
- Jung, H.S.; Lee, J.G.; Lee, C.Y.; Kim, D.J.; Chung, K.Y. Validation of the T descrior in the new 8th TNM Classification for non-small cell lung cancer. J. Thorac. Dis. 2018, 10, 162–167. [Google Scholar] [CrossRef] [Green Version]
- Hwang, E.J.; Park, C.M.; Ryu, Y.; Lee, S.M.; Kim, Y.T.; Kim, Y.W.; Goo, J.M. Pulmonary adenocarcinomas appearing as part-solid ground-glass nodules: Is measuring solid component size a better prognostic indicator? Eur. Radiol. 2014, 25, 558–567. [Google Scholar] [CrossRef]
- Aokage, K.; Miyoshi, T.; Ishii, G.; Kusumoto, M.; Nomura, S.; Katsumata, S.; Sekihara, K.; Tane, K.; Tsuboi, M. Influence of Ground Glass Opacity and the Corresponding Pathological Findings on Survival in Patients with Clinical Stage I Non–Small Cell Lung Cancer. J. Thorac. Oncol. 2018, 13, 533–542. [Google Scholar] [CrossRef] [Green Version]
- Hattori, A.; Hirayama, S.; Matsunaga, T.; Hayashi, T.; Takamochi, K.; Oh, S.; Suzuki, K. Distinct Clinicopathologic Characteristics and Prognosis Based on the Presence of Ground Glass Opacity Component in Clinical Stage IA Lung Adenocarcinoma. J. Thorac. Oncol. 2019, 14, 265–275. [Google Scholar] [CrossRef] [PubMed] [Green Version]
- Tsutani, Y.; Miyata, Y.; Nakayama, H.; Okumura, S.; Adachi, S.; Yoshimura, M.; Okada, M. Prognostic significance of using solid versus whole tumor size on high-resolution computed tomography for predicting pathologic malignant grade of tumors in clinical stage IA lung adenocarcinoma: A multicenter study. J. Thorac. Cardiovasc. Surg. 2012, 143, 607–612. [Google Scholar] [CrossRef] [PubMed] [Green Version]
- Su, H.; Dai, C.; She, Y.; Ren, Y.; Zhang, L.; Xie, H.; Xie, D.; Jiang, G.; Chen, C. Which T descriptor is more predictive of recurrence after sublobar resection: Whole tumour size versus solid component size? Eur. J. Cardio-Thorac. Surg. 2018, 54, 1028–1036. [Google Scholar] [CrossRef] [PubMed]
- Yanagawa, M.; Kusumoto, M.; Johkoh, T.; Noguchi, M.; Minami, Y.; Sakai, F.; Asamura, H.; Tomiyama, N.; Awai, K.; Minami, M.; et al. Radiologic–Pathologic Correlation of Solid Portions on Thin-section CT Images in Lung Adenocarcinoma: A Multicenter Study. Clin. Lung Cancer 2018, 19, e303–e312. [Google Scholar] [CrossRef] [PubMed] [Green Version]
- Shih, A.; Uruga, H.; Bozkurtlar, E.; Chung, J.; Hariri, L.P.; Minami, Y.; Wang, H.; Yoshizawa, A.; Muzikansky, A.; Moreira, A.L.; et al. Problems in the reproducibility of classification of small lung adenocarcinoma: An international interobserver study. Histopathology 2019, 75, 649–659. [Google Scholar] [CrossRef]
- Pignon, J.-P.; Tribodet, H.; Scagliotti, G.V.; Douillard, J.-Y.; Shepherd, F.A.; Stephens, R.J.; Dunant, A.; Torri, V.; Rosell, R.; Seymour, L.; et al. Lung Adjuvant Cisplatin Evaluation: A Pooled Analysis by the LACE Collaborative Group. J. Clin. Oncol. 2008, 26, 3552–3559. [Google Scholar] [CrossRef]
- Hamada, C.; Tanaka, F.; Ohta, M.; Fujimura, S.; Kodama, K.; Imaizumi, M.; Wada, H. Meta-Analysis of Postoperative Adjuvant Chemotherapy With Tegafur-Uracil in Non–Small-Cell Lung Cancer. J. Clin. Oncol. 2005, 23, 4999–5006. [Google Scholar] [CrossRef]
- Available online: https://www.haigan.gr.jp/guideline/2019/1/2/190102040100.html (accessed on 15 May 2020).
- Sawabata, N.; Miyaoka, E.; Asamura, H.; Nakanishi, Y.; Eguchi, K.; Mori, M.; Nomori, H.; Fujii, Y.; Okumura, M.; Yokoi, K. Japanese Lung Cancer Registry Study of 11,663 Surgical Cases in 2004: Demographic and Prognosis Changes Over Decade. J. Thorac. Oncol. 2011, 6, 1229–1235. [Google Scholar] [CrossRef] [Green Version]
- Noguchi, M.; Minami, Y.; Iijima, T.; Matsuno, Y. Reproducibility of the diagnosis of small adenocarcinoma of the lung and usefulness of an educational program for the diagnostic criteria. Pathol. Int. 2005, 55, 8–13. [Google Scholar] [CrossRef]
- Suzuki, K.; Yokose, T.; Yoshida, J.; Nishimura, M.; Takahashi, K.; Nagai, K.; Nishiwaki, Y. Prognostic significance of the size of central fibrosis in peripheral adenocarcinoma of the lung. Ann. Thorac. Surg. 2000, 69, 893–897. [Google Scholar] [CrossRef]
- Wittekind, C.; Compton, C.C.; Brierley, J.; Lee, A.; Eycken, E.V. TNM Supplement: A Commentary on Uniform Use, 4th ed.; Wiley-Blackwell: Oxford, UK, 2012. [Google Scholar]
- Anderson, K.R.; Onken, A.; Heidinger, B.; Chen, Y.; Bankier, A.A.; Vanderlaan, P.A. Pathologic T Descriptor of Nonmucinous Lung Adenocarcinomas Now Based on Invasive Tumor Size. Am. J. Clin. Pathol. 2018, 150, 499–506. [Google Scholar] [CrossRef] [PubMed]


| Characteristics | n |
|---|---|
| Histological types | |
| Adenocarcinoma | 125 (71%) |
| Squamous cell carcinoma | 34 (19%) |
| Large cell neuroendocrine carcinoma | 7 (4%) |
| Others | 11 (6%) |
| Median follow up (days) | 624 (range, 97–1207) |
| Median time from CT scan to surgery (days) | 6 (range, 1–60) |
| Number of diagnostic pathologists | 11 people |
| Overall tumor size (T) | 22 mm (range, 6–94) |
| Solid component size (Ts) | 20 mm (range, 0–94) |
| Pathological tumor size (P) | 25 mm (range, 8–98) |
| Pathological invasive size (Pi) | 18 mm (range, 0–98) |
| P minus T | −1 mm (−28 to +41) |
| Pi minus Ts | −1.4 mm (−24 to +97) |
| −5 mm < Pi minus Ts < +5 mm | 99 (56%) |
| T-Stage | Clinical T-Stage (People) | Pathological T-Stage (People) |
|---|---|---|
| Tis | 3 (2%) | 4 (2%) |
| T1mi | 4 (2%) | 20 (11%) |
| T1a | 23 (13%) | 22 (13%) |
| T1b | 72 (41%) | 51 (29%) |
| T1c | 38 (21%) | 25 (14%) |
| T2a | 21 (12%) | 31 (18%) |
| T2b | 1 (1%) | 6 (3%) |
| T3 | 9 (5%) | 14 (8%) |
| T4 | 6 (3%) | 4 (2%) |
| Clinical T-Stage | Pathological T-Stage | ||
|---|---|---|---|
| cT-stage | n | Changed from cT-stage to pT-stage | n |
| Tis | 3 | No change: 33% | Tis: 1 |
| Upstage: 66% | T1a: 1 T1b: 1 | ||
| T1mi | 4 | No change: 75% | T1mi: 3 |
| Upstage: 25% | T1a: 1 | ||
| T1a | 23 | Downstage: 26% | Tis: 2 T1mi: 4 |
| No change: 35% | T1a: 8 | ||
| Upstage: 39% | T1b: 7 T1c: 1 T4: 1 | ||
| T1b | 72 | Downstage: 28% | Tis: 1 T1mi: 12 T1a: 7 |
| No change: 51% | T1b: 37 | ||
| Upstage: 21% | T1c: 4 T2a: 10 (pl) T3: 1 (pm) | ||
| T1c | 38 | Downstage: 24% | T1mi: 1 T1a: 4 T1b: 4 |
| No change: 34% | T1c: 13 | ||
| Upstage: 42% | T2a: 10 (pl: 9) T2b: 2 T3: 4 (pl3: 2, pm: 2) | ||
| T2a | 21 | Downstage: 43% | T1a: 1 T1b: 2 T1c: 6 |
| No change: 38% | T2a: 8 | ||
| Upstage: 19% | T2b: 1 T3: 3 | ||
| T2b | 1 | No change: 100% | T2b: 1 |
| T3 | 9 | Downstage: 45% | T2a: 3 T2b: 1 |
| No change: 45% | T3: 4 | ||
| Upstage: 10% | T4: 1 | ||
| T4 | 6 | Downstage: 67% | T1c: 1 T2b: 1 T3: 2 |
| No change: 33% | T4: 2 | ||
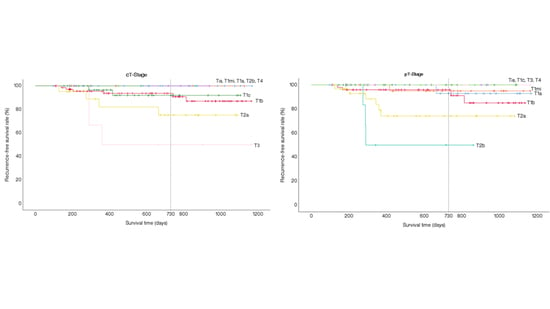
| T-Stage | Clinical T-Stage | Pathological T-Stage |
|---|---|---|
| Tis | 100% | 100% |
| T1mi | 100% | 95.0% |
| T1a | 100% | 92.9% |
| T1b | 93.7% | 95.9% |
| T1c | 92.0% | 100% |
| T2a | 75.2% | 74.1% |
| T2b | 100% | 50% |
| T3 | 50% | 100% |
| T4 | 100% | 100% |
| Characteristics | n |
|---|---|
| Adenocarcinoma | |
| Lepidic | 51 (40%) |
| Acinar | 12 (9%) |
| Papillary | 45 (36%) |
| Micropapillary | 2 (2%) |
| Solid | 2 (2%) |
| Acinar and solid (35% each) | 1 (1%) |
| Variants (Invasive mucinous) | 10 (8%) |
| (Colloid) | 2 (2%) |
| Age | |
| <70 | 69 (55%) |
| ≥70 | 56 (45%) |
| Sex | |
| Female | 66 (53%) |
| Male | 59 (47%) |
| CEA | |
| ≤4.4 | 97 (78%) |
| >4.5 | 28 (22%) |
| Brinkman index | |
| ≤400 | 80 (64%) |
| >400 | 45 (36%) |
| %FEV1.0 | |
| <70% | 119 (95%) |
| ≥70% | 6 (5%) |
| Pleural invasion | |
| Positive | 22 (18%) |
| Negative | 103 (82%) |
| Pulmonary metastasis | |
| Positive | 2 (2%) |
| Negative | 123 (98%) |
| Lymphatic vessel invasion | |
| Positive | 30 (24%) |
| Negative | 95 (76%) |
| Blood vessel invasion | |
| Positive | 44 (35%) |
| Negative | 81 (65%) |
| Spread through alveolar space | |
| Positive | 35 (28%) |
| Negative | 73 (58%) |
| Unknown | 17 (14%) |
| Characteristics | All Histlogical Types | Adenocarcinoma |
|---|---|---|
| Median follow up (days) | 624 (range, 97–1207) | 651 (range, 97–1207) |
| Median time from CT scan to surgery (days) | 6 (range, 1–60) | 6 (range, 1–60) |
| Overall tumor size (T) | 22 mm (range, 6–94) | 22 mm (range, 8–64) |
| Solid component size (Ts) | 20 mm (range, 0–94) | 17 mm (range, 0–64) |
| Pathological tumor size (P) | 25 mm (range, 8–98) | 22 mm (range, 8–98) |
| Pathological invasive size (Pi) | 18 mm (range, 0–98) | 14 mm (range, 0–98) |
| P minus T | −1 mm (−28 to +41) | 0 mm (−16 to +41) |
| Pi minus Ts | −1.4 mm (−24 to +97) | −1 mm (−32 to +97) |
| −5 mm < Pi minus Ts < +5 mm | 99 (56%) | 65 (52%) |
| Clinical T-Stage | Pathological T-Stage | ||
|---|---|---|---|
| cT-stage | n | Changed from cT-stage to pT-stage | n |
| Tis | 3 | No change: 33% | Tis: 1 |
| Upstage: 66% | T1a: 1 | ||
| T1b: 1 | |||
| T1mi | 4 | No change: 75% | T1mi: 3 |
| Upstage: 25% | T1a: 1 | ||
| T1a | 21 | Downstage: 29% | Tis: 2 |
| T1mi: 4 | |||
| No change: 38% | T1a: 8 | ||
| Upstage: 33% | T1b: 5 | ||
| T1c: 1 | |||
| T4: 1 (size) | |||
| T1b | 53 | Downstage: 36% | Tis: 1 |
| T1mi: 12 | |||
| T1a: 6 | |||
| No change: 41% | T1b: 22 | ||
| Upstage: 23% | T1c: 4 | ||
| T2a: 8 (pl:8) | |||
| T1c | 25 | Downstage: 32% | T1mi: 1 |
| T1a: 3 | |||
| T1b: 4 | |||
| No change: 28% | T1c: 7 | ||
| Upstage: 40% | T2a: 8 (pl:7)) | ||
| T2b: 1 | |||
| T3: 1 (pm) | |||
| T2a | 14 | Downstage: 50% | T1a: 1 |
| T1b: 2 | |||
| T1c: 4 | |||
| No change: 36% | T2a: 5 (pl:1) | ||
| Upstage: 14% | T3: 2 (pl:1, size:1) | ||
| T2b | 0 | - | |
| T3 | 4 | Downstage: 25% | T2a: 1 |
| No change: 50% | T3: 2 | ||
| Upstage: 25% | T4: 1 (size) | ||
| T4 | 1 | No change: 100% | T4: 1 |
© 2020 by the authors. Licensee MDPI, Basel, Switzerland. This article is an open access article distributed under the terms and conditions of the Creative Commons Attribution (CC BY) license (http://creativecommons.org/licenses/by/4.0/).
Share and Cite
Funai, K.; Kawase, A.; Mizuno, K.; Koyama, S.; Shiiya, N. 8th Edition Tumor, Node, and Metastasis T-Stage Prognosis Discrepancies: Solid Component Diameter Predicts Prognosis Better than Invasive Component Diameter. Cancers 2020, 12, 1577. https://doi.org/10.3390/cancers12061577
Funai K, Kawase A, Mizuno K, Koyama S, Shiiya N. 8th Edition Tumor, Node, and Metastasis T-Stage Prognosis Discrepancies: Solid Component Diameter Predicts Prognosis Better than Invasive Component Diameter. Cancers. 2020; 12(6):1577. https://doi.org/10.3390/cancers12061577
Chicago/Turabian StyleFunai, Kazuhito, Akikazu Kawase, Kiyomichi Mizuno, Shin Koyama, and Norihiko Shiiya. 2020. "8th Edition Tumor, Node, and Metastasis T-Stage Prognosis Discrepancies: Solid Component Diameter Predicts Prognosis Better than Invasive Component Diameter" Cancers 12, no. 6: 1577. https://doi.org/10.3390/cancers12061577