Radiomics Applications in Renal Tumor Assessment: A Comprehensive Review of the Literature

 ,
,  ,
,  ,
,
Abstract
:
1. Introduction
2. Materials and Methods
2.1. Study Aims
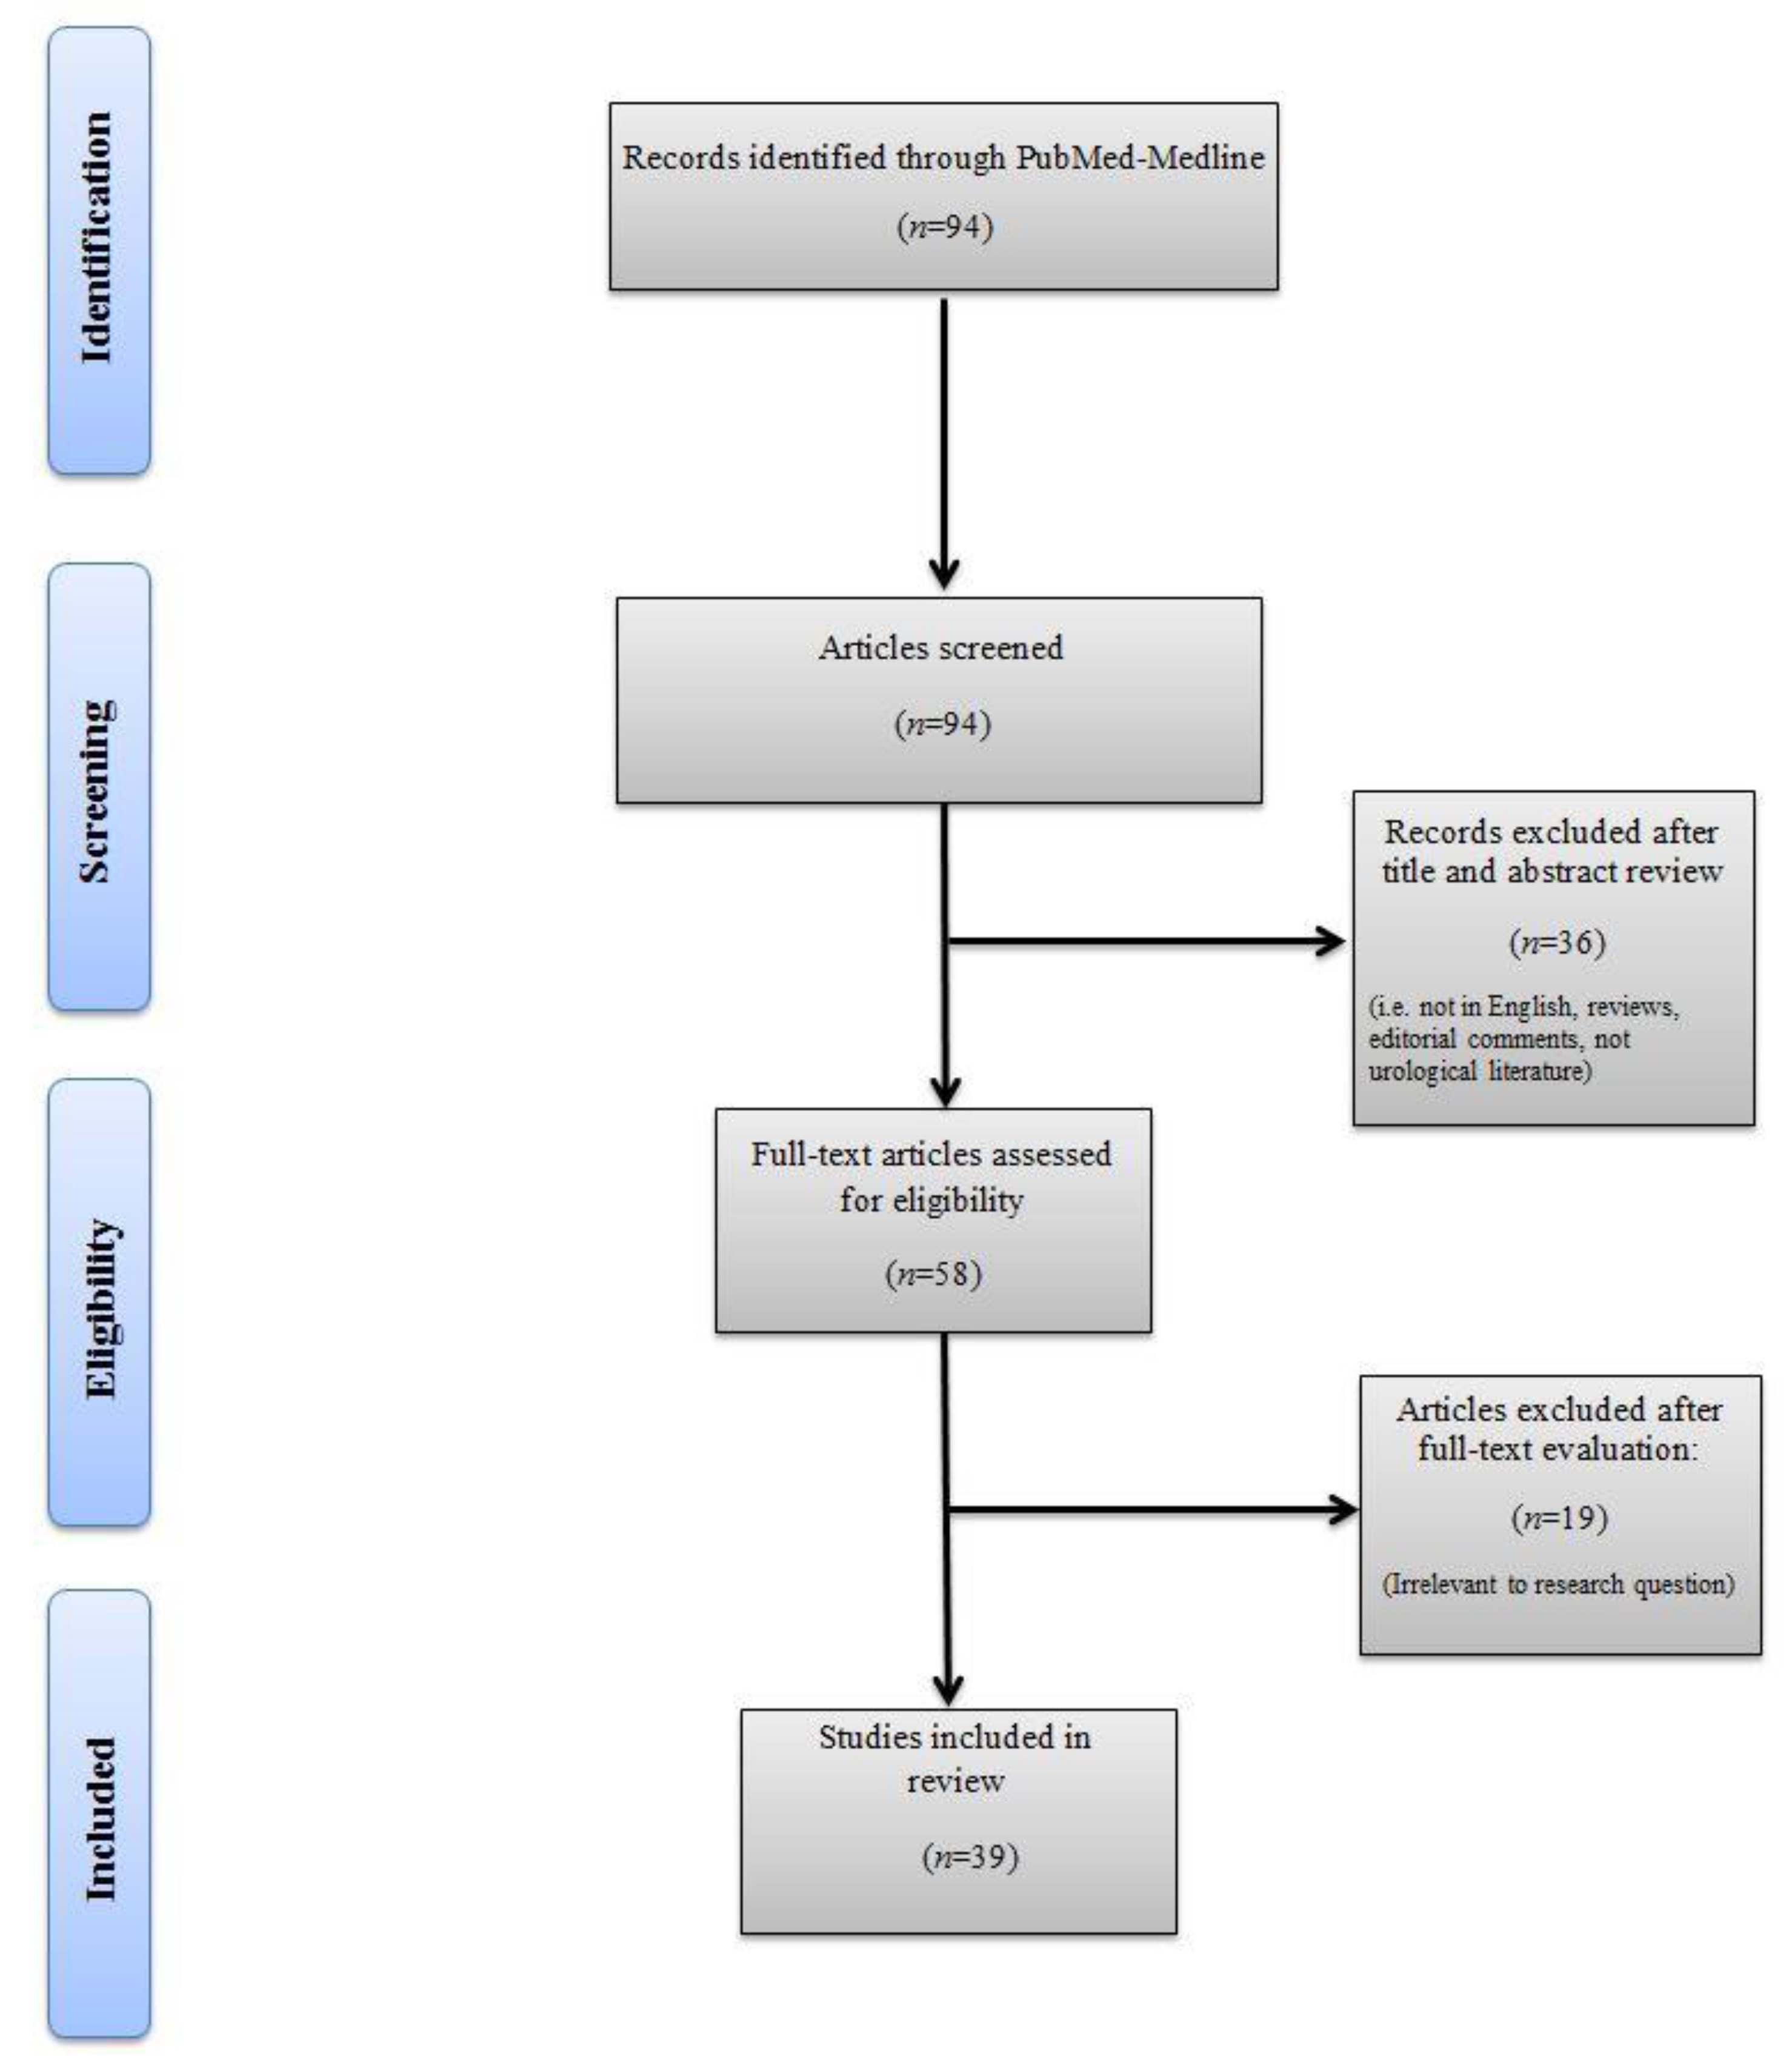
2.2. Literature Search
2.3. Inclusion and Exclusion Criteria
2.4. Data Extraction and Quality Assessment
3. Results
3.1. Characteristics of Included Studies
3.2. Renal Mass Differentiation
3.2.1. Benign vs. Malignant Renal Masses
3.2.2. Angiomyolipoma (AMLwvf) vs. RCC Subtypes
3.2.3. Oncocytoma vs. RCC Subtypes
3.2.4. RCC Subtype Differentiation
3.3. Nuclear Grade Prediction
3.4. Gene Expression-Based Molecular Biomarkers
3.5. Disease Progression and Patient Outcome Prediction
3.6. Limitations/Challenges of Radiomics
3.7. Future Perspectives
4. Conclusions
Author Contributions
Funding
Acknowledgments
Conflicts of Interest
References
- Ferlay, J.; Colombet, M.; Soerjomataram, I.; Mathers, C.; Parkin, D.M.; Piñeros, M.; et Znaor, A.; Bray, F. Estimating the global cancer incidence and mortality in 2018: GLOBOCAN sources and methods. Int. J. Cancer 2019, 144, 1941–1953. [Google Scholar] [CrossRef] [Green Version]
- Siegel, R.L.; Miller, K.D.; Jemal, A. Cancer statistics, 2019. CA Cancer J. Clin. 2019, 69, 7–34. [Google Scholar] [CrossRef] [PubMed] [Green Version]
- Ursprung, S.; Beer, L.; Bruining, A.; Woitek, R.; Stewart, G.D.; Gallagher, F.A.; Sala, E. Radiomics of computed tomography and magnetic resonance imaging in renal cell carcinoma—a systematic review and meta-analysis. Eur. Radiol. 2020, 1–9. [Google Scholar] [CrossRef] [PubMed] [Green Version]
- Patel, H.D.; Johnson, M.H.; Pierorazio, P.M.; Sozio, S.M.; Sharma, R.; Iyoha, E.; Bass, E.B.; Allaf, M.E. Diagnostic accuracy and risks of biopsy in the diagnosis of a renal mass suspicious for localized renal cell carcinoma: Systematic review of the literature. J. Urol. 2016, 195, 1340–1347. [Google Scholar] [CrossRef] [PubMed] [Green Version]
- Marconi, L.; Dabestani, S.; Lam, T.B.; Hofmann, F.; Stewart, F.; Norrie, J.; Bex, A.; Bensalah, K.; Canfield, S.E.; Hora, M.; et al. Systematic review and meta-analysis of diagnostic accuracy of percutaneous renal tumour biopsy. Eur. Urol. 2016, 69, 660–673. [Google Scholar] [CrossRef]
- Defortescu, G.; Cornu, J.N.; Béjar, S.; Giwerc, A.; Gobet, F.; Werquin, C.; Pfister, C.; Nouhaud, F.X. Diagnostic performance of contrast-enhanced ultrasonography and magnetic resonance imaging for the assessment of complex renal cysts: A prospective study. Int. J. Urol. 2017, 24, 184–189. [Google Scholar] [CrossRef] [Green Version]
- Karlo, C.A.; Di Paolo, P.L.; Donati, O.F.; Russo, P.; Tickoo, S.; Hricak, H.; Akin, O. Renal cell carcinoma: Role of mr imaging in the assessment of muscular venous branch invasion. Radiology 2013, 267, 454–459. [Google Scholar] [CrossRef]
- Hindman, N.; Ngo, L.; Genega, E.M.; Melamed, J.; Wei, J.; Braza, J.M.; Rofsky, N.M.; Pedrosa, I. Angiomyolipoma with minimal fat: Can it be differentiated from clear cell renal cell carcinoma by using standard MR techniques? Radiology 2012, 265, 468–477. [Google Scholar] [CrossRef]
- Gillies, R.J.; Kinahan, P.E.; Hricak, H. Radiomics Overview Hricak. Radiology 2016, 278, 563–577. [Google Scholar] [CrossRef] [Green Version]
- De Leon, A.D.; Kapur, P.; Pedrosa, I. Radiomics in Kidney Cancer: MR Imaging. Magn. Reson. Imaging Clin. N. Am. 2019, 27, 1–13. [Google Scholar] [CrossRef]
- Hollingsworth, J.M.; Miller, D.C.; Daignault, S.; Hollenbeck, B.K. Rising incidence of small renal masses: A need to reassess treatment effect. J. Natl. Cancer Inst. 2006, 98, 1331–1334. [Google Scholar] [CrossRef] [PubMed]
- Pierorazio, P.M.; Johnson, M.H.; Patel, H.D.; Sozio, S.M.; Sharma, R.; Iyoha, E.; Bass, E.B.; Allaf, M.E. Management of Renal Masses and Localized Renal Cancer: Systematic Review and Meta-Analysis. J. Urol. 2016, 196, 989–999. [Google Scholar] [CrossRef] [PubMed] [Green Version]
- Patel, H.D.; Semerjian, A.; Gupta, M.; Pavlovich, C.P.; Johnson, M.H.; Gorin, M.A.; Allaf, M.E.; Pierorazio, P.M. Surgical removal of renal tumors with low metastatic potential based on clinical radiographic size: A systematic review of the literature. Urol. Oncol. Semin. Orig. Investig. 2019, 37, 519–524. [Google Scholar] [CrossRef]
- Akdogan, B.; Gudeloglu, A.; Inci, K.; Gunay, L.M.; Koni, A.; Ozen, H. Prevalence and predictors of benign lesions in renal masses smaller than 7 cm presumed to be renal cell carcinoma. Clin. Genitourin. Cancer 2012, 10, 121–125. [Google Scholar] [CrossRef] [PubMed]
- Sun, X.Y.; Feng, Q.X.; Xu, X.; Zhang, J.; Zhu, F.P.; Yang, Y.H.; Zhang, Y.D. Radiologic-Radiomic Machine Learning Models for Differentiation of Benign and Malignant Solid Renal Masses: Comparison With Expert-Level Radiologists. Am. J. Roentgenol. 2020, 214, W44–W54. [Google Scholar] [CrossRef] [PubMed]
- Waterhouse, D.J.; Fitzpatrick, C.R.M.; Pogue, B.W.; O’Connor, J.P.B.; Bohndiek, S.E. A roadmap for the clinical implementation of optical-imaging biomarkers. Nat. Biomed. Eng. 2019, 3, 339–353. [Google Scholar] [CrossRef]
- Kunapuli, G.; Varghese, B.A.; Ganapathy, P.; Desai, B.; Cen, S.; Aron, M.; Gill, I.; Duddalwar, V. A Decision-Support Tool for Renal Mass Classification. J. Digit. Imaging 2018, 31, 929–939. [Google Scholar] [CrossRef]
- Erdim, C.; Yardimci, A.H.; Bektas, C.T.; Kocak, B.; Koca, S.B.; Demir, H.; Kilickesmez, O. Prediction of Benign and Malignant Solid Renal Masses: Machine Learning-Based CT Texture Analysis. Acad. Radiol. 2020, 2020, 1–8. [Google Scholar] [CrossRef]
- Xi, I.L.; Zhao, Y.; Wang, R.; Chang, M.; Purkayastha, S.; Chang, K.; Huang, R.Y.; Silva, A.C.; Vallieres, M.; Habibollahi, P.; et al. Deep learning to distinguish benign from malignant renal lesions based on routine MR imaging. Clin. Cancer Res. 2020. [Google Scholar] [CrossRef] [PubMed]
- Yan, L.; Liu, Z.; Wang, G.; Huang, Y.; Liu, Y.; Yu, Y.; Liang, C. Angiomyolipoma with Minimal Fat: Differentiation From Clear Cell Renal Cell Carcinoma and Papillary Renal Cell Carcinoma by Texture Analysis on CT Images. Acad. Radiol. 2015, 22, 1115–1121. [Google Scholar] [CrossRef]
- Feng, Z.; Rong, P.; Cao, P.; Zhou, Q.; Zhu, W.; Yan, Z.; Liu, Q.; Wang, W. Machine learning-based quantitative texture analysis of CT images of small renal masses: Differentiation of angiomyolipoma without visible fat from renal cell carcinoma. Eur. Radiol. 2018, 28, 1625–1633. [Google Scholar] [CrossRef] [PubMed]
- Lee, H.; Hong, H.; Kim, J.; Jung, D.C. Deep feature classification of angiomyolipoma without visible fat and renal cell carcinoma in abdominal contrast-enhanced CT images with texture image patches and hand-crafted feature concatenation. Med. Phys. 2018, 45, 1550–1561. [Google Scholar] [CrossRef] [PubMed]
- Cui, E.M.; Lin, F.; Li, Q.; Li, R.G.; Chen, X.M.; Liu, Z.S.; Long, W.S. Differentiation of renal angiomyolipoma without visible fat from renal cell carcinoma by machine learning based on whole-tumor computed tomography texture features. Acta Radiol. 2019, 60, 1543–1552. [Google Scholar] [CrossRef] [PubMed]
- Yang, R.; Wu, J.; Sun, L.; Lai, S.; Xu, Y.; Liu, X.; Ma, Y.; Zhen, X. Radiomics of small renal masses on multiphasic CT: Accuracy of machine learning–based classification models for the differentiation of renal cell carcinoma and angiomyolipoma without visible fat. Eur. Radiol. 2020, 30, 1254–1263. [Google Scholar] [CrossRef]
- Nie, P.; Yang, G.; Wang, Z.; Yan, L.; Miao, W.; Hao, D.; Wu, J.; Zhao, Y.; Gong, A.; Cui, J.; et al. A CT-based radiomics nomogram for differentiation of renal angiomyolipoma without visible fat from homogeneous clear cell renal cell carcinoma. Eur. Radiol. 2020, 30, 1274–1284. [Google Scholar] [CrossRef]
- Ma, Y.; Cao, F.; Xu, X.; Ma, W. Can whole-tumor radiomics-based CT analysis better differentiate fat-poor angiomyolipoma from clear cell renal cell caricinoma: Compared with conventional CT analysis? Abdom. Radiol. 2020, 1–8. [Google Scholar] [CrossRef]
- Yu, H.S.; Scalera, J.; Khalid, M.; Touret, A.S.; Bloch, N.; Li, B.; Qureshi, M.M.; Soto, J.A.; Anderson, S.W. Texture analysis as a radiomic marker for differentiating renal tumors. Abdom. Radiol. 2017, 42, 2470–2478. [Google Scholar] [CrossRef]
- Coy, H.; Hsieh, K.; Wu, W.; Nagarajan, M.B.; Young, J.; Douek, M.L.; Brown, M.S.; Scalzo, F.; Raman, S.S. Deep learning radiomics: The utility of Google TensorFlowTMInception in classifying clear cell renal cell carcinoma oncocytoma on multiphasic, C.T. Abdom. Radiol. 2019, 44, 2009–2020. [Google Scholar] [CrossRef]
- Li, Y.; Huang, X.; Xia, Y.; Long, L. Value of radiomics in differential diagnosis of chromophobe renal cell carcinoma and renal oncocytoma. Abdom. Radiol. 2019, 1–9. [Google Scholar] [CrossRef] [Green Version]
- Baghdadi, A.; Aldhaam, N.A.; Elsayed, A.S.; Hussein, A.A.; Cavuoto, L.A.; Kauffman, E.; Guru, K.A. Automated differentiation of benign renal oncocytoma and chromophobe renal cell carcinoma on computed tomography using deep learning. BJU Int. 2020, 125, 553–560. [Google Scholar] [CrossRef]
- Li, Z.C.; Zhai, G.; Zhang, J.; Wang, Z.; Liu, G.; Wu, G.Y.; Liang, D.; Zheng, H. Differentiation of clear cell and non-clear cell renal cell carcinomas by all-relevant radiomics features from multiphase CT: A VHL mutation perspective. Eur. Radiol. 2019, 29, 3996–4007. [Google Scholar] [CrossRef] [PubMed]
- Kocak, B.; Yardimci, A.H.; Bektas, C.T.; Turkcanoglu, M.H.; Erdim, C.; Yucetas, U.; Koca, S.B.; Kilickesmez, O.; Kilickesmez, N.O. Textural differences between renal cell carcinoma subtypes: Machine learning-based quantitative computed tomography texture analysis with independent external validation. Eur. J. Radiol. 2018, 107, 149–157. [Google Scholar] [CrossRef] [PubMed]
- Yin, Q.; Hung, S.C.; Rathmell, W.K.; Shen, L.; Wang, L.; Lin, W.; Fielding, J.R.; Khandani, A.H.; Woods, M.E.; Milowsky, M.I.; et al. Integrative radiomics expression predicts molecular subtypes of primary clear cell renal cell carcinoma. Clin. Radiol. 2018, 73, 782–791. [Google Scholar] [CrossRef] [PubMed]
- Han, S.; Hwang, S.I.; Lee, H.J. The Classification of Renal Cancer in 3-Phase CT Images Using a Deep Learning Method. J. Digit. Imaging 2019, 32, 638–643. [Google Scholar] [CrossRef] [Green Version]
- Flum, A.S.; Hamoui, N.; Said, M.A.; Yang, X.J.; Casalino, D.D.; McGuire, B.B.; Perry, K.T.; Nadler, R.B. Update on the Diagnosis and Management of Renal Angiomyolipoma. J. Urol. 2016, 195, 834–846. [Google Scholar] [CrossRef]
- Lim, R.S.; Flood, T.A.; McInnes, M.D.F.; Lavallee, L.T.; Schieda, N. Renal angiomyolipoma without visible fat: Can we make the diagnosis using CT and MRI? Eur. Radiol. 2018, 28, 542–553. [Google Scholar] [CrossRef]
- Van Der Kwast, T.; Perez-Ordoñez, B. Renal oncocytoma, yet another tumour that does not fit in the dualistic benign/malignant paradigm? J. Clin. Pathol. 2007, 60, 585–586. [Google Scholar] [CrossRef] [Green Version]
- Wu, J.; Zhu, Q.; Zhu, W.; Chen, W.; Wang, S. Comparative study of CT appearances in renal oncocytoma and chromophobe renal cell carcinoma. Acta Radiol. 2016, 57, 500–506. [Google Scholar] [CrossRef]
- Ishigami, K.; Jones, A.R.; Dahmoush, L.; Leite, L.V.; Pakalniskis, M.G.; Barloon, T.J. Imaging spectrum of renal oncocytomas: A pictorial review with pathologic correlation. Insights Imaging 2015, 6, 53–64. [Google Scholar] [CrossRef] [Green Version]
- Thurnher, M.; Putz, T.; Rahm, A.; Gander, H.; Ramoner, R.; Bartsch, G.; Höltl, L.; Falkensammer, C. Renal Cell Carcinoma. Handb. Dendritic Cells 2008, 3, 1117–1127. [Google Scholar] [CrossRef]
- Wagener, N.; Edelmann, D.; Benner, A.; Zigeuner, R.; Borgmann, H.; Wolff, I.; Krabbe, L.M.; Musquera, M.; Dell´Oglio, P.; Capitanio, U.; et al. Outcome of papillary versus clear cell renal cell carcinoma varies significantly in non-metastatic disease. PLoS ONE 2017, 12, 1–12. [Google Scholar] [CrossRef] [PubMed] [Green Version]
- Bektas, C.T.; Kocak, B.; Yardimci, A.H.; Turkcanoglu, M.H.; Yucetas, U.; Koca, S.B.; Erdim, C.; Kilickesmez, O. Clear Cell Renal Cell Carcinoma: Machine Learning-Based Quantitative Computed Tomography Texture Analysis for Prediction of Fuhrman Nuclear Grade. Eur. Radiol. 2019, 29, 1153–1163. [Google Scholar] [CrossRef]
- Kocak, B.; Durmaz, E.S.; Ates, E.; Kaya, O.K.; Kilickesmez, O. Unenhanced CT texture analysis of clear cell renal cell carcinomas: A machine learning-based study for predicting histopathologic nuclear grade. Am. J. Roentgenol. 2019, 212, W1–W8. [Google Scholar] [CrossRef] [PubMed]
- Ding, J.; Xing, Z.; Jiang, Z.; Chen, J.; Pan, L.; Qiu, J.; Xing, W. CT-based radiomic model predicts high grade of clear cell renal cell carcinoma. Eur. J. Radiol. 2018, 103, 51–56. [Google Scholar] [CrossRef] [PubMed]
- Shu, J.; Tang, Y.; Cui, J.; Yang, R.; Meng, X.; Cai, Z.; Zhang, J.; Xu, W.; Wen, D.; Yin, H. Clear cell renal cell carcinoma: CT-based radiomics features for the prediction of Fuhrman grade. Eur. J. Radiol. 2018, 109, 8–12. [Google Scholar] [CrossRef]
- Gill, T.S.; Varghese, B.A.; Hwang, D.H.; Cen, S.Y.; Aron, M.; Aron, M.; Duddalwar, V.A. Juxtatumoral perinephric fat analysis in clear cell renal cell carcinoma. Abdom. Radiol. 2019, 44, 1470–1480. [Google Scholar] [CrossRef]
- Goyal, A.; Razik, A.; Kandasamy, D.; Seth, A.; Das, P.; Ganeshan, B.; Sharma, R. Role of MR texture analysis in histological subtyping and grading of renal cell carcinoma: A preliminary study. Abdom. Radiol. 2019, 44, 3336–3349. [Google Scholar] [CrossRef]
- He, X.; Wei, Y.; Zhang, H.; Zhang, T.; Yuan, F.; Huang, Z.; Han, F.; Song, B. Grading of Clear Cell Renal Cell Carcinomas by Using Machine Learning Based on Artificial Neural Networks and Radiomic Signatures Extracted From Multidetector Computed Tomography Images. Acad. Radiol. 2020, 27, 157–168. [Google Scholar] [CrossRef]
- Lin, F.; Cui, E.M.; Lei, Y.; Luo, L.P. CT-based machine learning model to predict the Fuhrman nuclear grade of clear cell renal cell carcinoma. Abdom. Radiol. 2019, 44, 2528–2534. [Google Scholar] [CrossRef]
- Shu, J.; Wen, D.; Xi, Y.; Xia, Y.; Cai, Z.; Xu, W.; Meng, X.; Liu, B.; Yin, H. Clear cell renal cell carcinoma: Machine learning-based computed tomography radiomics analysis for the prediction of WHO/ISUP grade. Eur. J. Radiol. 2019, 121, 108738. [Google Scholar] [CrossRef]
- Sun, X.; Liu, L.; Xu, K.; Li, W.; Huo, Z.; Liu, H.; Shen, T.; Pan, F.; Jiang, Y.; Zhang, M. Prediction of ISUP grading of clear cell renal cell carcinoma using support vector machine model based on CT images. Medicine (Baltimore) 2019, 98, e15022. [Google Scholar] [CrossRef]
- Cui, E.; Li, Z.; Ma, C.; Li, Q.; Lei, Y.; Lan, Y.; Yu, J.; Zhou, Z.; Li, R.; Long, W.; et al. Predicting the ISUP grade of clear cell renal cell carcinoma with multiparametric MR and multiphase CT radiomics. Eur. Radiol. 2020. [Google Scholar] [CrossRef]
- Ghosh, P.; Tamboli, P.; Vikram, R.; Rao, A. Imaging-genomic pipeline for identifying gene mutations using three-dimensional intra-tumor heterogeneity features. J. Med. Imaging 2015, 2, 041009. [Google Scholar] [CrossRef] [PubMed] [Green Version]
- Kocak, B.; Durmaz, E.S.; Ates, E.; Ulusan, M.B. Radiogenomics in Clear Cell Renal Cell Carcinoma: Machine Learning-Based High Dimensional Quantitative CT Texture Analysis in Predicting PBRM1 Mutation Status. AJR Am. J. Roentgenol. 2019, 212, W55–W63. [Google Scholar] [CrossRef]
- Li, P.; Ren, H.; Zhang, Y.; Zhou, Z. Fifteen-gene expression based model predicts the survival of clear cell renal cell carcinoma. Medicine (US) 2018, 97, e11839. [Google Scholar] [CrossRef] [PubMed]
- Park, J.S.; Lee, H.J.; Cho, N.H.; Kim, J.; Jang, W.S.; Heo, J.E.; Ham, W.S. Risk Prediction Tool for Aggressive Tumors in Clinical T1 Stage Clear Cell Renal Cell Carcinoma Using Molecular Biomarkers. Comput. Struct. Biotechnol. J. 2019, 17, 371–377. [Google Scholar] [CrossRef]
- Azuaje, F.; Kim, S.-Y.; Perez Hernandez, D.; Dittmar, G. Connecting Histopathology Imaging and Proteomics in Kidney Cancer through Machine Learning. J. Clin. Med. 2019, 8, 1535. [Google Scholar] [CrossRef] [Green Version]
- Yin, Q.; Hung, S.C.; Wang, L.; Lin, W.; Fielding, J.R.; Rathmell, W.K.; Khandani, A.H.; Woods, M.E.; Milowsky, M.I.; Brooks, S.A.; et al. Associations between Tumor Vascularity, Vascular Endothelial Growth Factor Expression and PET/MRI Radiomic Signatures in Primary Clear-Cell-Renal-Cell-Carcinoma: Proof-of-Concept Study. Sci. Rep. 2017, 7, 1–11. [Google Scholar] [CrossRef] [PubMed]
- Antunes, J.; Viswanath, S.; Rusu, M.; Valls, L.; Hoimes, C.; Avril, N.; Madabhushi, A. Radiomics analysis on FLT-PET/MRI for characterization of early treatment response in renal cell carcinoma: A proof-of-concept study. Transl. Oncol. 2016, 9, 155–162. [Google Scholar] [CrossRef] [PubMed] [Green Version]
- Singh, N.P.; Bapi, R.S.; Vinod, P.K. Machine learning models to predict the progression from early to late stages of papillary renal cell carcinoma. Comput. Biol. Med. 2018, 100, 92–99. [Google Scholar] [CrossRef] [PubMed]
- Tabibu, S.; Vinod, P.K.; Jawahar, C.V. Pan-Renal Cell Carcinoma classification and survival prediction from histopathology images using deep learning. Sci. Rep. 2019, 9, 1–9. [Google Scholar] [CrossRef] [PubMed] [Green Version]
- Kocak, B.; Durmaz, E.S.; Erdim, C.; Ates, E.; Kaya, O.K.; Kilickesmez, O. Radiomics of Renal Masses: Systematic Review of Reproducibility and Validation Strategies. AJR Am. J. Roentgenol. 2020, 214, 129–136. [Google Scholar] [CrossRef] [PubMed]
- Avanzo, M.; Stancanello, J.; El Naqa, I. Beyond Imaging: The Promise of Radiomics. Phys. Med. 2017, 38, 122–139. [Google Scholar] [CrossRef] [PubMed]
- Panth, K.M.; Leijenaar, R.T.H.; Carvalho, S.; Lieuwes, N.G.; Yaromina, A.; Dubois, L.; Lamblin, P. Is there a causal relashionship between genetic changes and radiomics-based image features? An in vivo preclinical experiment with doxycycline inducible GADD34 tumor cells. Radiother. Oncol. 2015, 116, 462–466. [Google Scholar] [CrossRef] [Green Version]
- Napel, S.; Giger, M. Special Section Guest Editorial: Radiomics and Imaging Genomics: Quantitative Imaging for Precision Medicine. J. Med. Imaging 2015, 2, 041001. [Google Scholar] [CrossRef]


| Author | Imaging | Patients | Mean Age | Mean Lesion Diameter (cm) | Radiomics Method | Texture Features | Predicted Outcome Accuracy |
|---|---|---|---|---|---|---|---|
| Benign vs. Malignant Tumor Differentiation | |||||||
| Kunapuli et al. 2018 [17] | Four-phasic CECT | 150 patients | NA | NA | 11 ML-based classifiers | 40 features extracted per phase from all patients (Gray-level histogram, GLCM, GLDM) | Decision support tool for renal mass classification |
| 70 ccRCC | |||||||
| 20 pRCC | |||||||
| 10 chRCC | RFGB methods showed the best performance for dealing with class imbalance, accuracy (0.83) and AUC (0.83) from all 11 methods tested. | ||||||
| 20 AMLvwf | |||||||
| 30 oncocytoma | |||||||
| Sun et al. 2019 [15] | Three-phasic CECT | 290 lesions | ML-based SVM classifiers | 35 features for ccRCC vs. pRCC, 22 features for ccRCC vs. AMLwvf and oncocytoma, 11 features for pRCC/chRCC vs. AMLwvf/oncocytoma | Radiomics ML models for benignvs. malignant tumor differentiation and comparison with expert radiologists | ||
| 190 ccRCC | 59 (23–85) | 4.00 | |||||
| 26 pRCC | 54 (19–76) | 4.16 | |||||
| 38 chRCC | 51 (24–83) | 4.61 | Radiologists performance were as follows: sensitivity 73.7–96.8% and specificity of 48.4–71.9% for differentiating ccRCCs from pRCCs and chrRCCs; sensitivity of 73.7–96.8% and specificity of 52.8–88.9% for differentiating ccRCCs from AMLwvf and oncocytomas; and sensitivity of 28.1–60.9% and specificity of 75.0–88.9% for differentiating pRCCs and chrRCCs from AMLwvf and oncocytomas. Radiomic ML model yielded sensitivity of 90.0%, 86.3%, and 73.4% and specificity of 89.1%, 83.3%, and 91.7%, respectively. | ||||
| 26 AMLwvf | 47 (24–68) | 2.99 | |||||
| 10 oncocytoma | 42 (28–56) | 3.95 | |||||
| Xi et al. 2020 [19] | MRI T2 weighted and T1 post contrast | 1162 renal lesions | NA | NA | Ensemble deep learning model | Images randomly divided into training set of 816 lesions with 408,000 augmented images, validation set of 234 lesions, and test set of 112 lesions. | Deep learning model distinguishing benign tumors from RCC |
| 655 malignant | |||||||
| 507 benign | Compared to four expert radiologists, the ensemble DL model had higher test accuracy (0.70 vs. 0.60, p = 0.053), sensitivity (0.92 vs. 0.80, p = 0.017), and specificity (0.41 vs. 0.35, p = 0.450). | ||||||
| Erdim et al. 2020 [18] | Two-phased CECT | 63 malignant masses | 57.2 ± 12.6 | 5.84 ± 3.3 | Eight ML-based algorithms for model development | 198 features from unenhanced phase and 24 from CMP | ML prediction of benign and malignant renal masses |
| 25 ccRCC | The accuracy and AUC were 90.5% and 0.915, respectively. After eliminating the highly collinear features from the analysis, the accuracy and AUC values slightly increased to 91.7% and 0.916, respectively. | ||||||
| 23 pRCC | |||||||
| 15 chRCC | |||||||
| 21 benign | 54.9 ± 15.5 | 3.6 ± 1.4 | |||||
| 11 AMLwvf | |||||||
| 10 oncocytoma | |||||||
| Angiomyolipoma without visible fat (AMLwvf) vs. RCC subtypes | |||||||
| Yan et al. 2015 [20] | Three-phasic CECT | Pathologically proven: | ANN classifier | Image histogram, gradient, GLRL matrix, autoregressive model and wavelet transform | Differentiation between AMLwvf, ccRCC and pRCC | ||
| 18 AML | 44.5 (26–61) | 2.85 (range, 0.8–5.1) | Excellent classification results (0% to 9.3% error) were obtained for all three groups, independently of CT phase used. Unenhanced phase showed better trend for classification. | ||||
| 18 ccRCC | 53.9 (36–79) | 3.3 (range, 1.5–4.9) | |||||
| 14 pRCC | 57.6 (34–77) | 3.3 (range, 1.4–5.1) | |||||
| Feng et al. 2018 [21] | Three-phasic CECT | 58 SRM patients: | ML-based SMV classifier for quantitative texture analysis | Image histogram and GLCM | Differentiating AMLwvf from ccRCC | ||
| 41 ccRCC | 56.2 ± 12.3 | 3.2 ± 0.7 | SMV classifier discriminated between AMLwvf and ccRCC with accuracy, sensitivity, specificity and AUC of 93.9%, 87.8%, 100% and 0.955, respectively. | ||||
| 17 AMLwvf | 48.7 ± 10.8 | 2.8 ± 0.9 | |||||
| Lee et al. 2018 [22] | CECT | 41 ccRCC | NA | NA | Deep feature classification with CNN and ML-classifiers | - Hand-crafted texture and shape features | Deep feature classification of AMLwvf and ccRCC |
| 39 AMLwvf | - Deep feature extraction | Improved texture features enhance AMLwvf and ccRCC differentiation. | |||||
| Cui et al. 2019 [23] | Three-phasic CECT | 171 pathologically proven renal masses | NA | ML-based SMV established differentiation classifiers | Shape, GLCM, GLRL matrix, gray-level-size zone matrix, gray-tone difference matrix, and gray-level-dependence matrix | Differentiation of AMLwvf from all RCC subtypes | |
| 82 ccRCC | 55.3 ± 11.6 | Differentiating AML from all-RCC (AUC = 0.96) and ccRCC (AUC = 0.97) was higher than AML from non-ccRCC (AUC = 0.89). Radiologists´ interpretation achieved lower performance differentiating AML from all-RCC (AUC= 0.067), ccRCC (AUC = 0.68), and non-ccRCC (AUC = 0.64). | |||||
| 22 pRCC | 49.3 ± 12.9 | ||||||
| 26 chRCC | 55.0 ± 11.8 | ||||||
| 41 AMLwvf | 48.6 ± 12.9 | ||||||
| Yang et al. 2019 [24] | Four-phasic CECT | 163 SRM patients | (median, IQR) | ML-based SMV, LR and RF classifiers | Extracted features: 1. shape, 2. histogram analysis, and 3. texture features | Differentiation of AMLwvf from RCC subtypes | |
| 95 ccRCC | Features extracted from unenhanced phase are sufficient to generate accurate differentiation between AMLwvf and RCC using ML-based classification model. Two models achieved classification AUC of 0.90. | ||||||
| 10 pRCC | 52.9 ± 13.1 | 2.9 (2.5, 3.3) | |||||
| 13 chRCC | |||||||
| 45 AMLwvf | 48.6 ± 13.7 | 2.5 (2.1, 3.3) | |||||
| Nie et al. 2019 [25] | Four-phasic CECT | 63 ccRCC | 58.6 ± 11.5 | 2.2 (0.8–8.8) | Radiomics feature extraction for signature and nomogram | - Fourteen texture features built radiomics signature | Differentiating ccRCC from AMLwvf |
| 36 AMLwvf | 50.1 ± 8.3 | 2.7 (1.3–6.2) | - Rad-score/clinical factors for nomogram | Decision curve analysis demonstrated the nomogram outperformed the clinical factors model and radiomics signature in terms of clinical usefulness. | |||
| Ma et al. 2020 [26] | Three-phasic CECT | 62 ccRCC | 57.9 ± 10.8 | 3.7 ± 1.6 | Four radiomics logistic classifiers | Radiomics feature parameters: Histogram, texture, form factor, GLCM and RLM | Differentiating ccRCC from AMLwvf |
| 22 AMLwvf | 50.5 ± 12.8 | 3.2 ± 0.9 | Whole-tumor radiomics-based CT analysis was superior to conventional CT analysis. Cyst degeneration, pseudocapsule, and sum rad-score were the most significant factors. Unenhanced phase radiomics showed higher AUC than CMP and NP groups. | ||||
| Oncocytoma vs. RCC Subtypes | |||||||
| Yu et al. 2017 [27] | Two-phasic CECT | 119 RCC patients | NA | NA | CT TA with ML-based SVM classifier | 43 texture features extracted from renal tumor segments: 14 histogram-based, 5 GLCM, 11 GLRL, 4 GLGM, and 9 Laws’ features. | Oncocytomavs. RCC subtypes |
| Excellent tumor discriminators were identified with AUC of 0.91 and 0.93 (p < 0.0001) respectively for differentiating ccRCC from oncocytoma. AUC of 0.99 (p < 0.0001) for differentiating pRCC from oncocytoma and an AUC of 0.92 for differentiating oncocytoma from other tumors. The ability of ML to distinguish ccRCC from other tumors and pRCC from other tumors showed AUC of 0.91 and 0.92, respectively. | |||||||
| Coy et al. 2019 [28] | Four-phase CECT | 128 ccRCC | 62 (22–91) | 3.8 (0.8–14.6) | ANN trained with 4000 iterations | ML-based texture extraction | Oncocytomavs. ccRCC |
| 51 oncocytoma | 69 (38–87) | 3.9 (1.0–13.1) | Excretory phase of entire tumor volume achieved highest 74.4% accuracy, 85.8% sensitivity and 80.1% PPV. When combined with tumor mid-slices of all phases then PPV was 82.5%. | ||||
| Li et al. 2019 [29] | Four-phase CECT | 44 chRCC | 50.8 (22–79) | NA | Five ML-based classifiers (kNN, SVM, RF, LR, MLP) | - Intensity statistics: peak value, mean value and variance | Chromophobe RCCvs. oncocytoma |
| - Shape features: Volume, surface area, spherical value | All five classifiers had good diagnostic performance, with AUC values greater than 0.85. SVM classifier showed the highest diagnostic accuracy with 0.945. | ||||||
| 17 oncocytoma | 54.9 (35–79) | - Texture features: GLRL and size matrices | Accurate preoperative differential diagnosis of chRCC and oncocytoma can be facilitated by a combination of CT enhanced quantitative features and ML. | ||||
| Baghdadi et al. 2020 [30] | Three-phasic CECT | 212 renal masses from 192 patients | NA | NA | CNNs deep-learning structure based on TensorFlow | Semi-automated tumor-to-cortex peak early-phase enhancement ratio (PEER) | Chromophobe RCCvs. oncocytoma |
| PEER evaluation achieved 95% accuracy in tumor type classification (100% sensitivity and 89% specificity) compared to the final pathology results. | |||||||
| RCC Subtype Differentiation | |||||||
| Li et al. 2018 [31] | Three-phasic CECT | Training: - 170 patients | 58.5 (21–84) | NA | ML-based RF classifier | For each tumor 156 texture features extracted from triphasic CECT | Differentiation of clear cell and non-clear cell RCC and radiomics link to VHL gene mutation |
| Validation: - 85 patients | 58.9 (33–81) | ||||||
| 255 in total | |||||||
| 118 ccRCC | Eight all-relevant features from CMP were selected. Model showed AUC of 0.95 and an accuracy of 92.9% in the validation cohort. Five out of eight all-relevant features were significantly associated with VHL mutation. | ||||||
| 36 pRCC | |||||||
| 31 chRCC | |||||||
| Kocak et al. 2018 [32] | Three-phasic CECT | 68 RCC patients | 5.9 (3.3–8.1) | 5.9 (2.0–12.3) | ANN and ML-based SVM classifiers | 275 texture features extracted: | Distinguishing the three main RCC subtypes |
| 48 ccRCC | ANN discrimination of non-ccRCC from ccRCC subtypes with an external validation accuracy, sensitivity, and specificity of 84.6%, 69.2%, and 100%, respectively. | ||||||
| 13 pRCC | SVM discrimination of pRCC from other RCC subtypes with an external validation accuracy, sensitivity, and specificity of 69.2%, 71.4%, and 100%, respectively. | ||||||
| 7 chRCC | |||||||
| Yin et al. 2018 [33] | PET/MRI | 23 specimens from 8 primary ccRCC | NA | NA | Sparse and generalized partial least squares discriminant analysis | 168 radiomics features for each tumor | ccRCC molecular subtype prediction |
| The correct classification rate (CCR) for molecular subtype classification using only radiomics features was 86.96%. When combining messenger RNA (mRNA), microvascular density, and clinical parameters from each specimen with radiomics features the best CCR was 95.65%. | |||||||
| Han et al. 2019 [34] | Three-phasic CECT | 169 patients | NA | NA | GoogLeNet CNN | ROI selection in each phase image | Distinguishing the three main RCC subtypes |
| 57 ccRCC | |||||||
| 56 pRCC | When compared to a biopsy-proven dataset, CNN showed 0.85 accuracy, 0.64–0.98 sensitivity, 0.83–0.93 specificity, and 0.90 AUC. | ||||||
| 56 chRCC | |||||||
| Author | Imaging | Patients | Mean Age | Mean Lesion Diameter (cm) | Method | Texture Features | Predicted Outcome Accuracy |
|---|---|---|---|---|---|---|---|
| Bektas et al. 2018 [42] | Single-pase CECT | 23 high-grade | 59 (35–81) | 5.0 (range 1.6–14.5) | ML-based SMV, MLP, naïve Bayes, k-nearest neighbors, and random forest classifiers for quantitative two-dimensional (2D) TA | Histogram, gradient, GRLM, and autoregressive model | High-grade (Fuhrman 3–4) tumor detection |
| 31 low-grade | SMV model predicted high-grade pathology with 85.1% overall accuracy, 91.3% sensitivity, 80.6% specificity, and AUC of 0.860. | ||||||
| Ding et al. 2018 [44] | Three-phasic CECT | Training: 74 low-grade | 59.5 (50–65) | NA | ML-based LASSO to select features and build a texture-score | Histogram, GLCOM, and GRLM | Detection of high-grade (Fuhrman 3–4) and prediction models |
| 40 high-grade | 62 (52–68) | Training cohort | |||||
| Validation: 71 low-grade | 58 (52–65) | Texture-score AUC 0.843 (0.765–0.920). Non-TA features (round mass, diameter, artery tumor, relative tumor enhancement value) were compared to TA features and round mass was similar (AUC: 0.723 (0.632–0.803)). Prediction model including both texture and non-texture features did not outperform that including solely TA features in both cohorts. | |||||
| 21 high-grade | 59 (47–64) | ||||||
| Shu et al. 2018 [45] | Three-phasic CECT | 161 low-grade | 55.8 ± 10.7 | 4.8 ± 1.6 | LASSO for feature selection. Models built by LR | First-order statistics, shape, GLCOM, GRLM, and gray-level size zone matrix. | High-grade (Fuhrman 3–4) tumor prediction |
| 99 high-grade | 59.3 ± 10.8 | 6.3 ± 2.1 | Three models were created using features from CMP, NP, or CMP + NP. CMP model’s accuracy was 71.9%, AUC 0.766 (0.709–0.816), sensitivity 0.602, and specificity 0.838; NP model’s accuracy was 73.8%, AUC 0.818 (0.765–0.838), sensitivity 0.693, and specificity 0.838; and CMP + NP model’s accuracy was 77.7%, AUC 0.822 (0.769–0.866), sensitivity 0.677, and specificity 0.839. The CMP + NP model’s AUC was significantly higher than that of CMP alone and all other AUCs were similar between them. | ||||
| Gill et al. 2019 [46] | Four-phasic CECT | 54 low-grade | 61.5 | 3.40 ± 1.80 | Radiomics panel of tissue characterization | Histogram analysis, GLCOM, gray-level difference matrix, 2D Fourier-transform analysis, and spectral analysis | Differentiating juxtatumoral perinephric fat of high-grade (ISUP 3–4)vs. low-grade (ISUP 1–2) |
| 30 high-grade (ISUP) | 61.7 | 4.33 ± 2.24 | All TA methods but gray-level difference matrix showed differences and increased heterogeneity index in high-grade juxtatumoral perinephric fat.The measure of correlation coefficient form GLCOM had the best accuracy (AUC 0.746 (0.63–0.86)). | ||||
| Goyal et al. 2019 [47] | Multi-phasic MRI | 19 low-grade | 50.3 (including 5 non-ccRCC) | 6.63 ± 3.2 (including 5 non-ccRCC) | ML-based TexRAD arranging according to size in SSF | Filtration histogram. | High-grade (Fuhrman 3–4) tumor detection |
| 10 high-grade | The best performance was found in Entropy (at SSF 6 on diffusion-weighted image) AUC: 0823 (0.618–1.0), mean (at SSF 3 on CMP) AUC: 0.889 (0.655–1.9), and mean of positive pixels (at SSF 5 on NP) AUC: 0.870 (0.712–1.0) | ||||||
| He et al. 2019 [48] | Three-phasic CECT | 136 low-grade | 57.3 ± 12.9 | NA | ML-based on ANN fed with radiomics signatures prediction models | Gray-level histogram, GLCOM, GRLM, histogram of oriented gradient, wavelet transformations, and autoregressive models | Prediction accuracy of high-grade (ISUP 3–4) tumors by 5 TA-based models |
| 91 high-grade (ISUP) | Five models based on features with the best performance had a predictive mean value of 92.46% ± 1.83%. The top-ranked model was a combination of minimum mean squared error of conventional image features and CMP phase (94.06% ± 1.14%) | ||||||
| Kocak et al. 2019 [43] | NECT | 25 low-grade | 62 | 7.59 (range 2.5–16.4) | ANN and binary LR with and without SMOTE | First order, GLDM, GLCOM, GRLM, gray-level size zone matrix, neighboring gray-tone difference matrix, and wavelet-based features | High-grade (Fuhrman 3–4) tumor detection |
| 56 high-grade (Fuhrman) | The ANN algorithm (based on 5 TA features) outperformed that of logistic regression (based on 6 features). ANN algorithm detected 81.5% of high-grade tumors accurately (AUC: 0.714). | ||||||
| Lin et al. 2019 [49] | Three-phasic CECT | 189 low-grade | 54.9 ± 11.9 | NA | ML-based CatBoost | First-order, shape, GLCOM, GRLM, gray-level size zone matrix, and GLDM features. | High-grade (Fuhrman 3–4) tumor detection |
| 43 high-grade (Fuhrman) | 53.1 ± 12.6 | The ML model based on three-phase CT images detected high-grade tumors with an AUC 0.87, outperforming those based on single-phase images. | |||||
| Shu et al. 2019 [50] | Three-phasic CECT | 164 low-grade | 57.3 ± 10.9 | 4.7 ± 1.5 | LASSO for feature selection. The k-nearest neighbor, LR, MLP, random forest, and SVM as ML-based classifiers | First-order statistics, shape, GLCOM, GRLM, and gray-level size zone matrix. | High-grade (ISUP 3–4) tumor prediction |
| 107 high-grade (ISUP) | 6.2 ± 2.0 | The best model was achieved by the combined classifier (CMP + NP features) with 91.7%–93.5% accuracy and an AUC of 0.96–0.98 in the validation cohort compared to the training cohort with 86.5%–90.8% accuracy and an AUC of 0.95–0.97. | |||||
| Sun et al. 2019 [51] | Three-phasic CECT | 155 low-grade | 53 (47–62) | NA | ML-based SMV. Variant selection and LASSO for feature selection | First-order statistics, shape and size, GRLM, GLCOM, and higher-order statistics (from wavelet transformation) | High-grade (ISUP 3–4) tumor prediction |
| 72 high-grade (ISUP) | 57 (51–65) | A model combining features of both phases (CMP and NP) with SMV classifier achieved best performance in the training and validation datasets, with an AUC of 0.88 (0.77–0.95; sensitivity 0.85 and specificity 0.89) and 0.91 (0.65–0.99, sensitivity 0.83 and specificity 0.89), respectively. | |||||
| Cui et al. 2020 [52] | Three-phasic CECT and multiphasic MRI | Internal cohort: 347 CTE, 93 MRI, 284 low-grade | 44.4 (28–88) | NA | ML-based CatBoost | First order features, shape features, GLCOM, GLDM, gray-tone difference matrix, GRLM, gray-level size-zone matrix | Comparison between CECT- and MR-based high-grade (ISUP 3–4) prediction |
| 156 high-grade | 57.4 (24–85) | MRI ML-TA accuracy did not outperform that of CT either in the internal (79% vs. 73%) or in the external (69% vs. 74%) cohorts’ datasets. | |||||
| External cohort:20 CECT + MRI, 10 low-grade | 54.3 (38–70) | High-grade accuracy prediction and external validation | |||||
| 10 high-grade (ISUP) | 60.8 (42–76) | CECT and MRI multiphase TA improved accuracy prediction 2–10% compared to single-phase. Similar results between cohort datasets were reported. |
| Author | Source | Patients | Mean Age | Method | Biomarker(s) | Texture Features | Predicted Outcome Accuracy |
|---|---|---|---|---|---|---|---|
| Ghosh et al. 2015 [53] | Four-phasic CECT | 14 ccRCC BAP1-mutant and 64 non-mutant | NA | Image-genomics pipeline. Texture features from 3D-tumor images. Random forest classifiers. Data from TCGA | BAP1 | Histogram, Haralick, GRLM, GLCOM, mean gray-level intensity | Prediction of BAP1 mutation status by ML-based 3D-TA |
| Best rated model was that based on NP, with an AUC of 0.71. | |||||||
| Kocak et al. 2018 [54] | CMP of CECT | 16 ccRCC mutant PBRM1 and 29 non-mutant. (12 low- and 33 high-grade) | 60 | ANN and ML-based TA from images using random forest classifiers. Data from TCGA | PBRM1 | Firs-order, GLDM, GLCOM, GRLM, gray-level size zone matrix, neighbor gray-tone difference matrix, and wavelet-based features. | Prediction of PBRM1 mutation status by ANN and ML-based TA |
| ANN algorithm’s accuracy: 88.2%; AUC: 0.925. The random forest model’s accuracy: 95%; AUC: 0.987. | |||||||
| Li et al. 2018 [55] | Genes expression panel | 533 ccRCC | NA | Genes whose expression was associated with OS were selected and downsized by RF variable selection, then were categorized as high/low risk groups according mean genes’ expression | COL7A1, ARFGAP1, BRD9, MC1R, ATP13A1, POFUT2, OTOF, ANAPC5, CDCA3, IL20RB, CDC7, FBXO3, ZIC2, KL and CCDC137 | None | Correlation between genes’ expression-based risk score and OS |
| Low-risk group had better prognosis and recurrence-free survival. AUC for the risk score and 3-year OS was 0.784 | |||||||
| Park et al. 2019 [56] | cDNA extracted from paraffin-embedded tumor tissue | 40 aggressive t1 ccRCC | 58.0 ± 11.3 | Complementary DNA (cDNA) extracted from paraffin-embedded tumor samples. Genes whose expression was different in aggressiveness were IHQ stained. DNN and LR model algorithms | FOXC2, CLIP4, PBRM1, BAP1, SETD2, and KDM5C | None | Association of biomarkers with aggressiveness |
| 137 non-aggressive T1 ccRCC | 58.7 ± 11.8 | Lower FOXC2, PBRM1, and BAP1 expression was associated with aggressiveness. DNN model’s accuracy based on gene expression was: 0.537 (AUC: 0.736), and LR: 0.555 (AUC: 0.651). Accuracy was significantly increased by adding IHQ data: DNN 0.852 (AUC: 0.796); LR: 0.759 (AUC: 0.760) | |||||
| Azuaje et al. 2019 [57] | Histopathology and proteomics | 110 proteomics 524 histology | Proteomics- and histology-based ML models. RF for proteomics data and DL for histology images data | NA | Raw pixel intensity data from thumbnails of whole slides | Modelaccuracy detectingccRCC | |
| Proteomic-based model’s accuracy 0.98, sensitivity and specificity of 0.97 and 0.99, respectively. Histology-based model’s prediction 0.95, sensitivity and specificity of 1 and 0.93, respectively. | |||||||
| Yin et al. 2017 [58] | PET-FDG/MRI | 9 ccRCC | NA | Analysis of sparse canonical correlation | VEGF expression and MVD | SUV, spatiotemporal association and texture features | Correlation between vascularity and radiomics features |
| PET/MRI combination had the strongest correlation to MVD. No association of VEGF expression and radiomic features. |
| Author | Source | Patients | Method | Features | Predicted Outcome Accuracy |
|---|---|---|---|---|---|
| Antunes et al. 2016 [59] | PET -FLT and multiphase MRI | 2 patients with advanced ccRCC | Radiomics analysis of test/retest images | First- and second-order statistical features, ADC Haralick, entropy and difference average features. | Detection of changes in test/retest images after 3 weeks of sunitinib in metastatic RCC. |
| Low variability between test/re-test images. SUV, ADC energy, and T2-weigthed average differences were found, and these might be able to detect early structural and functional changes in response to treatment. | |||||
| Singh et al. 2018 [60] | RNA sequencing and microarray dataset form from GDC | 32 normal 289 pRCC: | ML-based algorithms with random forest, naïve Bayes, SVM, KNN, and shrunken centroid classifier | Upregulated and downregulated genes. | Prediction of progression between early (I–II) and late (III–IV) pRCC stages |
| 172 stage I | Gene expression alone discriminated between normal tissue and tumor, and between early and late stage samples by means of PCA. For most features selected, accuracy ranged from 82.5–88%, PR-AUC 0.69–0.79, and MCC 0.60–0-68 | ||||
| 22 stage II | |||||
| 51 stage III | |||||
| 15 stage IV | |||||
| Tabibu et al. 2019 [61] | Histopathology slides from TCGA | 1027 ccRCC | CNN model to develop a risk index using LASSO | Tumor and nuclei shape features (area, perimeter, etc.) from tumor region | Survival probability between high and low grade |
| 303 pRCC | Samples were dichotomized in high- and low grade according the risk score constructed form tumor and nuclei features. High-grade group was associated with a lower survival rate (p = 3.86 × 10⁻⁶) | ||||
| 254 chRCC |
© 2020 by the authors. Licensee MDPI, Basel, Switzerland. This article is an open access article distributed under the terms and conditions of the Creative Commons Attribution (CC BY) license (http://creativecommons.org/licenses/by/4.0/).
Share and Cite
Suarez-Ibarrola, R.; Basulto-Martinez, M.; Heinze, A.; Gratzke, C.; Miernik, A. Radiomics Applications in Renal Tumor Assessment: A Comprehensive Review of the Literature. Cancers 2020, 12, 1387. https://doi.org/10.3390/cancers12061387
Suarez-Ibarrola R, Basulto-Martinez M, Heinze A, Gratzke C, Miernik A. Radiomics Applications in Renal Tumor Assessment: A Comprehensive Review of the Literature. Cancers. 2020; 12(6):1387. https://doi.org/10.3390/cancers12061387
Chicago/Turabian StyleSuarez-Ibarrola, Rodrigo, Mario Basulto-Martinez, Alexander Heinze, Christian Gratzke, and Arkadiusz Miernik. 2020. "Radiomics Applications in Renal Tumor Assessment: A Comprehensive Review of the Literature" Cancers 12, no. 6: 1387. https://doi.org/10.3390/cancers12061387