LINC00261 Is Differentially Expressed in Pancreatic Cancer Subtypes and Regulates a Pro-Epithelial Cell Identity

 , and
, and 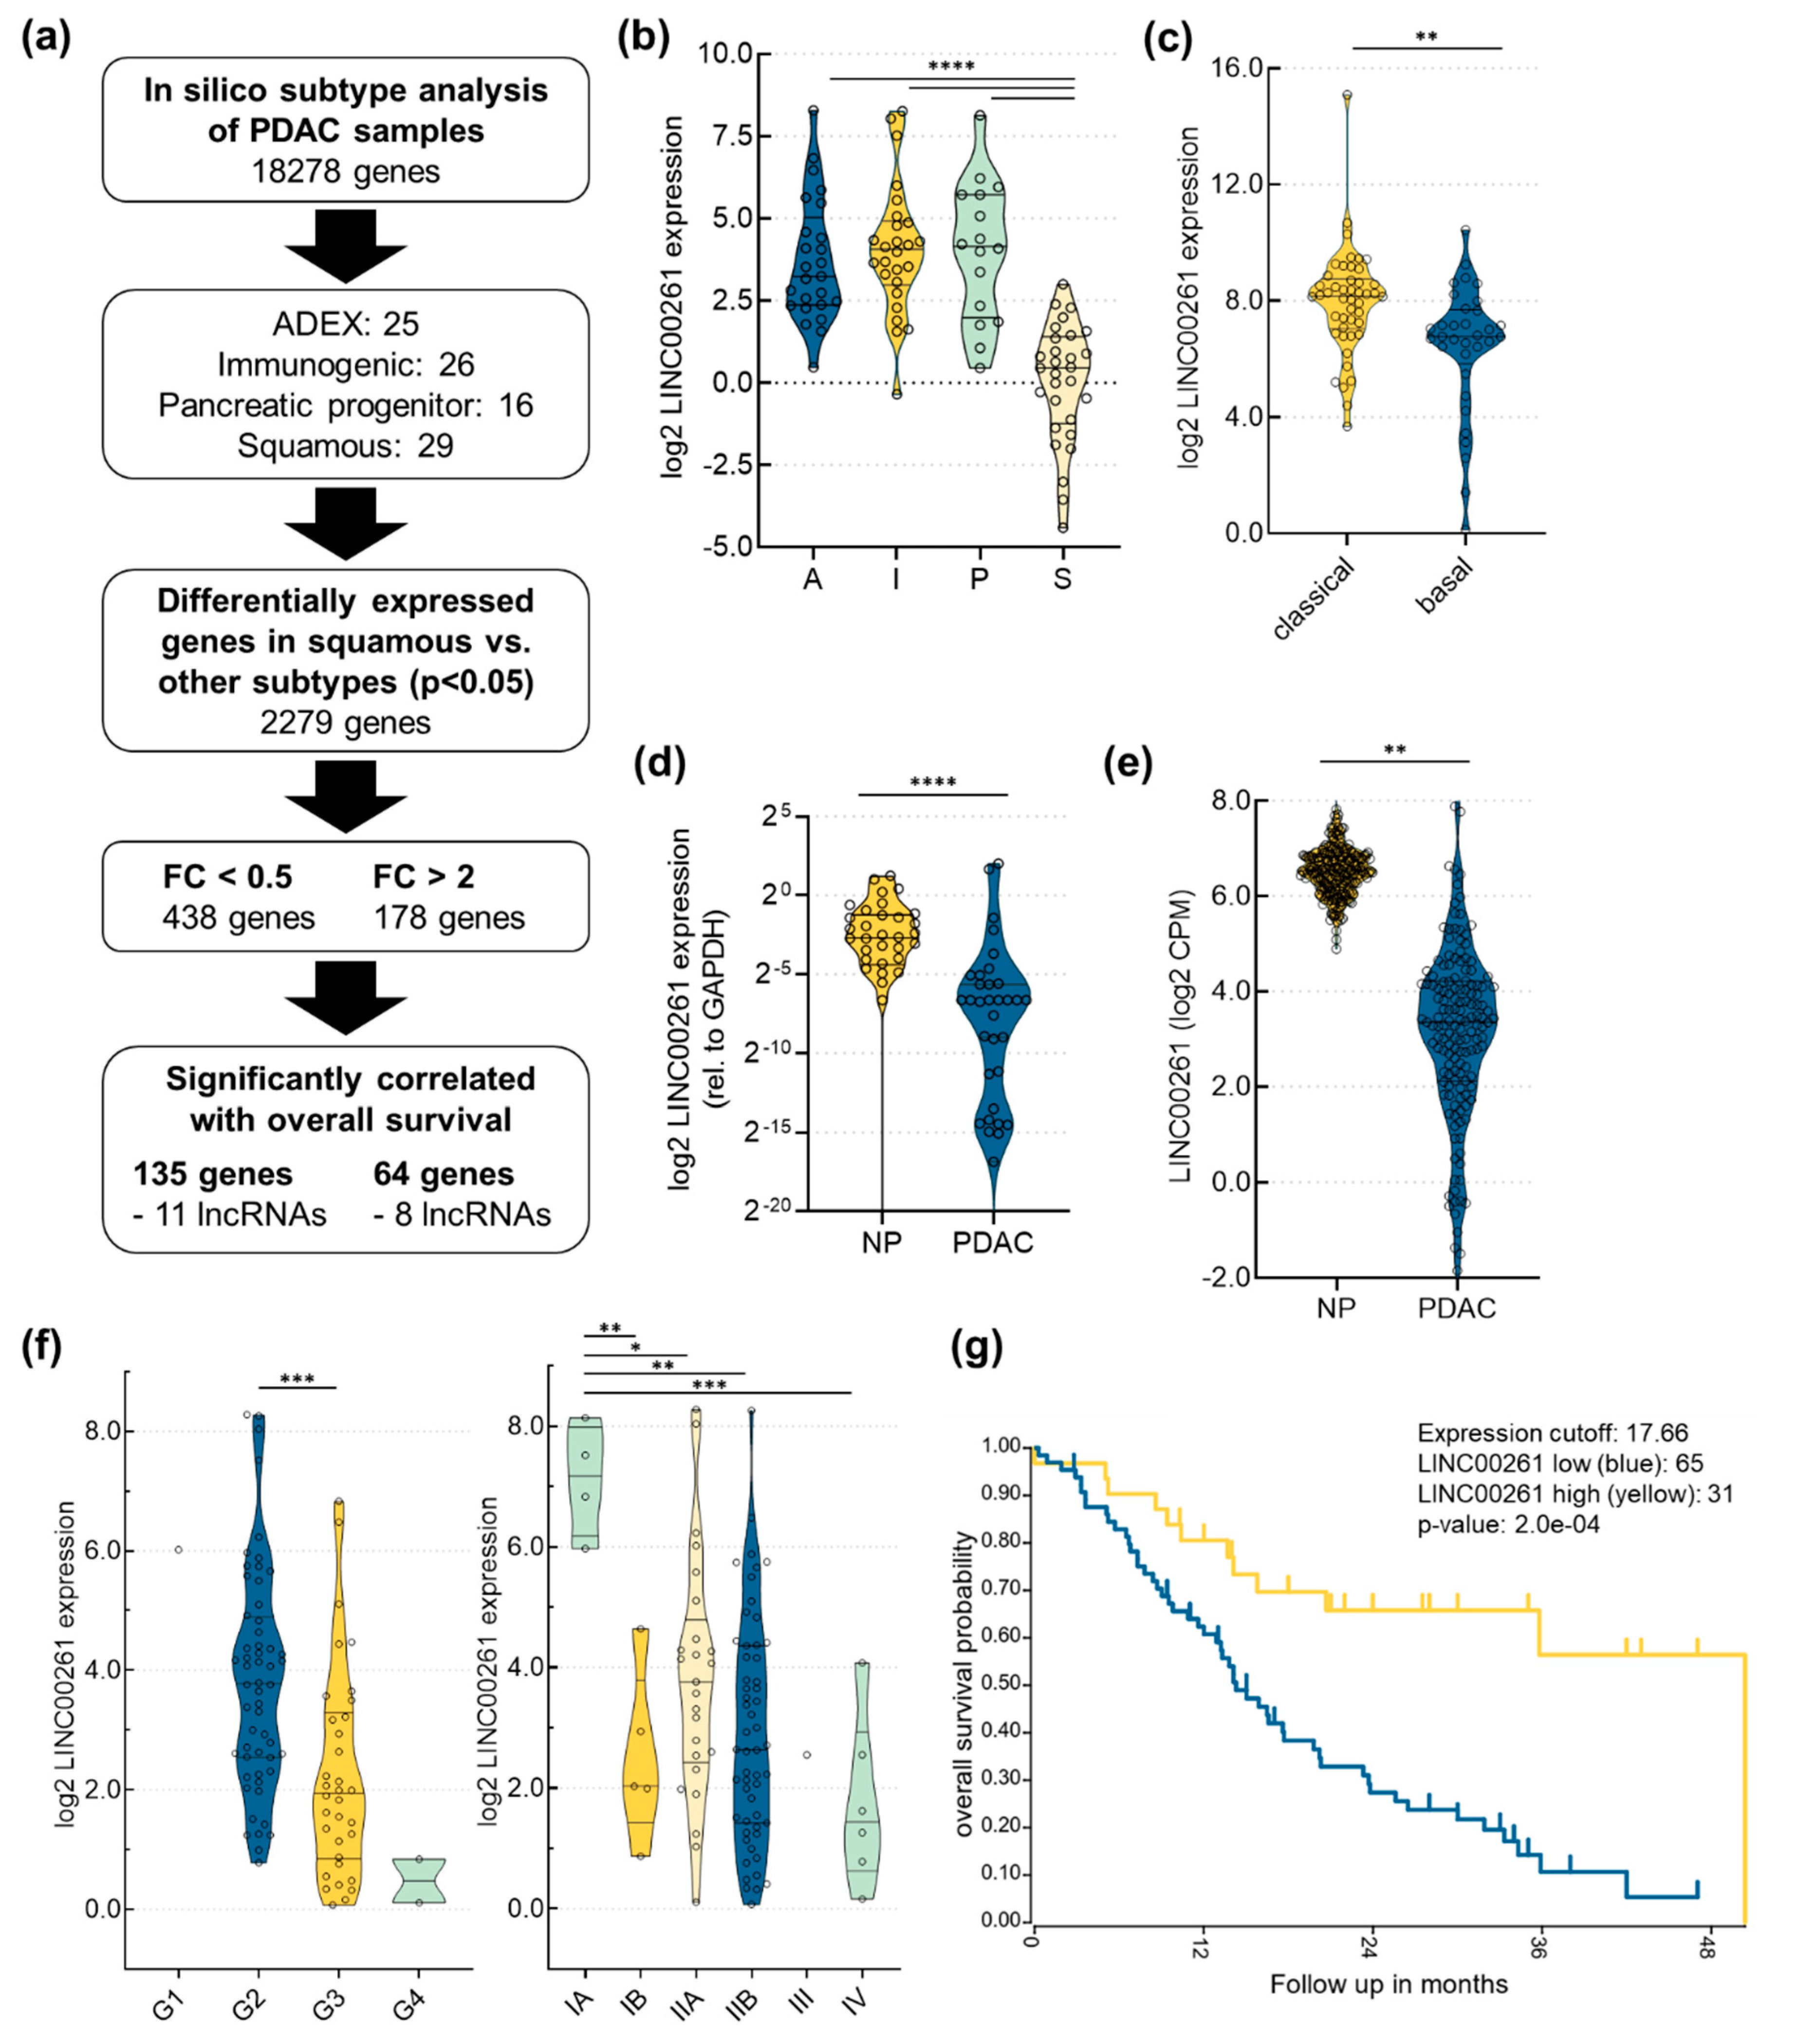
Abstract
:1. Introduction
2. Results
2.1. LINC00261 is Downregulated in PDAC and its Expression Correlates with PDAC Subtypes, Stage, Grade, and Patient Survival
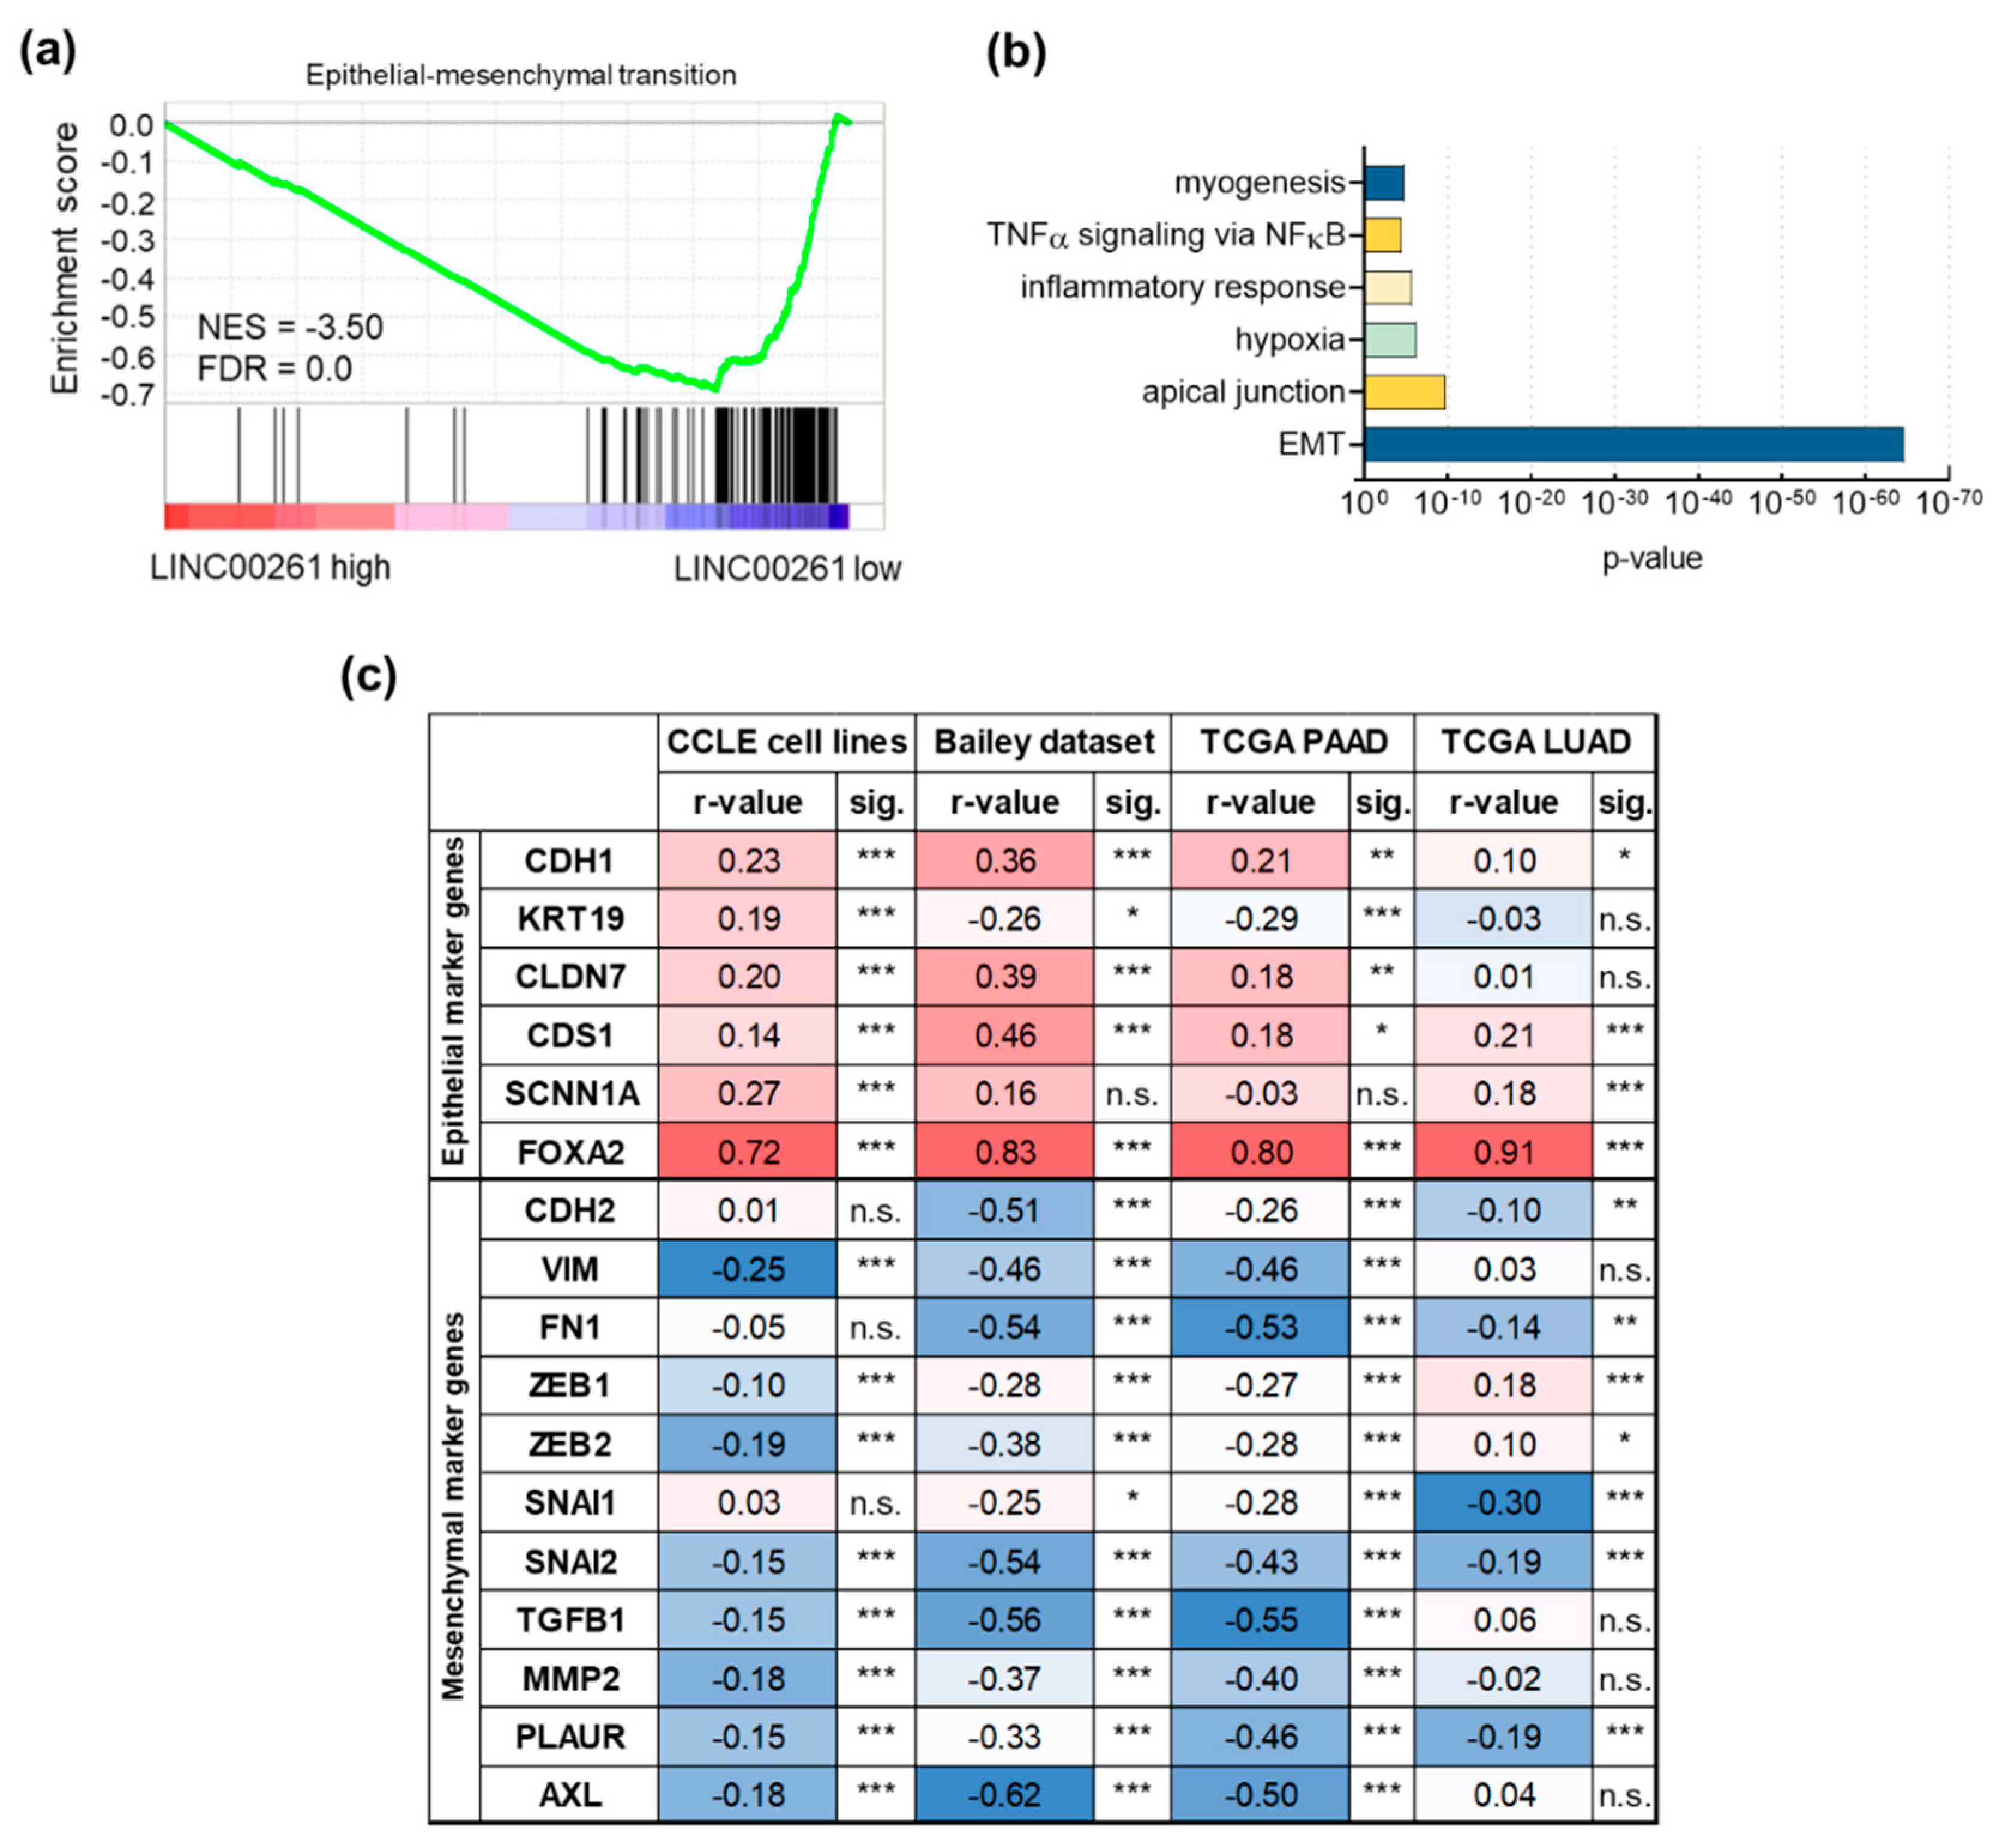
2.2. LINC00261 is Associated with EMT and is Regulated by its Genomic Neighbour FOXA2
2.3. LINC00261 is Downregulated by TGFβ in TGFβ-Responsive Cell Lines
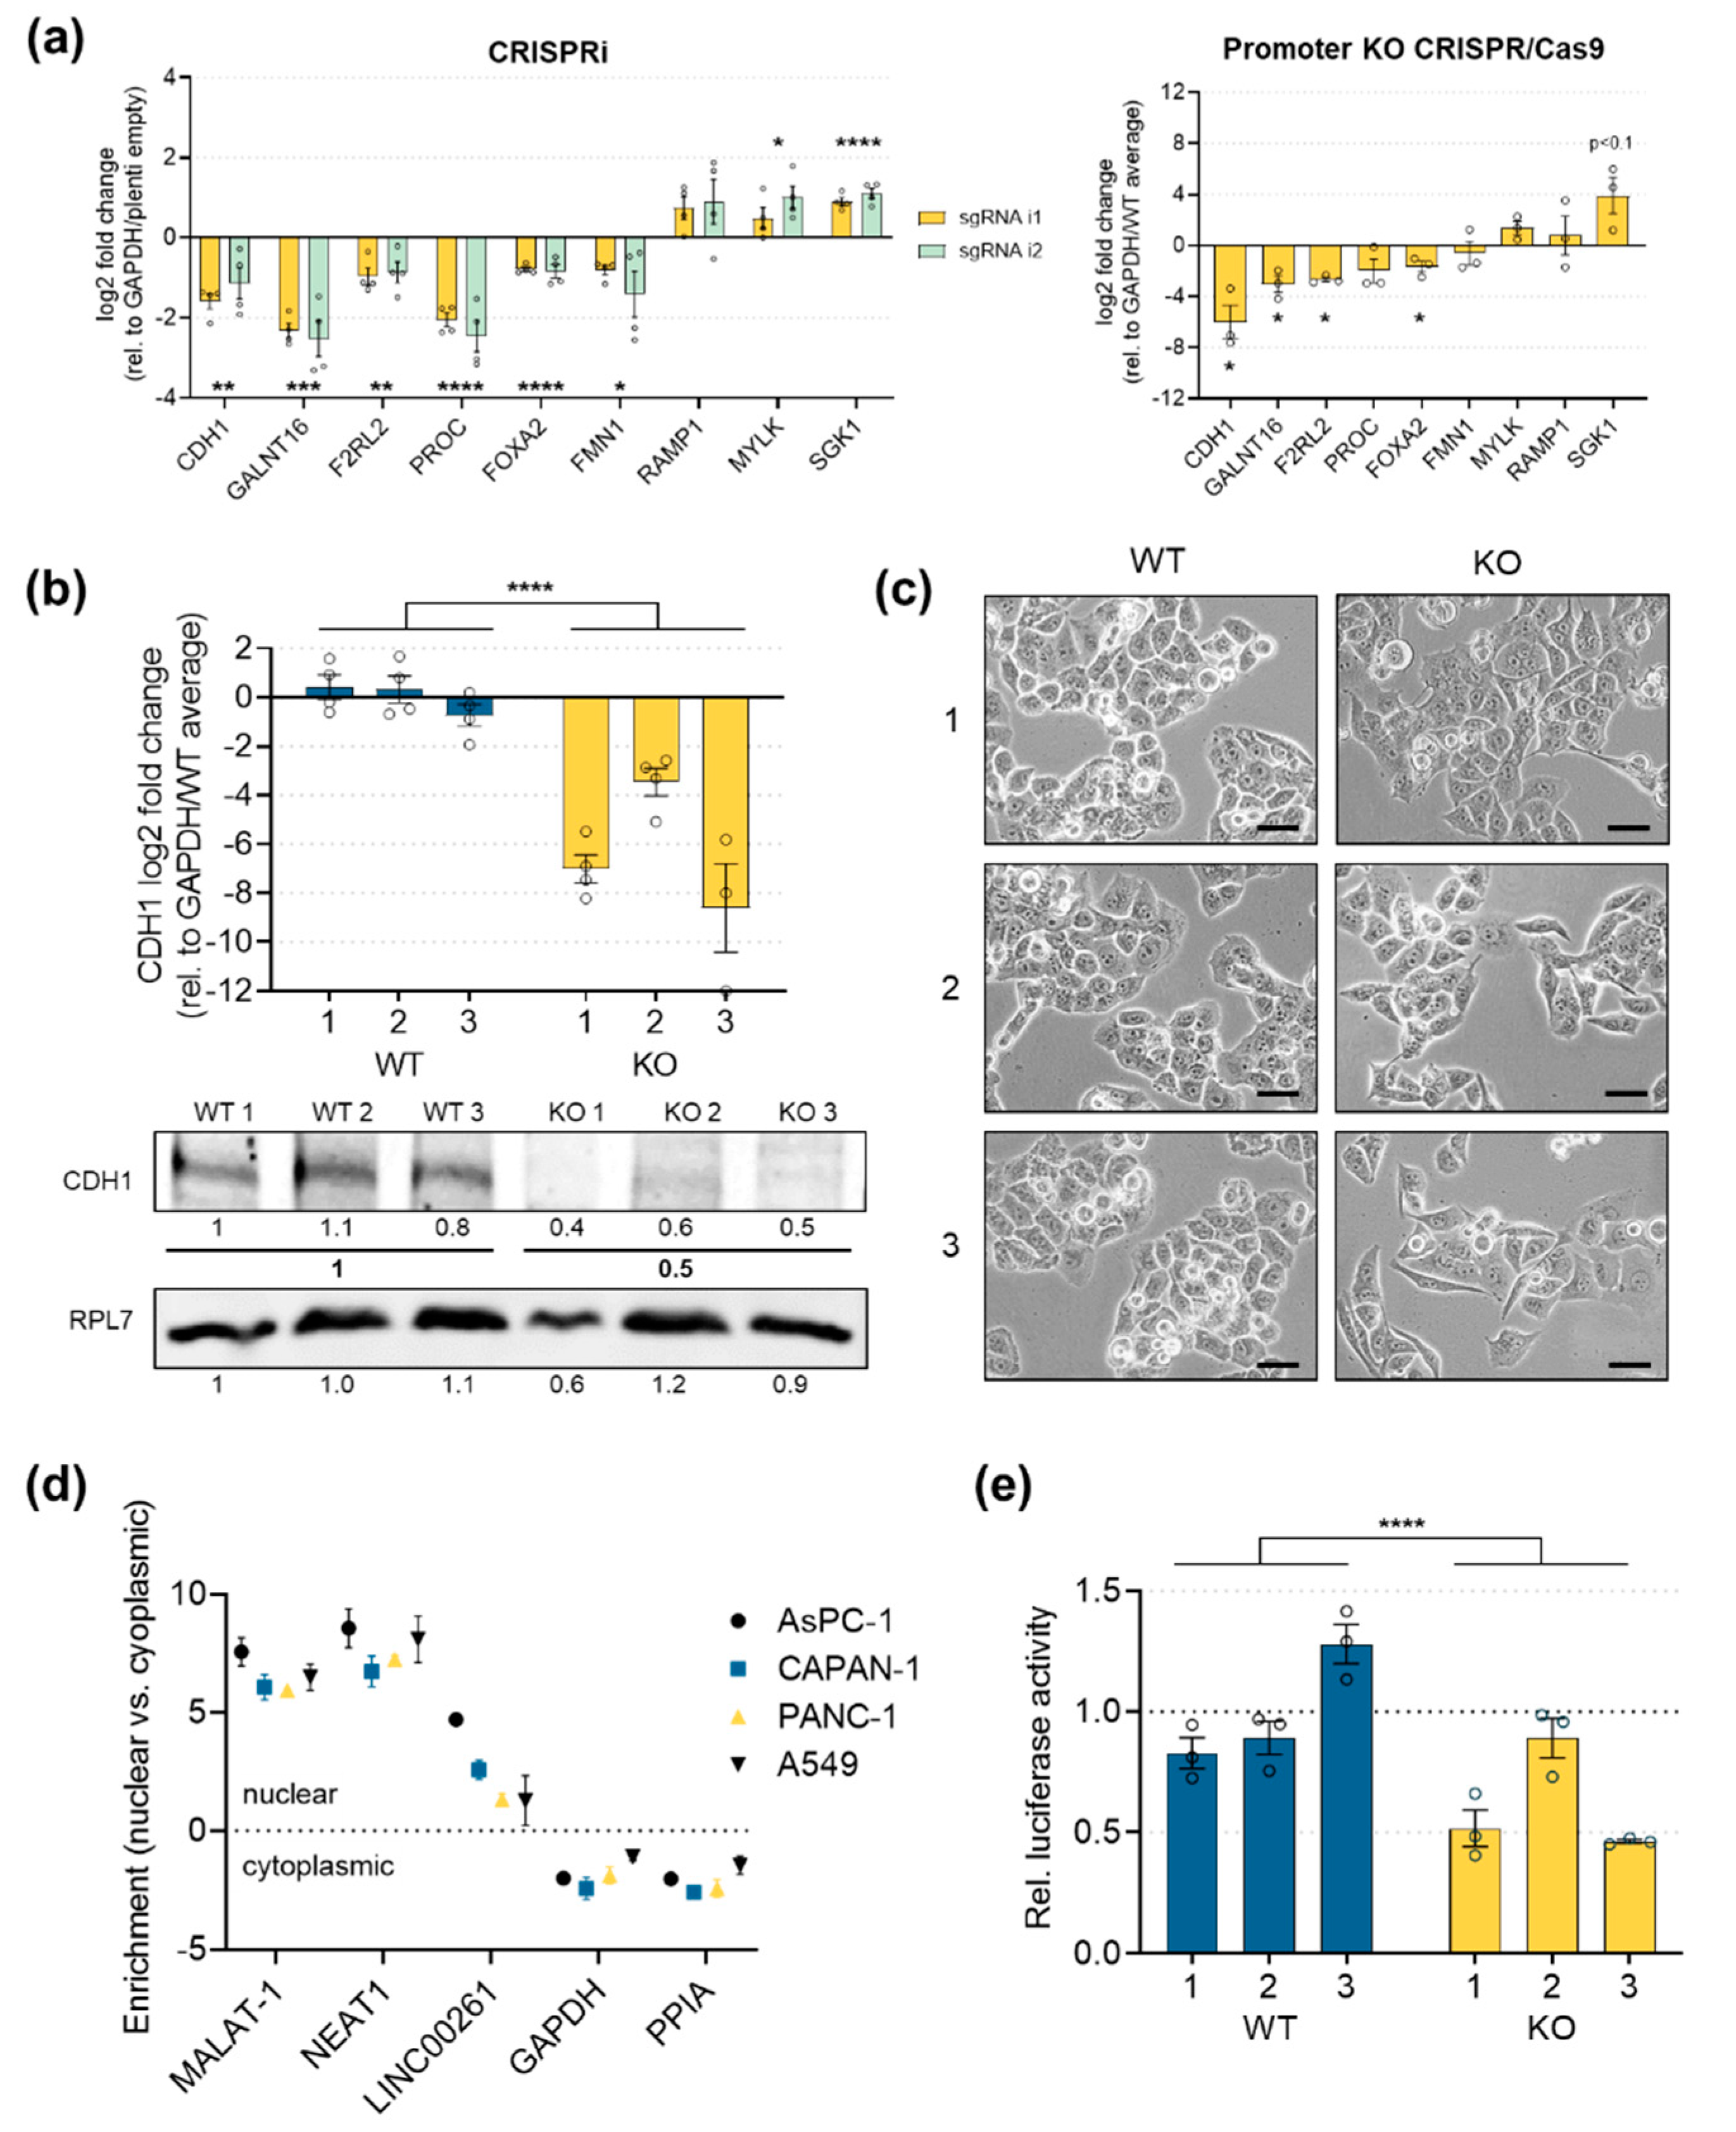
2.4. Downregulation of LINC00261 Expression with Two Different CRISPR-Based Systems Leads to EMT
2.5. E-Cadherin Expression is Significantly Downregulated in LINC00261low Cells
2.6. LINC00261 Downregulation Leads to Increased Cell Migration and Invasion
3. Discussion
4. Materials and Methods
4.1. Bioinformatics Analysis of LINC00261 Expression in PDAC samples
4.2. RNA Extraction from PDAC and Normal Pancreas Tissue Samples
4.3. Cell Culture and siRNA Transfection
4.4. Genomic DNA and Total RNA Extraction Followed by qRT-PCR
4.5. Protein Extraction and Western Blot Analysis
4.6. Subcellular Fractionation
4.7. Chromatin Immunoprecipitation
4.8. Cloning
4.9. LINC00261 Downregulation by CRISPR Interference
4.10. LINC00261 Promoter Knockout Using CRISPR/Cas9
4.11. RNA-Seq and Data Analysis
4.12. Luciferase Assay
4.13. 2D Cell Proliferation Assay
4.14. Cell Migration and Invasion Assays
4.15. Statistical Analysis
5. Conclusions
Supplementary Materials
Author Contributions
Funding
Acknowledgments
Conflicts of Interest
References
- Siegel, R.L.; Miller, K.D.; Jemal, A. Cancer Statistics, 2017. CA Cancer J. Clin. 2017, 67, 7–30. [Google Scholar] [CrossRef] [PubMed] [Green Version]
- Rahib, L.; Smith, B.D.; Aizenberg, R.; Rosenzweig, A.B.; Fleshman, J.M.; Matrisian, L.M. Projecting cancer incidence and deaths to 2030: The unexpected burden of thyroid, liver, and pancreas cancers in the United States. Cancer Res. 2014, 74, 2913–2921. [Google Scholar] [CrossRef] [PubMed] [Green Version]
- Bailey, P.; Chang, D.K.; Nones, K.; Johns, A.L.; Patch, A.M.; Gingras, M.C.; Miller, D.K.; Christ, A.N.; Bruxner, T.J.; Quinn, M.C.; et al. Genomic analyses identify molecular subtypes of pancreatic cancer. Nature 2016, 531, 47–52. [Google Scholar] [CrossRef] [PubMed]
- Collisson, E.A.; Sadanandam, A.; Olson, P.; Gibb, W.J.; Truitt, M.; Gu, S.; Cooc, J.; Weinkle, J.; Kim, G.E.; Jakkula, L.; et al. Subtypes of pancreatic ductal adenocarcinoma and their differing responses to therapy. Nat. Med. 2011, 17, 500–503. [Google Scholar] [CrossRef] [PubMed]
- Moffitt, R.A.; Marayati, R.; Flate, E.L.; Volmar, K.E.; Loeza, S.G.; Hoadley, K.A.; Rashid, N.U.; Williams, L.A.; Eaton, S.C.; Chung, A.H.; et al. Virtual microdissection identifies distinct tumor- and stroma-specific subtypes of pancreatic ductal adenocarcinoma. Nat. Genet. 2015, 47, 1168–1178. [Google Scholar] [CrossRef] [PubMed]
- Puleo, F.; Nicolle, R.; Blum, Y.; Cros, J.; Marisa, L.; Demetter, P.; Quertinmont, E.; Svrcek, M.; Elarouci, N.; Iovanna, J.; et al. Stratification of Pancreatic Ductal Adenocarcinomas Based on Tumor and Microenvironment Features. Gastroenterology 2018, 155, 1999–2013.e3. [Google Scholar] [CrossRef] [Green Version]
- Collisson, E.A.; Bailey, P.; Chang, D.K.; Biankin, A.V. Molecular subtypes of pancreatic cancer. Nat. Rev. Gastroenterol. Hepatol. 2019, 16, 207–220. [Google Scholar] [CrossRef]
- Grunert, S.; Jechlinger, M.; Beug, H. Diverse cellular and molecular mechanisms contribute to epithelial plasticity and metastasis. Nat. Rev. Mol. Cell Biol. 2003, 4, 657–665. [Google Scholar] [CrossRef]
- Son, H.; Moon, A. Epithelial-mesenchymal Transition and Cell Invasion. Toxicol. Res. 2010, 26, 245–252. [Google Scholar] [CrossRef] [Green Version]
- Aiello, N.M.; Maddipati, R.; Norgard, R.J.; Balli, D.; Li, J.; Yuan, S.; Yamazoe, T.; Black, T.; Sahmoud, A.; Furth, E.E.; et al. EMT Subtype Influences Epithelial Plasticity and Mode of Cell Migration. Dev. Cell 2018, 45, 681–695 e684. [Google Scholar] [CrossRef] [Green Version]
- Wendt, M.K.; Allington, T.M.; Schiemann, W.P. Mechanisms of the epithelial-mesenchymal transition by TGF-beta. Future Oncol. 2009, 5, 1145–1168. [Google Scholar] [CrossRef] [PubMed] [Green Version]
- Lu, W.; Kang, Y. Epithelial-Mesenchymal Plasticity in Cancer Progression and Metastasis. Dev. Cell 2019, 49, 361–374. [Google Scholar] [CrossRef] [PubMed]
- Gutschner, T.; Diederichs, S. The hallmarks of cancer: A long non-coding RNA point of view. RNA Biol. 2012, 9, 703–719. [Google Scholar] [CrossRef] [Green Version]
- Gutschner, T.; Richtig, G.; Haemmerle, M.; Pichler, M. From biomarkers to therapeutic targets-the promises and perils of long non-coding RNAs in cancer. Cancer Metastasis Rev. 2018, 37, 83–105. [Google Scholar] [CrossRef] [PubMed]
- Cancer Genome Atlas Research Network; Raphael, B.J.; Hruban, R.H.; Aguirre, A.J.; Moffitt, R.A.; Yeh, J.J.; Stewart, C.; Robertson, A.G.; Cherniack, A.D.; Gupta, M.; et al. Integrated Genomic Characterization of Pancreatic Ductal Adenocarcinoma. Cancer Cell 2017, 32, 185–203.e3. [Google Scholar] [CrossRef]
- Cao, W.J.; Wu, H.L.; He, B.S.; Zhang, Y.S.; Zhang, Z.Y. Analysis of long non-coding RNA expression profiles in gastric cancer. World J. Gastroenterol. 2013, 19, 3658–3664. [Google Scholar] [CrossRef]
- Dhamija, S.; Becker, A.C.; Sharma, Y.; Myacheva, K.; Seiler, J.; Diederichs, S. LINC00261 and the Adjacent Gene FOXA2 Are Epithelial Markers and Are Suppressed during Lung Cancer Tumorigenesis and Progression. Noncoding RNA 2018, 5, 2. [Google Scholar] [CrossRef] [Green Version]
- Zhang, H.F.; Li, W.; Han, Y.D. LINC00261 suppresses cell proliferation, invasion and Notch signaling pathway in hepatocellular carcinoma. Cancer Biomark. 2018, 21, 575–582. [Google Scholar] [CrossRef]
- Gaujoux, R.; Seoighe, C. A flexible R package for nonnegative matrix factorization. BMC Bioinform. 2010, 11, 367. [Google Scholar] [CrossRef] [Green Version]
- Tu, B.; Yao, J.; Ferri-Borgogno, S.; Zhao, J.; Chen, S.; Wang, Q.; Yan, L.; Zhou, X.; Zhu, C.; Bang, S.; et al. YAP1 oncogene is a context-specific driver for pancreatic ductal adenocarcinoma. JCI Insight 2019, 4. [Google Scholar] [CrossRef] [Green Version]
- Lomberk, G.; Blum, Y.; Nicolle, R.; Nair, A.; Gaonkar, K.S.; Marisa, L.; Mathison, A.; Sun, Z.; Yan, H.; Elarouci, N.; et al. Distinct epigenetic landscapes underlie the pathobiology of pancreatic cancer subtypes. Nat. Commun. 2018, 9, 1978. [Google Scholar] [CrossRef] [PubMed]
- Consortium, G.T. The Genotype-Tissue Expression (GTEx) project. Nat. Genet. 2013, 45, 580–585. [Google Scholar] [CrossRef]
- Tang, Z.; Li, C.; Kang, B.; Gao, G.; Li, C.; Zhang, Z. GEPIA: A web server for cancer and normal gene expression profiling and interactive analyses. Nucleic Acids Res. 2017, 45, W98–W102. [Google Scholar] [CrossRef] [PubMed] [Green Version]
- Mootha, V.K.; Lindgren, C.M.; Eriksson, K.F.; Subramanian, A.; Sihag, S.; Lehar, J.; Puigserver, P.; Carlsson, E.; Ridderstrale, M.; Laurila, E.; et al. PGC-1alpha-responsive genes involved in oxidative phosphorylation are coordinately downregulated in human diabetes. Nat. Genet. 2003, 34, 267–273. [Google Scholar] [CrossRef] [PubMed]
- Subramanian, A.; Tamayo, P.; Mootha, V.K.; Mukherjee, S.; Ebert, B.L.; Gillette, M.A.; Paulovich, A.; Pomeroy, S.L.; Golub, T.R.; Lander, E.S.; et al. Gene set enrichment analysis: A knowledge-based approach for interpreting genome-wide expression profiles. Proc. Natl. Acad. Sci. USA 2005, 102, 15545–15550. [Google Scholar] [CrossRef] [Green Version]
- Byers, L.A.; Diao, L.; Wang, J.; Saintigny, P.; Girard, L.; Peyton, M.; Shen, L.; Fan, Y.; Giri, U.; Tumula, P.K.; et al. An epithelial-mesenchymal transition gene signature predicts resistance to EGFR and PI3K inhibitors and identifies Axl as a therapeutic target for overcoming EGFR inhibitor resistance. Clin. Cancer Res. 2013, 19, 279–290. [Google Scholar] [CrossRef] [Green Version]
- Barretina, J.; Caponigro, G.; Stransky, N.; Venkatesan, K.; Margolin, A.A.; Kim, S.; Wilson, C.J.; Lehar, J.; Kryukov, G.V.; Sonkin, D.; et al. The Cancer Cell Line Encyclopedia enables predictive modelling of anticancer drug sensitivity. Nature 2012, 483, 603–607. [Google Scholar] [CrossRef]
- Ghandi, M.; Huang, F.W.; Jane-Valbuena, J.; Kryukov, G.V.; Lo, C.C.; McDonald, E.R., 3rd; Barretina, J.; Gelfand, E.T.; Bielski, C.M.; Li, H.; et al. Next-generation characterization of the Cancer Cell Line Encyclopedia. Nature 2019, 569, 503–508. [Google Scholar] [CrossRef]
- Cancer Genome Atlas Research, N. Comprehensive molecular profiling of lung adenocarcinoma. Nature 2014, 511, 543–550. [Google Scholar] [CrossRef]
- Song, Y.; Washington, M.K.; Crawford, H.C. Loss of FOXA1/2 is essential for the epithelial-to-mesenchymal transition in pancreatic cancer. Cancer Res. 2010, 70, 2115–2125. [Google Scholar] [CrossRef] [Green Version]
- Tang, Y.; Shu, G.; Yuan, X.; Jing, N.; Song, J. FOXA2 functions as a suppressor of tumor metastasis by inhibition of epithelial-to-mesenchymal transition in human lung cancers. Cell Res. 2011, 21, 316–326. [Google Scholar] [CrossRef] [PubMed] [Green Version]
- Wang, J.; Zhu, C.P.; Hu, P.F.; Qian, H.; Ning, B.F.; Zhang, Q.; Chen, F.; Liu, J.; Shi, B.; Zhang, X.; et al. FOXA2 suppresses the metastasis of hepatocellular carcinoma partially through matrix metalloproteinase-9 inhibition. Carcinogenesis 2014, 35, 2576–2583. [Google Scholar] [CrossRef] [PubMed] [Green Version]
- Lee, K.; Cho, H.; Rickert, R.W.; Li, Q.V.; Pulecio, J.; Leslie, C.S.; Huangfu, D. FOXA2 Is Required for Enhancer Priming during Pancreatic Differentiation. Cell Rep. 2019, 28, 382–393.e7. [Google Scholar] [CrossRef] [PubMed]
- Shahabi, S.; Kumaran, V.; Castillo, J.; Cong, Z.; Nandagopal, G.; Mullen, D.J.; Alvarado, A.; Correa, M.R.; Saizan, A.; Goel, R.; et al. LINC00261 Is an Epigenetically Regulated Tumor Suppressor Essential for Activation of the DNA Damage Response. Cancer Res. 2019, 79, 3050–3062. [Google Scholar] [CrossRef] [Green Version]
- Yu, Y.; Li, L.; Zheng, Z.; Chen, S.; Chen, E.; Hu, Y. Long non-coding RNA linc00261 suppresses gastric cancer progression via promoting Slug degradation. J. Cell Mol. Med. 2017, 21, 955–967. [Google Scholar] [CrossRef]
- Gellibert, F.; Woolven, J.; Fouchet, M.H.; Mathews, N.; Goodland, H.; Lovegrove, V.; Laroze, A.; Nguyen, V.L.; Sautet, S.; Wang, R.; et al. Identification of 1,5-naphthyridine derivatives as a novel series of potent and selective TGF-beta type I receptor inhibitors. J. Med. Chem 2004, 47, 4494–4506. [Google Scholar] [CrossRef]
- Qi, L.S.; Larson, M.H.; Gilbert, L.A.; Doudna, J.A.; Weissman, J.S.; Arkin, A.P.; Lim, W.A. Repurposing CRISPR as an RNA-guided platform for sequence-specific control of gene expression. Cell 2013, 152, 1173–1183. [Google Scholar] [CrossRef] [Green Version]
- Ran, F.A.; Hsu, P.D.; Wright, J.; Agarwala, V.; Scott, D.A.; Zhang, F. Genome engineering using the CRISPR-Cas9 system. Nat. Protoc. 2013, 8, 2281–2308. [Google Scholar] [CrossRef] [Green Version]
- Totsukawa, G.; Wu, Y.; Sasaki, Y.; Hartshorne, D.J.; Yamakita, Y.; Yamashiro, S.; Matsumura, F. Distinct roles of MLCK and ROCK in the regulation of membrane protrusions and focal adhesion dynamics during cell migration of fibroblasts. J. Cell Biol. 2004, 164, 427–439. [Google Scholar] [CrossRef] [Green Version]
- Faix, J.; Grosse, R. Staying in shape with formins. Dev. Cell 2006, 10, 693–706. [Google Scholar] [CrossRef] [Green Version]
- Kang, Y.; Massague, J. Epithelial-mesenchymal transitions: Twist in development and metastasis. Cell 2004, 118, 277–279. [Google Scholar] [CrossRef] [PubMed] [Green Version]
- Jiang, W.; Liu, Y.; Liu, R.; Zhang, K.; Zhang, Y. The lncRNA DEANR1 facilitates human endoderm differentiation by activating FOXA2 expression. Cell Rep. 2015, 11, 137–148. [Google Scholar] [CrossRef] [PubMed] [Green Version]
- Sergeeva, O.V.; Korinfskaya, S.A.; Kurochkin, I.I.; Zatsepin, T.S. Long Noncoding RNA LL35/Falcor Regulates Expression of Transcription Factor Foxa2 in Hepatocytes in Normal and Fibrotic Mouse Liver. Acta Nat. 2019, 11, 66–74. [Google Scholar] [CrossRef] [PubMed]
- Swarr, D.T.; Herriges, M.; Li, S.; Morley, M.; Fernandes, S.; Sridharan, A.; Zhou, S.; Garcia, B.A.; Stewart, K.; Morrisey, E.E. The long noncoding RNA Falcor regulates Foxa2 expression to maintain lung epithelial homeostasis and promote regeneration. Genes Dev. 2019, 33, 656–668. [Google Scholar] [CrossRef] [Green Version]
- Lamouille, S.; Xu, J.; Derynck, R. Molecular mechanisms of epithelial-mesenchymal transition. Nat. Rev. Mol. Cell Biol. 2014, 15, 178–196. [Google Scholar] [CrossRef] [PubMed] [Green Version]
- Figueiredo, J.; Melo, S.; Carneiro, P.; Moreira, A.M.; Fernandes, M.S.; Ribeiro, A.S.; Guilford, P.; Paredes, J.; Seruca, R. Clinical spectrum and pleiotropic nature of CDH1 germline mutations. J. Med. Genet. 2019, 56, 199–208. [Google Scholar] [CrossRef] [Green Version]
- Hutchinson, J.N.; Ensminger, A.W.; Clemson, C.M.; Lynch, C.R.; Lawrence, J.B.; Chess, A. A screen for nuclear transcripts identifies two linked noncoding RNAs associated with SC35 splicing domains. BMC Genom. 2007, 8, 39. [Google Scholar] [CrossRef] [Green Version]
- Fu, X.L.; Liu, D.J.; Yan, T.T.; Yang, J.Y.; Yang, M.W.; Li, J.; Huo, Y.M.; Liu, W.; Zhang, J.F.; Hong, J.; et al. Analysis of long non-coding RNA expression profiles in pancreatic ductal adenocarcinoma. Sci. Rep. 2016, 6, 33535. [Google Scholar] [CrossRef] [Green Version]
- Giulietti, M.; Righetti, A.; Principato, G.; Piva, F. LncRNA co-expression network analysis reveals novel biomarkers for pancreatic cancer. Carcinogenesis 2018, 39, 1016–1025. [Google Scholar] [CrossRef] [Green Version]
- Hao, S.; Yao, L.; Huang, J.; He, H.; Yang, F.; Di, Y.; Jin, C.; Fu, D. Genome-Wide Analysis Identified a Number of Dysregulated Long Noncoding RNA (lncRNA) in Human Pancreatic Ductal Adenocarcinoma. Technol. Cancer Res. Treat. 2018, 17, 1533034617748429. [Google Scholar] [CrossRef] [Green Version]
- Yu, X.; Lin, Y.; Sui, W.; Zou, Y.; Lv, Z. Analysis of distinct long noncoding RNA transcriptional fingerprints in pancreatic ductal adenocarcinoma. Cancer Med. 2017, 6, 673–680. [Google Scholar] [CrossRef] [PubMed]
- Zhou, C.; Wang, S.; Zhou, Q.; Zhao, J.; Xia, X.; Chen, W.; Zheng, Y.; Xue, M.; Yang, F.; Fu, D.; et al. A Long Non-coding RNA Signature to Improve Prognostic Prediction of Pancreatic Ductal Adenocarcinoma. Front. Oncol. 2019, 9, 1160. [Google Scholar] [CrossRef] [PubMed] [Green Version]
- Zhou, M.; Diao, Z.; Yue, X.; Chen, Y.; Zhao, H.; Cheng, L.; Sun, J. Construction and analysis of dysregulated lncRNA-associated ceRNA network identified novel lncRNA biomarkers for early diagnosis of human pancreatic cancer. Oncotarget 2016, 7, 56383–56394. [Google Scholar] [CrossRef] [PubMed] [Green Version]
- Nieto, M.A.; Huang, R.Y.; Jackson, R.A.; Thiery, J.P. Emt: 2016. Cell 2016, 166, 21–45. [Google Scholar] [CrossRef] [Green Version]
- Karamitopoulou, E.; Zlobec, I.; Born, D.; Kondi-Pafiti, A.; Lykoudis, P.; Mellou, A.; Gennatas, K.; Gloor, B.; Lugli, A. Tumour budding is a strong and independent prognostic factor in pancreatic cancer. Eur. J. Cancer 2013, 49, 1032–1039. [Google Scholar] [CrossRef]
- Lawlor, R.T.; Veronese, N.; Nottegar, A.; Malleo, G.; Smith, L.; Demurtas, J.; Cheng, L.; Wood, L.D.; Silvestris, N.; Salvia, R.; et al. Prognostic Role of High-Grade Tumor Budding in Pancreatic Ductal Adenocarcinoma: A Systematic Review and Meta-Analysis with a Focus on Epithelial to Mesenchymal Transition. Cancers 2019, 11, 113. [Google Scholar] [CrossRef] [Green Version]
- Yamada, S.; Fuchs, B.C.; Fujii, T.; Shimoyama, Y.; Sugimoto, H.; Nomoto, S.; Takeda, S.; Tanabe, K.K.; Kodera, Y.; Nakao, A. Epithelial-to-mesenchymal transition predicts prognosis of pancreatic cancer. Surgery 2013, 154, 946–954. [Google Scholar] [CrossRef]
- Hotz, B.; Arndt, M.; Dullat, S.; Bhargava, S.; Buhr, H.J.; Hotz, H.G. Epithelial to mesenchymal transition: Expression of the regulators snail, slug, and twist in pancreatic cancer. Clin. Cancer Res. 2007, 13, 4769–4776. [Google Scholar] [CrossRef] [Green Version]
- Du, L.; Yamamoto, S.; Burnette, B.L.; Huang, D.; Gao, K.; Jamshidi, N.; Kuo, M.D. Transcriptome profiling reveals novel gene expression signatures and regulating transcription factors of TGFbeta-induced epithelial-to-mesenchymal transition. Cancer Med. 2016, 5, 1962–1972. [Google Scholar] [CrossRef] [Green Version]
- Melisi, D.; Ishiyama, S.; Sclabas, G.M.; Fleming, J.B.; Xia, Q.; Tortora, G.; Abbruzzese, J.L.; Chiao, P.J. LY2109761, a novel transforming growth factor beta receptor type I and type II dual inhibitor, as a therapeutic approach to suppressing pancreatic cancer metastasis. Mol. Cancer Ther. 2008, 7, 829–840. [Google Scholar] [CrossRef] [Green Version]
- Zheng, X.; Carstens, J.L.; Kim, J.; Scheible, M.; Kaye, J.; Sugimoto, H.; Wu, C.C.; LeBleu, V.S.; Kalluri, R. Epithelial-to-mesenchymal transition is dispensable for metastasis but induces chemoresistance in pancreatic cancer. Nature 2015, 527, 525–530. [Google Scholar] [CrossRef] [PubMed] [Green Version]
- Fischer, K.R.; Durrans, A.; Lee, S.; Sheng, J.; Li, F.; Wong, S.T.; Choi, H.; El Rayes, T.; Ryu, S.; Troeger, J.; et al. Epithelial-to-mesenchymal transition is not required for lung metastasis but contributes to chemoresistance. Nature 2015, 527, 472–476. [Google Scholar] [CrossRef] [PubMed]
- Aiello, N.M.; Brabletz, T.; Kang, Y.; Nieto, M.A.; Weinberg, R.A.; Stanger, B.Z. Upholding a role for EMT in pancreatic cancer metastasis. Nature 2017, 547, E7–E8. [Google Scholar] [CrossRef] [PubMed]
- Ye, X.; Brabletz, T.; Kang, Y.; Longmore, G.D.; Nieto, M.A.; Stanger, B.Z.; Yang, J.; Weinberg, R.A. Upholding a role for EMT in breast cancer metastasis. Nature 2017, 547, E1–E3. [Google Scholar] [CrossRef]
- Krebs, A.M.; Mitschke, J.; Lasierra Losada, M.; Schmalhofer, O.; Boerries, M.; Busch, H.; Boettcher, M.; Mougiakakos, D.; Reichardt, W.; Bronsert, P.; et al. The EMT-activator Zeb1 is a key factor for cell plasticity and promotes metastasis in pancreatic cancer. Nat. Cell Biol. 2017, 19, 518–529. [Google Scholar] [CrossRef] [Green Version]
- Stemmler, M.P.; Eccles, R.L.; Brabletz, S.; Brabletz, T. Non-redundant functions of EMT transcription factors. Nat. Cell Biol. 2019, 21, 102–112. [Google Scholar] [CrossRef]
- Gao, J.; Qin, W.; Kang, P.; Xu, Y.; Leng, K.; Li, Z.; Huang, L.; Cui, Y.; Zhong, X. Up-regulated LINC00261 predicts a poor prognosis and promotes a metastasis by EMT process in cholangiocarcinoma. Pathol. Res. Pract 2020, 216, 152733. [Google Scholar] [CrossRef]
- Colak, S.; Ten Dijke, P. Targeting TGF-beta Signaling in Cancer. Trends Cancer 2017, 3, 56–71. [Google Scholar] [CrossRef]
- Calon, A.; Lonardo, E.; Berenguer-Llergo, A.; Espinet, E.; Hernando-Momblona, X.; Iglesias, M.; Sevillano, M.; Palomo-Ponce, S.; Tauriello, D.V.; Byrom, D.; et al. Stromal gene expression defines poor-prognosis subtypes in colorectal cancer. Nat. Genet. 2015, 47, 320–329. [Google Scholar] [CrossRef] [Green Version]
- Akalay, I.; Janji, B.; Hasmim, M.; Noman, M.Z.; Andre, F.; De Cremoux, P.; Bertheau, P.; Badoual, C.; Vielh, P.; Larsen, A.K.; et al. Epithelial-to-mesenchymal transition and autophagy induction in breast carcinoma promote escape from T-cell-mediated lysis. Cancer Res. 2013, 73, 2418–2427. [Google Scholar] [CrossRef] [Green Version]
- Chen, T.; Lei, S.; Zeng, Z.; Zhang, J.; Xue, Y.; Sun, Y.; Lan, J.; Xu, S.; Mao, D.; Guo, B. Linc00261 inhibits metastasis and the WNT signaling pathway of pancreatic cancer by regulating a miR5525p/FOXO3 axis. Oncol. Rep. 2020, 43, 930–942. [Google Scholar] [CrossRef] [PubMed] [Green Version]
- Iyer, S.; Ambrogini, E.; Bartell, S.M.; Han, L.; Roberson, P.K.; de Cabo, R.; Jilka, R.L.; Weinstein, R.S.; O’Brien, C.A.; Manolagas, S.C.; et al. FOXOs attenuate bone formation by suppressing Wnt signaling. J. Clin. Investig. 2013, 123, 3409–3419. [Google Scholar] [CrossRef] [PubMed]
- Ouyang, D.; Li, R.; Li, Y.; Zhu, X. Construction of a Competitive Endogenous RNA Network in Uterine Corpus Endometrial Carcinoma. Med. Sci. Monit. 2019, 25, 7998–8010. [Google Scholar] [CrossRef] [PubMed]
- Qi, L.; Zhang, T.; Yao, Y.; Zhuang, J.; Liu, C.; Liu, R.; Sun, C. Identification of lncRNAs associated with lung squamous cell carcinoma prognosis in the competitive endogenous RNA network. PeerJ 2019, 7, e7727. [Google Scholar] [CrossRef] [PubMed] [Green Version]
- Zhao, D.; Ren, C.; Yao, Y.; Wang, Q.; Li, F.; Li, Y.; Jiang, A.; Wang, G. Identifying prognostic biomarkers in endometrial carcinoma based on ceRNA network. J. Cell. Biochem. 2020, 121, 2437–2446. [Google Scholar] [CrossRef] [PubMed]
- Lin, K.; Jiang, H.; Zhuang, S.S.; Qin, Y.S.; Qiu, G.D.; She, Y.Q.; Zheng, J.T.; Chen, C.; Fang, L.; Zhang, S.Y. Long noncoding RNA LINC00261 induces chemosensitization to 5-fluorouracil by mediating methylation-dependent repression of DPYD in human esophageal cancer. FASEB J. 2019, 33, 1972–1988. [Google Scholar] [CrossRef] [Green Version]
- von Burstin, J.; Eser, S.; Paul, M.C.; Seidler, B.; Brandl, M.; Messer, M.; von Werder, A.; Schmidt, A.; Mages, J.; Pagel, P.; et al. E-cadherin regulates metastasis of pancreatic cancer in vivo and is suppressed by a SNAIL/HDAC1/HDAC2 repressor complex. Gastroenterology 2009, 137, 361–371.e5. [Google Scholar] [CrossRef]
- Hu, D.; Ansari, D.; Pawlowski, K.; Zhou, Q.; Sasor, A.; Welinder, C.; Kristl, T.; Bauden, M.; Rezeli, M.; Jiang, Y.; et al. Proteomic analyses identify prognostic biomarkers for pancreatic ductal adenocarcinoma. Oncotarget 2018, 9, 9789–9807. [Google Scholar] [CrossRef] [Green Version]
- Batlle, E.; Sancho, E.; Franci, C.; Dominguez, D.; Monfar, M.; Baulida, J.; Garcia De Herreros, A. The transcription factor snail is a repressor of E-cadherin gene expression in epithelial tumour cells. Nat. Cell Biol. 2000, 2, 84–89. [Google Scholar] [CrossRef]
- Cano, A.; Perez-Moreno, M.A.; Rodrigo, I.; Locascio, A.; Blanco, M.J.; del Barrio, M.G.; Portillo, F.; Nieto, M.A. The transcription factor snail controls epithelial-mesenchymal transitions by repressing E-cadherin expression. Nat. Cell Biol. 2000, 2, 76–83. [Google Scholar] [CrossRef]
- De Craene, B.; Gilbert, B.; Stove, C.; Bruyneel, E.; van Roy, F.; Berx, G. The transcription factor snail induces tumor cell invasion through modulation of the epithelial cell differentiation program. Cancer Res. 2005, 65, 6237–6244. [Google Scholar] [CrossRef] [PubMed] [Green Version]
- Hajra, K.M.; Chen, D.Y.; Fearon, E.R. The SLUG zinc-finger protein represses E-cadherin in breast cancer. Cancer Res. 2002, 62, 1613–1618. [Google Scholar] [PubMed]
- Wang, F.; Sloss, C.; Zhang, X.; Lee, S.W.; Cusack, J.C. Membrane-bound heparin-binding epidermal growth factor like growth factor regulates E-cadherin expression in pancreatic carcinoma cells. Cancer Res. 2007, 67, 8486–8493. [Google Scholar] [CrossRef] [PubMed] [Green Version]
- Yang, J.; Mani, S.A.; Donaher, J.L.; Ramaswamy, S.; Itzykson, R.A.; Come, C.; Savagner, P.; Gitelman, I.; Richardson, A.; Weinberg, R.A. Twist, a master regulator of morphogenesis, plays an essential role in tumor metastasis. Cell 2004, 117, 927–939. [Google Scholar] [CrossRef] [PubMed] [Green Version]
- Liu, Y.N.; Lee, W.W.; Wang, C.Y.; Chao, T.H.; Chen, Y.; Chen, J.H. Regulatory mechanisms controlling human E-cadherin gene expression. Oncogene 2005, 24, 8277–8290. [Google Scholar] [CrossRef] [PubMed] [Green Version]
- Arumugam, T.; Ramachandran, V.; Fournier, K.F.; Wang, H.; Marquis, L.; Abbruzzese, J.L.; Gallick, G.E.; Logsdon, C.D.; McConkey, D.J.; Choi, W. Epithelial to mesenchymal transition contributes to drug resistance in pancreatic cancer. Cancer Res. 2009, 69, 5820–5828. [Google Scholar] [CrossRef] [PubMed] [Green Version]
- Chua, H.L.; Bhat-Nakshatri, P.; Clare, S.E.; Morimiya, A.; Badve, S.; Nakshatri, H. NF-kappaB represses E-cadherin expression and enhances epithelial to mesenchymal transition of mammary epithelial cells: Potential involvement of ZEB-1 and ZEB-2. Oncogene 2007, 26, 711–724. [Google Scholar] [CrossRef] [PubMed] [Green Version]
- Larsen, J.E.; Nathan, V.; Osborne, J.K.; Farrow, R.K.; Deb, D.; Sullivan, J.P.; Dospoy, P.D.; Augustyn, A.; Hight, S.K.; Sato, M.; et al. ZEB1 drives epithelial-to-mesenchymal transition in lung cancer. J. Clin. Investig. 2016, 126, 3219–3235. [Google Scholar] [CrossRef] [Green Version]
- Lombaerts, M.; van Wezel, T.; Philippo, K.; Dierssen, J.W.; Zimmerman, R.M.; Oosting, J.; van Eijk, R.; Eilers, P.H.; van de Water, B.; Cornelisse, C.J.; et al. E-cadherin transcriptional downregulation by promoter methylation but not mutation is related to epithelial-to-mesenchymal transition in breast cancer cell lines. Br. J. Cancer 2006, 94, 661–671. [Google Scholar] [CrossRef] [Green Version]
- Wang, Y.Q.; Yuan, Y.; Jiang, S.; Jiang, H. Promoter methylation and expression of CDH1 and susceptibility and prognosis of eyelid squamous cell carcinoma. Tumor Biol. 2016, 37, 9521–9526. [Google Scholar] [CrossRef]
- Bow, Y.D.; Wang, Y.Y.; Chen, Y.K.; Su, C.W.; Hsu, C.W.; Xiao, L.Y.; Yuan, S.S.; Li, R.N. Silencing of FOXA2 decreases E-cadherin expression and is associated with lymph node metastasis in oral cancer. Oral Dis. 2020, 26, 756–765. [Google Scholar] [CrossRef] [PubMed]
- Villacorte, M.; Suzuki, K.; Hirasawa, A.; Ohkawa, Y.; Suyama, M.; Maruyama, T.; Aoki, D.; Ogino, Y.; Miyagawa, S.; Terabayashi, T.; et al. beta-Catenin signaling regulates Foxa2 expression during endometrial hyperplasia formation. Oncogene 2013, 32, 3477–3482. [Google Scholar] [CrossRef] [PubMed]
- Wang, B.; Liu, G.; Ding, L.; Zhao, J.; Lu, Y. FOXA2 promotes the proliferation, migration and invasion, and epithelial mesenchymal transition in colon cancer. Exp. Ther. Med. 2018, 16, 133–140. [Google Scholar] [CrossRef] [PubMed] [Green Version]
- Dang, H.X.; White, N.M.; Rozycki, E.B.; Felsheim, B.M.; Watson, M.A.; Govindan, R.; Luo, J.; Maher, C.A. Long non-coding RNA LCAL62 / LINC00261 is associated with lung adenocarcinoma prognosis. Heliyon 2020, 6, e03521. [Google Scholar] [CrossRef] [PubMed]
- Frappart, P.O.; Walter, K.; Gout, J.; Beutel, A.K.; Morawe, M.; Arnold, F.; Breunig, M.; Barth, T.F.; Marienfeld, R.; Schulte, L.; et al. Pancreatic cancer-derived organoids—A disease modeling tool to predict drug response. United Eur. Gastroenterol. J. 2020. [Google Scholar] [CrossRef] [Green Version]
- Boj, S.F.; Hwang, C.I.; Baker, L.A.; Chio, I.I.; Engle, D.D.; Corbo, V.; Jager, M.; Ponz-Sarvise, M.; Tiriac, H.; Spector, M.S.; et al. Organoid models of human and mouse ductal pancreatic cancer. Cell 2015, 160, 324–338. [Google Scholar] [CrossRef] [Green Version]
- Seino, T.; Kawasaki, S.; Shimokawa, M.; Tamagawa, H.; Toshimitsu, K.; Fujii, M.; Ohta, Y.; Matano, M.; Nanki, K.; Kawasaki, K.; et al. Human Pancreatic Tumor Organoids Reveal Loss of Stem Cell Niche Factor Dependence during Disease Progression. Cell Stem Cell 2018, 22, 454–467 e456. [Google Scholar] [CrossRef] [Green Version]
- Hingorani, S.R.; Wang, L.; Multani, A.S.; Combs, C.; Deramaudt, T.B.; Hruban, R.H.; Rustgi, A.K.; Chang, S.; Tuveson, D.A. Trp53R172H and KrasG12D cooperate to promote chromosomal instability and widely metastatic pancreatic ductal adenocarcinoma in mice. Cancer Cell 2005, 7, 469–483. [Google Scholar] [CrossRef] [Green Version]
- Morton, C.L.; Houghton, P.J. Establishment of human tumor xenografts in immunodeficient mice. Nat. Protoc. 2007, 2, 247–250. [Google Scholar] [CrossRef]
- Robinson, M.D.; McCarthy, D.J.; Smyth, G.K. edgeR: A Bioconductor package for differential expression analysis of digital gene expression data. Bioinformatics 2010, 26, 139–140. [Google Scholar] [CrossRef] [Green Version]
- Deer, E.L.; Gonzalez-Hernandez, J.; Coursen, J.D.; Shea, J.E.; Ngatia, J.; Scaife, C.L.; Firpo, M.A.; Mulvihill, S.J. Phenotype and genotype of pancreatic cancer cell lines. Pancreas 2010, 39, 425–435. [Google Scholar] [CrossRef] [PubMed] [Green Version]
- Loukopoulos, P.; Kanetaka, K.; Takamura, M.; Shibata, T.; Sakamoto, M.; Hirohashi, S. Orthotopic transplantation models of pancreatic adenocarcinoma derived from cell lines and primary tumors and displaying varying metastatic activity. Pancreas 2004, 29, 193–203. [Google Scholar] [CrossRef] [PubMed]
- Gutschner, T.; Hammerle, M.; Pazaitis, N.; Bley, N.; Fiskin, E.; Uckelmann, H.; Heim, A.; Grobeta, M.; Hofmann, N.; Geffers, R.; et al. Insulin-like growth factor 2 mRNA-binding protein 1 (IGF2BP1) is an important protumorigenic factor in hepatocellular carcinoma. Hepatology 2014, 59, 1900–1911. [Google Scholar] [CrossRef] [PubMed]
- Livak, K.J.; Schmittgen, T.D. Analysis of relative gene expression data using real-time quantitative PCR and the 2(-Delta Delta C(T)) Method. Methods 2001, 25, 402–408. [Google Scholar] [CrossRef]
- Grund, S.E.; Polycarpou-Schwarz, M.; Luo, C.; Eichmuller, S.B.; Diederichs, S. Rare Drosha splice variants are deficient in microRNA processing but do not affect general microRNA expression in cancer cells. Neoplasia 2012, 14, 238–248. [Google Scholar] [CrossRef] [Green Version]
- Dobin, A.; Davis, C.A.; Schlesinger, F.; Drenkow, J.; Zaleski, C.; Jha, S.; Batut, P.; Chaisson, M.; Gingeras, T.R. STAR: Ultrafast universal RNA-seq aligner. Bioinformatics 2013, 29, 15–21. [Google Scholar] [CrossRef]
- Liao, Y.; Smyth, G.K.; Shi, W. featureCounts: An efficient general purpose program for assigning sequence reads to genomic features. Bioinformatics 2014, 30, 923–930. [Google Scholar] [CrossRef] [Green Version]
- Love, M.I.; Huber, W.; Anders, S. Moderated estimation of fold change and dispersion for RNA-seq data with DESeq2. Genome Biol. 2014, 15, 550. [Google Scholar] [CrossRef] [Green Version]


© 2020 by the authors. Licensee MDPI, Basel, Switzerland. This article is an open access article distributed under the terms and conditions of the Creative Commons Attribution (CC BY) license (http://creativecommons.org/licenses/by/4.0/).
Share and Cite
Dorn, A.; Glaß, M.; Neu, C.T.; Heydel, B.; Hüttelmaier, S.; Gutschner, T.; Haemmerle, M. LINC00261 Is Differentially Expressed in Pancreatic Cancer Subtypes and Regulates a Pro-Epithelial Cell Identity. Cancers 2020, 12, 1227. https://doi.org/10.3390/cancers12051227
Dorn A, Glaß M, Neu CT, Heydel B, Hüttelmaier S, Gutschner T, Haemmerle M. LINC00261 Is Differentially Expressed in Pancreatic Cancer Subtypes and Regulates a Pro-Epithelial Cell Identity. Cancers. 2020; 12(5):1227. https://doi.org/10.3390/cancers12051227
Chicago/Turabian StyleDorn, Agnes, Markus Glaß, Carolin T. Neu, Beate Heydel, Stefan Hüttelmaier, Tony Gutschner, and Monika Haemmerle. 2020. "LINC00261 Is Differentially Expressed in Pancreatic Cancer Subtypes and Regulates a Pro-Epithelial Cell Identity" Cancers 12, no. 5: 1227. https://doi.org/10.3390/cancers12051227