Proteome Profiling Uncovers an Autoimmune Response Signature That Reflects Ovarian Cancer Pathogenesis

 , , , , , , , and
Abstract
:1. Introduction
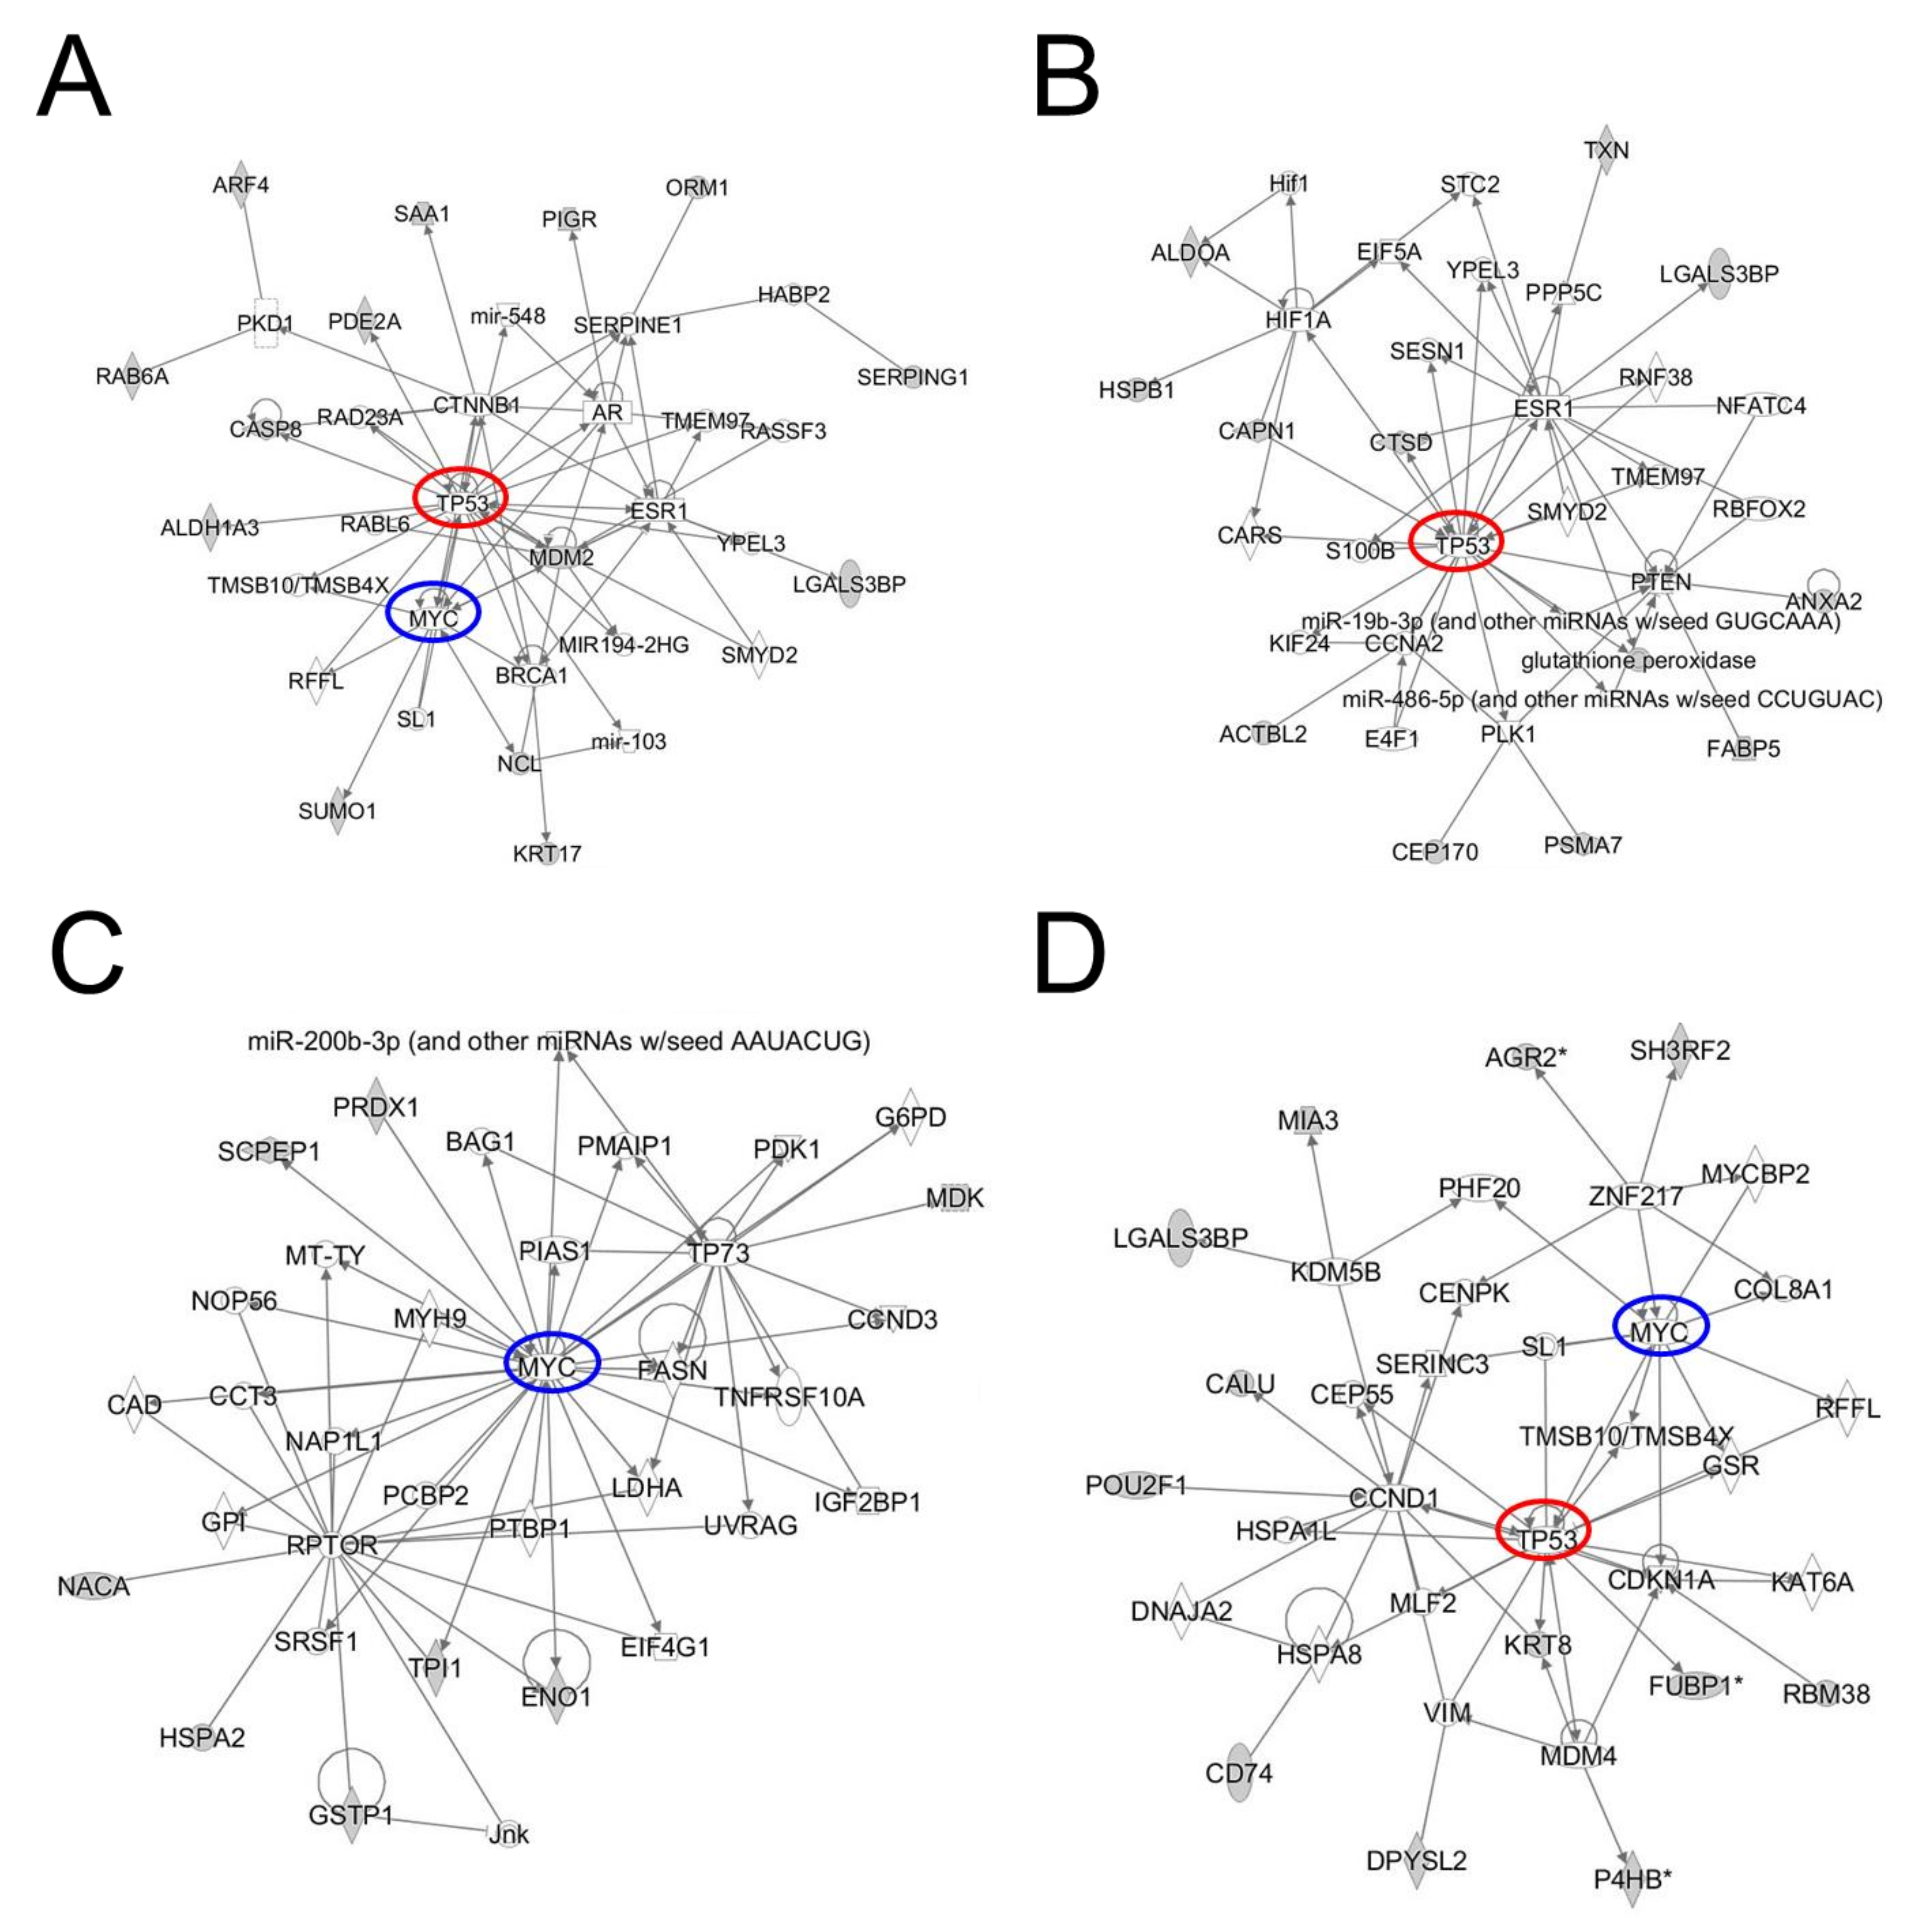
2. Results
2.1. Recombinant Protein Array-Based Ovarian Cancer Autoantibody Signature
2.2. Circulating Immunoglobulin (Ig)-Bound Protein Signature in Ovarian Cancer
2.3. Immunopeptidome Analysis
3. Discussion
4. Materials and Methods
4.1. Recombinant Protein Array Analysis
4.2. Analysis of Circulating Ig-Bound Proteins in Ovarian Cancer
4.3. Immunopeptidome Analysis
4.4. Mass Spectrometry Analysis
4.5. Immunoprecipitation (IP) and Western Blot Analysis
4.6. Ingenuity Pathway Analysis (IPA)
4.7. Statistical Analysis
5. Conclusions
Supplementary Materials
Author Contributions
Funding
Conflicts of Interest
References
- Tsou, P.; Katayama, H.; Ostrin, E.J.; Hanash, S.M. The Emerging Role of B Cells in Tumor Immunity. Cancer Res. 2016, 76, 5597–5601. [Google Scholar] [CrossRef] [Green Version]
- Hanash, S. Harnessing immunity for cancer marker discovery. Nat. Biotechnol. 2003, 21, 37–38. [Google Scholar] [CrossRef] [PubMed]
- Pereira-Faca, S.R.; Kuick, R.; Puravs, E.; Zhang, Q.; Krasnoselsky, A.L.; Phanstiel, D.; Qiu, J.; Misek, D.E.; Hinderer, R.; Tammemagi, M.; et al. Identification of 14-3-3 theta as an antigen that induces a humoral response in lung cancer. Cancer Res. 2007, 67, 12000–12006. [Google Scholar] [CrossRef] [PubMed] [Green Version]
- Lheureux, S.; Braunstein, M.; Oza, A.M. Epithelial ovarian cancer: Evolution of management in the era of precision medicine. CA Cancer J. Clin. 2019, 69, 280–304. [Google Scholar] [CrossRef] [PubMed] [Green Version]
- Simmons, A.R.; Fourkala, E.O.; Gentry-Maharaj, A.; Ryan, A.; Sutton, M.N.; Baggerly, K.; Zheng, H.; Lu, K.H.; Jacobs, I.; Skates, S.; et al. Complementary Longitudinal Serum Biomarkers to CA125 for Early Detection of Ovarian Cancer. Cancer Prev. Res. 2019, 12, 391–400. [Google Scholar] [CrossRef] [PubMed] [Green Version]
- Yang, W.L.; Gentry-Maharaj, A.; Simmons, A.; Ryan, A.; Fourkala, E.O.; Lu, Z.; Baggerly, K.A.; Zhao, Y.; Lu, K.H.; Bowtell, D.; et al. Elevation of TP53 Autoantibody Before CA125 in Preclinical Invasive Epithelial Ovarian Cancer. Clin. Cancer Res. 2017, 23, 5912–5922. [Google Scholar] [CrossRef] [PubMed] [Green Version]
- Yang, W.L.; Lu, Z.; Guo, J.; Fellman, B.M.; Ning, J.; Lu, K.H.; Menon, U.; Kobayashi, M.; Hanash, S.M.; Celestino, J.; et al. Human epididymis protein 4 antigen-autoantibody complexes complement cancer antigen 125 for detecting early-stage ovarian cancer. Cancer 2019, 126, 725–736. [Google Scholar] [CrossRef]
- Mintz, P.J.; Kim, J.; Do, K.A.; Wang, X.; Zinner, R.G.; Cristofanilli, M.; Arap, M.A.; Hong, W.K.; Troncoso, P.; Logothetis, C.J.; et al. Fingerprinting the circulating repertoire of antibodies from cancer patients. Nat. Biotechnol. 2003, 21, 57–63. [Google Scholar] [CrossRef]
- Antony, F.; Deantonio, C.; Cotella, D.; Soluri, M.F.; Tarasiuk, O.; Raspagliesi, F.; Adorni, F.; Piazza, S.; Ciani, Y.; Santoro, C.; et al. High-throughput assessment of the antibody profile in ovarian cancer ascitic fluids. Oncoimmunology 2019, 8, e1614856. [Google Scholar] [CrossRef] [Green Version]
- Hudson, M.E.; Pozdnyakova, I.; Haines, K.; Mor, G.; Snyder, M. Identification of differentially expressed proteins in ovarian cancer using high-density protein microarrays. Proc. Natl. Acad. Sci. USA 2007, 104, 17494–17499. [Google Scholar] [CrossRef] [Green Version]
- Anderson, K.S.; Cramer, D.W.; Sibani, S.; Wallstrom, G.; Wong, J.; Park, J.; Qiu, J.; Vitonis, A.; LaBaer, J. Autoantibody signature for the serologic detection of ovarian cancer. J. Proteome Res. 2015, 14, 578–586. [Google Scholar] [CrossRef] [PubMed] [Green Version]
- Wilson, A.L.; Moffitt, L.R.; Duffield, N.; Rainczuk, A.; Jobling, T.W.; Plebanski, M.; Stephens, A.N. Autoantibodies against HSF1 and CCDC155 as Biomarkers of Early-Stage, High-Grade Serous Ovarian Cancer. Cancer Epidemiol. Biomark. Prev. 2018, 27, 183–192. [Google Scholar] [CrossRef] [PubMed] [Green Version]
- Qiu, J.; Choi, G.; Li, L.; Wang, H.; Pitteri, S.J.; Pereira-Faca, S.R.; Krasnoselsky, A.L.; Randolph, T.W.; Omenn, G.S.; Edelstein, C.; et al. Occurrence of autoantibodies to annexin I, 14-3-3 theta and LAMR1 in prediagnostic lung cancer sera. J. Clin. Oncol. 2008, 26, 5060–5066. [Google Scholar] [CrossRef] [PubMed] [Green Version]
- Ladd, J.J.; Chao, T.; Johnson, M.M.; Qiu, J.; Chin, A.; Israel, R.; Pitteri, S.J.; Mao, J.; Wu, M.; Amon, L.M.; et al. Autoantibody signatures involving glycolysis and splicesome proteins precede a diagnosis of breast cancer among postmenopausal women. Cancer Res. 2013, 73, 1502–1513. [Google Scholar] [CrossRef] [PubMed] [Green Version]
- Katayama, H.; Boldt, C.; Ladd, J.J.; Johnson, M.M.; Chao, T.; Capello, M.; Suo, J.; Mao, J.; Manson, J.E.; Prentice, R.; et al. An Autoimmune Response Signature Associated with the Development of Triple-Negative Breast Cancer Reflects Disease Pathogenesis. Cancer Res. 2015, 75, 3246–3254. [Google Scholar] [CrossRef] [PubMed] [Green Version]
- Yan, Y.; Sun, N.; Wang, H.; Kobayashi, M.; Ladd, J.J.; Long, J.P.; Lo, K.C.; Patel, J.; Sullivan, E.; Albert, T.; et al. Whole Genome-Derived Tiled Peptide Arrays Detect Prediagnostic Autoantibody Signatures in Non-Small-Cell Lung Cancer. Cancer Res. 2019, 79, 1549–1557. [Google Scholar] [CrossRef] [PubMed] [Green Version]
- Yamaguchi, A.; Urano, T.; Goi, T.; Feig, L.A. An Eps homology (EH) domain protein that binds to the Ral-GTPase target, RalBP1. J. Biol. Chem. 1997, 272, 31230–31234. [Google Scholar] [CrossRef] [Green Version]
- Xu, J.; Zhou, Z.; Zeng, L.; Huang, Y.; Zhao, W.; Cheng, C.; Xu, M.; Xie, Y.; Mao, Y. Cloning, expression and characterization of a novel human REPS1 gene. Biochim. Biophys. Acta 2001, 1522, 118–121. [Google Scholar] [CrossRef]
- Capello, M.; Vykoukal, J.V.; Katayama, H.; Bantis, L.E.; Wang, H.; Kundnani, D.L.; Aguilar-Bonavides, C.; Aguilar, M.; Tripathi, S.C.; Dhillon, D.S.; et al. Exosomes harbor B cell targets in pancreatic adenocarcinoma and exert decoy function against complement-mediated cytotoxicity. Nat. Commun. 2019, 10, 254. [Google Scholar] [CrossRef]
- Follia, L.; Ferrero, G.; Mandili, G.; Beccuti, M.; Giordano, D.; Spadi, R.; Satolli, M.A.; Evangelista, A.; Katayama, H.; Hong, W.; et al. Integrative Analysis of Novel Metabolic Subtypes in Pancreatic Cancer Fosters New Prognostic Biomarkers. Front. Oncol. 2019, 9, 115. [Google Scholar] [CrossRef]
- Kobayashi, M.; Katayama, H.; Fahrmann, J.; Hanash, S.M. Development of autoantibody signatures for common cancers. Semin Immunol. 2020. [Google Scholar] [CrossRef] [PubMed]
- Faca, V.M.; Ventura, A.P.; Fitzgibbon, M.P.; Pereira-Faca, S.R.; Pitteri, S.J.; Green, A.E.; Ireton, R.C.; Zhang, Q.; Wang, H.; O’Briant, K.C.; et al. Proteomic analysis of ovarian cancer cells reveals dynamic processes of protein secretion and shedding of extra-cellular domains. PLoS ONE 2008, 3, e2425. [Google Scholar] [CrossRef] [PubMed] [Green Version]
- Tripathi, S.C.; Peters, H.L.; Taguchi, A.; Katayama, H.; Wang, H.; Momin, A.; Jolly, M.K.; Celiktas, M.; Rodriguez-Canales, J.; Liu, H.; et al. Immunoproteasome deficiency is a feature of non-small cell lung cancer with a mesenchymal phenotype and is associated with a poor outcome. Proc. Natl. Acad. Sci. USA 2016, 113, E1555–E1564. [Google Scholar] [CrossRef] [PubMed] [Green Version]
- Wang, P.; Sidney, J.; Dow, C.; Mothe, B.; Sette, A.; Peters, B. A systematic assessment of MHC class II peptide binding predictions and evaluation of a consensus approach. PLoS Comput. Biol. 2008, 4, e1000048. [Google Scholar] [CrossRef] [Green Version]
- Katchman, B.A.; Chowell, D.; Wallstrom, G.; Vitonis, A.F.; LaBaer, J.; Cramer, D.W.; Anderson, K.S. Autoantibody biomarkers for the detection of serous ovarian cancer. Gynecol. Oncol. 2017, 146, 129–136. [Google Scholar] [CrossRef]
- Sun, H.; Shi, J.X.; Zhang, H.F.; Xing, M.T.; Li, P.; Dai, L.P.; Luo, C.L.; Wang, X.; Wang, P.; Ye, H.; et al. Serum autoantibodies against a panel of 15 tumor-associated antigens in the detection of ovarian cancer. Tumour Biol. 2017, 39. [Google Scholar] [CrossRef] [Green Version]
- Li, L.; Wang, K.; Dai, L.; Wang, P.; Peng, X.X.; Zhang, J.Y. Detection of autoantibodies to multiple tumor-associated antigens in the immunodiagnosis of ovarian cancer. Mol. Med. Rep. 2008, 1, 589–594. [Google Scholar] [CrossRef] [Green Version]
- Zhang, L.; Yuan, Y.; Lu, K.H.; Zhang, L. Identification of recurrent focal copy number variations and their putative targeted driver genes in ovarian cancer. BMC Bioinform. 2016, 17, 222. [Google Scholar] [CrossRef] [Green Version]
- National Cancer Genome Atlas. Comprehensive molecular portraits of human breast tumours. Nature 2012, 490, 61–70. [Google Scholar] [CrossRef] [Green Version]
- Pan, J.; Zheng, Q.Z.; Li, Y.; Yu, L.L.; Wu, Q.W.; Zheng, J.Y.; Pan, X.J.; Xie, B.S.; Wu, Y.A.; Qian, J.; et al. Discovery and Validation of a Serologic Autoantibody Panel for Early Diagnosis of Esophageal Squamous Cell Carcinoma. Cancer Epidemiol. Biomark. Prev. 2019, 28, 1454–1460. [Google Scholar] [CrossRef] [Green Version]
- Pan, J.; Song, G.; Chen, D.; Li, Y.; Liu, S.; Hu, S.; Rosa, C.; Eichinger, D.; Pino, I.; Zhu, H.; et al. Identification of Serological Biomarkers for Early Diagnosis of Lung Cancer Using a Protein Array-Based Approach. Mol. Cell. Proteom. 2017, 16, 2069–2078. [Google Scholar] [CrossRef] [PubMed] [Green Version]
- Kunizaki, M.; Fukuda, A.; Wakata, K.; Tominaga, T.; Nonaka, T.; Miyazaki, T.; Matsumoto, K.; Sumida, Y.; Hidaka, S.; Yasutake, T.; et al. Clinical Significance of Serum p53 Antibody in the Early Detection and Poor Prognosis of Gastric Cancer. Anticancer Res. 2017, 37, 1979–1984. [Google Scholar] [CrossRef] [PubMed]
- Liu, Y.; Liao, Y.; Xiang, L.; Jiang, K.; Li, S.; Huangfu, M.; Sun, S. A panel of autoantibodies as potential early diagnostic serum biomarkers in patients with breast cancer. Int. J. Clin. Oncol. 2017, 22, 291–296. [Google Scholar] [CrossRef] [PubMed]
- Shimada, H.; Ochiai, T.; Nomura, F. Titration of serum p53 antibodies in 1085 patients with various types of malignant tumors: A multiinstitutional analysis by the Japan p53 Antibody Research Group. Cancer 2003, 97, 682–689. [Google Scholar] [CrossRef]
- Wang, P.; Qin, J.; Ye, H.; Li, L.; Wang, X.; Zhang, J. Using a panel of multiple tumor-associated antigens to enhance the autoantibody detection in the immunodiagnosis of ovarian cancer. J. Cell. Biochem. 2019, 120, 3091–3100. [Google Scholar] [CrossRef]
- Kutteh, W.H.; Miller, D.S.; Mathis, J.M. Immunologic characterization of tumor markers in human ovarian cancer cell lines. J. Soc. Gynecol. Investig. 1996, 3, 216–222. [Google Scholar] [CrossRef]
- Dai, C.; Gu, W. p53 post-translational modification: Deregulated in tumorigenesis. Trends Mol. Med. 2010, 16, 528–536. [Google Scholar] [CrossRef] [PubMed] [Green Version]
- Takagaki, Y.; Ryner, L.C.; Manley, J.L. Four factors are required for 3′-end cleavage of pre-mRNAs. Genes Dev. 1989, 3, 1711–1724. [Google Scholar] [CrossRef] [Green Version]
- Deka, P.; Rajan, P.K.; Perez-Canadillas, J.M.; Varani, G. Protein and RNA dynamics play key roles in determining the specific recognition of GU-rich polyadenylation regulatory elements by human Cstf-64 protein. J. Mol. Biol. 2005, 347, 719–733. [Google Scholar] [CrossRef]
- Perez Canadillas, J.M.; Varani, G. Recognition of GU-rich polyadenylation regulatory elements by human CstF-64 protein. EMBO J. 2003, 22, 2821–2830. [Google Scholar] [CrossRef] [Green Version]
- Aragaki, M.; Takahashi, K.; Akiyama, H.; Tsuchiya, E.; Kondo, S.; Nakamura, Y.; Daigo, Y. Characterization of a cleavage stimulation factor, 3′ pre-RNA, subunit 2, 64 kDa (CSTF2) as a therapeutic target for lung cancer. Clin. Cancer Res. 2011, 17, 5889–5900. [Google Scholar] [CrossRef] [PubMed] [Green Version]
- Lim, K.H.; Baines, A.T.; Fiordalisi, J.J.; Shipitsin, M.; Feig, L.A.; Cox, A.D.; Der, C.J.; Counter, C.M. Activation of RalA is critical for Ras-induced tumorigenesis of human cells. Cancer Cell 2005, 7, 533–545. [Google Scholar] [CrossRef] [PubMed] [Green Version]
- Zhang, H.; Li, W. Dysregulation of micro-143-3p and BALBP1 contributes to the pathogenesis of the development of ovarian carcinoma. Oncol. Rep. 2016, 36, 3605–3610. [Google Scholar] [CrossRef] [PubMed]
- Satoh, M.; Takano, S.; Sogawa, K.; Noda, K.; Yoshitomi, H.; Ishibashi, M.; Mogushi, K.; Takizawa, H.; Otsuka, M.; Shimizu, H.; et al. Immune-complex level of cofilin-1 in sera is associated with cancer progression and poor prognosis in pancreatic cancer. Cancer Sci. 2017, 108, 795–803. [Google Scholar] [CrossRef] [PubMed]
- Katayama, H.; Tsou, P.; Kobayashi, M.; Capello, M.; Wang, H.; Esteva, F.; Disis, M.L.; Hanash, S. A plasma protein derived TGFbeta signature is a prognostic indicator in triple negative breast cancer. NPJ Precis. Oncol. 2019, 3, 10. [Google Scholar] [CrossRef] [PubMed]
- Unver, N.; Delgado, O.; Zeleke, K.; Cumpian, A.; Tang, X.; Caetano, M.S.; Wang, H.; Katayama, H.; Yu, H.; Szabo, E.; et al. Reduced IL-6 levels and tumor-associated phospho-STAT3 are associated with reduced tumor development in a mouse model of lung cancer chemoprevention with myo-inositol. Int. J. Cancer 2018, 142, 1405–1417. [Google Scholar] [CrossRef] [Green Version]


| Gene | Accession | AUC | Wilcox t (2-Sided) |
|---|---|---|---|
| CSTF2 | NM_001325 | 0.8471 | 0.0002 |
| REPS1 | BC021211 | 0.8265 | 0.0004 |
| EFCBP2 | BC016979 | 0.8176 | 0.0007 |
| SSBP2 | BC017020 | 0.7824 | 0.0028 |
| MAP2K3 | NM_002756 | 0.7882 | 0.003 |
| PSMC4 | NM_153001 | 0.7868 | 0.0031 |
| MGC4473 | NM_080719 | 0.7853 | 0.0033 |
| RALBP1 | NM_006788 | 0.7676 | 0.0048 |
| AMMECR1 | BC060813 | 0.7647 | 0.0064 |
| WAC | BC004258 | 0.7588 | 0.0077 |
| DCX | NM_178152 | 0.7515 | 0.0096 |
| HN1 | NM_016185 | 0.7471 | 0.0097 |
| RYBP | BC014959 | 0.7471 | 0.0097 |
| C13orf3 | BC048988 | 0.7441 | 0.0107 |
| LOC51334 | BC038838 | 0.7441 | 0.0107 |
| FHL2 | NM_001450 | 0.7382 | 0.0141 |
| CLPP | NM_006012 | 0.7382 | 0.0141 |
| KIAA0174 | BC004359 | 0.7382 | 0.0141 |
| WEE1 | NM_003390 | 0.7353 | 0.0141 |
| LOC199964 | BC029775 | 0.7368 | 0.0148 |
| GAPD | NM_002046 | 0.7324 | 0.0154 |
| HIPK4 | NM_144685 | 0.7324 | 0.0154 |
| MCTP2 | BC025708 | 0.7324 | 0.0167 |
| CDC42EP4 | BC010451 | 0.7294 | 0.0169 |
| MAP3K4 | NM_005922 | 0.7279 | 0.0189 |
| Gene | Newly Diagnosis Early Stage plasma set 1 | Newly Diagnosis Early Stage Plasma Set 2 | Newly Diagnosis Early Stage Plasma Set 3 | |||||||||||||||
|---|---|---|---|---|---|---|---|---|---|---|---|---|---|---|---|---|---|---|
| Case Pool 1 | Case Pool 2 | Case Pool 3 | Case Pool 4 | Control | Control | Case Pool 5 | Case Pool 6 | Case Pool 7 | Case Pool 8 | Control | Control | Case Pool 9 | Case pool 10 | Case Pool 11 | Case Pool 12 | Control | Control | |
| ALDH1A3 | 0 | 3 | 0 | 0 | 0 | 0 | 0 | 0 | 0 | 0 | 0 | 0 | 0 | 3 | 0 | 0 | 0 | 0 |
| AMPD3 | 0 | 0 | 0 | 0 | 0 | 0 | 0 | 0 | 1 | 0 | 0 | 0 | 0 | 0 | 6 | 0 | 0 | 0 |
| ARF4 | 0 | 0 | 0 | 0 | 0 | 0 | 4 | 0 | 0 | 0 | 0 | 0 | 0 | 0 | 3 | 0 | 0 | 0 |
| BSCL2 | 0 | 1 | 0 | 0 | 0 | 0 | 0 | 0 | 0 | 1 | 0 | 0 | 0 | 0 | 0 | 0 | 0 | 0 |
| C1R | 13 | 0 | 12 | 33 | 35 | 32 | 0 | 0 | 0 | 40 | 0 | 0 | 11 | 0 | 39 | 0 | 0 | 12 |
| CASP8 | 0 | 6 | 0 | 0 | 0 | 0 | 0 | 0 | 0 | 0 | 0 | 0 | 0 | 0 | 1 | 0 | 0 | 0 |
| CCDC53 | 0 | 0 | 0 | 0 | 0 | 0 | 0 | 1 | 0 | 0 | 0 | 0 | 0 | 2 | 0 | 0 | 0 | 0 |
| EPS8L2 | 1 | 0 | 0 | 0 | 0 | 0 | 0 | 0 | 0 | 0 | 0 | 0 | 0 | 0 | 4 | 3 | 0 | 0 |
| IGHV2-5 | 4 | 7 | 7 | 10 | 6 | 4 | 4 | 0 | 0 | 1 | 3 | 0 | 1 | 7 | 28 | 4 | 5 | 2 |
| KRT17 | 35 | 0 | 0 | 0 | 11 | 1 | 33 | 0 | 0 | 0 | 0 | 0 | 121 | 23 | 53 | 291 | 143 | 344 |
| LGALS3BP | 32 | 12 | 22 | 17 | 20 | 14 | 17 | 0 | 19 | 18 | 11 | 8 | 10 | 32 | 56 | 61 | 37 | 9 |
| MDM2 | 1 | 0 | 0 | 0 | 0 | 0 | 0 | 0 | 0 | 0 | 0 | 0 | 0 | 0 | 2 | 0 | 0 | 0 |
| NCL | 0 | 0 | 0 | 1 | 0 | 0 | 0 | 0 | 0 | 0 | 0 | 0 | 0 | 2 | 0 | 0 | 0 | 0 |
| ORM1 | 15 | 0 | 22 | 19 | 1 | 15 | 24 | 24 | 29 | 44 | 21 | 19 | 38 | 28 | 84 | 29 | 28 | 45 |
| PDE2A | 2 | 1 | 0 | 0 | 0 | 0 | 0 | 0 | 0 | 0 | 1 | 0 | 0 | 0 | 3 | 0 | 0 | 0 |
| PIGR | 6 | 5 | 12 | 0 | 0 | 0 | 0 | 0 | 0 | 0 | 0 | 0 | 10 | 0 | 17 | 18 | 0 | 14 |
| RAB6A | 0 | 0 | 0 | 0 | 0 | 0 | 1 | 0 | 0 | 0 | 0 | 0 | 0 | 2 | 0 | 1 | 0 | 0 |
| RWDD4 | 0 | 1 | 1 | 0 | 0 | 0 | 0 | 0 | 0 | 0 | 0 | 0 | 0 | 0 | 0 | 1 | 0 | 0 |
| SAA1 | 2 | 0 | 2 | 3 | 0 | 3 | 0 | 0 | 0 | 3 | 0 | 0 | 0 | 0 | 21 | 10 | 0 | 0 |
| SERPING1 | 48 | 9 | 45 | 44 | 0 | 38 | 18 | 0 | 5 | 23 | 26 | 13 | 10 | 8 | 52 | 41 | 0 | 15 |
| SUMO1 | 0 | 0 | 1 | 0 | 0 | 0 | 0 | 2 | 0 | 0 | 0 | 0 | 0 | 0 | 0 | 0 | 0 | 0 |
| TANGO6 | 0 | 0 | 0 | 0 | 0 | 0 | 1 | 0 | 0 | 0 | 0 | 0 | 0 | 0 | 0 | 1 | 0 | 0 |
| TSTA3 | 0 | 1 | 0 | 0 | 0 | 0 | 0 | 0 | 1 | 0 | 0 | 0 | 0 | 0 | 0 | 0 | 0 | 0 |
| VPS26B | 1 | 0 | 0 | 0 | 0 | 0 | 0 | 0 | 0 | 0 | 1 | 0 | 0 | 1 | 0 | 0 | 0 | 0 |
| Gene | Pre-Diagnostic Ovarian Cancer Plasma set | |||||
|---|---|---|---|---|---|---|
| Case 1 | Case 2 | Case 3 | Case 4 | Control Pool 1 | Control Pool 2 | |
| ACTBL2 | 1 | 0 | 0 | 1 | 0 | 0 |
| ALDOA | 0 | 0 | 0 | 1 | 0 | 0 |
| BLMH | 0 | 0 | 0 | 1 | 0 | 0 |
| CALML5 | 0 | 0 | 0 | 7 | 0 | 0 |
| CANT1 | 1 | 0 | 0 | 0 | 0 | 0 |
| CAPN1 | 0 | 0 | 1 | 0 | 0 | 0 |
| CEP170 | 1 | 0 | 0 | 0 | 0 | 0 |
| CTSD | 0 | 0 | 0 | 4 | 0 | 0 |
| DBI | 0 | 0 | 1 | 0 | 0 | 0 |
| DOHH | 1 | 0 | 0 | 0 | 0 | 0 |
| EEF1A1 | 5 | 0 | 0 | 1 | 0 | 0 |
| ENO1 | 6 | 0 | 0 | 13 | 0 | 0 |
| EPS8L2 | 0 | 0 | 4 | 0 | 0 | 0 |
| FABP5 | 4 | 0 | 0 | 6 | 0 | 0 |
| GLOD4 | 0 | 0 | 0 | 1 | 0 | 0 |
| GSTP1 | 2 | 0 | 0 | 0 | 0 | 0 |
| HMOX2 | 0 | 0 | 1 | 0 | 0 | 0 |
| HSPA2 | 1 | 0 | 0 | 0 | 0 | 0 |
| HSPA8 | 0 | 0 | 0 | 3 | 0 | 0 |
| HSPB1 | 10 | 0 | 0 | 0 | 0 | 0 |
| HSPH1 | 3 | 0 | 0 | 0 | 0 | 0 |
| KRT7 | 0 | 0 | 0 | 6 | 0 | 0 |
| KRT84 | 6 | 0 | 0 | 5 | 0 | 0 |
| LARP7 | 0 | 1 | 0 | 0 | 0 | 0 |
| LGALS3BP | 0 | 0 | 7 | 0 | 0 | 0 |
| LYPLA1 | 0 | 0 | 2 | 0 | 0 | 0 |
| MANSC1 | 0 | 0 | 0 | 1 | 0 | 0 |
| MDK | 1 | 0 | 0 | 0 | 0 | 0 |
| MLX | 0 | 0 | 1 | 0 | 0 | 0 |
| NACA | 0 | 0 | 1 | 0 | 0 | 0 |
| PKM | 23 | 0 | 0 | 23 | 0 | 0 |
| PNP | 0 | 0 | 0 | 3 | 0 | 0 |
| POTEF | 3 | 0 | 0 | 0 | 0 | 0 |
| PRDX1 | 0 | 0 | 0 | 6 | 0 | 0 |
| PSMA7 | 0 | 0 | 0 | 1 | 0 | 0 |
| SCPEP1 | 0 | 0 | 1 | 0 | 0 | 0 |
| SERPING1 | 0 | 0 | 3 | 0 | 0 | 0 |
| STRBP | 1 | 0 | 0 | 0 | 0 | 0 |
| TIMM50 | 0 | 0 | 1 | 0 | 0 | 0 |
| TPI1 | 1 | 0 | 0 | 1 | 0 | 0 |
| TUBA1B | 10 | 0 | 0 | 0 | 0 | 0 |
| TUBA3C | 5 | 0 | 0 | 0 | 0 | 0 |
| TXN | 5 | 0 | 0 | 1 | 0 | 0 |
| UBB | 0 | 0 | 0 | 4 | 0 | 0 |
| Sequence | Length | Gene |
|---|---|---|
| VNQRNRTYSSGSSGGSHPS | 19 | ABI2 |
| VERGGVVTSNPLGF | 14 | ACADVL |
| IVNTARPDEKAIMT | 14 | ACTN4 |
| IITAVNPATIGREKDME | 17 | AGGF1 |
| VYETTDKHLSPDGQYVPRIM | 20 | AGR2 |
| VYETTDKHLSPDGQYVPRIM | 20 | AGR2 |
| DAQLDAYNARMDTS | 14 | ALYREF |
| GRAGSQGQPAPGGRP | 15 | AMT |
| IQRTPKIQVYSRHPAENGKSNF | 22 | B2M |
| LTTDEYDGHSTYPSHQYQ | 18 | BLVRB |
| VLSSGKFYGDEEKDKGLQTSQD | 22 | CALR |
| SSGKFYGDEEKDKGLQTSQDARF | 23 | CALR |
| SSGKFYGDEEKDKGLQTSQDARF | 23 | CALR |
| FVGSQATDFGEAL | 13 | CALU |
| LNDMTPPVNPSRE | 13 | CANX |
| KESKLPGDKGLVL | 13 | CANX |
| EDPSSGLGVTKQDLGPVPM | 19 | CD74 |
| YGMDYATSKDAREPVVG | 17 | CHID1 |
| SVYTTTRSHLGAENNID | 17 | CLPTM1L |
| SITSVTSSVVSTSSNSSDNAP | 21 | DOCK5 |
| FQGTKAALAGGTTM | 14 | DPYSL2 |
| VQALDDTERGSGGFGSTGKN | 20 | DUT |
| LKKFSYRNAKNDDL | 14 | ERAP2 |
| AVTDFEPTQARMAF | 14 | ERAP2 |
| RVPFRRNKEEDLQSTKEERF | 20 | ERLEC1 |
| LHTKGALPLDTVTF | 14 | ERP29 |
| VKFDTQYPYGEKQDE | 15 | ERP29 |
| VAEVGISDYGDKLNM | 15 | ERP29 |
| AQTSPQGMPQHPPAPQGQ | 18 | FUBP1 |
| YAQTSPQGMPQHPPAPQGQ | 19 | FUBP1 |
| YYAQTSPQGMPQHPPAPQGQ | 20 | FUBP1 |
| DVGENNQGGKPLIM | 14 | GALNT3 |
| AAIRQAAKNGATGVEL | 16 | GDE1 |
| AQEVTYANLRPFEA | 14 | GGCX |
| EKLPGQGVHSQGQGPGANF | 19 | GLG1 |
| LASPEYVNLPINGNGKQ | 17 | GSTP1 |
| FLASPEYVNLPINGNGKQ | 18 | GSTP1 |
| IKKIADDKYNDTF | 13 | HSP90B1 |
| LHVTDTGVGMTREE | 14 | HSP90B1 |
| LVKNLGTIAKSGTSE | 15 | HSP90B1 |
| LHVTDTGVGMTREEL | 15 | HSP90B1 |
| VKNLGTIAKSGTSEF | 15 | HSP90B1 |
| FLNKMTEAQEDGQSTSEL | 18 | HSP90B1 |
| PFKVVEKKTKPYIQ | 14 | HSPA5 |
| IIANDQGNRITPSY | 14 | HSPA5 |
| IIANDQGNRITPSY | 14 | HSPA5 |
| IVLVGGSTRIPKIQQL | 16 | HSPA5 |
| TKMKETAEAYLGKKVTHA | 18 | HSPA5 |
| VDIGGGQTKTFAPEEISA | 18 | HSPA5 |
| VDIGGGQTKTFAPEEISAM | 19 | HSPA5 |
| VAYGAAVQAGVLSGDQDTGD | 20 | HSPA5 |
| AQQPAESRVSGISM | 14 | HSPG2 |
| LVETTSLPPRPETT | 14 | HSPG2 |
| LKENERFFGDSAASM | 15 | HYOU1 |
| TREVEEEPGIHSLKHNKRVL | 20 | HYOU1 |
| SVVSRTDSPSPTVL | 14 | KCT2 |
| RGGLGGGYGGASGMGGITA | 19 | KRT8 |
| VTDSSWSARKSQL | 13 | LGALS3BP |
| VSGMQHPGSAGGVY | 14 | LMAN1 |
| VSGMQHPGSAGGVY | 14 | LMAN1 |
| ILDSEKTSETAAKGVNTGGREPNTM | 25 | MIA3 |
| VVEKTAAARLPPSVS | 15 | MVB12A |
| PASFTKNYKPVVQTTGN | 17 | NCEH1 |
| IVIAKMDSTANEVE | 14 | P4HB |
| IVIAKMDSTANEVE | 14 | P4HB |
| LEGKIKPHLMSQEL | 14 | P4HB |
| IVIAKMDSTANEVEA | 15 | P4HB |
| FRPSHLTNKFEDKT | 14 | PDIA3 |
| FRPSHLTNKFEDKTVA | 16 | PDIA3 |
| IHTNWTGHGGTVSSSSYNA | 19 | PGD |
| LEGKVLPGVDALSNI | 15 | PGK1 |
| LAQHGSEYQSVKL | 13 | PLOD1 |
| FTVASASGAASTTTTASKAQ | 20 | POU2F1 |
| GLFGKTVPKTVDNF | 14 | PPIB |
| VSMANAGKDTNGSQF | 15 | PPIB |
| LQAGKKSLEDQVEM | 14 | PRKCSH |
| IELQAGKKSLEDQVEM | 16 | PRKCSH |
| VQYQAPQLQPDRMQ | 14 | RBM38 |
| YTKLGNPTRSEDL | 13 | RPN1 |
| AHLGGGSTSRATSFLL | 16 | RPN1 |
| IVETVYTHVLHPYPTQITQSEKQF | 24 | RPN1 |
| QIPPLVTTDCMIQDQGNASPRFIRC | 25 | SEC24D |
| VSTASGTQTVFPSK | 14 | SH3RF2 |
| PSGYKGRDCEVSLDSCSSGP | 20 | SLIT1 |
| SSLLRPQPEPQQE | 13 | TAPBP |
| AATPGLNGQMPAAQEG | 16 | TAPBP |
| AATPGLNGQMPAAQEGAVAF | 20 | TAPBP |
| AATPGLNGQMPAAQEGAVAF | 20 | TAPBP |
| VQAVSDPSSPQYGKY | 15 | TPP1 |
| FGKQFLRQNTGDDQTS | 16 | TVP23C |
| FLDPSGKVHPEIINENGNPSYKYF | 24 | TXNDC12 |
| FTHGIQSAAHFVM | 13 | TXNDC5 |
© 2020 by the authors. Licensee MDPI, Basel, Switzerland. This article is an open access article distributed under the terms and conditions of the Creative Commons Attribution (CC BY) license (http://creativecommons.org/licenses/by/4.0/).
Share and Cite
Kobayashi, M.; Katayama, H.; Irajizad, E.; Vykoukal, J.V.; Fahrmann, J.F.; Kundnani, D.L.; Yu, C.-Y.; Cai, Y.; Hsiao, F.C.; Yang, W.-L.; et al. Proteome Profiling Uncovers an Autoimmune Response Signature That Reflects Ovarian Cancer Pathogenesis. Cancers 2020, 12, 485. https://doi.org/10.3390/cancers12020485
Kobayashi M, Katayama H, Irajizad E, Vykoukal JV, Fahrmann JF, Kundnani DL, Yu C-Y, Cai Y, Hsiao FC, Yang W-L, et al. Proteome Profiling Uncovers an Autoimmune Response Signature That Reflects Ovarian Cancer Pathogenesis. Cancers. 2020; 12(2):485. https://doi.org/10.3390/cancers12020485
Chicago/Turabian StyleKobayashi, Makoto, Hiroyuki Katayama, Ehsan Irajizad, Jody V. Vykoukal, Johannes F. Fahrmann, Deepali L. Kundnani, Chuan-Yih Yu, Yining Cai, Fu Chung Hsiao, Wei-Lei Yang, and et al. 2020. "Proteome Profiling Uncovers an Autoimmune Response Signature That Reflects Ovarian Cancer Pathogenesis" Cancers 12, no. 2: 485. https://doi.org/10.3390/cancers12020485