Transcriptomics-Based Drug Repurposing Approach Identifies Novel Drugs against Sorafenib-Resistant Hepatocellular Carcinoma

Abstract
:Simple Summary
Abstract
1. Introduction
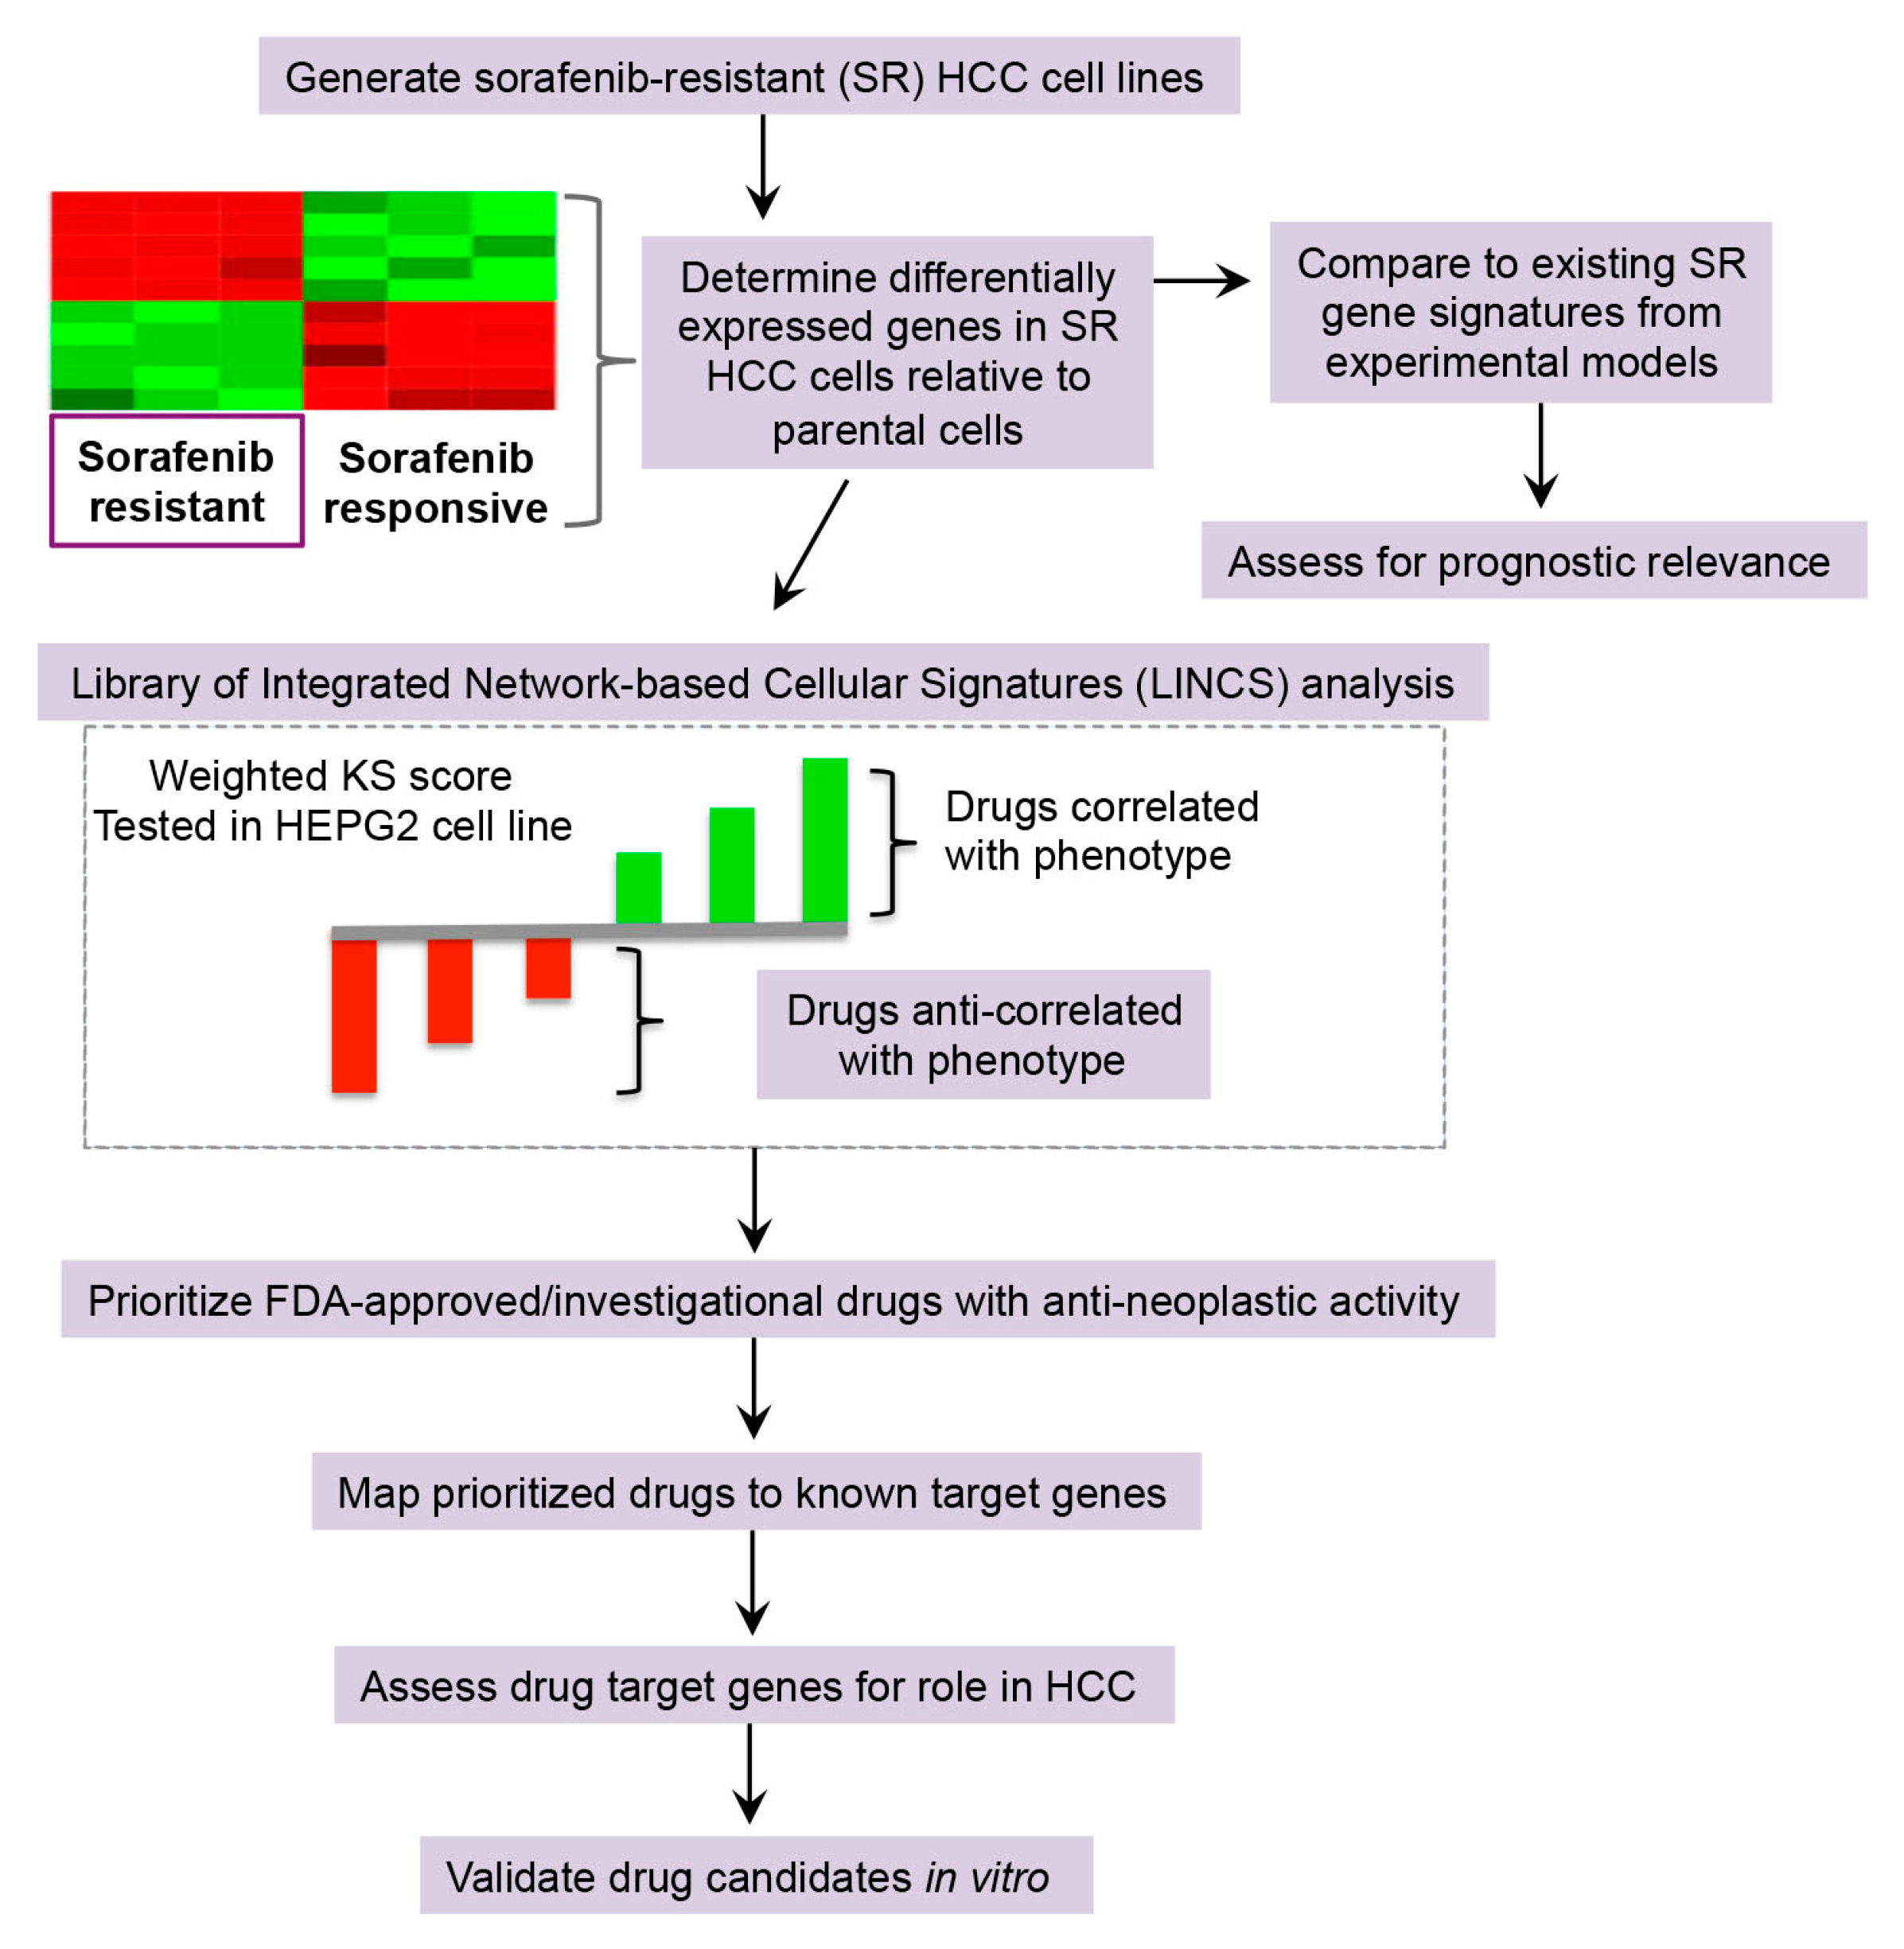
2. Results
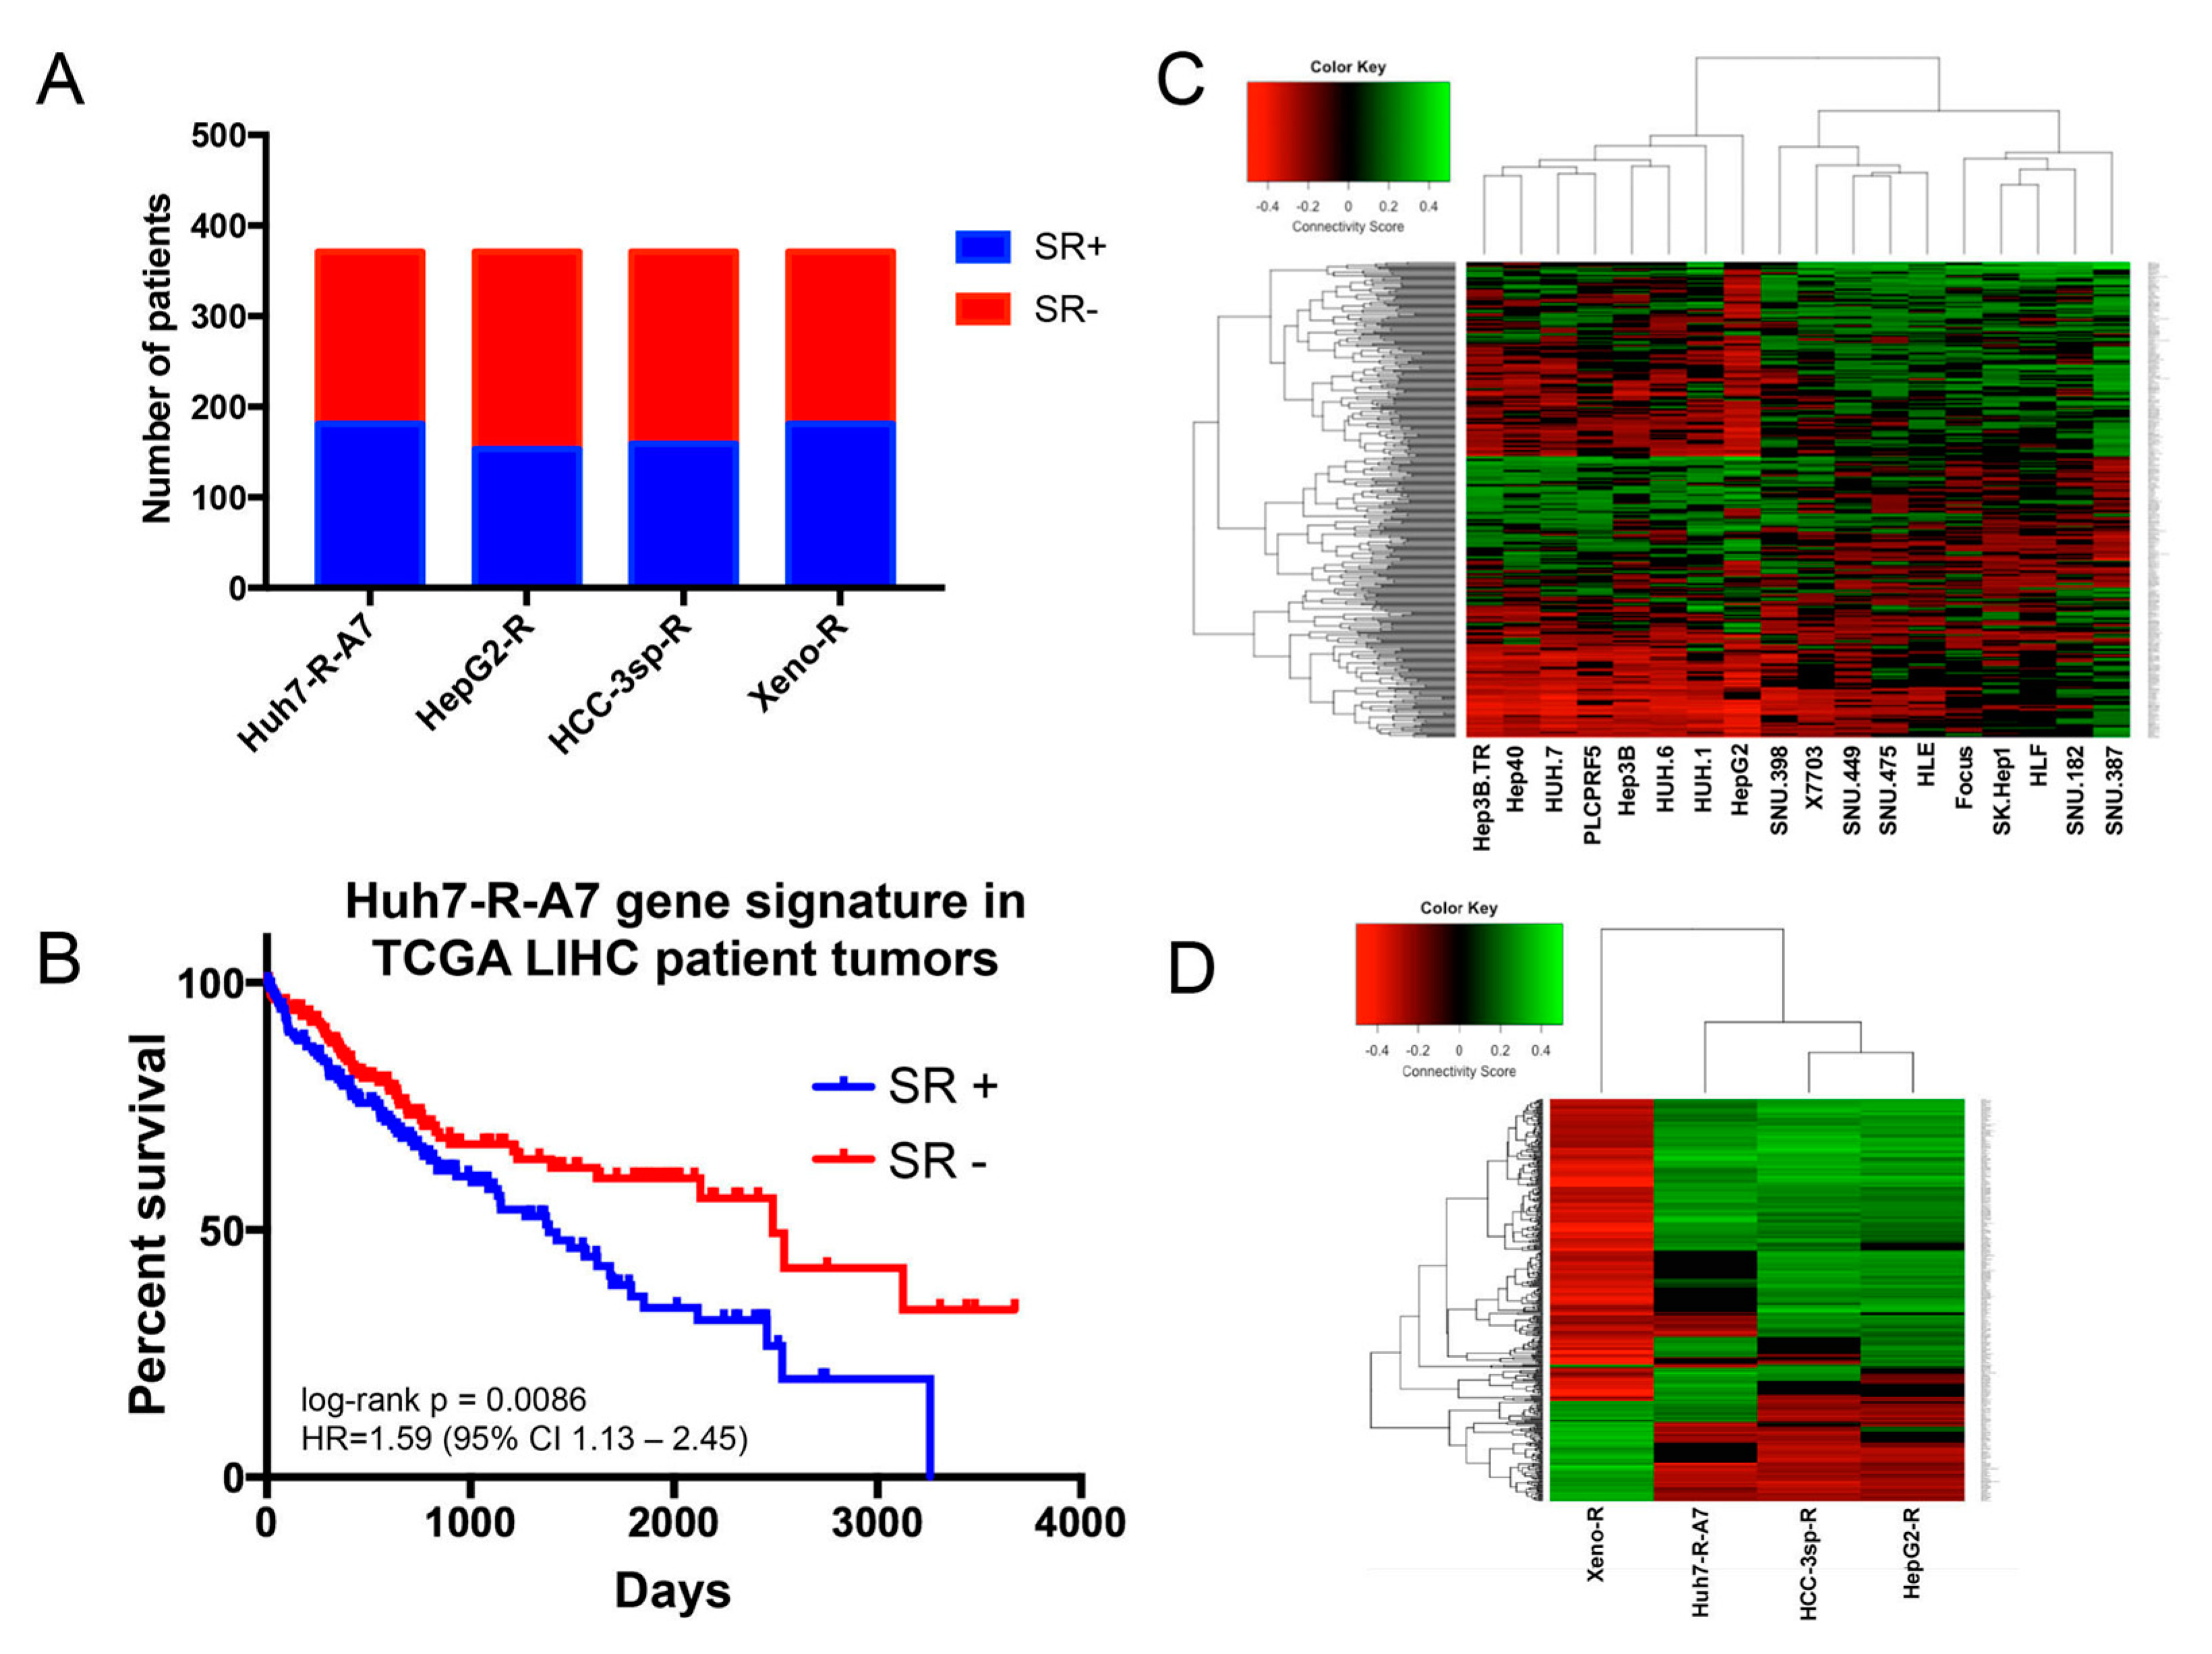
2.1. Comparison of Gene Signatures of Experimental Models of Sorafenib Resistance
2.1.1. Generation and Microarray Analysis of Sorafenib-Resistant HCC Cell Line
2.1.2. Evaluation of Experimental Models of HCC Sorafenib Resistance against HCC Patient Datasets
2.2. Drug Repurposing Predictions to Reverse Sorafenib Resistance in HCC
2.2.1. Library of Integrated Network-Based Cellular Signatures (LINCS) Analysis for Drug Repurposing Predictions
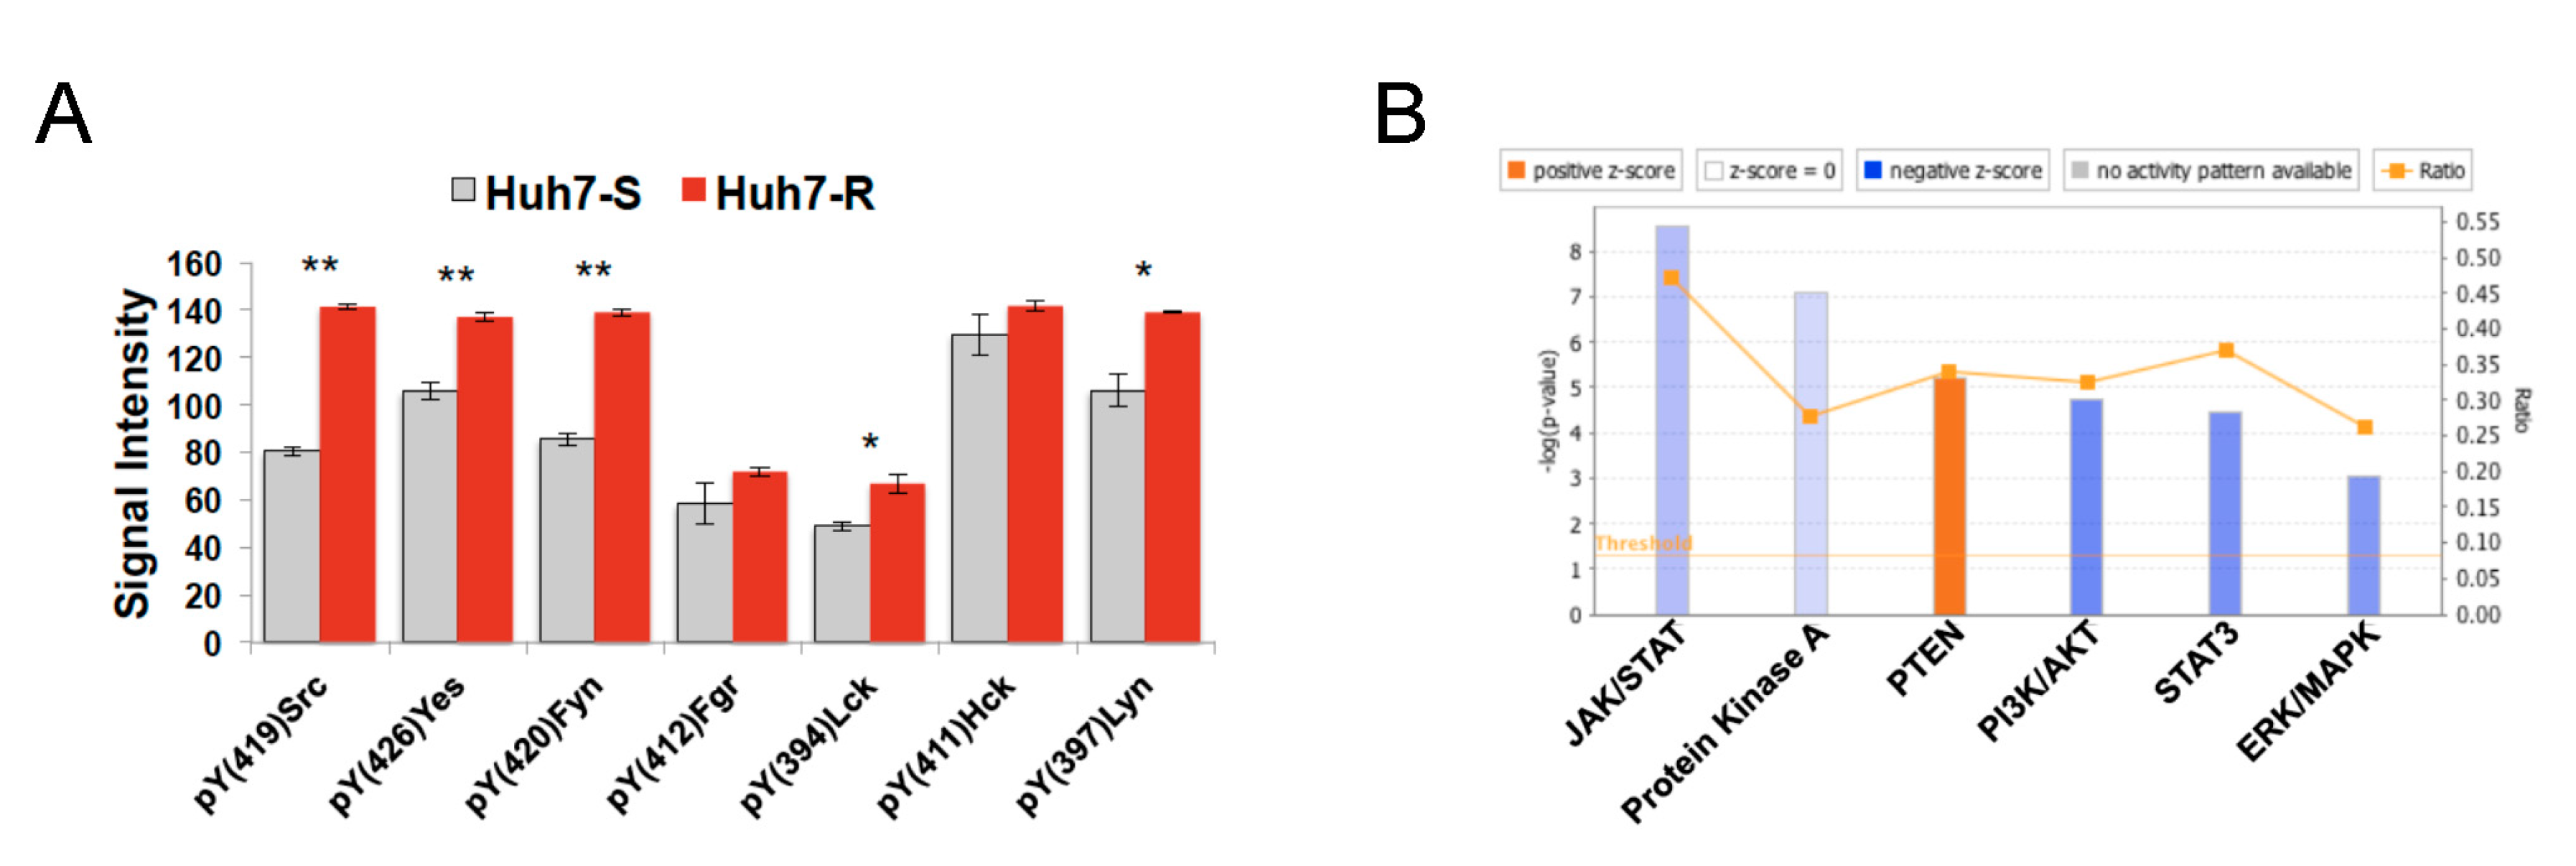
2.2.2. Drug Target Analysis and Candidate Prioritization
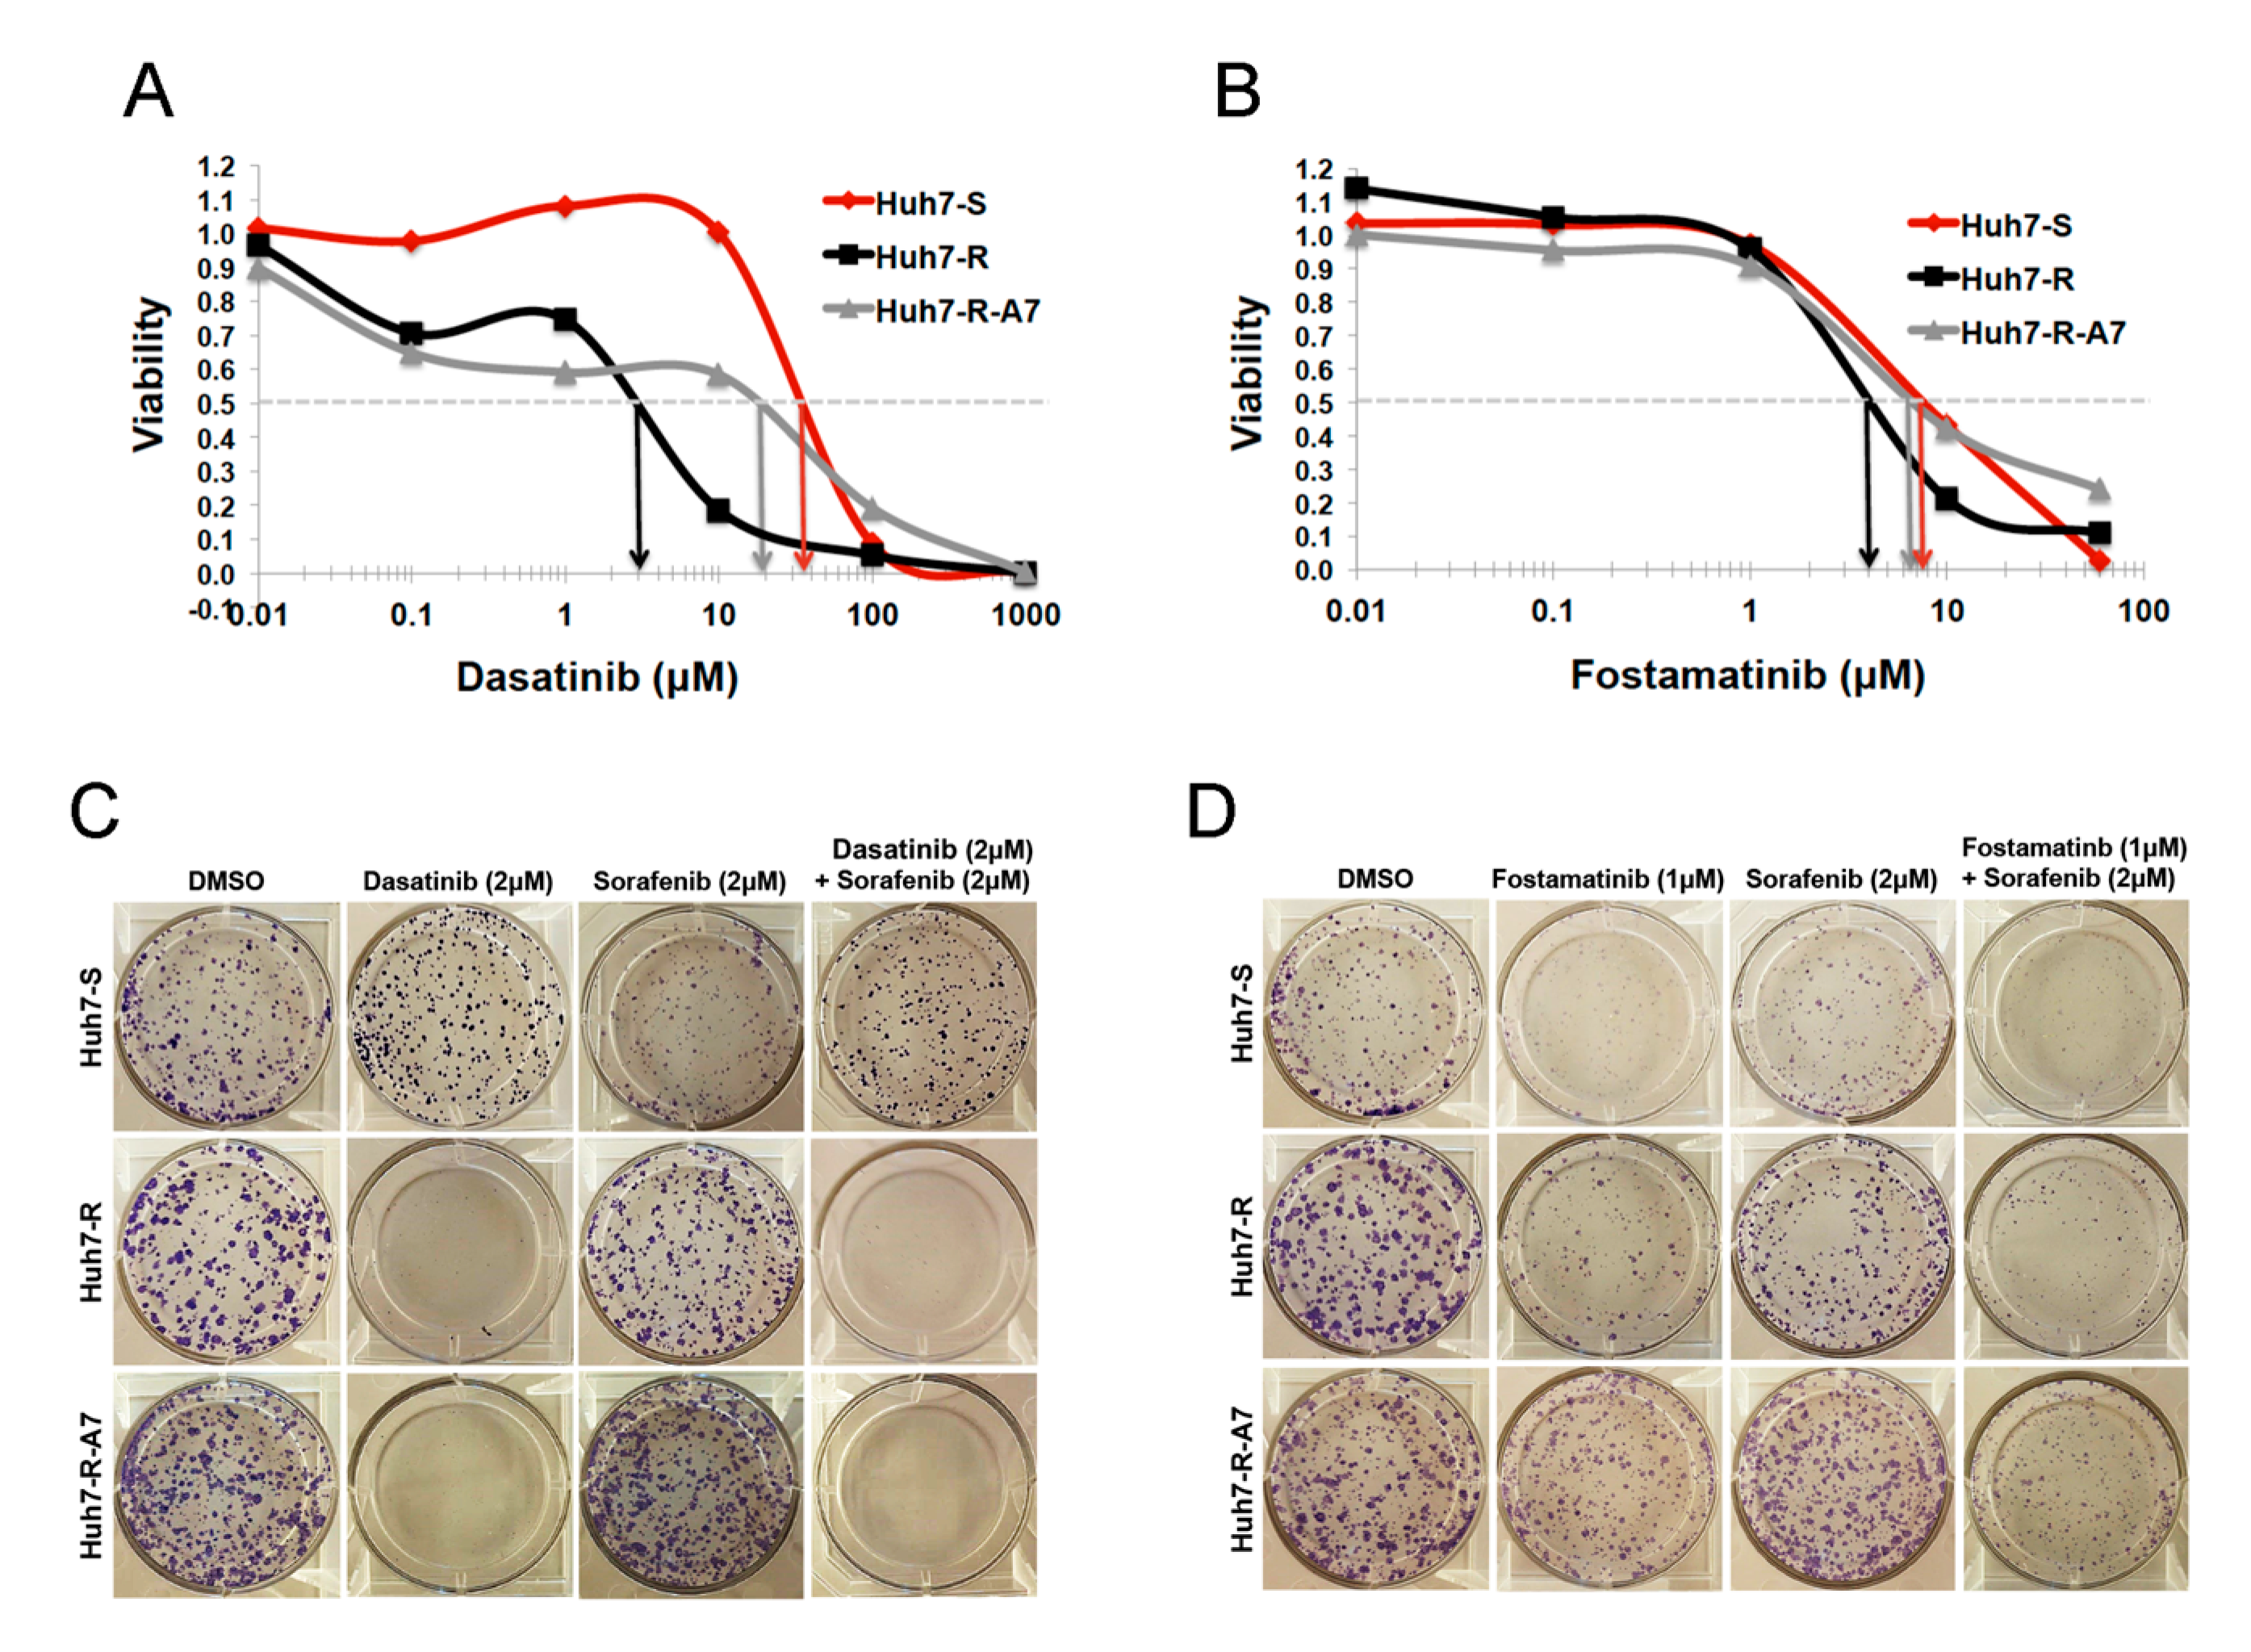
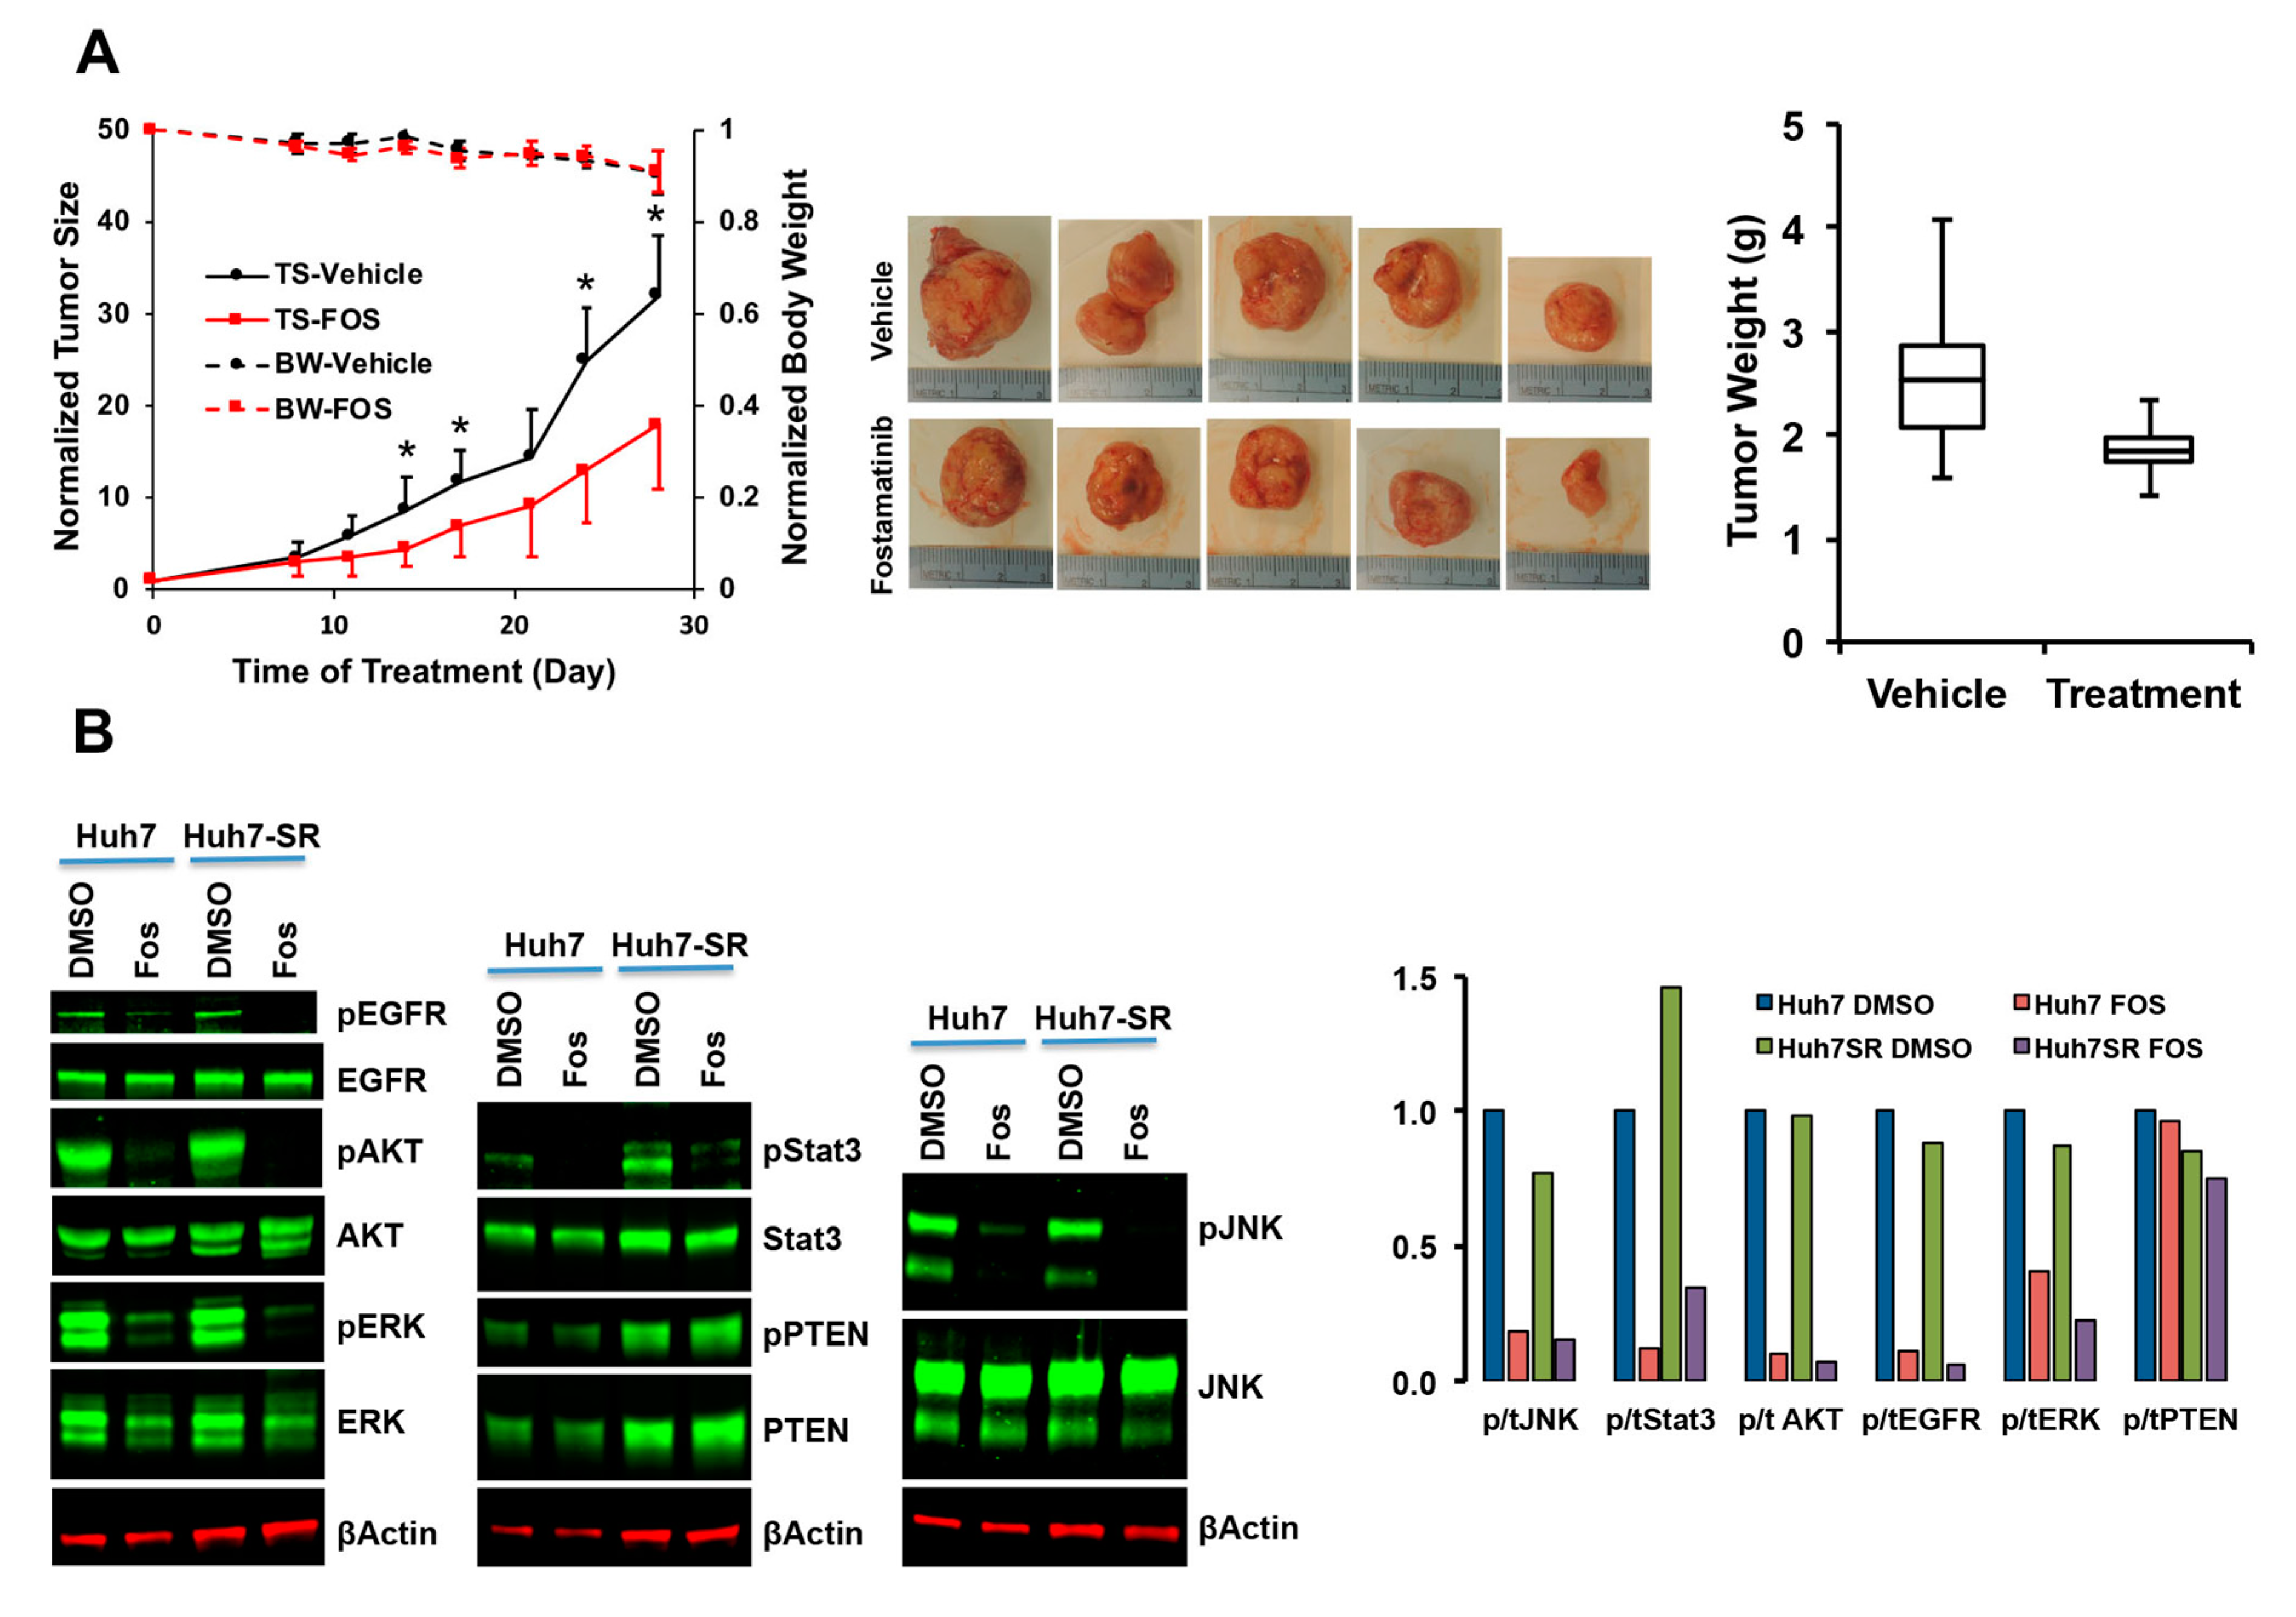
2.2.3. Validation of SRC-Inhibitor, Dasatinib, and SYK-Inhibitor, Fostamatinib, Alone and in Combination with Sorafenib
2.2.4. Characterization of Fostamatinib as Anti-HCC Drug
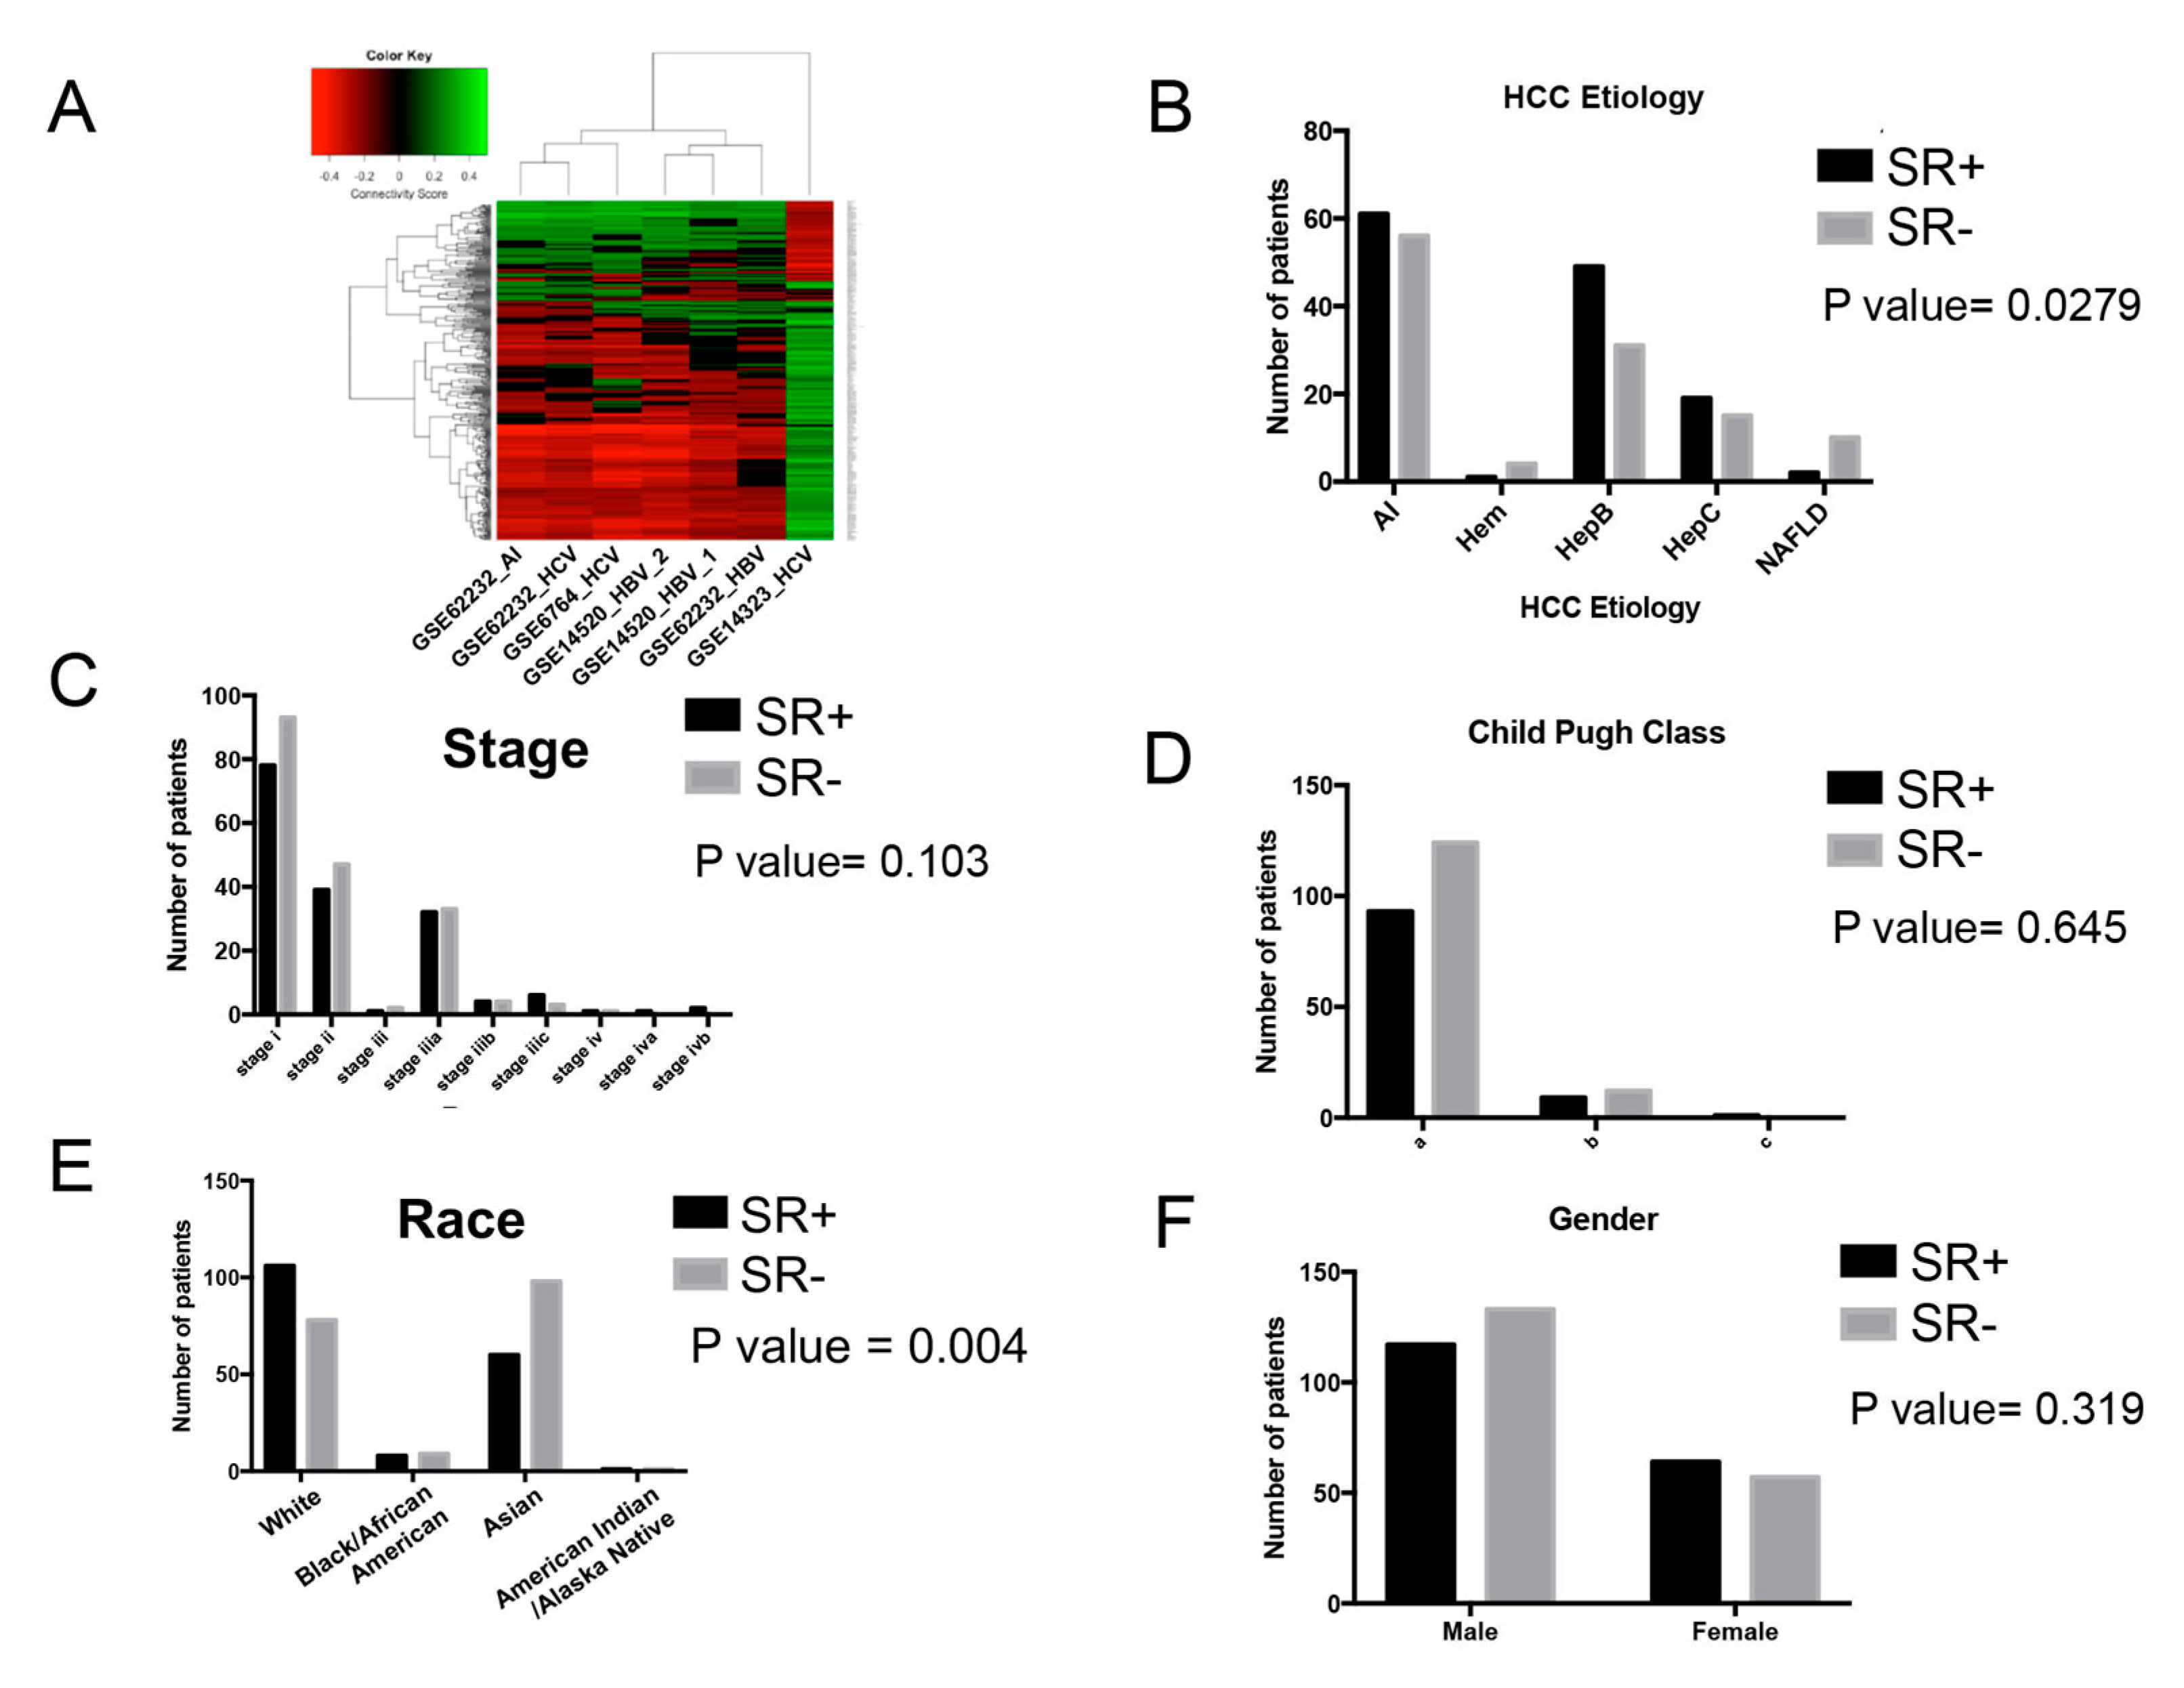
2.3. Analysis of Clinical and Demographic Factors
2.3.1. Effect of Etiology with Drug Repurposing Hypothesis
2.3.2. Association of Clinical and Demographic Factors with Sorafenib Resistance Signature
3. Discussion
4. Materials and Methods
4.1. Reagents (Drugs and Antibodies)
4.2. Cell Culture and Acquired Sorafenib Resistance
4.3. Cell Viability Assay
4.4. Colony Formation Assay
4.5. Mouse Strains, Animal Husbandry and Treatment
4.6. Western Blot Analysis
4.7. Human Phospho-Protein Array
4.8. Differential Gene Expression Analysis
4.8.1. Sorafenib Resistance Gene Expression Signatures
4.8.2. HCC Tumor Gene Expression Data
4.8.3. RNA-Seq Analysis of Fostamatinib-Treated Huh7-R cells
4.9. Library of Integrated Network-Based Cellular Signatures (LINCS) Analyses
4.10. Database Access: DrugBank, AACT, KEGG, Cell Miner, Beegle
4.11. Bioinformatics Analyses
4.12. Survival Analysis
4.13. Ethics Information for Publicly Available Datasets
5. Conclusions
Supplementary Materials
Author Contributions
Funding
Acknowledgments
Conflicts of Interest
References
- Global Burden of Disease Cancer Collaboration; Fitzmaurice, C.; Akinyemiju, T.F.; Al Lami, F.H.; Alam, T.; Alizadeh-Navaei, R.; Allen, C.; Alsharif, U.; Alvis-Guzman, N.; Amini, E.; et al. Global, Regional, and National Cancer Incidence, Mortality, Years of Life Lost, Years Lived With Disability, and Disability-Adjusted Life-Years for 29 Cancer Groups, 1990 to 2016: A Systematic Analysis for the Global Burden of Disease Study. JAMA Oncol. 2018, 4, 1553–1568. [Google Scholar] [CrossRef]
- Bruix, J.; Sherman, M.; American Association for the Study of Liver Diseases. Management of hepatocellular carcinoma: An update. Hepatology 2011, 53, 1020–1022. [Google Scholar] [CrossRef] [PubMed]
- Llovet, J.M.; Ricci, S.; Mazzaferro, V.; Hilgard, P.; Gane, E.; Blanc, J.F.; de Oliveira, A.C.; Santoro, A.; Raoul, J.L.; Forner, A.; et al. Sorafenib in advanced hepatocellular carcinoma. N. Engl. J. Med. 2008, 359, 378–390. [Google Scholar] [CrossRef] [PubMed]
- Villanueva, A.; Llovet, J.M. Second-line therapies in hepatocellular carcinoma: Emergence of resistance to sorafenib. Clin. Cancer Res. 2012, 18, 1824–1826. [Google Scholar] [CrossRef] [PubMed] [Green Version]
- Bruix, J.; Qin, S.; Merle, P.; Granito, A.; Huang, Y.H.; Bodoky, G.; Pracht, M.; Yokosuka, O.; Rosmorduc, O.; Breder, V.; et al. Regorafenib for patients with hepatocellular carcinoma who progressed on sorafenib treatment (RESORCE): A randomised, double-blind, placebo-controlled, phase 3 trial. Lancet 2017, 389, 56–66. [Google Scholar] [CrossRef] [Green Version]
- El-Khoueiry, A.B.; Sangro, B.; Yau, T.; Crocenzi, T.S.; Kudo, M.; Hsu, C.; Kim, T.Y.; Choo, S.P.; Trojan, J.; Welling, T.H.R.; et al. Nivolumab in patients with advanced hepatocellular carcinoma (CheckMate 040): An open-label, non-comparative, phase 1/2 dose escalation and expansion trial. Lancet 2017, 389, 2492–2502. [Google Scholar] [CrossRef]
- Zhu, A.X.; Finn, R.S.; Edeline, J.; Cattan, S.; Ogasawara, S.; Palmer, D.; Verslype, C.; Zagonel, V.; Fartoux, L.; Vogel, A.; et al. Pembrolizumab in patients with advanced hepatocellular carcinoma previously treated with sorafenib (KEYNOTE-224): A non-randomised, open-label phase 2 trial. Lancet Oncol. 2018, 19, 940–952. [Google Scholar] [CrossRef]
- Faivre, S.; Rimassa, L.; Finn, R.S. Molecular therapies for HCC: Looking outside the box. J. Hepatol. 2020, 72, 342–352. [Google Scholar] [CrossRef] [Green Version]
- Finn, R.S.; Ryoo, B.Y.; Merle, P.; Kudo, M.; Bouattour, M.; Lim, H.Y.; Breder, V.; Edeline, J.; Chao, Y.; Ogasawara, S.; et al. Pembrolizumab As Second-Line Therapy in Patients With Advanced Hepatocellular Carcinoma in KEYNOTE-240: A Randomized, Double-Blind, Phase III Trial. J. Clin. Oncol. 2020, 38, 193–202. [Google Scholar] [CrossRef]
- Kudo, M.; Finn, R.S.; Qin, S.; Han, K.H.; Ikeda, K.; Piscaglia, F.; Baron, A.; Park, J.W.; Han, G.; Jassem, J.; et al. Lenvatinib versus sorafenib in first-line treatment of patients with unresectable hepatocellular carcinoma: A randomised phase 3 non-inferiority trial. Lancet 2018, 391, 1163–1173. [Google Scholar] [CrossRef] [Green Version]
- Lv, J.; Zhu, B.; Zhang, L.; Xie, Q.; Zhuo, W. Detection and screening of small molecule agents for overcoming Sorafenib resistance of hepatocellular carcinoma: A bioinformatics study. Int. J. Clin. Exp. Med. 2015, 8, 2317–2325. [Google Scholar] [PubMed]
- Lamb, J.; Crawford, E.D.; Peck, D.; Modell, J.W.; Blat, I.C.; Wrobel, M.J.; Lerner, J.; Brunet, J.P.; Subramanian, A.; Ross, K.N.; et al. The Connectivity Map: Using gene-expression signatures to connect small molecules, genes, and disease. Science 2006, 313, 1929–1935. [Google Scholar] [CrossRef] [PubMed] [Green Version]
- Subramanian, A.; Tamayo, P.; Mootha, V.K.; Mukherjee, S.; Ebert, B.L.; Gillette, M.A.; Paulovich, A.; Pomeroy, S.L.; Golub, T.R.; Lander, E.S.; et al. Gene set enrichment analysis: A knowledge-based approach for interpreting genome-wide expression profiles. Proc. Natl. Acad. Sci. USA 2005, 102, 15545–15550. [Google Scholar] [CrossRef] [Green Version]
- Reyes, R.; Wani, N.A.; Ghoshal, K.; Jacob, S.T.; Motiwala, T. Sorafenib and 2-Deoxyglucose Synergistically Inhibit Proliferation of Both Sorafenib-Sensitive and -Resistant HCC Cells by Inhibiting ATP Production. Gene Expr. 2017, 17, 129–140. [Google Scholar] [CrossRef] [PubMed] [Green Version]
- van Malenstein, H.; Dekervel, J.; Verslype, C.; Van Cutsem, E.; Windmolders, P.; Nevens, F.; van Pelt, J. Long-term exposure to sorafenib of liver cancer cells induces resistance with epithelial-to-mesenchymal transition, increased invasion and risk of rebound growth. Cancer Lett. 2013, 329, 74–83. [Google Scholar] [CrossRef]
- van Zijl, F.; Mall, S.; Machat, G.; Pirker, C.; Zeillinger, R.; Weinhaeusel, A.; Bilban, M.; Berger, W.; Mikulits, W. A human model of epithelial to mesenchymal transition to monitor drug efficacy in hepatocellular carcinoma progression. Mol. Cancer Ther. 2011, 10, 850–860. [Google Scholar] [CrossRef] [Green Version]
- Tovar, V.; Cornella, H.; Moeini, A.; Vidal, S.; Hoshida, Y.; Sia, D.; Peix, J.; Cabellos, L.; Alsinet, C.; Torrecilla, S.; et al. Tumour initiating cells and IGF/FGF signalling contribute to sorafenib resistance in hepatocellular carcinoma. Gut 2017, 66, 530–540. [Google Scholar] [CrossRef]
- ElShal, S.; Tranchevent, L.C.; Sifrim, A.; Ardeshirdavani, A.; Davis, J.; Moreau, Y. Beegle: From literature mining to disease-gene discovery. Nucleic Acids Res. 2016, 44, e18. [Google Scholar] [CrossRef] [Green Version]
- Dropmann, A.; Dediulia, T.; Breitkopf-Heinlein, K.; Korhonen, H.; Janicot, M.; Weber, S.N.; Thomas, M.; Piiper, A.; Bertran, E.; Fabregat, I.; et al. TGF-beta1 and TGF-beta2 abundance in liver diseases of mice and men. Oncotarget 2016, 7, 19499–19518. [Google Scholar] [CrossRef] [Green Version]
- Ungerleider, N.; Han, C.; Zhang, J.; Yao, L.; Wu, T. TGFbeta signaling confers sorafenib resistance via induction of multiple RTKs in hepatocellular carcinoma cells. Mol. Carcinog. 2017, 56, 1302–1311. [Google Scholar] [CrossRef] [Green Version]
- Liang, Y.; Zheng, T.; Song, R.; Wang, J.; Yin, D.; Wang, L.; Liu, H.; Tian, L.; Fang, X.; Meng, X.; et al. Hypoxia-mediated sorafenib resistance can be overcome by EF24 through Von Hippel-Lindau tumor suppressor-dependent HIF-1alpha inhibition in hepatocellular carcinoma. Hepatology 2013, 57, 1847–1857. [Google Scholar] [CrossRef] [PubMed]
- Guo, W.; Liu, S.; Cheng, Y.; Lu, L.; Shi, J.; Xu, G.; Li, N.; Cheng, K.; Wu, M.; Cheng, S.; et al. ICAM-1-Related Noncoding RNA in Cancer Stem Cells Maintains ICAM-1 Expression in Hepatocellular Carcinoma. Clin. Cancer Res. 2016, 22, 2041–2050. [Google Scholar] [CrossRef] [PubMed] [Green Version]
- Liu, S.; Li, N.; Yu, X.; Xiao, X.; Cheng, K.; Hu, J.; Wang, J.; Zhang, D.; Cheng, S.; Liu, S. Expression of intercellular adhesion molecule 1 by hepatocellular carcinoma stem cells and circulating tumor cells. Gastroenterology 2013, 144, 1031–1041.e10. [Google Scholar] [CrossRef] [PubMed] [Green Version]
- Ma, N.; Chen, F.; Shen, S.L.; Chen, W.; Chen, L.Z.; Su, Q.; Zhang, L.J.; Bi, J.; Zeng, W.T.; Li, W.; et al. MicroRNA-129-5p inhibits hepatocellular carcinoma cell metastasis and invasion via targeting ETS1. Biochem. Biophys. Res. Commun. 2015, 461, 618–623. [Google Scholar] [CrossRef] [PubMed]
- Chen, M.H.; Yang, W.L.; Lin, K.T.; Liu, C.H.; Liu, Y.W.; Huang, K.W.; Chang, P.M.; Lai, J.M.; Hsu, C.N.; Chao, K.M.; et al. Gene expression-based chemical genomics identifies potential therapeutic drugs in hepatocellular carcinoma. PLoS ONE 2011, 6, e27186. [Google Scholar] [CrossRef] [Green Version]
- Woo, H.G.; Park, E.S.; Lee, J.S.; Lee, Y.H.; Ishikawa, T.; Kim, Y.J.; Thorgeirsson, S.S. Identification of potential driver genes in human liver carcinoma by genomewide screening. Cancer Res. 2009, 69, 4059–4066. [Google Scholar] [CrossRef] [Green Version]
- Chen, B.; Wei, W.; Ma, L.; Yang, B.; Gill, R.M.; Chua, M.S.; Butte, A.J.; So, S. Computational Discovery of Niclosamide Ethanolamine, a Repurposed Drug Candidate That Reduces Growth of Hepatocellular Carcinoma Cells In Vitro and in Mice by Inhibiting Cell Division Cycle 37 Signaling. Gastroenterology 2017, 152, 2022–2036. [Google Scholar] [CrossRef]
- Singh, R.; Masuda, E.S.; Payan, D.G. Discovery and development of spleen tyrosine kinase (SYK) inhibitors. J. Med. Chem. 2012, 55, 3614–3643. [Google Scholar] [CrossRef]
- Friedberg, J.W.; Sharman, J.; Sweetenham, J.; Johnston, P.B.; Vose, J.M.; Lacasce, A.; Schaefer-Cutillo, J.; De Vos, S.; Sinha, R.; Leonard, J.P.; et al. Inhibition of Syk with fostamatinib disodium has significant clinical activity in non-Hodgkin lymphoma and chronic lymphocytic leukemia. Blood 2010, 115, 2578–2585. [Google Scholar] [CrossRef]
- Herman, S.E.; Barr, P.M.; McAuley, E.M.; Liu, D.; Wiestner, A.; Friedberg, J.W. Fostamatinib inhibits B-cell receptor signaling, cellular activation and tumor proliferation in patients with relapsed and refractory chronic lymphocytic leukemia. Leukemia 2013, 27, 1769–1773. [Google Scholar] [CrossRef]
- Coopman, P.J.; Mueller, S.C. The Syk tyrosine kinase: A new negative regulator in tumor growth and progression. Cancer Lett. 2006, 241, 159–173. [Google Scholar] [CrossRef] [PubMed]
- Geahlen, R.L. Getting Syk: Spleen tyrosine kinase as a therapeutic target. Trends Pharmacol. Sci. 2014, 35, 414–422. [Google Scholar] [CrossRef] [PubMed] [Green Version]
- Bailet, O.; Fenouille, N.; Abbe, P.; Robert, G.; Rocchi, S.; Gonthier, N.; Denoyelle, C.; Ticchioni, M.; Ortonne, J.P.; Ballotti, R.; et al. Spleen tyrosine kinase functions as a tumor suppressor in melanoma cells by inducing senescence-like growth arrest. Cancer Res. 2009, 69, 2748–2756. [Google Scholar] [CrossRef] [PubMed] [Green Version]
- Ogane, S.; Onda, T.; Takano, N.; Yajima, T.; Uchiyama, T.; Shibahara, T. Spleen tyrosine kinase as a novel candidate tumor suppressor gene for human oral squamous cell carcinoma. Int. J. Cancer 2009, 124, 2651–2657. [Google Scholar] [CrossRef]
- Yuan, Y.; Mendez, R.; Sahin, A.; Dai, J.L. Hypermethylation leads to silencing of the SYK gene in human breast cancer. Cancer Res. 2001, 61, 5558–5561. [Google Scholar]
- Yuan, Y.; Wang, J.; Li, J.; Wang, L.; Li, M.; Yang, Z.; Zhang, C.; Dai, J.L. Frequent epigenetic inactivation of spleen tyrosine kinase gene in human hepatocellular carcinoma. Clin. Cancer Res. 2006, 12, 6687–6695. [Google Scholar] [CrossRef] [Green Version]
- Ito, Y.; Kawakatsu, H.; Takeda, T.; Sakon, M.; Nagano, H.; Sakai, T.; Miyoshi, E.; Noda, K.; Tsujimoto, M.; Wakasa, K.; et al. Activation of c-Src gene product in hepatocellular carcinoma is highly correlated with the indices of early stage phenotype. J. Hepatol. 2001, 35, 68–73. [Google Scholar] [CrossRef]
- Lau, G.M.; Lau, G.M.; Yu, G.L.; Gelman, I.H.; Gutowski, A.; Hangauer, D.; Fang, J.W. Expression of Src and FAK in hepatocellular carcinoma and the effect of Src inhibitors on hepatocellular carcinoma in vitro. Dig. Dis. Sci. 2009, 54, 1465–1474. [Google Scholar] [CrossRef]
- Yeatman, T.J. A renaissance for SRC. Nat. Rev. Cancer 2004, 4, 470–480. [Google Scholar] [CrossRef]
- Chang, A.Y.; Wang, M. Molecular mechanisms of action and potential biomarkers of growth inhibition of dasatinib (BMS-354825) on hepatocellular carcinoma cells. BMC Cancer 2013, 13, 267. [Google Scholar] [CrossRef] [Green Version]
- Finn, R.S.; Aleshin, A.; Dering, J.; Yang, P.; Ginther, C.; Desai, A.; Zhao, D.; von Euw, E.; Busuttil, R.W.; Slamon, D.J. Molecular subtype and response to dasatinib, an Src/Abl small molecule kinase inhibitor, in hepatocellular carcinoma cell lines in vitro. Hepatology 2013, 57, 1838–1846. [Google Scholar] [CrossRef] [PubMed]
- Takada, J.; Hidaka, H.; Nakazawa, T.; Kondo, M.; Numata, K.; Tanaka, K.; Matsunaga, K.; Okuse, C.; Kobayashi, S.; Morimoto, M.; et al. Modified response evaluation criteria in solid tumors is superior to response evaluation criteria in solid tumors for assessment of responses to sorafenib in patients with advanced hepatocellular carcinoma. BMC Res. Notes 2015, 8, 609. [Google Scholar] [CrossRef] [PubMed] [Green Version]
- Bruix, J.; Raoul, J.L.; Sherman, M.; Mazzaferro, V.; Bolondi, L.; Craxi, A.; Galle, P.R.; Santoro, A.; Beaugrand, M.; Sangiovanni, A.; et al. Efficacy and safety of sorafenib in patients with advanced hepatocellular carcinoma: Subanalyses of a phase III trial. J. Hepatol. 2012, 57, 821–829. [Google Scholar] [CrossRef] [PubMed] [Green Version]
- Irizarry, R.A.; Hobbs, B.; Collin, F.; Beazer-Barclay, Y.D.; Antonellis, K.J.; Scherf, U.; Speed, T.P. Exploration, normalization, and summaries of high density oligonucleotide array probe level data. Biostatistics 2003, 4, 249–264. [Google Scholar] [CrossRef] [Green Version]
- Yu, L.; Gulati, P.; Fernandez, S.; Pennell, M.; Kirschner, L.; Jarjoura, D. Fully moderated T-statistic for small sample size gene expression arrays. Stat. Appl. Genet. Mol. Biol. 2011, 10. [Google Scholar] [CrossRef]
- Schrodi, S.J. The Use of Multiplicity Corrections, Order Statistics and Generalized Family-Wise Statistics with Application to Genome-Wide Studies. PLoS ONE 2016, 11, e0154472. [Google Scholar] [CrossRef]
- Ritchie, M.E.; Phipson, B.; Wu, D.; Hu, Y.; Law, C.W.; Shi, W.; Smyth, G.K. limma powers differential expression analyses for RNA-sequencing and microarray studies. Nucleic Acids Res. 2015, 43, e47. [Google Scholar] [CrossRef]
- Solari, A.; Goeman, J.J. Minimally adaptive BH: A tiny but uniform improvement of the procedure of Benjamini and Hochberg. Biom. J. 2017, 59, 776–780. [Google Scholar] [CrossRef]
- Kim, D.; Langmead, B.; Salzberg, S.L. HISAT: A fast spliced aligner with low memory requirements. Nat. Methods 2015, 12, 357–360. [Google Scholar] [CrossRef] [Green Version]
- Liao, Y.; Smyth, G.K.; Shi, W. featureCounts: An efficient general purpose program for assigning sequence reads to genomic features. Bioinformatics 2014, 30, 923–930. [Google Scholar] [CrossRef] [Green Version]
- Robinson, M.D.; Oshlack, A. A scaling normalization method for differential expression analysis of RNA-seq data. Genome Biol. 2010, 11, R25. [Google Scholar] [CrossRef] [PubMed] [Green Version]
- Wu, H.; Miller, E.; Wijegunawardana, D.; Regan, K.; Payne, P.R.O.; Li, F. MD-Miner: A network-based approach for personalized drug repositioning. BMC Syst. Biol. 2017, 11, 86. [Google Scholar] [CrossRef] [PubMed]
- Wishart, D.S.; Knox, C.; Guo, A.C.; Shrivastava, S.; Hassanali, M.; Stothard, P.; Chang, Z.; Woolsey, J. DrugBank: A comprehensive resource for in silico drug discovery and exploration. Nucleic Acids Res. 2006, 34, D668–D672. [Google Scholar] [CrossRef] [PubMed]
- Kanehisa, M.; Goto, S.; Furumichi, M.; Tanabe, M.; Hirakawa, M. KEGG for representation and analysis of molecular networks involving diseases and drugs. Nucleic Acids Res. 2010, 38, D355–D360. [Google Scholar] [CrossRef] [Green Version]
- Staib, F.; Krupp, M.; Maass, T.; Itzel, T.; Weinmann, A.; Lee, J.S.; Schmidt, B.; Muller, M.; Thorgeirsson, S.S.; Galle, P.R.; et al. CellMinerHCC: A microarray-based expression database for hepatocellular carcinoma cell lines. Liver Int. 2014, 34, 621–631. [Google Scholar] [CrossRef]
- Hoshida, Y. Nearest template prediction: A single-sample-based flexible class prediction with confidence assessment. PLoS ONE 2010, 5, e15543. [Google Scholar] [CrossRef]
- Gao, J.; Aksoy, B.A.; Dogrusoz, U.; Dresdner, G.; Gross, B.; Sumer, S.O.; Sun, Y.; Jacobsen, A.; Sinha, R.; Larsson, E.; et al. Integrative analysis of complex cancer genomics and clinical profiles using the cBioPortal. Sci. Signal. 2013, 6, pl1. [Google Scholar] [CrossRef] [Green Version]
- Szklarczyk, D.; Franceschini, A.; Wyder, S.; Forslund, K.; Heller, D.; Huerta-Cepas, J.; Simonovic, M.; Roth, A.; Santos, A.; Tsafou, K.P.; et al. STRING v10: Protein-protein interaction networks, integrated over the tree of life. Nucleic Acids Res. 2015, 43, D447–D452. [Google Scholar] [CrossRef]
- Bastian, M.; Heymann, S.; Jacomy, M. Gephi: An open source software for exploring and manipulating networks. Icwsm 2009, 361–362. [Google Scholar]
- Chen, J.; Bardes, E.E.; Aronow, B.J.; Jegga, A.G. ToppGene Suite for gene list enrichment analysis and candidate gene prioritization. Nucleic Acids Res. 2009, 37, W305–W311. [Google Scholar] [CrossRef]
- Mas, V.R.; Maluf, D.G.; Archer, K.J.; Yanek, K.; Kong, X.; Kulik, L.; Freise, C.E.; Olthoff, K.M.; Ghobrial, R.M.; McIver, P.; et al. Genes involved in viral carcinogenesis and tumor initiation in hepatitis C virus-induced hepatocellular carcinoma. Mol. Med. 2009, 15, 85–94. [Google Scholar] [CrossRef] [PubMed]
- Roessler, S.; Long, E.L.; Budhu, A.; Chen, Y.; Zhao, X.; Ji, J.; Walker, R.; Jia, H.L.; Ye, Q.H.; Qin, L.X.; et al. Integrative genomic identification of genes on 8p associated with hepatocellular carcinoma progression and patient survival. Gastroenterology 2012, 142, 957–966.e12. [Google Scholar] [CrossRef] [PubMed] [Green Version]
- Wang, H.W.; Hsieh, T.H.; Huang, S.Y.; Chau, G.Y.; Tung, C.Y.; Su, C.W.; Wu, J.C. Forfeited hepatogenesis program and increased embryonic stem cell traits in young hepatocellular carcinoma (HCC) comparing to elderly HCC. BMC Genom. 2013, 14, 736. [Google Scholar] [CrossRef] [PubMed] [Green Version]
- Schulze, K.; Imbeaud, S.; Letouze, E.; Alexandrov, L.B.; Calderaro, J.; Rebouissou, S.; Couchy, G.; Meiller, C.; Shinde, J.; Soysouvanh, F.; et al. Exome sequencing of hepatocellular carcinomas identifies new mutational signatures and potential therapeutic targets. Nat. Genet. 2015, 47, 505–511. [Google Scholar] [CrossRef] [PubMed]
- Wurmbach, E.; Chen, Y.B.; Khitrov, G.; Zhang, W.; Roayaie, S.; Schwartz, M.; Fiel, I.; Thung, S.; Mazzaferro, V.; Bruix, J.; et al. Genome-wide molecular profiles of HCV-induced dysplasia and hepatocellular carcinoma. Hepatology 2007, 45, 938–947. [Google Scholar] [CrossRef] [PubMed]


| HCC Patient Dataset | GSE14323 | GSE14520_GPL571 | GSE14520_GPL3921 | GSE45267 | GSE62232 | GSE6764 | |
|---|---|---|---|---|---|---|---|
| Number HCC tumor/normal liver samples | n = 22 tumor/n = 19 normal | n = 38 tumor/n = 19 normal | n = 214 tumor/n = 220 normal | n = 31 tumor/n = 24 normal | n = 81 tumor/n = 10 normal | n = 35 tumor/n = 10 normal | |
| Microarray platform | Affymetrix Human Genome U133A 2.0 Array | Affymetrix Human Genome U133A 2.0 Array | Affymetrix HT Human Genome U133A Array | Affymetrix Human Genome U133 Plus 2.0 Array | Affymetrix Human Genome U133 Plus 2.0 Array | Affymetrix Human Genome U133 Plus 2.0 Array | |
| HCC etiology | HCV | HBV | HBV | n/a; HCC dx >40 yrs | AI, HBV, HCV | HCV | |
| Huh7-R-A7 (n = 368 genes) | % SR+ samples | 53.9% | 55.8% | 44.5% | 50.6% | 58.2% | 53.30% |
| P value | <0.0001 | 0.4225 | 0.019 | 0.5307 | 0.0397 | 0.073 | |
| Sensitivity | 0.56 (95% CI: 0.37–0.72) | 0.53 (95% CI: 0.30–0.75) | 0.47 (95% CI: 0.38–0.56) | 0.43 (95% CI: 0.27–0.61) | 0.42 (95% CI: 0.29–0.57) | 0.61 (95% CI: 0.39–0.80) | |
| Specificity | 1.0 (95% CI: 0.82–1.0) | 0.67 (95% CI: 0.35–0.88) | 0.70 (95% CI: 0.60–0.76) | 0.69 (95% CI: 0.44–0.86) | 1.0 (95% CI: 0.68–1.0) | 0.86 (95% CI: 0.49–0.99) | |
| HepG2-R (n = 1147 genes) | % SR+ samples | 32.2% | 20.9% | 22.5% | 24.1% | 27.5% | 30.7% |
| P value | 0.018 | 0.0405 | <0.0001 | <0.0001 | 0.0212 | 0.1139 | |
| Sensitivity | 0.42 (95% CI: 0.26–0.59) | 0.54 (95% CI: 0.29–0.77) | 0.53 (95% CI: 0.45–0.60) | 0.57 (95% CI: 0.41–0.72) | 0.42 (95% CI: 0.31–0.55) | 0.68 (95% CI: 0.46–0.85) | |
| Specificity | 0.93 (95% CI: 0.70–1.0) | 0.88 (95% CI: 0.64–0.98) | 0.90 (95% CI: 0.85–0.94) | 0.97 (95% CI: 0.84–1.0) | 1.0 (95% CI: 0.87–1.0) | 0.67 (95% CI: 0.35–0.88) | |
| HCC-3sp-R (n = 847 genes) | % SR+ samples | 31.0% | 23.3% | 25.6% | 31.0% | 28.6% | 26.7% |
| P value | 0.0007 | 0.0538 | <0.0001 | 0.0168 | 0.0443 | 0.0443 | |
| Sensitivity | 0.45 (95% CI: 0.28–0.63) | 0.50 (95% CI: 0.28–0.72) | 0.46 (95% CI: 0.39–0.53) | 0.49 (95% CI: 0.34–0.64) | 0.40 (95% CI: 0.29–0.52) | 0.57 (95%CI: 0.37–0.76) | |
| Specificity | 1.0 (95% CI: 0.82–1.0) | 0.87 (95% CI: 0.62–0.98) | 0.83 (95% CI: 0.77–0.88) | 0.79 (95% CI: 0.62–0.89) | 1.0 (95% CI: 0.68–1.0) | 0.86 (95% CI: 0.53–0.99) | |
| Xeno-R (n = 175 genes) | % SR+ samples | 25.2% | 60.5% | 50.1% | 62.1% | 40.7% | 40.0% |
| P value | 0.0686 | <0.0001 | <0.0001 | <0.0001 | 0.008 | 0.0049 | |
| Sensitivity | 0.33 (95% CI: 0.15–0.58) | 0.82 (95% CI: 0.52–0.97) | 0.86 (95% CI: 0.77–0.92) | 0.86 (95% CI: 0.67–0.95) | 0.6 (95% CI: 0.42–0.75) | 0.93 (95% CI: 0.70–1.0) | |
| Specificity | 0 (95% CI: 0–0.56) | 1.0 (95% CI: 0.80–1.0) | 0.99 (95% CI: 0.96–1.0) | 1.0 (95% CI: 0.89–1.0) | 1.0 (95% CI: 0.65–1.0) | 0.80 (95% CI: 0.38–0.99) | |
| Drug | Connectivity Score | Status | Target(s) | Drug Action(s) |
|---|---|---|---|---|
| dasatinib | −0.3073 | Approved | ABL1,SRC,EPHA2,LCK,YES1,KIT, PDGFRB,STAT5B,ABL2,FYN | antineoplastic, kinase inhibitor |
| enzalutamide | −0.3686 | Approved | AR | antineoplastic, antiandrogen, receptor antagonist |
| paclitaxel | −0.2423 | Approved | TUBB1,BCL2,NR1I2,MAP4,MAP2,MAPT | antineoplastic, antimicrotubule |
| palbociclib | −0.2387 | Approved | CDK4,CDK6 | antineoplastic, kinase inhibitor |
| pemetrexed | −0.2830 | Approved | TYMS,ATIC,DHFR,GART | antineoplastic, antimetabolite, antifolate |
| toremifene | −0.3114 | Approved | ESR1 | antiestrogen, antineoplastic, receptor antagonist |
| aminoglutethimide | −0.3121 | Approved | CYP19A1,CYP11A1 | adrenocortical suppressant, antineoplastic, aromatase inhibitor |
| anastrozole | −0.3002 | Approved | CYP19A1 | antineoplastic, aromatase inhibitor |
| nilotinib | −0.2677 | Approved | ABL1,KIT | antineoplastic, kinase inhibitor |
| procarbazine | −0.2573 | Approved | DNA | antineoplastic, alkylating |
| thiotepa | −0.3158 | Approved | DNA | antineoplastic, alkylating |
| vemurafenib | −0.3455 | Approved | BRAF | antineoplastic, kinase inhibitor |
| verteporfin | −0.2223 | Approved | n/a | antineoplastic, photosensitizer |
| brivanib | −0.2896 | Investigational | VEGFR2,FGFR1,FGFR2 | antineoplastic, kinase inhibitor |
| fostamatinib | −0.2388 | Investigational | SYK | antineoplastic, anti-inflammatory, kinase inhibitor |
| darinaparsin | −0.3833 | Investigational | n/a | antineoplastic, organic arsenical |
| enzastaurin | −0.2693 | Investigational | PRKCB | antineoplastic, kinase inhibitor |
| orteronel | −0.2719 | Investigational | CYP17A1 | antineoplastic, antiandrogen |
| quizartinib | −0.3080 | Investigational | FLT3 | antineoplastic, kinase inhibitor |
| tipifarnib | −0.4090 | Investigational | FNTB | antineoplastic, farnesyltransferase inhibitor |
© 2020 by the authors. Licensee MDPI, Basel, Switzerland. This article is an open access article distributed under the terms and conditions of the Creative Commons Attribution (CC BY) license (http://creativecommons.org/licenses/by/4.0/).
Share and Cite
Regan-Fendt, K.; Li, D.; Reyes, R.; Yu, L.; Wani, N.A.; Hu, P.; Jacob, S.T.; Ghoshal, K.; Payne, P.R.O.; Motiwala, T. Transcriptomics-Based Drug Repurposing Approach Identifies Novel Drugs against Sorafenib-Resistant Hepatocellular Carcinoma. Cancers 2020, 12, 2730. https://doi.org/10.3390/cancers12102730
Regan-Fendt K, Li D, Reyes R, Yu L, Wani NA, Hu P, Jacob ST, Ghoshal K, Payne PRO, Motiwala T. Transcriptomics-Based Drug Repurposing Approach Identifies Novel Drugs against Sorafenib-Resistant Hepatocellular Carcinoma. Cancers. 2020; 12(10):2730. https://doi.org/10.3390/cancers12102730
Chicago/Turabian StyleRegan-Fendt, Kelly, Ding Li, Ryan Reyes, Lianbo Yu, Nissar A. Wani, Peng Hu, Samson T. Jacob, Kalpana Ghoshal, Philip R.O. Payne, and Tasneem Motiwala. 2020. "Transcriptomics-Based Drug Repurposing Approach Identifies Novel Drugs against Sorafenib-Resistant Hepatocellular Carcinoma" Cancers 12, no. 10: 2730. https://doi.org/10.3390/cancers12102730