Engagement with tNOX (ENOX2) to Inhibit SIRT1 and Activate p53-Dependent and -Independent Apoptotic Pathways by Novel 4,11-Diaminoanthra[2,3-b]furan-5,10-diones in Hepatocellular Carcinoma Cells

 and
and 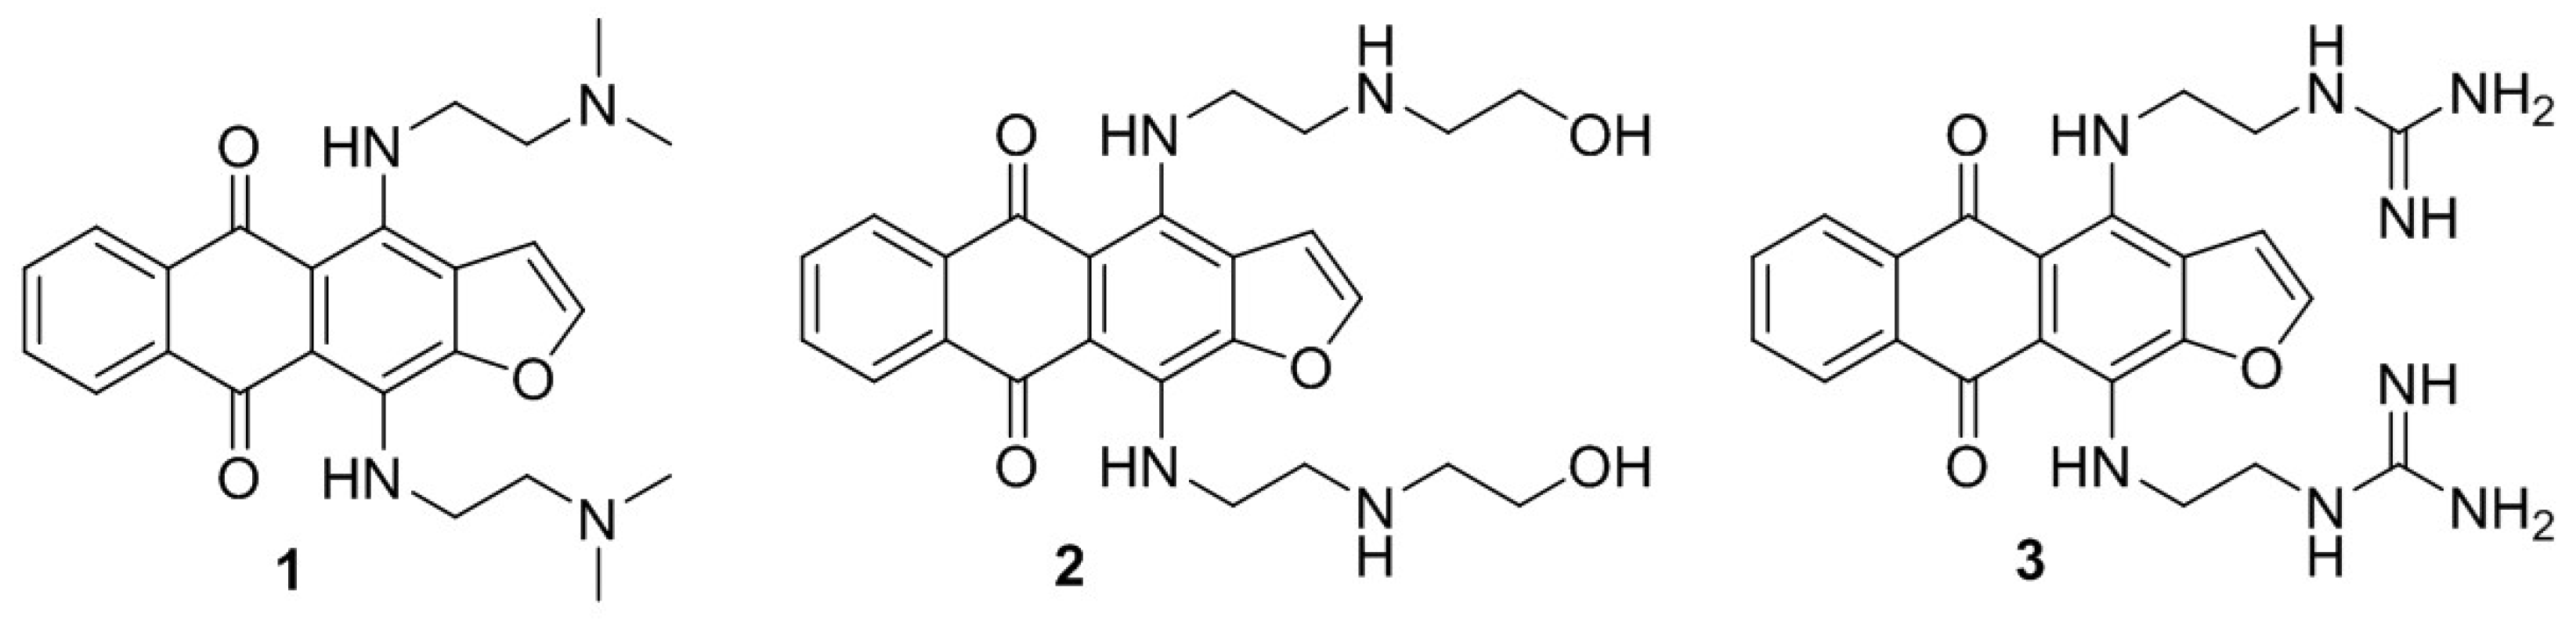
Abstract
:1. Introduction
2. Results
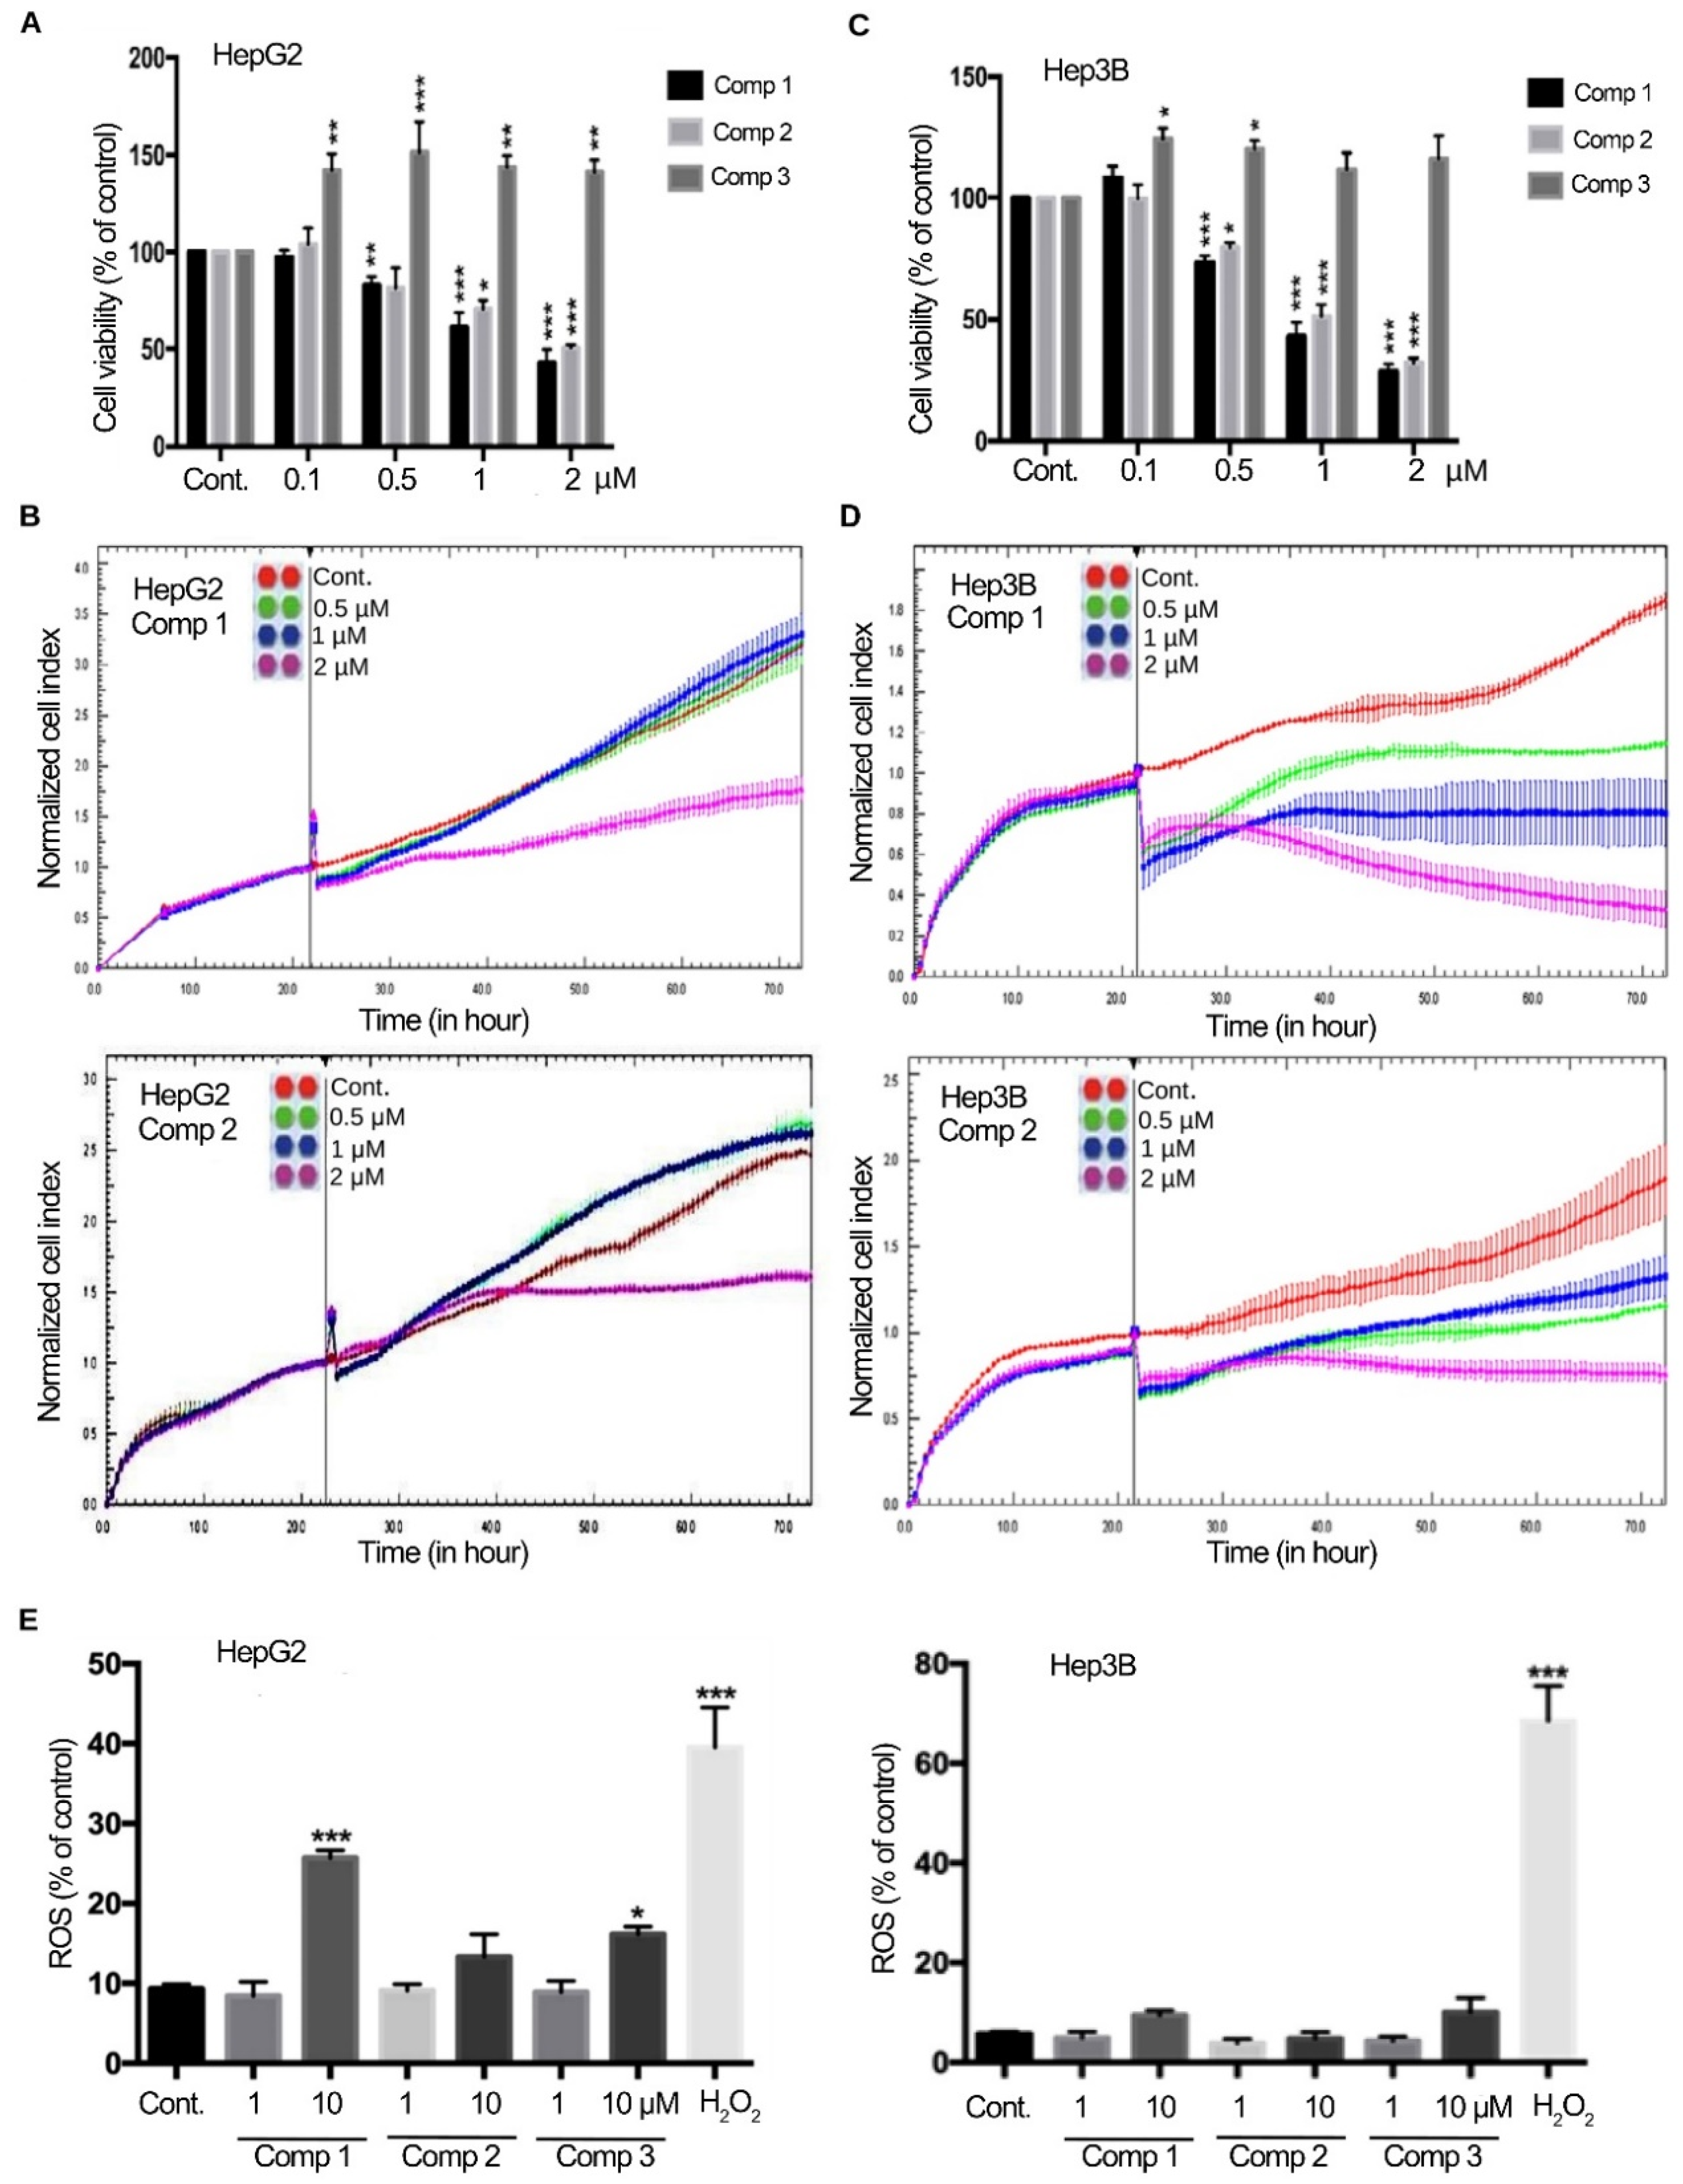
2.1. 4,11-Diaminoanthra[2,3-b]furan-5,10-diones 1 and 2 Suppress the Growth of HCC Cells
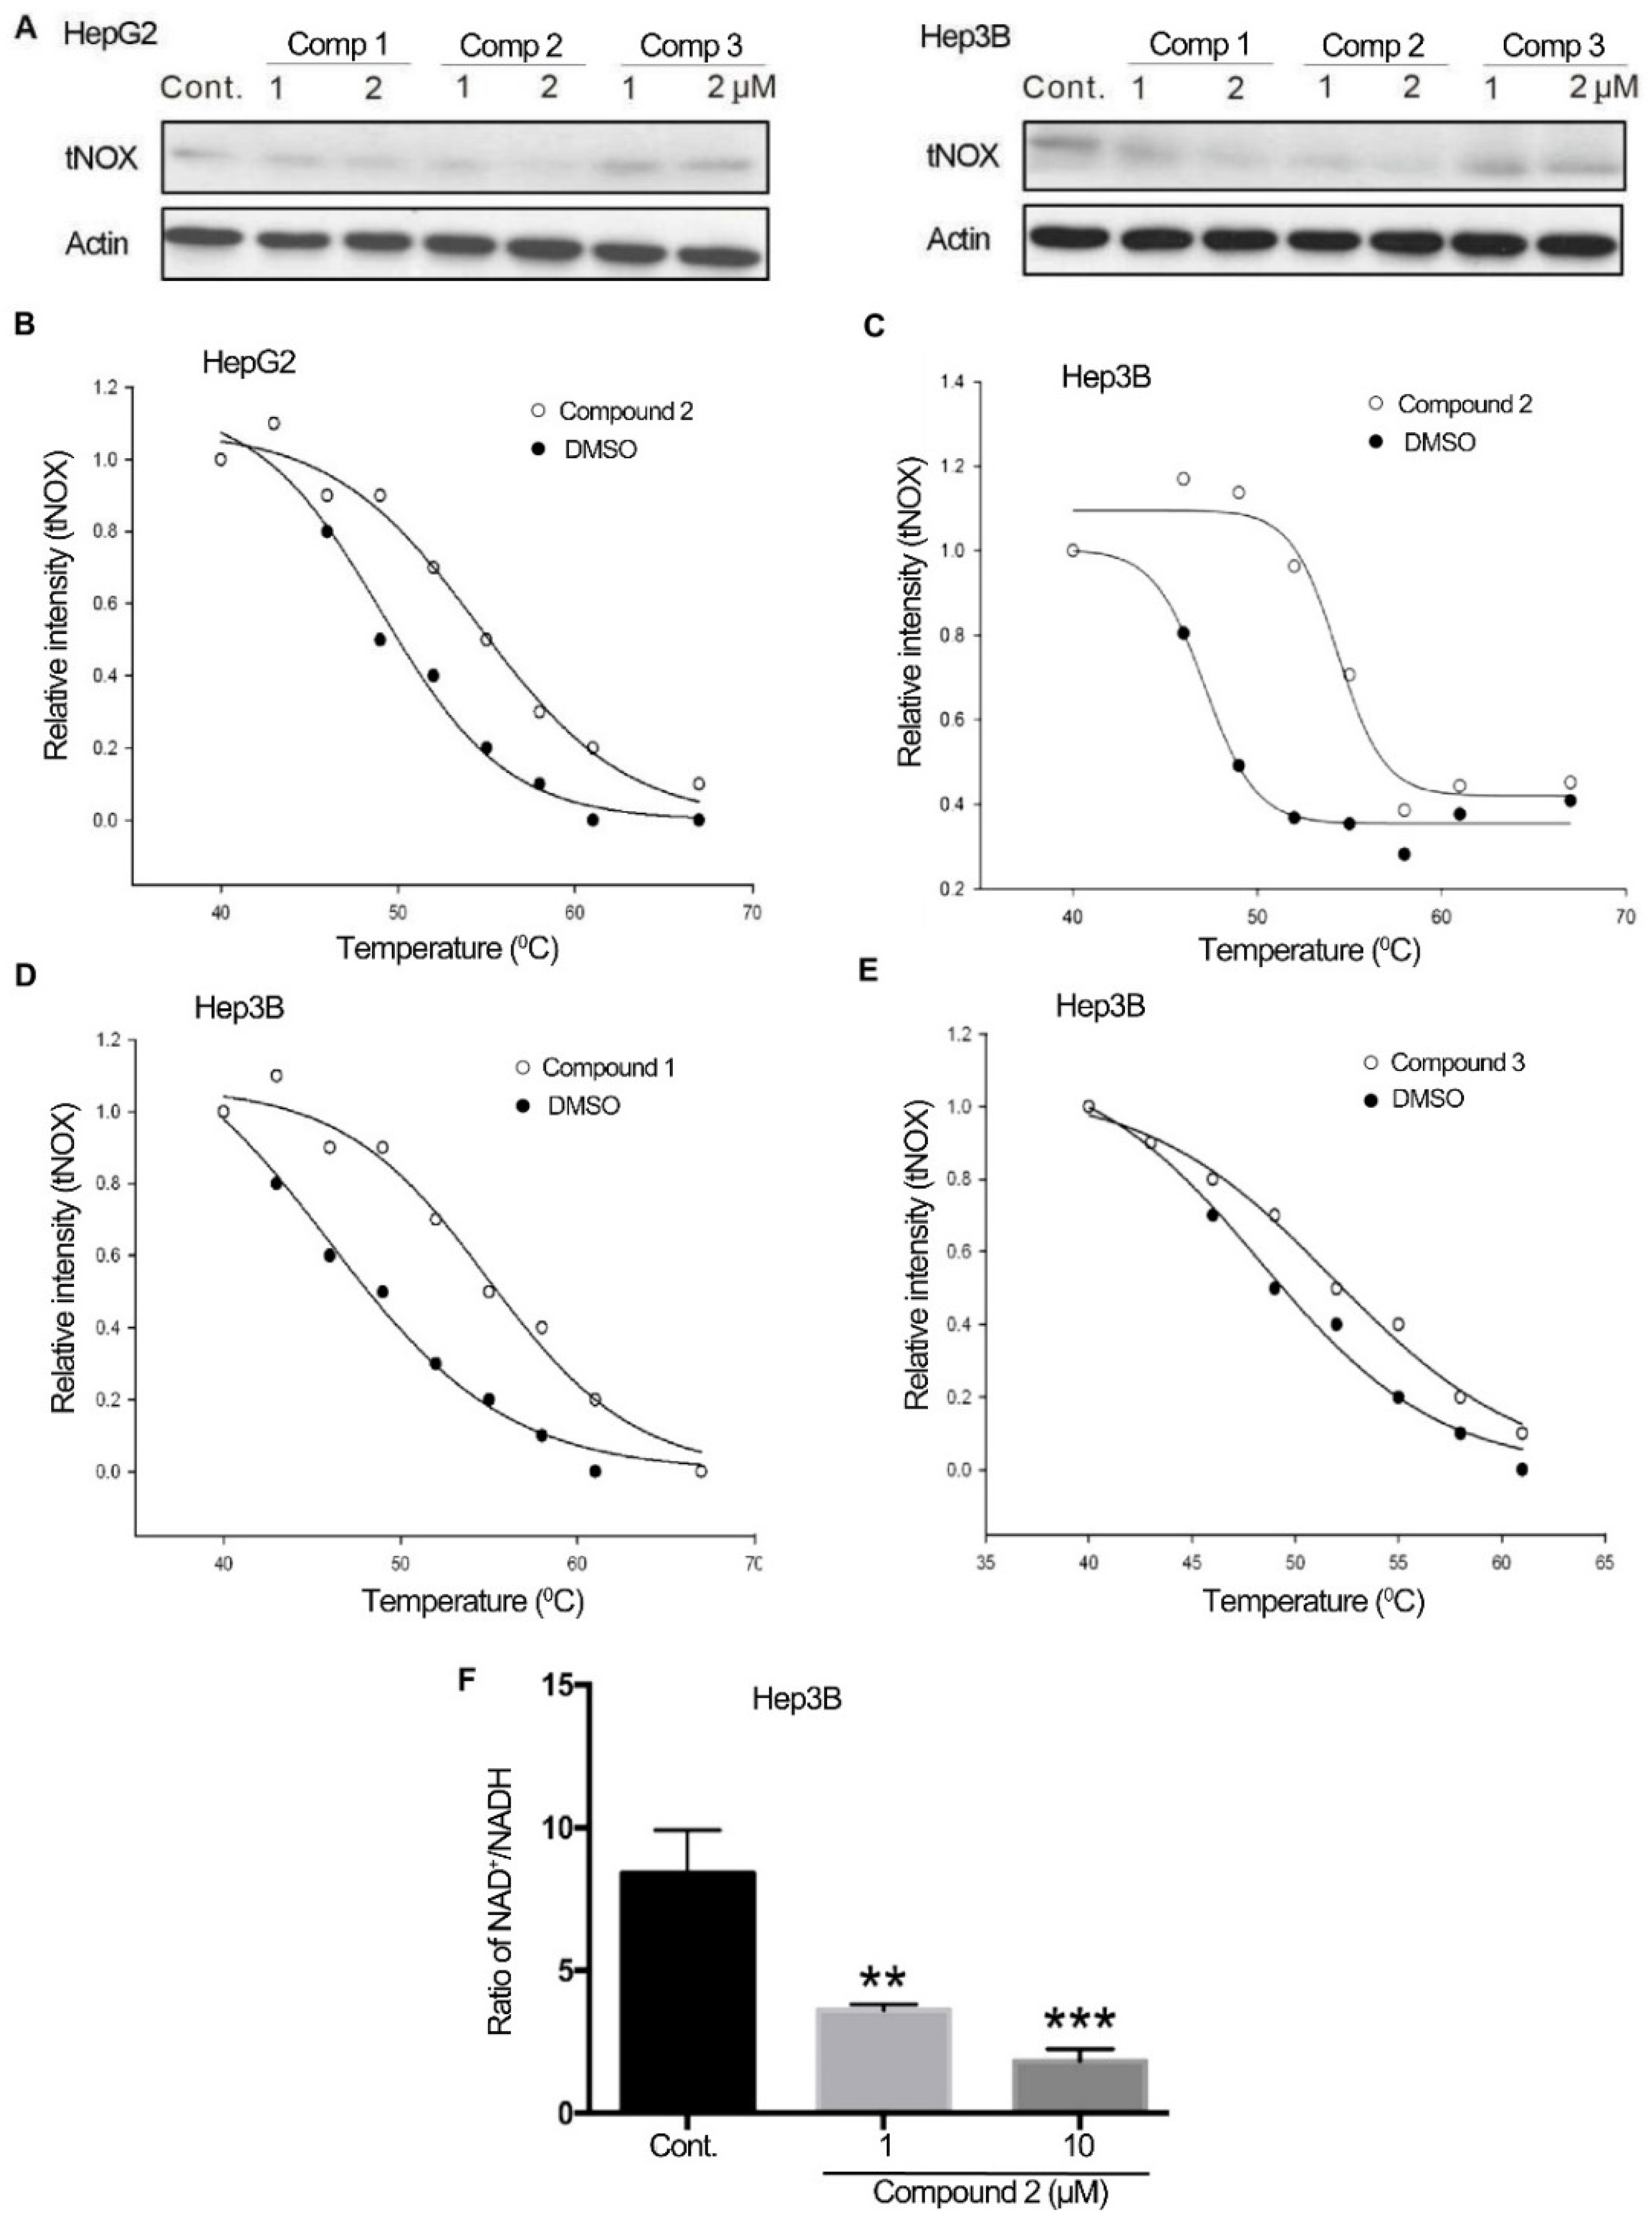
2.2. 4,11-Diaminoanthra[2,3-b]furan-5,10-diones 1 and 2 Bind to tNOX and Inhibit tNOX-Catalyzed NAD+ Generation
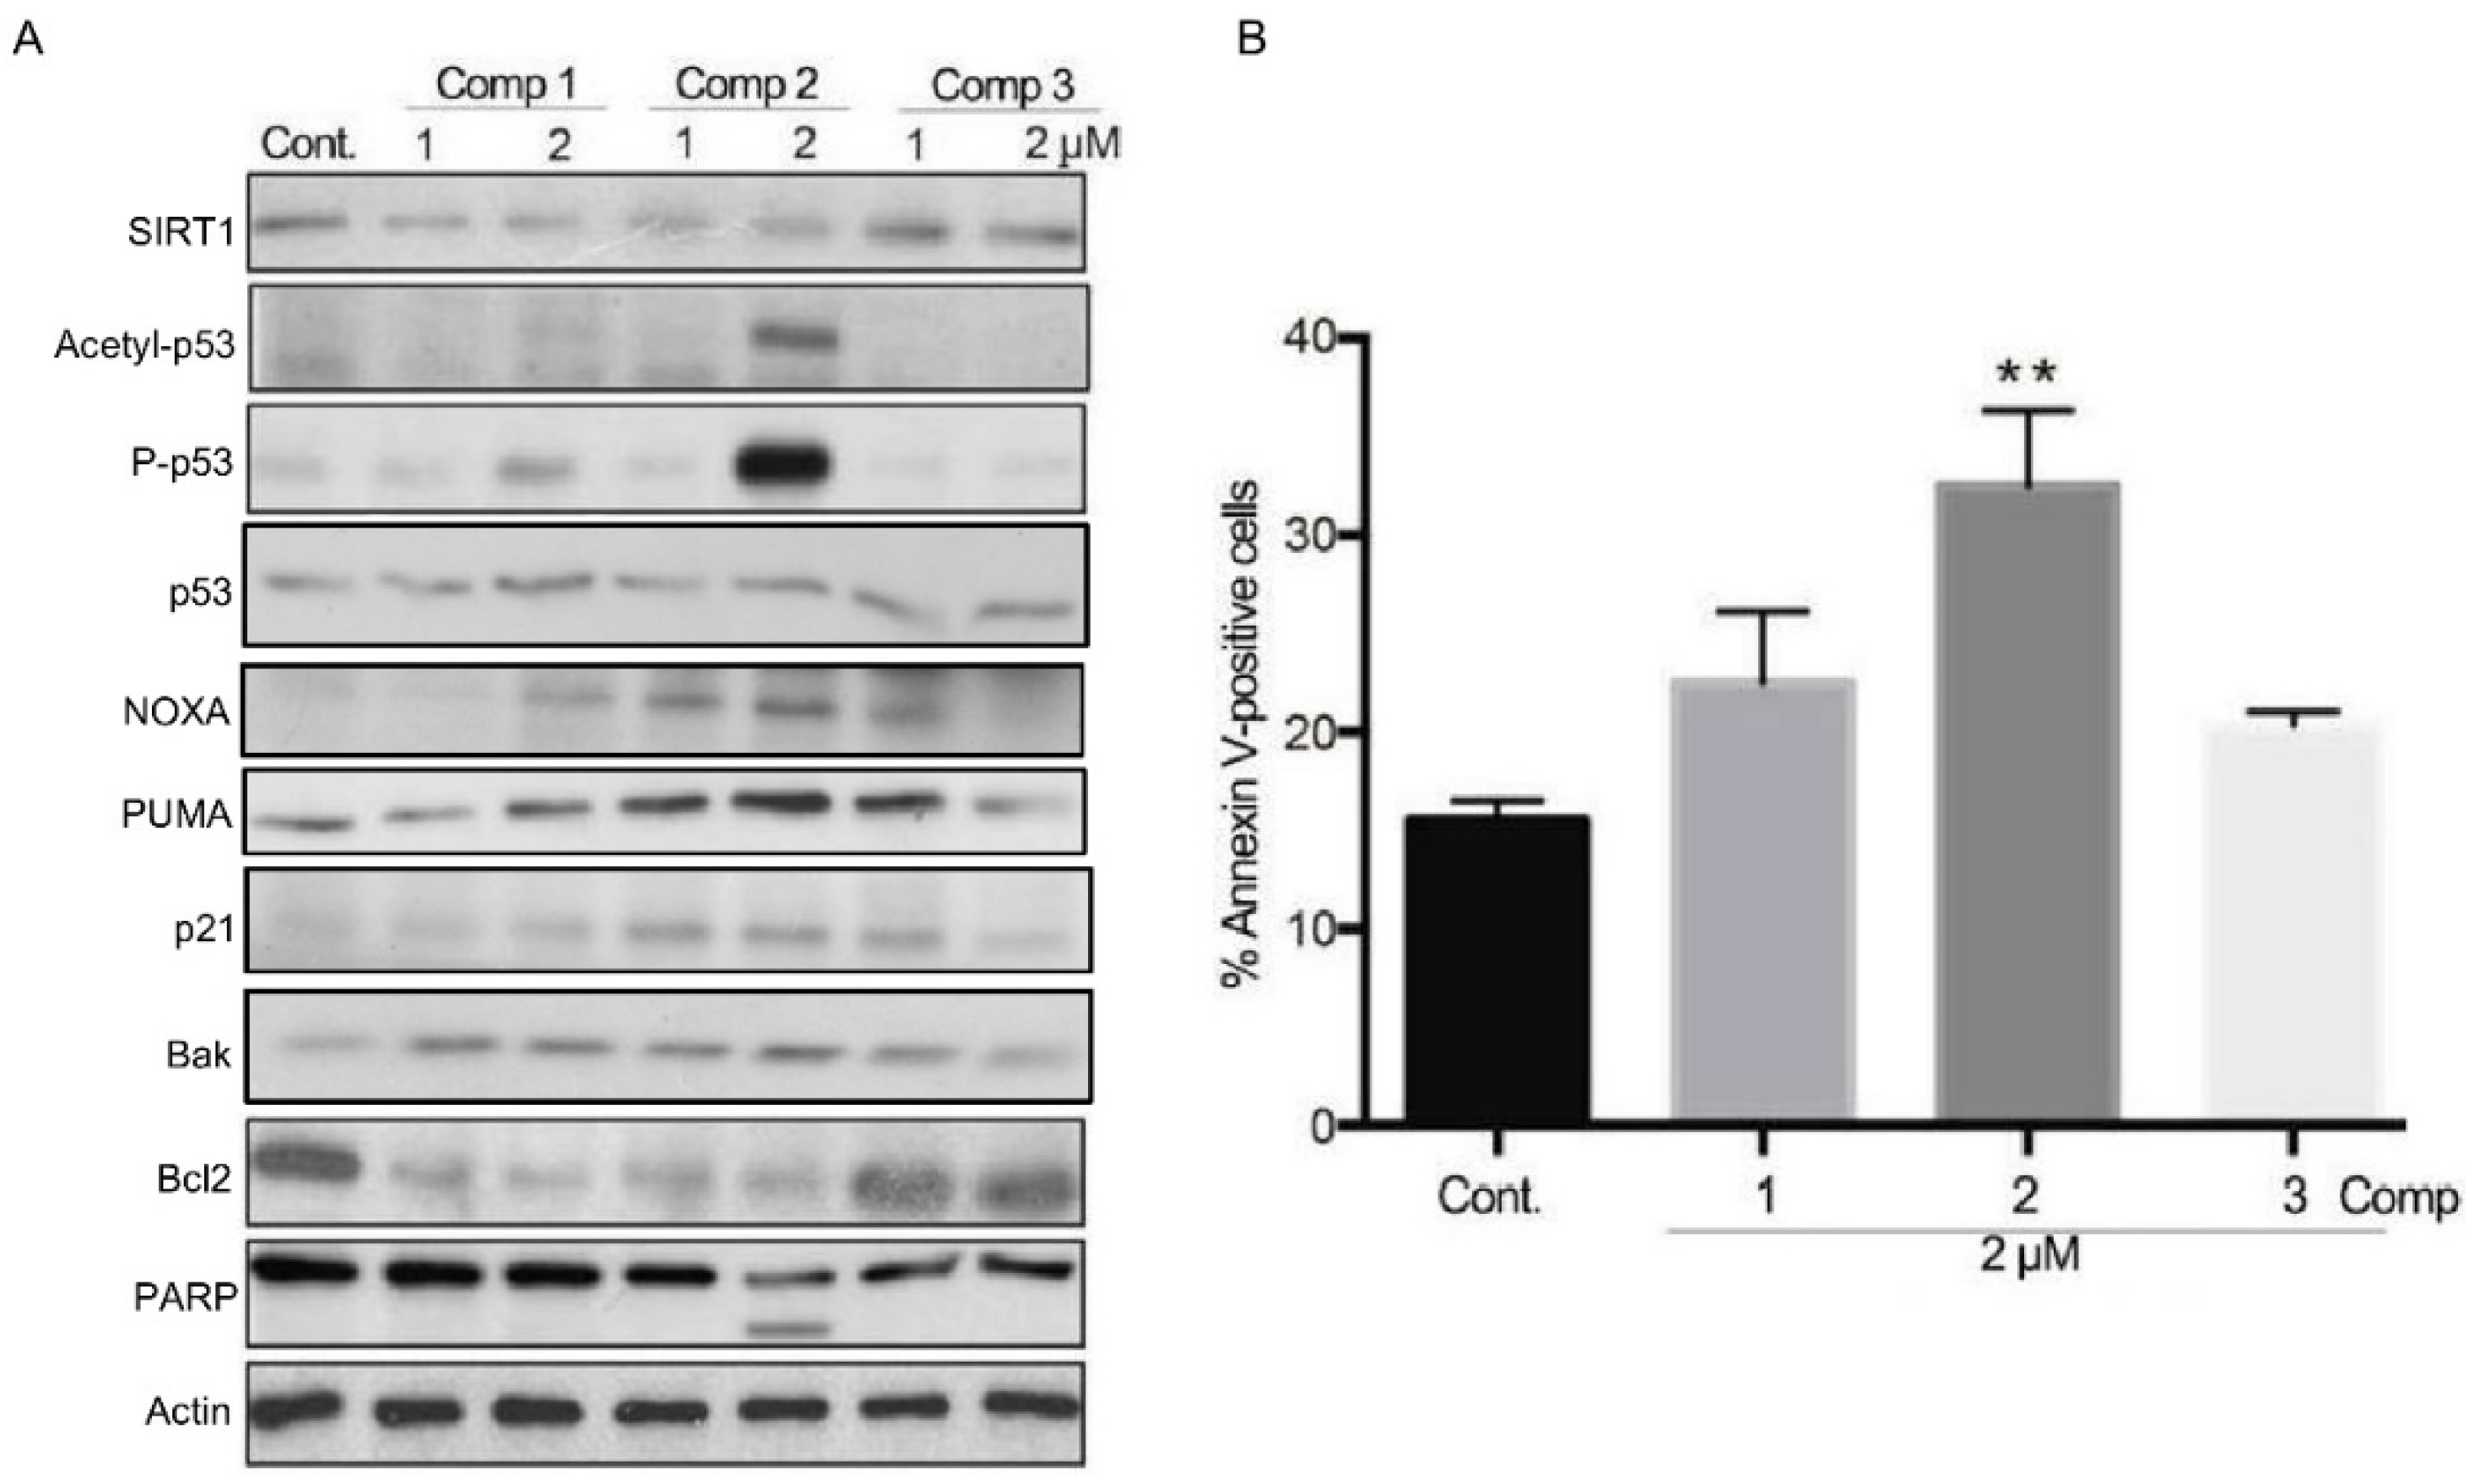
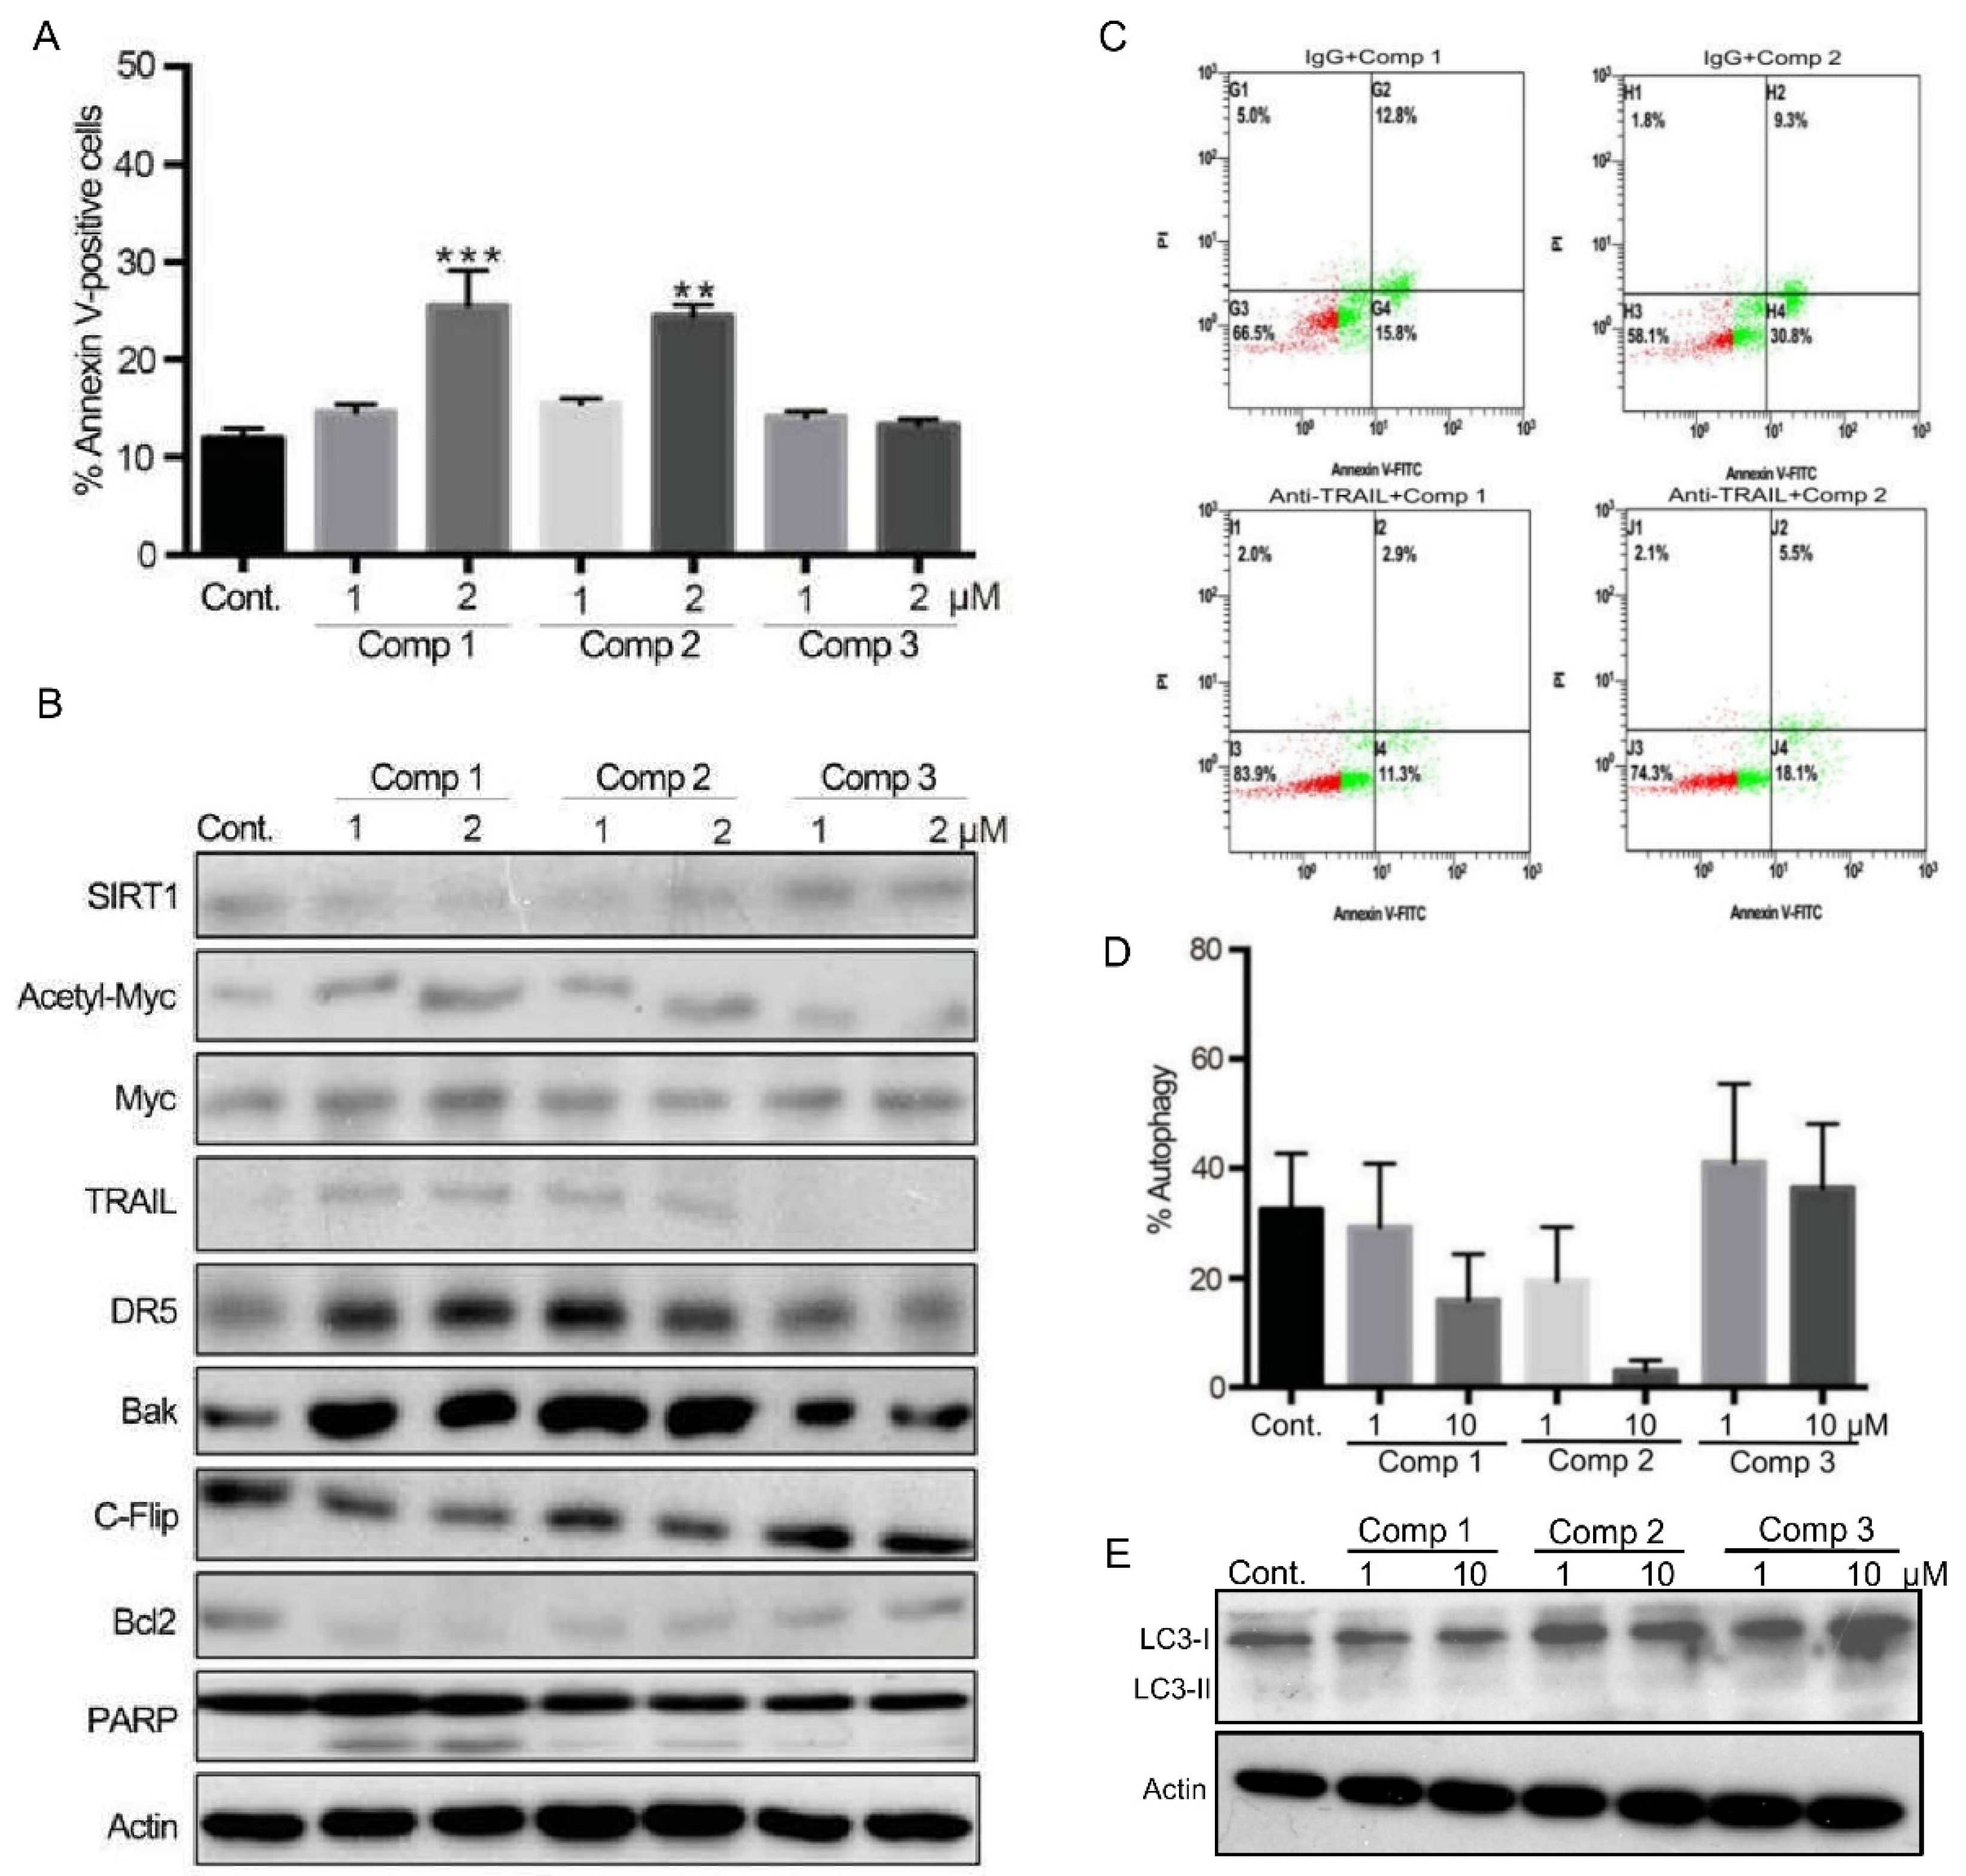
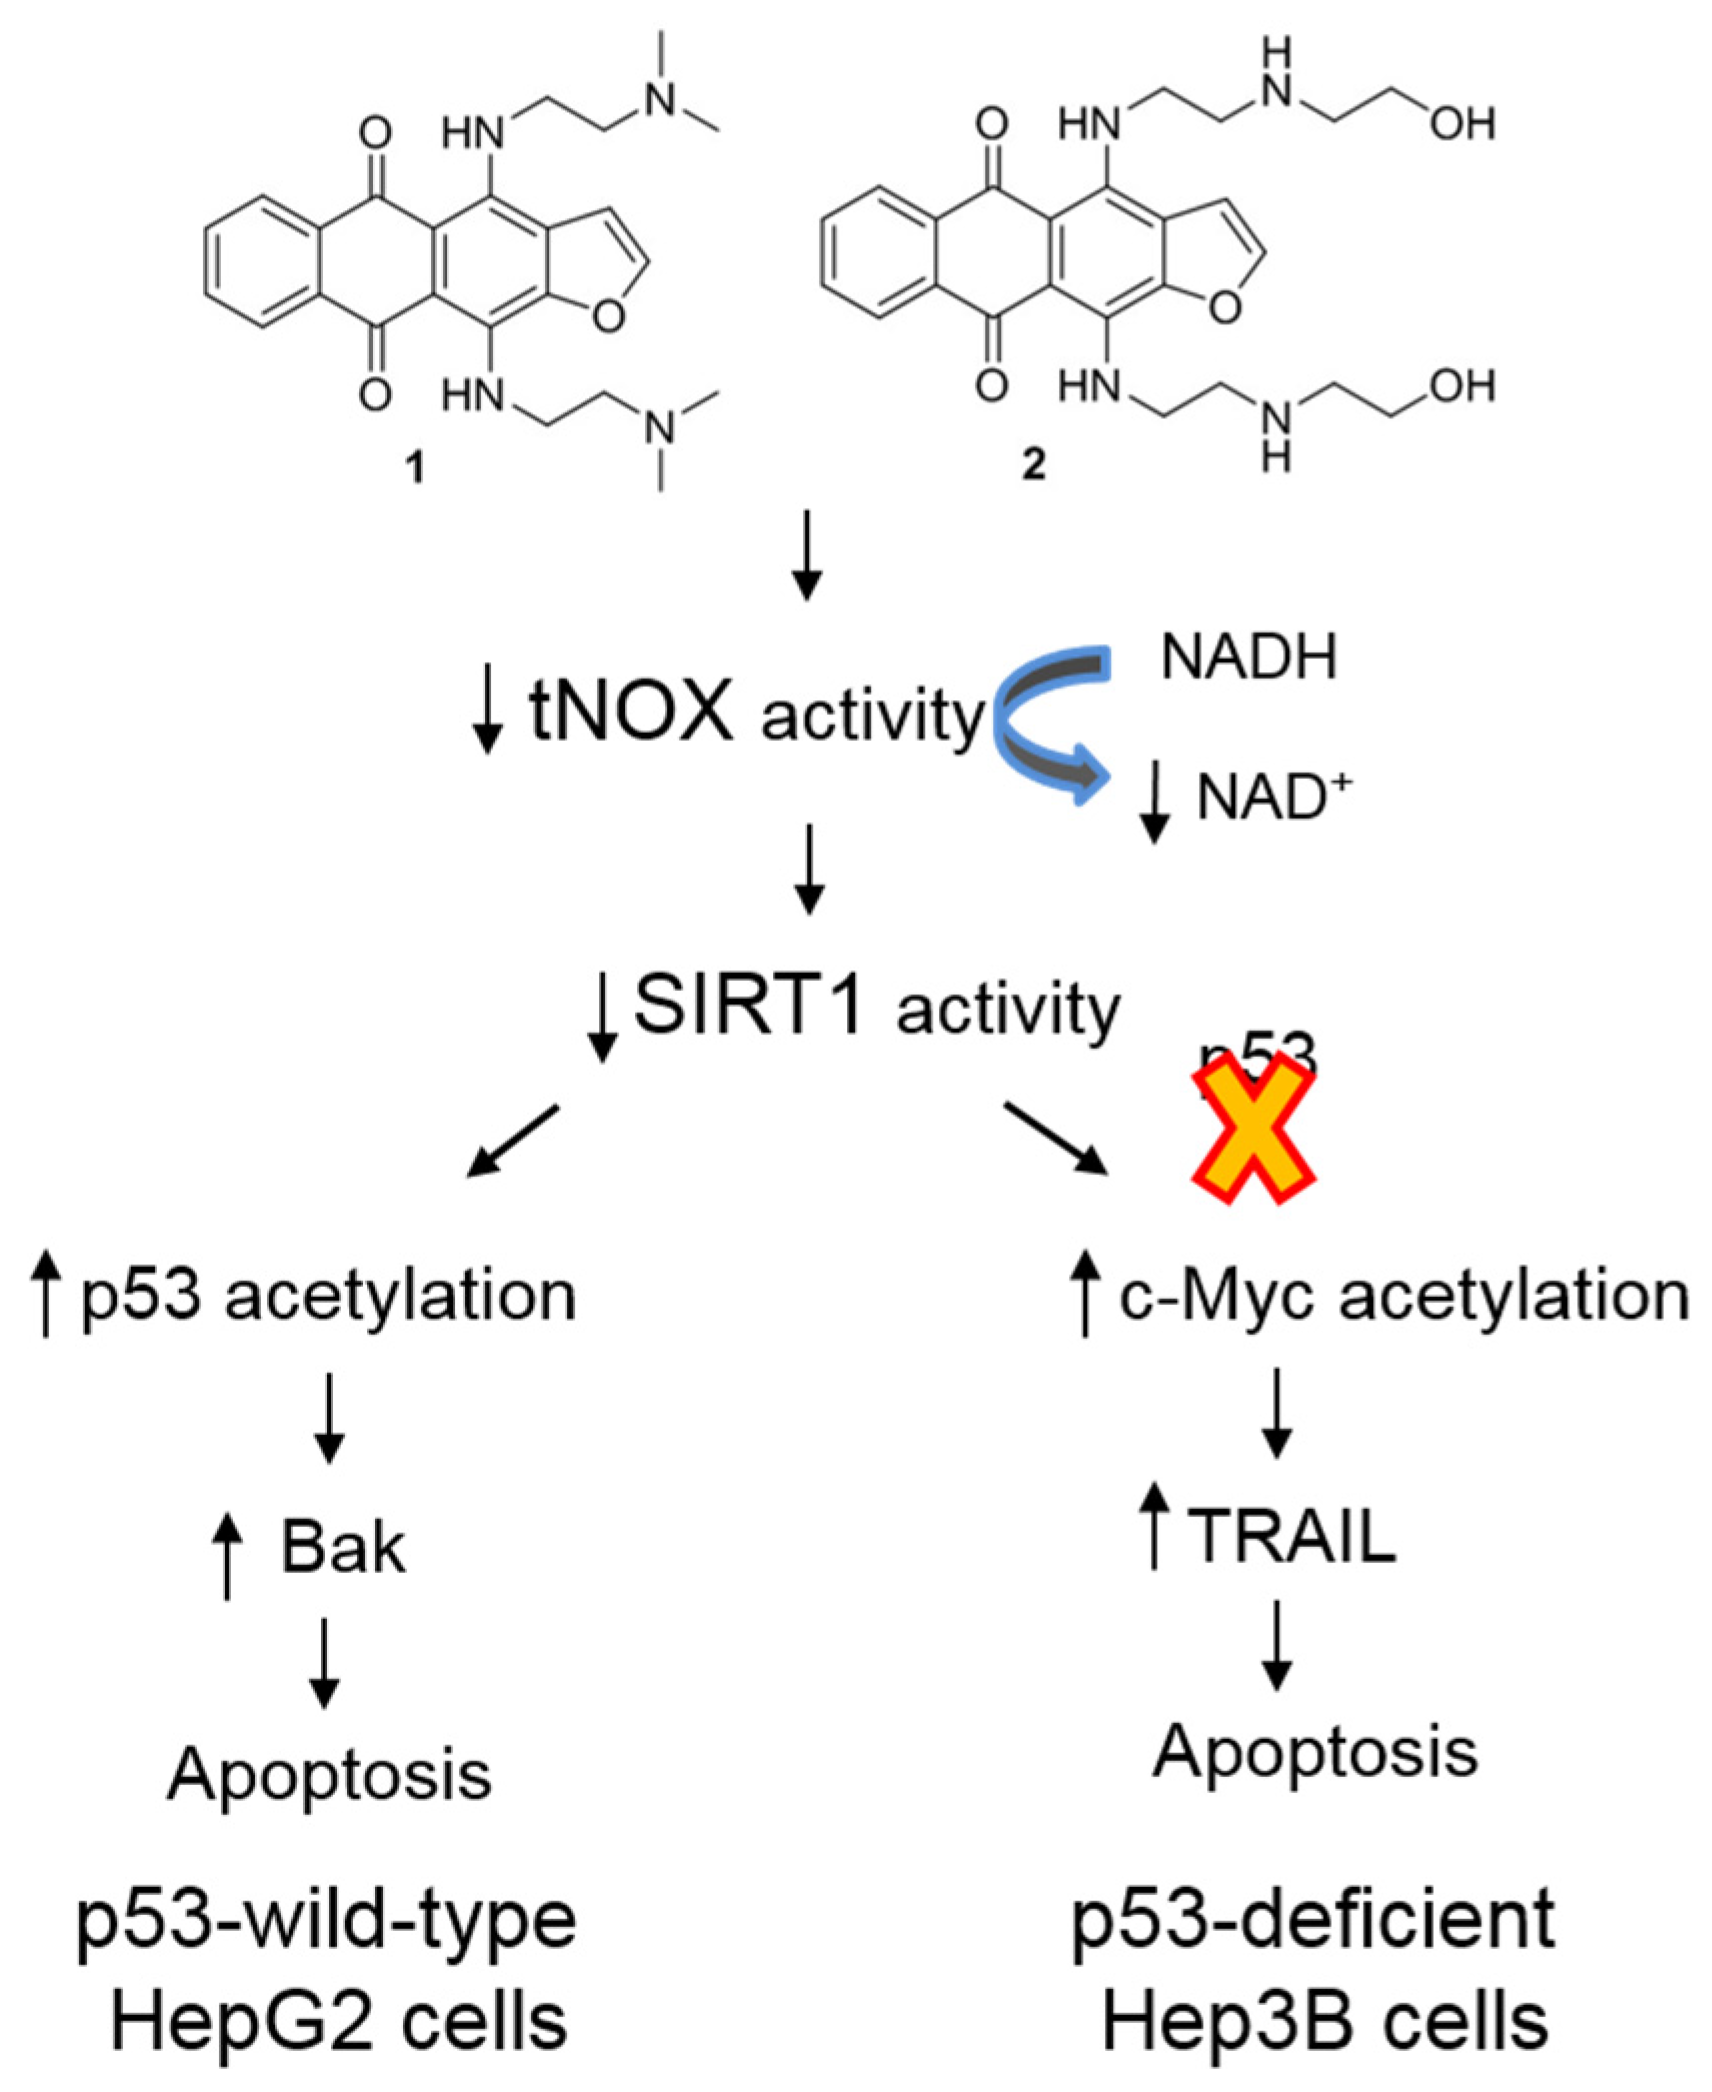
2.3. 4,11-Diaminoanthra[2,3-b]furan-5,10-diones 1 and 2 Inhibit SIRT1 Deacetylase Activity and Enhance p53/c-Myc Acetylation, Leading to Apoptosis, Not Autophagy
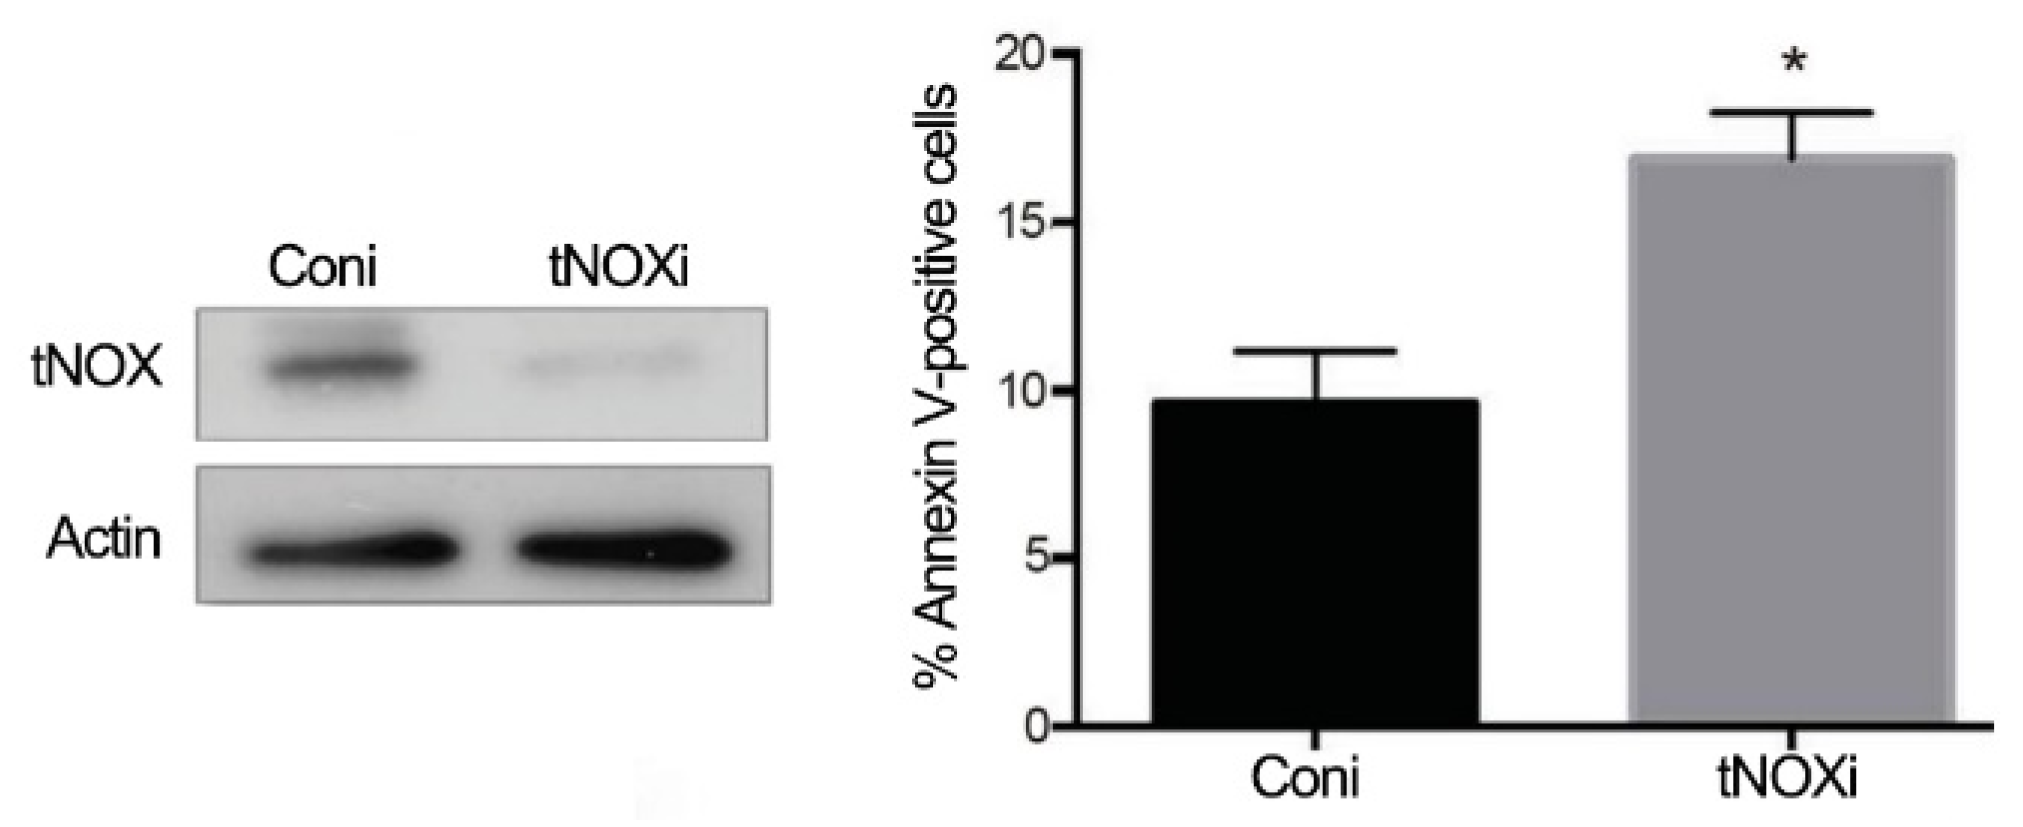
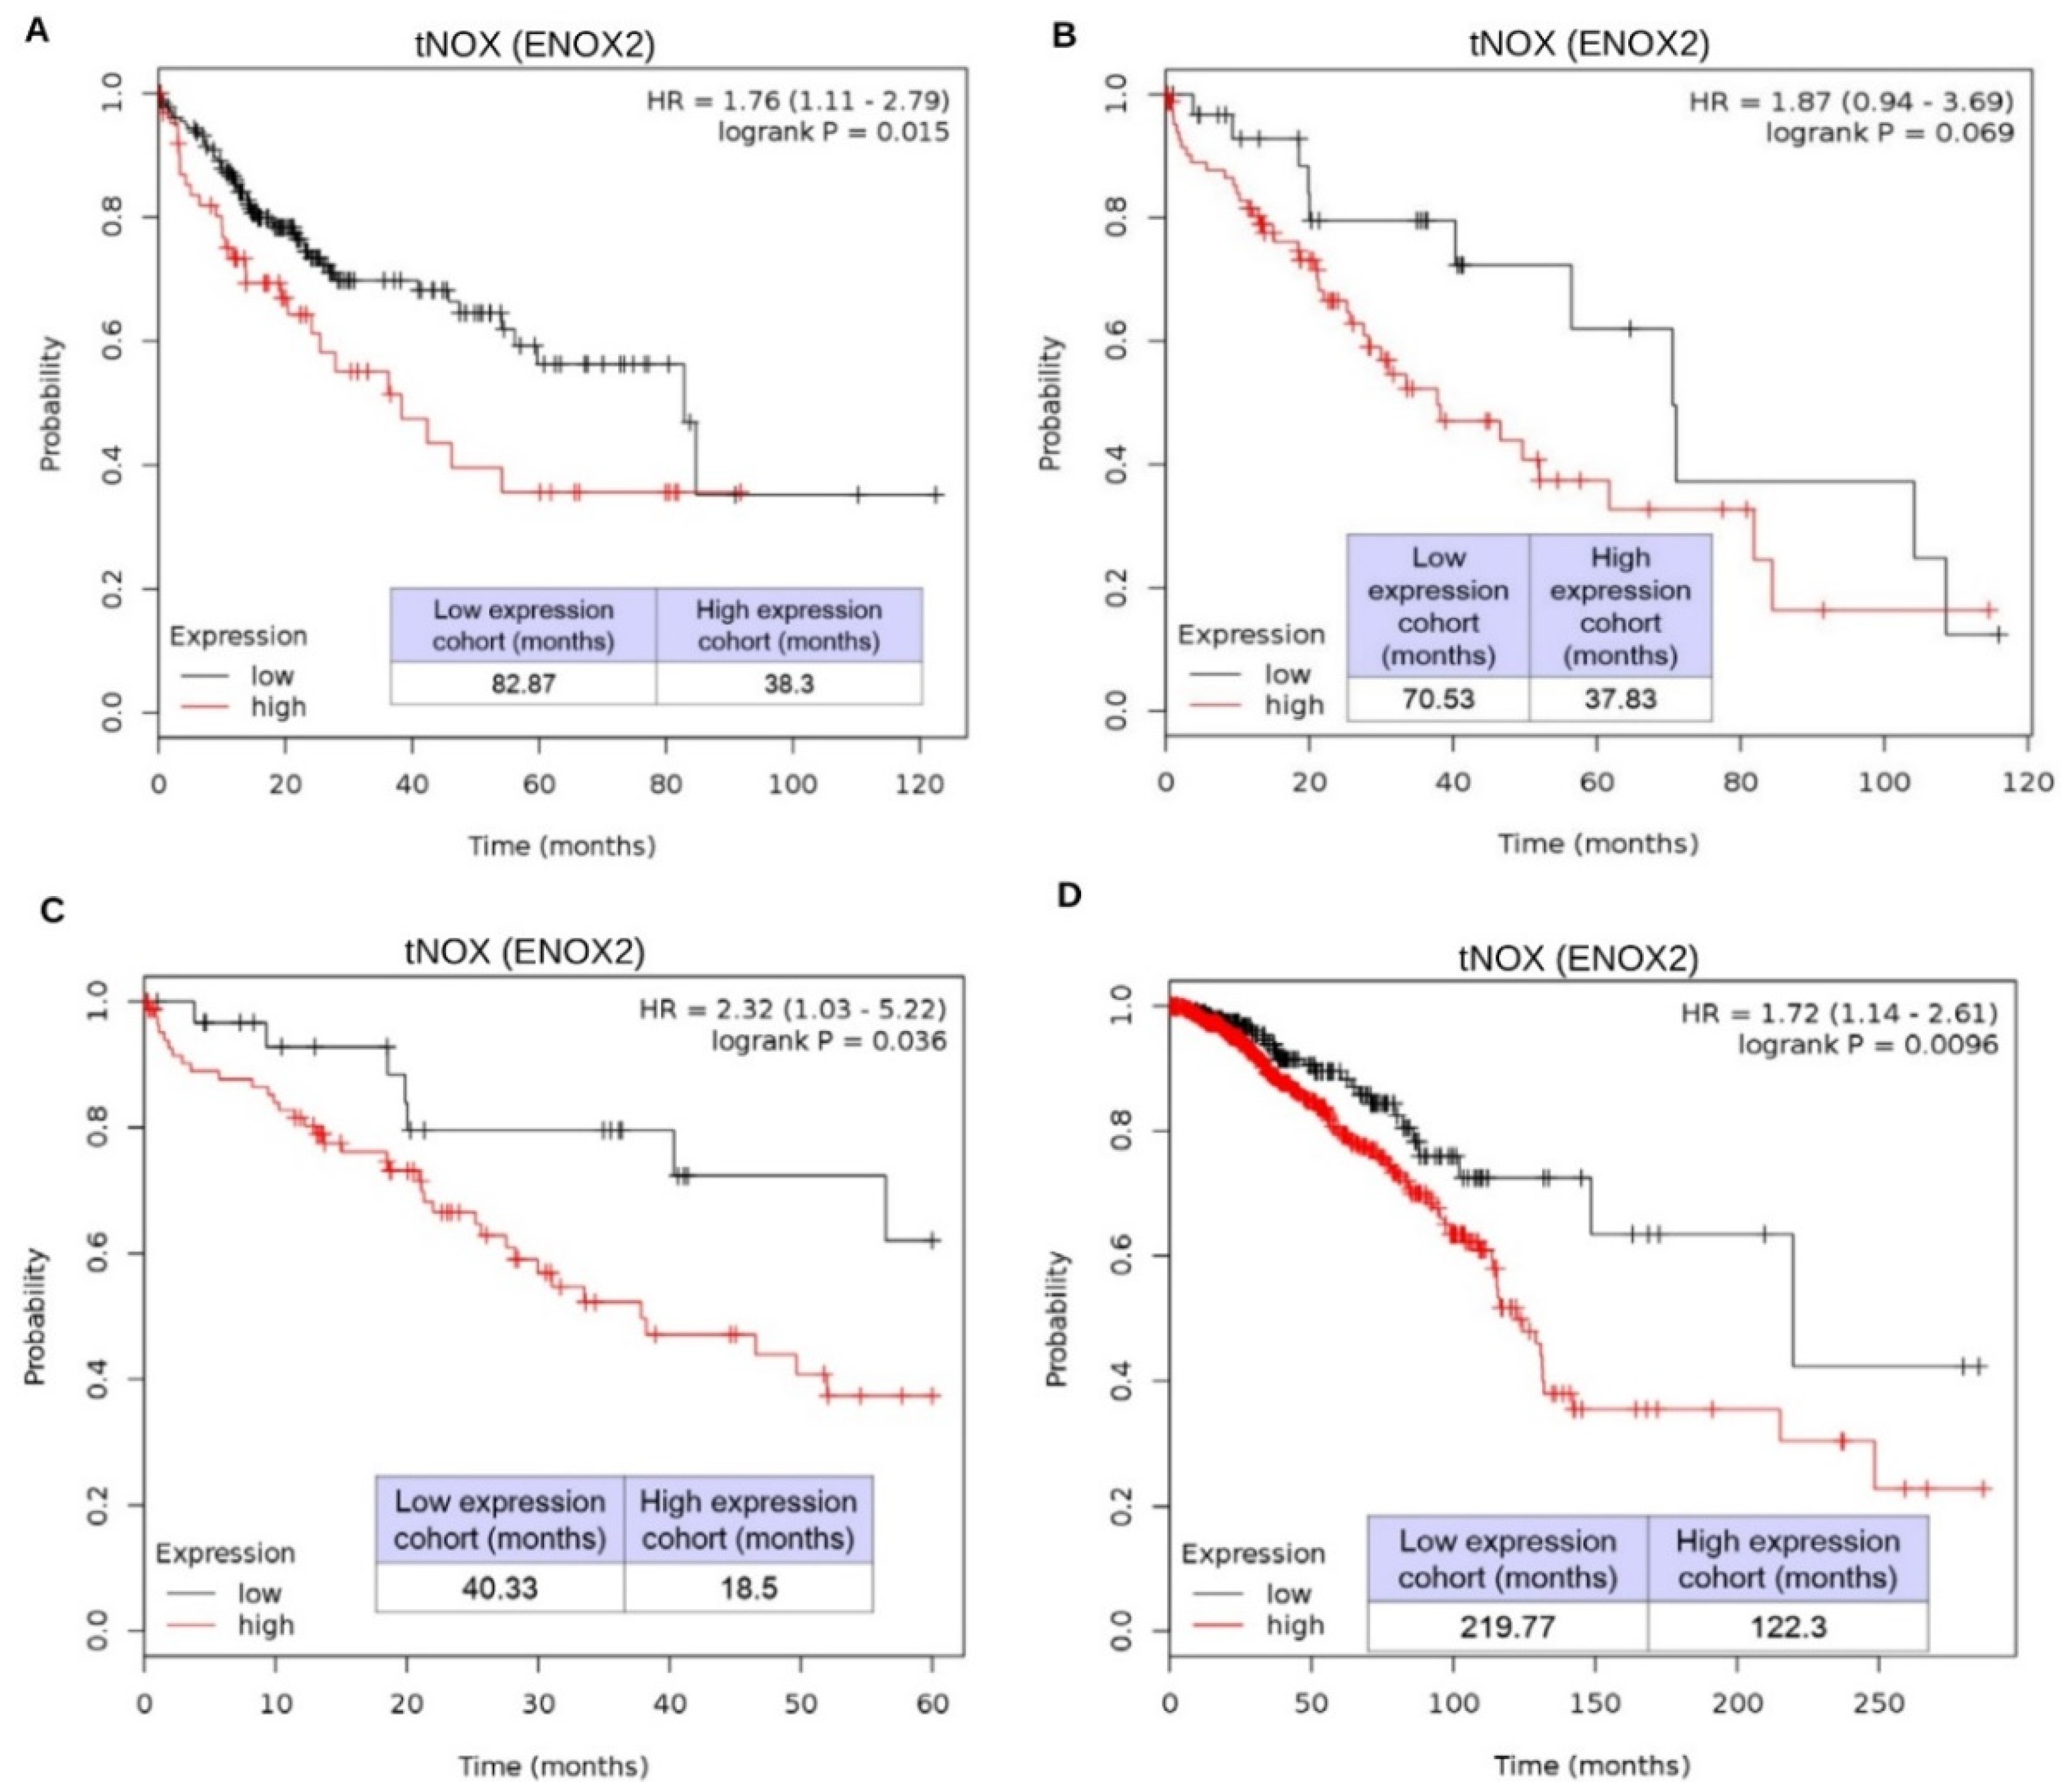
2.4. tNOX Expression Is Essential for Hep3B Cell Survival and Correlates with Tumor Progression and Poor Prognosis in an Online Database
3. Discussion
4. Materials and Methods
4.1. Materials
4.2. Chemistry
4.3. Cell Culture and Transfection
4.4. Continuous Monitoring of Cell Impedance
4.5. Cell Viability Assay
4.6. Apoptosis Determination
4.7. Measurement of Intracellular NAD+/NADH Ratio
4.8. Cellular Thermal Shift Assay (CETSA)
4.9. Measurement of Reactive Oxygen Species (ROS)
4.10. Western Blot Analysis
4.11. Statistics
5. Conclusions
Author Contributions
Funding
Conflicts of Interest
References
- Altekruse, S.F.; McGlynn, K.A.; Reichman, M.E. Hepatocellular carcinoma incidence, mortality, and survival trends in the United States from 1975 to 2005. J. Clin. Oncol. 2009, 27, 1485–1491. [Google Scholar] [CrossRef] [PubMed]
- El-Serag, H.B. Epidemiology of viral hepatitis and hepatocellular carcinoma. Gastroenterology 2012, 142, 1264–1273. [Google Scholar] [CrossRef]
- Varela, M.; Sala, M.; Llovet, J.M.; Bruix, J. Treatment of hepatocellular carcinoma: Is there an optimal strategy? Cancer Treat. Rev. 2003, 29, 99–104. [Google Scholar] [CrossRef]
- Tewey, K.M.; Chen, G.L.; Nelson, E.M.; Liu, L.F. Intercalative antitumor drugs interfere with the breakage-reunion reaction of mammalian DNA topoisomerase II. J. Biol. Chem. 1984, 259, 9182–9187. [Google Scholar]
- Fornari, F.A.; Randolph, J.K.; Yalowich, J.C.; Ritke, M.K.; Gewirtz, D.A. Interference by doxorubicin with DNA unwinding in MCF-7 breast tumor cells. Mol. Pharmacol. 1994, 45, 649–656. [Google Scholar] [PubMed]
- Ganne-Carrie, N.; Trinchet, J.C. Systemic treatment of hepatocellular carcinoma. Eur. J. Gastroenterol. Hepatol. 2004, 16, 275–281. [Google Scholar] [CrossRef] [PubMed]
- Cox, J.; Weinman, S. Mechanisms of doxorubicin resistance in hepatocellular carcinoma. Hepat. Oncol. 2016, 3, 57–59. [Google Scholar] [CrossRef] [PubMed]
- Tikhomirov, A.S.; Shchekotikhin, A.E.; Lee, Y.H.; Chen, Y.A.; Yeh, C.A.; Tatarskiy, V.V., Jr.; Dezhenkova, L.G.; Glazunova, V.A.; Balzarini, J.; Shtil, A.A.; et al. Synthesis and Characterization of 4,11-Diaminoanthra[2,3-b]furan-5,10-diones: Tumor Cell Apoptosis through tNOX-Modulated NAD+/NADH Ratio and SIRT1. J. Med. Chem. 2015, 58, 9522–9534. [Google Scholar] [CrossRef]
- Shchekotikhin, A.E.; Dezhenkova, L.G.; Tsvetkov, V.B.; Luzikov, Y.N.; Volodina, Y.L.; Tatarskiy, V.V., Jr.; Kalinina, A.A.; Treshalin, M.I.; Treshalina, H.M.; Romanenko, V.I.; et al. Discovery of antitumor anthra[2,3-b]furan-3-carboxamides: Optimization of synthesis and evaluation of antitumor properties. Eur. J. Med. Chem. 2016, 112, 114–129. [Google Scholar] [CrossRef] [PubMed]
- Miglietta, G.; Cogoi, S.; Marinello, J.; Capranico, G.; Tikhomirov, A.S.; Shchekotilthin, A.; Xodo, L.E. RNA G-Quadruplexes in Kirsten Ras (KRAS) Oncogene as Targets for Small Molecules Inhibiting Translation. J. Med. Chem. 2017, 60, 9448–9461. [Google Scholar] [CrossRef]
- Tikhomirov, A.S.; Tsvetkov, V.B.; Kaluzhny, D.N.; Volodina, Y.L.; Zatonsky, G.V.; Schols, D.; Shchekotikhin, A.E. Tri-armed ligands of G-quadruplex on heteroarene-fused anthraquinone scaffolds: Design, synthesis and pre-screening of biological properties. Eur. J. Med. Chem. 2018, 159, 59–73. [Google Scholar] [CrossRef] [PubMed]
- Tikhomirov, A.S.; Lin, C.Y.; Volodina, Y.L.; Dezhenkova, L.G.; Tatarskiy, V.V.; Schols, D.; Shtil, A.A.; Kaur, P.; Chueh, P.J.; Shchekotikhin, A.E. New antitumor anthra[2,3-b]furan-3-carboxamides: Synthesis and structure-activity relationship. Eur. J. Med. Chem. 2018, 148, 128–139. [Google Scholar] [CrossRef]
- Chueh, P.J.; Kim, C.; Cho, N.; Morré, D.M.; Morré, D.J. Molecular cloning and characterization of a tumor-associated, growth-related, and time-keeping hydroquinone (NADH) oxidase (tNOX) of the HeLa cell surface. Biochemistry 2002, 41, 3732–3741. [Google Scholar] [CrossRef] [PubMed]
- Morré, D.J. NADH oxidase: A multifunctional ectoprotein of the eukaryotic cell surface. In Plasma Membrane Redox Systems and Their Role in Biological Stress and Disease; Asard, H., Bérczi, A., Caubergs, R., Eds.; Kluwer Academic Publishers: Dordrecht, The Netherlands, 1998; pp. 121–156. [Google Scholar]
- Chueh, P.J. Cell membrane redox systems and transformation. Antioxid. Redox Signal. 2000, 2, 177–187. [Google Scholar] [CrossRef]
- Cheng, H.L.; Lee, Y.H.; Yuan, T.M.; Chen, S.W.; Chueh, P.J. Update on a tumor-associated NADH oxidase in gastric cancer cell growth. World J. Gastroenterol. 2016, 22, 2900–2905. [Google Scholar] [CrossRef]
- Chueh, P.J.; Wu, L.Y.; Morre, D.M.; Morre, D.J. tNOX is both necessary and sufficient as a cellular target for the anticancer actions of capsaicin and the green tea catechin (-)-epigallocatechin-3-gallate. Biofactors 2004, 20, 235–249. [Google Scholar]
- Liu, S.C.; Yang, J.J.; Shao, K.N.; Chueh, P.J. RNA interference targeting tNOX attenuates cell migration via a mechanism that involves membrane association of Rac. Biochem. Biophys. Res. Commun. 2008, 365, 672–677. [Google Scholar] [CrossRef] [PubMed]
- Wang, H.M.; Chuang, S.M.; Su, Y.C.; Li, Y.H.; Chueh, P.J. Down-regulation of tumor-associated NADH oxidase, tNOX (ENOX2), enhances capsaicin-induced inhibition of gastric cancer cell growth. Cell Biochem. Biophys. 2011, 61, 355–366. [Google Scholar] [CrossRef]
- Zeng, Z.M.; Chuang, S.M.; Chang, T.C.; Hong, C.W.; Chou, J.C.; Yang, J.J.; Chueh, P.J. Phosphorylation of serine-504 of tNOX (ENOX2) modulates cell proliferation and migration in cancer cells. Exp. Cell Res. 2012, 318, 1759–1766. [Google Scholar] [CrossRef]
- Lin, M.H.; Lee, Y.H.; Cheng, H.L.; Chen, H.Y.; Jhuang, F.H.; Chueh, P.J. Capsaicin Inhibits Multiple Bladder Cancer Cell Phenotypes by Inhibiting Tumor-Associated NADH Oxidase (tNOX) and Sirtuin1 (SIRT1). Molecules 2016, 21, 849. [Google Scholar] [CrossRef] [PubMed]
- Morre, D.J.; Chueh, P.J.; Morre, D.M. Capsaicin inhibits preferentially the NADH oxidase and growth of transformed cells in culture. Proc. Natl. Acad. Sci. USA 1995, 92, 1831–1835. [Google Scholar] [CrossRef] [PubMed]
- Morré, D.J.; Bridge, A.; Wu, L.Y.; Morré, D.M. Preferential inhibition by (-)-epigallocatechin-3-gallate of the cell surface NADH oxidase and growth of transformed cells in culture. Biochem. Pharmacol. 2000, 60, 937–946. [Google Scholar] [CrossRef]
- Su, Y.C.; Lin, Y.H.; Zeng, Z.M.; Shao, K.N.; Chueh, P.J. Chemotherapeutic agents enhance cell migration and epithelial-to-mesenchymal transition through transient up-regulation of tNOX (ENOX2) protein. Biochim. Biophys. Acta 2012, 1820, 1744–1752. [Google Scholar] [CrossRef]
- Chen, H.Y.; Cheng, H.L.; Lee, Y.H.; Yuan, T.M.; Chen, S.W.; Lin, Y.Y.; Chueh, P.J. Tumor-associated NADH oxidase (tNOX)-NAD+-sirtuin 1 axis contributes to oxaliplatin-induced apoptosis of gastric cancer cells. Oncotarget 2017, 8, 15338–15348. [Google Scholar] [CrossRef]
- Bruno, M.; Brightman, A.O.; Lawrence, J.; Werderitsh, D.; Morré, D.M.; Morré, D.J. Stimulation of NADH oxidase activity from rat liver plasma membranes by growth factors and hormones is decreased or absent with hepatoma plasma membranes. Biochem. J. 1992, 284 Pt 3, 625–628. [Google Scholar] [CrossRef]
- Lee, Y.H.; Chen, H.Y.; Su, L.J.; Chueh, P.J. Sirtuin 1 (SIRT1) Deacetylase Activity and NAD+/NADH Ratio Are Imperative for Capsaicin-Mediated Programmed Cell Death. J. Agric. Food Chem. 2015, 63, 7361–7370. [Google Scholar] [CrossRef]
- Lujambio, A.; Akkari, L.; Simon, J.; Grace, D.; Tschaharganeh, D.F.; Bolden, J.E.; Zhao, Z.; Thapar, V.; Joyce, J.A.; Krizhanovsky, V.; et al. Non-cell-autonomous tumor suppression by p53. Cell 2013, 153, 449–460. [Google Scholar] [CrossRef] [PubMed]
- Singal, P.K.; Iliskovic, N. Doxorubicin-induced cardiomyopathy. N. Engl. J. Med. 1998, 339, 900–905. [Google Scholar] [CrossRef]
- Renu, K.; V, G.A.; P, B.T.; Arunachalam, S. Molecular mechanism of doxorubicin-induced cardiomyopathy—An update. Eur. J. Pharmacol. 2018, 818, 241–253. [Google Scholar] [CrossRef]
- Savitski, M.M.; Reinhard, F.B.; Franken, H.; Werner, T.; Savitski, M.F.; Eberhard, D.; Martinez Molina, D.; Jafari, R.; Dovega, R.B.; Klaeger, S.; et al. Tracking cancer drugs in living cells by thermal profiling of the proteome. Science 2014, 346, 1255784. [Google Scholar] [CrossRef]
- Martinez Molina, D.; Jafari, R.; Ignatushchenko, M.; Seki, T.; Larsson, E.A.; Dan, C.; Sreekumar, L.; Cao, Y.; Nordlund, P. Monitoring drug target engagement in cells and tissues using the cellular thermal shift assay. Science 2013, 341, 84–87. [Google Scholar] [CrossRef] [PubMed]
- Sanchez-Ruiz, J.M. Ligand effects on protein thermodynamic stability. Biophys. Chem. 2007, 126, 43–49. [Google Scholar] [CrossRef]
- Ewer, M.S.; Ewer, S.M. Cardiotoxicity of anticancer treatments: What the cardiologist needs to know. Nat. Rev. Cardiol. 2010, 7, 564–575. [Google Scholar] [CrossRef]
- Swain, S.M.; Whaley, F.S.; Ewer, M.S. Congestive heart failure in patients treated with doxorubicin—A retrospective analysis of three trials. Cancer 2003, 97, 2869–2879. [Google Scholar] [CrossRef]
- Harake, D.; Franco, V.I.; Henkel, J.M.; Miller, T.L.; Lipshultz, S.E. Cardiotoxicity in childhood cancer survivors: Strategies for prevention and management. Future Cardiol. 2012, 8, 647–670. [Google Scholar] [CrossRef]
- Gorini, S.; De Angelis, A.; Berrino, L.; Malara, N.; Rosano, G.; Ferraro, E. Chemotherapeutic Drugs and Mitochondrial Dysfunction: Focus on Doxorubicin, Trastuzumab, and Sunitinib. Oxid. Med. Cell. Longev. 2018. [Google Scholar] [CrossRef] [PubMed]
- Simunek, T.; Sterba, M.; Popelova, O.; Adamcova, M.; Hrdina, R.; Gersl, V. Anthracycline-induced cardiotoxicity: Overview of studies examining the roles of oxidative stress and free cellular iron. Pharmacol. Rep. 2009, 61, 154–171. [Google Scholar] [CrossRef]
- Morre, D.J.; Korty, T.; Meadows, C.; Ades, L.M.; Morre, D.M. ENOX2 target for the anticancer isoflavone ME-143. Oncol. Res. 2014, 22, 1–12. [Google Scholar] [CrossRef]
- Morre, D.J.; Chueh, P.J.; Yagiz, K.; Balicki, A.; Kim, C.; Morre, D.M. ECTO-NOX target for the anticancer isoflavene phenoxodiol. Oncol. Res. 2007, 16, 299–312. [Google Scholar] [CrossRef]
- Chen, H.Y.; Islam, A.; Yuan, T.M.; Chen, S.W.; Liu, P.F.; Chueh, P.J. Regulation of tNOX expression through the ROS-p53-POU3F2 axis contributes to cellular responses against oxaliplatin in human colon cancer cells. J. Exp. Clin. Cancer Res. 2018, 37, 161. [Google Scholar] [CrossRef]
- Mao, L.C.; Wang, H.M.; Lin, Y.Y.; Chang, T.K.; Hsin, Y.H.; Chueh, P.J. Stress-induced down-regulation of tumor-associated NADH oxidase during apoptosis in transformed cells. FEBS Lett. 2008, 582, 3445–3450. [Google Scholar] [CrossRef]
- Adlakha, Y.K.; Saini, N. miR-128 exerts pro-apoptotic effect in a p53 transcription-dependent and -independent manner via PUMA-Bak axis. Cell Death Dis. 2013, 4, e542. [Google Scholar] [CrossRef]
- Nebbioso, A.; Carafa, V.; Conte, M.; Tambaro, F.P.; Abbondanza, C.; Martens, J.; Nees, M.; Benedetti, R.; Pallavicini, I.; Minucci, S.; et al. c-Myc Modulation and Acetylation Is a Key HDAC Inhibitor Target in Cancer. Clin. Cancer Res. 2017, 23, 2542–2555. [Google Scholar] [CrossRef] [PubMed]
- Kim, H.B.; Kim, M.J.; Lee, S.H.; Lee, J.W.; Bae, J.H.; Kim, D.W.; Dao, T.T.; Oh, W.K.; Kang, C.D.; Kim, S.H. Amurensin G, a novel SIRT1 inhibitor, sensitizes TRAIL-resistant human leukemic K562 cells to TRAIL-induced apoptosis. Biochem. Pharmacol. 2012, 84, 402–410. [Google Scholar] [CrossRef] [PubMed]
- Yuan, J.; Minter-Dykhouse, K.; Lou, Z. A c-Myc-SIRT1 feedback loop regulates cell growth and transformation. J. Cell Boil. 2009, 185, 203–211. [Google Scholar] [CrossRef]
- Menssen, A.; Hydbring, P.; Kapelle, K.; Vervoorts, J.; Diebold, J.; Luscher, B.; Larsson, L.G.; Hermeking, H. The c-MYC oncoprotein, the NAMPT enzyme, the SIRT1-inhibitor DBC1, and the SIRT1 deacetylase form a positive feedback loop. Proc. Natl. Acad. Sci. USA 2012, 109, E187–E196. [Google Scholar] [CrossRef] [PubMed]
- Hong, K.S.; Park, J.I.; Kim, M.J.; Kim, H.B.; Lee, J.W.; Dao, T.T.; Oh, W.K.; Kang, C.D.; Kim, S.H. Involvement of SIRT1 in hypoxic down-regulation of c-Myc and beta-catenin and hypoxic preconditioning effect of polyphenols. Toxicol. Appl. Pharmacol. 2012, 259, 210–218. [Google Scholar] [CrossRef]
- Kim, M.J.; Hong, K.S.; Kim, H.B.; Lee, S.H.; Bae, J.H.; Kim, D.W.; Dao, T.T.; Oh, W.K.; Kang, C.D.; Kim, S.H. Ku70 acetylation and modulation of c-Myc/ATF4/CHOP signaling axis by SIRT1 inhibition lead to sensitization of HepG2 cells to TRAIL through induction of DR5 and down-regulation of c-FLIP. Int. J. Biochem. Cell B 2013, 45, 711–723. [Google Scholar] [CrossRef] [PubMed]
- Huffman, D.M.; Grizzle, W.E.; Bamman, M.M.; Kim, J.S.; Eltoum, I.A.; Elgavish, A.; Nagy, T.R. SIRT1 is significantly elevated in mouse and human prostate cancer. Cancer Res. 2007, 67, 6612–6618. [Google Scholar] [CrossRef] [PubMed]
- Liu, T.; Liu, P.Y.; Marshall, G.M. The critical role of the class III histone deacetylase SIRT1 in cancer. Cancer Res. 2009, 69, 1702–1705. [Google Scholar] [CrossRef] [PubMed]
- Morré, D.J.; Caldwell, S.; Mayorga, A.; Wu, L.Y.; Morré, D.M. NADH oxidase activity from sera altered by capsaicin is widely distributed among cancer patients. Arch. Biochem. Biophys. 1997, 342, 224–230. [Google Scholar] [CrossRef]
- Chueh, P.J.; Morre, D.J.; Wilkinson, F.E.; Gibson, J.; Morré, D.M. A 33.5-kDa heat- and protease-resistant NADH oxidase inhibited by capsaicin from sera of cancer patients. Arch. Biochem. Biophys. 1997, 342, 38–47. [Google Scholar] [CrossRef] [PubMed]
- Ronconi, G.; Lessiani, G.; Spinas, E.; Kritas, S.K.; Caraffa, A.; Saggini, A.; Antinolfi, P.; Pizzicannella, J.; Toniato, E.; Conti, P. ENOX2 (or tNOX): A new and old molecule with cancer activity involved in tumor prevention and therapy. J. Biol. Regul. Homeost. Agents 2016, 30, 649–653. [Google Scholar] [PubMed]
- Nelson, R.L.; Dollear, T.; Freels, S.; Persky, V. The relation of age, race, and gender to the subsite location of colorectal carcinoma. Cancer 1997, 80, 193–197. [Google Scholar] [CrossRef]
- Yang, Y.; Wang, G.; He, J.; Ren, S.; Wu, F.; Zhang, J.; Wang, F. Gender differences in colorectal cancer survival: A meta-analysis. Int. J. Cancer 2017, 141, 1942–1949. [Google Scholar] [CrossRef]
- van Kempen, L.C.L.; Redpath, M.; Elchebly, M.; Klein, K.O.; Papadakis, A.I.; Wilmott, J.S.; Scolyer, R.A.; Edqvist, P.H.; Ponten, F.; Schadendorf, D.; et al. The protein phosphatase 2A regulatory subunit PR70 is a gonosomal melanoma tumor suppressor gene. Sci. Transl. Med. 2016, 8. [Google Scholar] [CrossRef]
- Matsuyama, T.; Ishikawa, T.; Mogushi, K.; Yoshida, T.; Iida, S.; Uetake, H.; Mizushima, H.; Tanaka, H.; Sugihara, K. MUC12 mRNA expression is an independent marker of prognosis in stage II and stage III colorectal cancer. Int. J. Cancer 2010, 127, 2292–2299. [Google Scholar] [CrossRef]
- Canadas, I.; Rojo, F.; Taus, A.; Arpi, O.; Arumi-Uria, M.; Pijuan, L.; Menendez, S.; Zazo, S.; Domine, M.; Salido, M.; et al. Targeting epithelial-to-mesenchymal transition with Met inhibitors reverts chemoresistance in small cell lung cancer. Clin. Cancer Res. 2014, 20, 938–950. [Google Scholar] [CrossRef] [PubMed]
- Swoboda, A.; Schanab, O.; Tauber, S.; Bilban, M.; Berger, W.; Petzelbauer, P.; Mikula, M. MET expression in melanoma correlates with a lymphangiogenic phenotype. Hum. Mol. Genet. 2012, 21, 3387–3396. [Google Scholar] [CrossRef]
- Chen, C.F.; Huang, S.; Liu, S.C.; Chueh, P.J. Effect of polyclonal antisera to recombinant tNOX protein on the growth of transformed cells. Biofactors 2006, 28, 119–133. [Google Scholar] [CrossRef] [PubMed]


© 2019 by the authors. Licensee MDPI, Basel, Switzerland. This article is an open access article distributed under the terms and conditions of the Creative Commons Attribution (CC BY) license (http://creativecommons.org/licenses/by/4.0/).
Share and Cite
Lin, C.-Y.; Islam, A.; Su, C.J.; Tikhomirov, A.S.; Shchekotikhin, A.E.; Chuang, S.-M.; Chueh, P.J.; Chen, Y.L. Engagement with tNOX (ENOX2) to Inhibit SIRT1 and Activate p53-Dependent and -Independent Apoptotic Pathways by Novel 4,11-Diaminoanthra[2,3-b]furan-5,10-diones in Hepatocellular Carcinoma Cells. Cancers 2019, 11, 420. https://doi.org/10.3390/cancers11030420
Lin C-Y, Islam A, Su CJ, Tikhomirov AS, Shchekotikhin AE, Chuang S-M, Chueh PJ, Chen YL. Engagement with tNOX (ENOX2) to Inhibit SIRT1 and Activate p53-Dependent and -Independent Apoptotic Pathways by Novel 4,11-Diaminoanthra[2,3-b]furan-5,10-diones in Hepatocellular Carcinoma Cells. Cancers. 2019; 11(3):420. https://doi.org/10.3390/cancers11030420
Chicago/Turabian StyleLin, Chia-Yang, Atikul Islam, Claire J. Su, Alexander S. Tikhomirov, Andrey E. Shchekotikhin, Show-Mei Chuang, Pin Ju Chueh, and Yao Li Chen. 2019. "Engagement with tNOX (ENOX2) to Inhibit SIRT1 and Activate p53-Dependent and -Independent Apoptotic Pathways by Novel 4,11-Diaminoanthra[2,3-b]furan-5,10-diones in Hepatocellular Carcinoma Cells" Cancers 11, no. 3: 420. https://doi.org/10.3390/cancers11030420