Article

Mitochondrial RNA Expression and Single Nucleotide Variants in Association with Clinical Parameters in Primary Breast Cancers

Department of Medical Oncology and Cancer Genomics Netherlands, Erasmus MC Cancer Institute, Erasmus University Medical Center, 3015 CE Rotterdam, The Netherlands
*
Author to whom correspondence should be addressed.
Cancers 2018, 10(12), 500; https://doi.org/10.3390/cancers10120500
Submission received: 10 November 2018 / Revised: 6 December 2018 / Accepted: 7 December 2018 / Published: 9 December 2018

Abstract

:
The human mitochondrial DNA (mtDNA) encodes 37 genes, including thirteen proteins essential for the respiratory chain, and RNAs functioning in the mitochondrial translation apparatus. The total number of mtDNA molecules per cell (mtDNA content) is variable between tissue types and also between tumors and their normal counterparts. For breast cancer, tumors tend to be depleted in their mtDNA content compared to adjacent normal mammary tissue. Various studies have shown that primary breast tumors harbor somatic mtDNA variants. A decrease in mtDNA content or the presence of somatic variants could indicate a reduced mitochondrial function within breast cancer. In this explorative study we aimed to further understand genomic changes and expression of the mitochondrial genome within breast cancer, by analyzing RNA sequencing data of primary breast tumor specimens of 344 cases. We demonstrate that somatic variants detected at the mtRNA level are representative for somatic variants in the mtDNA. Also, the number of somatic variants within the mitochondrial transcriptome is not associated with mutational processes impacting the nuclear genome, but is positively associated with age at diagnosis. Finally, we observe that mitochondrial expression is related to ER status. We conclude that there is a large heterogeneity in somatic mutations of the mitochondrial genome within primary breast tumors, and differences in mitochondrial expression among breast cancer subtypes. The exact impact on metabolic differences and clinical relevance deserves further study.

1. Introduction

Mitochondria are small organelles involved in multiple cellular processes. They are most renowned for their role in energy production, since they contain their own circular genomic entity encoding proteins essential for the respiratory chain and thereby for generating cellular ATP via oxidative phosphorylation. The human mitochondrial DNA (mtDNA) is gene-dense consisting of ~16569 base pairs encoding 37 genes: thirteen proteins, and two rRNAs and twenty-two tRNAs functioning in the mitochondrial translation apparatus. Polycistronic transcription of mtDNA is initiated at the non-coding D-loop region, and the resultant precursor transcripts are processed by excision of the tRNA genes (“tRNA punctuation model” [1]) generating individual mitochondrial tRNA, rRNA and mRNA transcripts. The total number of mtDNA molecules per cell (mtDNA content) is variable between tissue types, and interestingly also between tumors and their normal counterparts [2]. For breast cancer specifically, tumors tend to have reduced mtDNA content compared to adjacent normal mammary tissue [2,3,4,5,6,7,8,9,10], and mtDNA content in breast tumors positively correlates with the expression of mtDNA-encoded genes [11]. Decreased content and expression of mtDNA could indicate a reduced mitochondrial oxidative phosphorylation function within breast cancer, in line with the Warburg hypothesis [12] limiting energy production largely to glycolysis. Recently, we have shown mtDNA content to be associated with breast cancer patient outcome [13,14], underlining the clinical relevance of mitochondria in breast cancer.
Apart from mtDNA content, the significance of somatic mtDNA variants within (breast) cancer is still subject to debate, where the whole spectrum of neutral accumulation, positive selection (advantage) and negative selection (disadvantage) have been postulated. Various studies have shown that primary breast tumors harbor somatic variants in their mtDNA [8,15,16], with approximately 70% of the specimens containing at least one single nucleotide variant (SNV, range 1–7) and 10% containing at least one small insertion/deletion (INDEL, range 0–3). However, these variants do not appear at particular ‘hot-spot’ positions on the mitochondrial genome, raising doubts about their clinical relevance.
To better understand nucleotide changes in and expression of the mitochondrial genome within primary breast tumors, we investigated here transcriptomic sequencing data within the International Cancer Genome Consortium (ICGC) [17] and explored how these findings correlate with clinical parameters, providing more insight into the mitochondrial genome as potential biomarker and its clinical relevance in breast cancer.

2. Results

We evaluated RNA sequencing data of 344 primary breast tumor specimens. After mapping of sequencing reads against the human reference genome, median 15% (Interquartile range (IQR) 10–23%) of the uniquely mapped reads were assigned to the mitochondrial contig, resulting in median 9889× read depth (IQR 5333) of mtDNA.

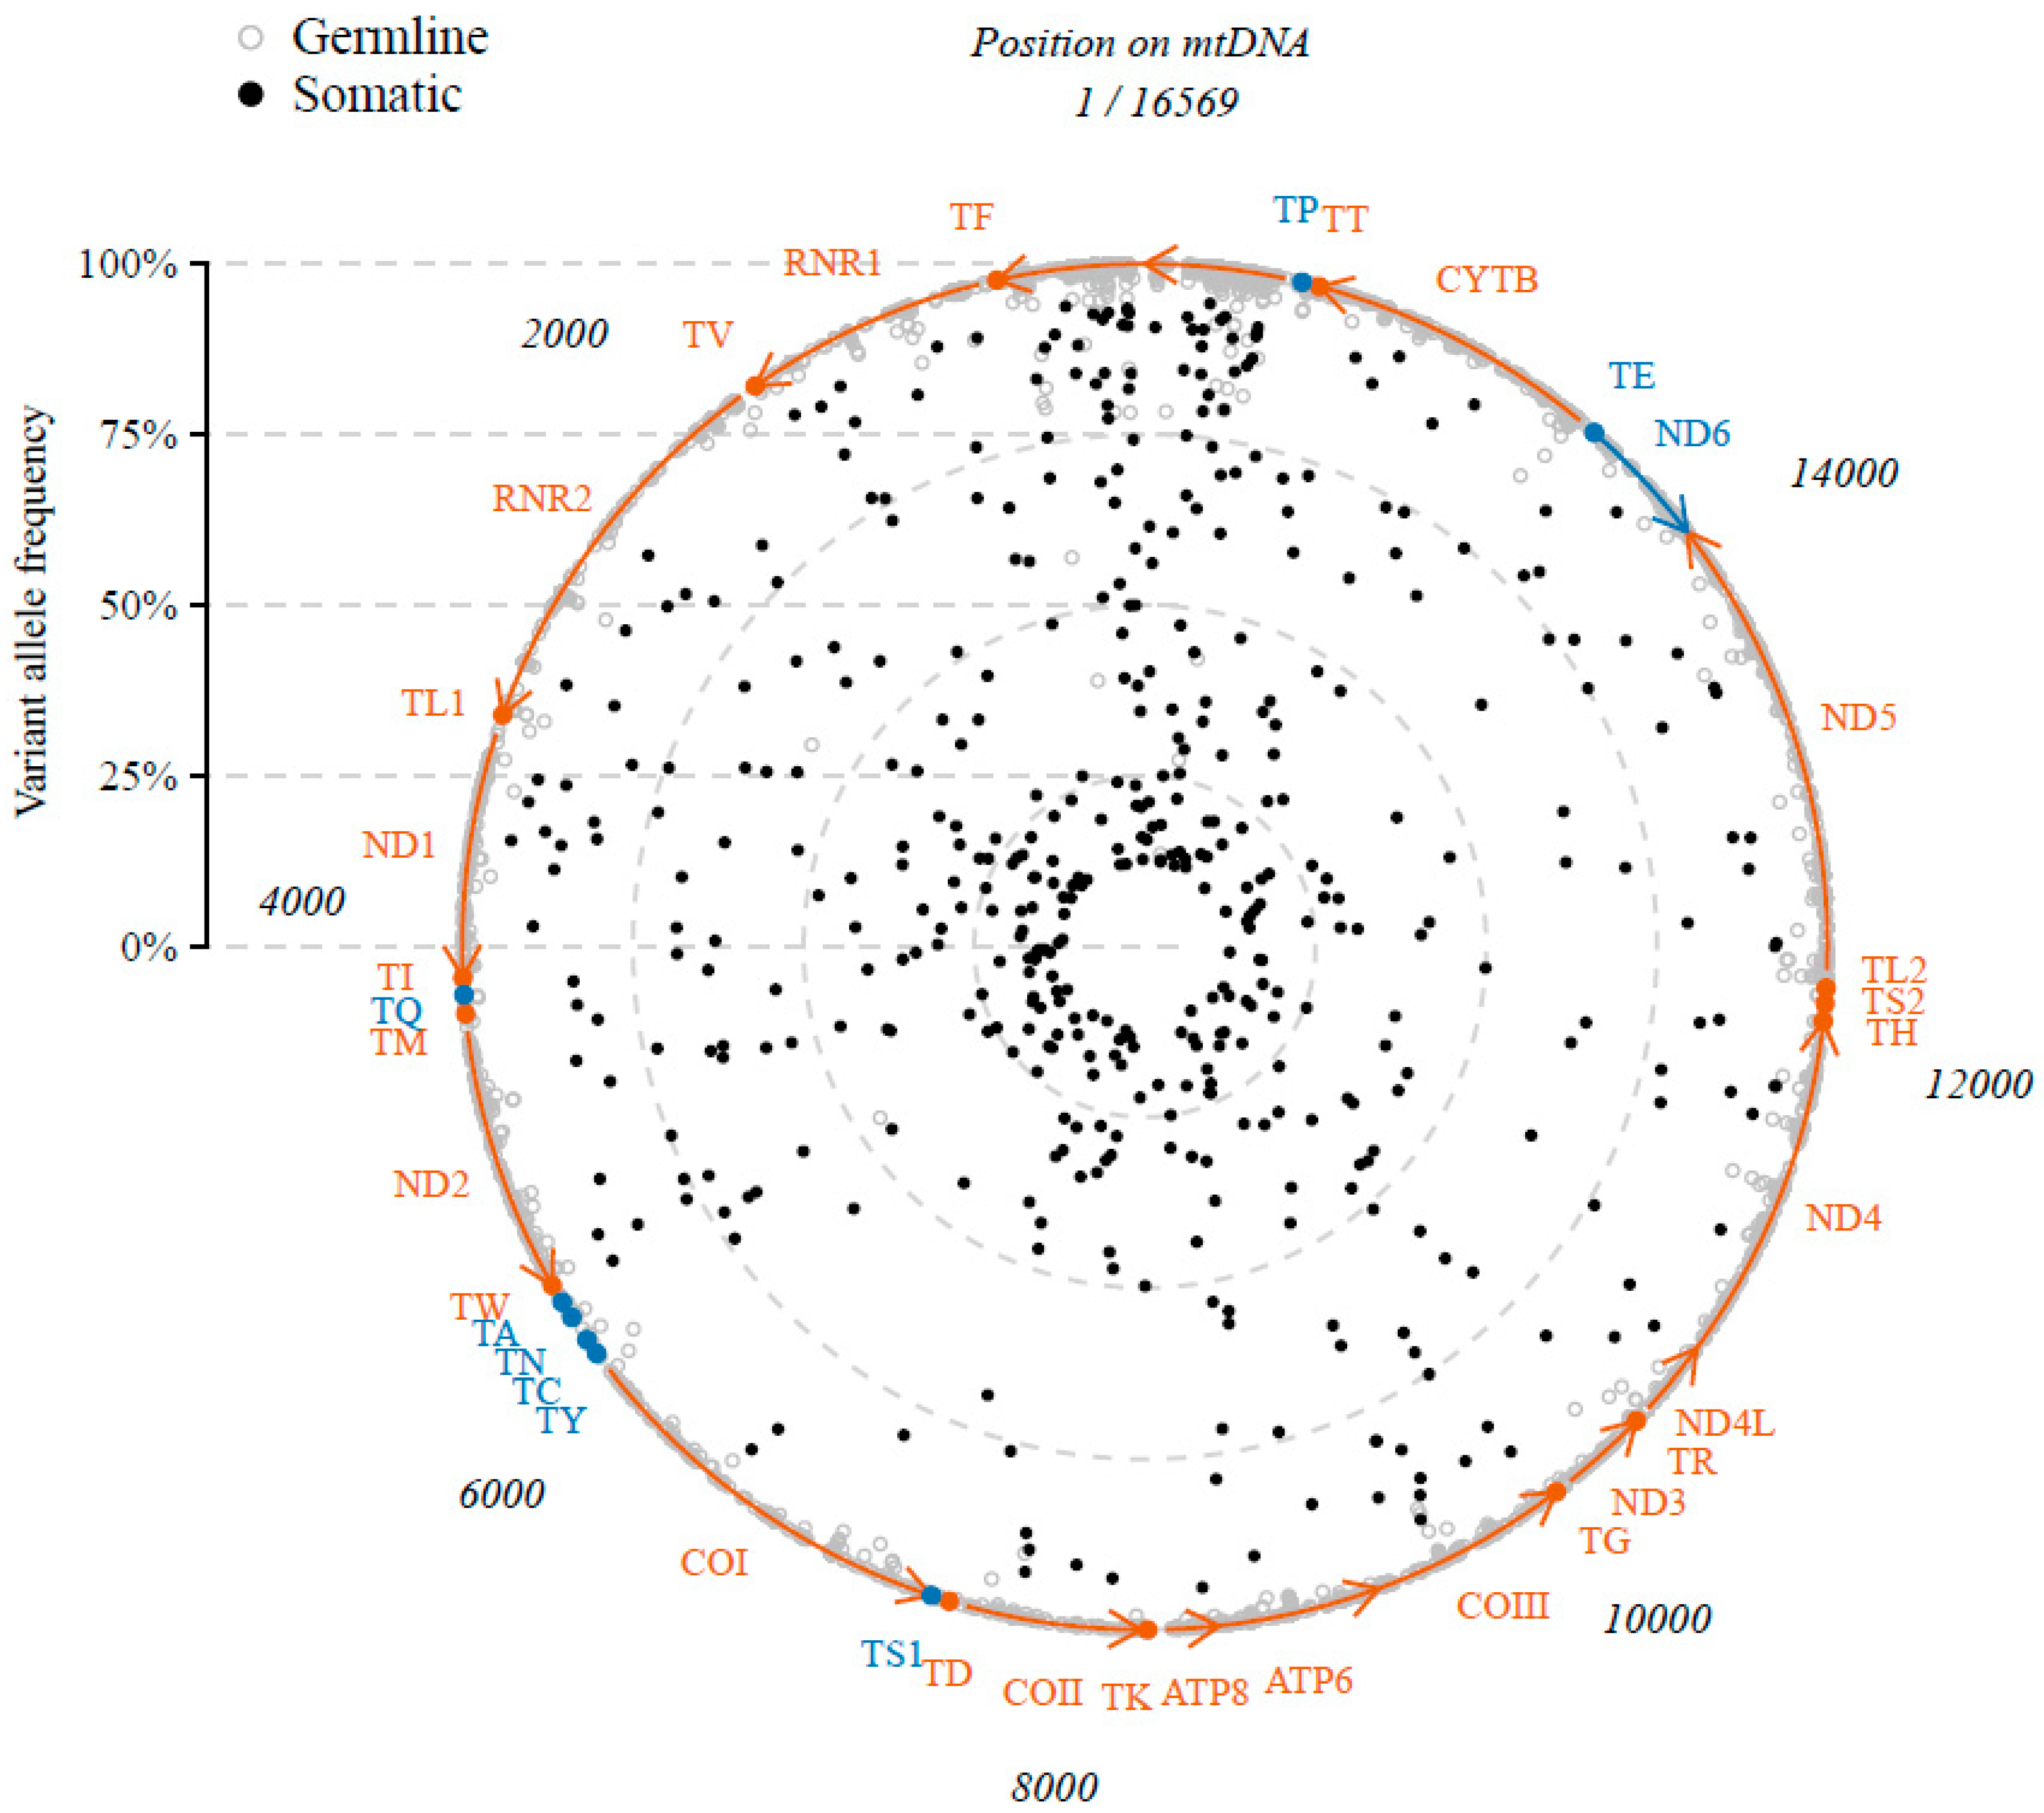
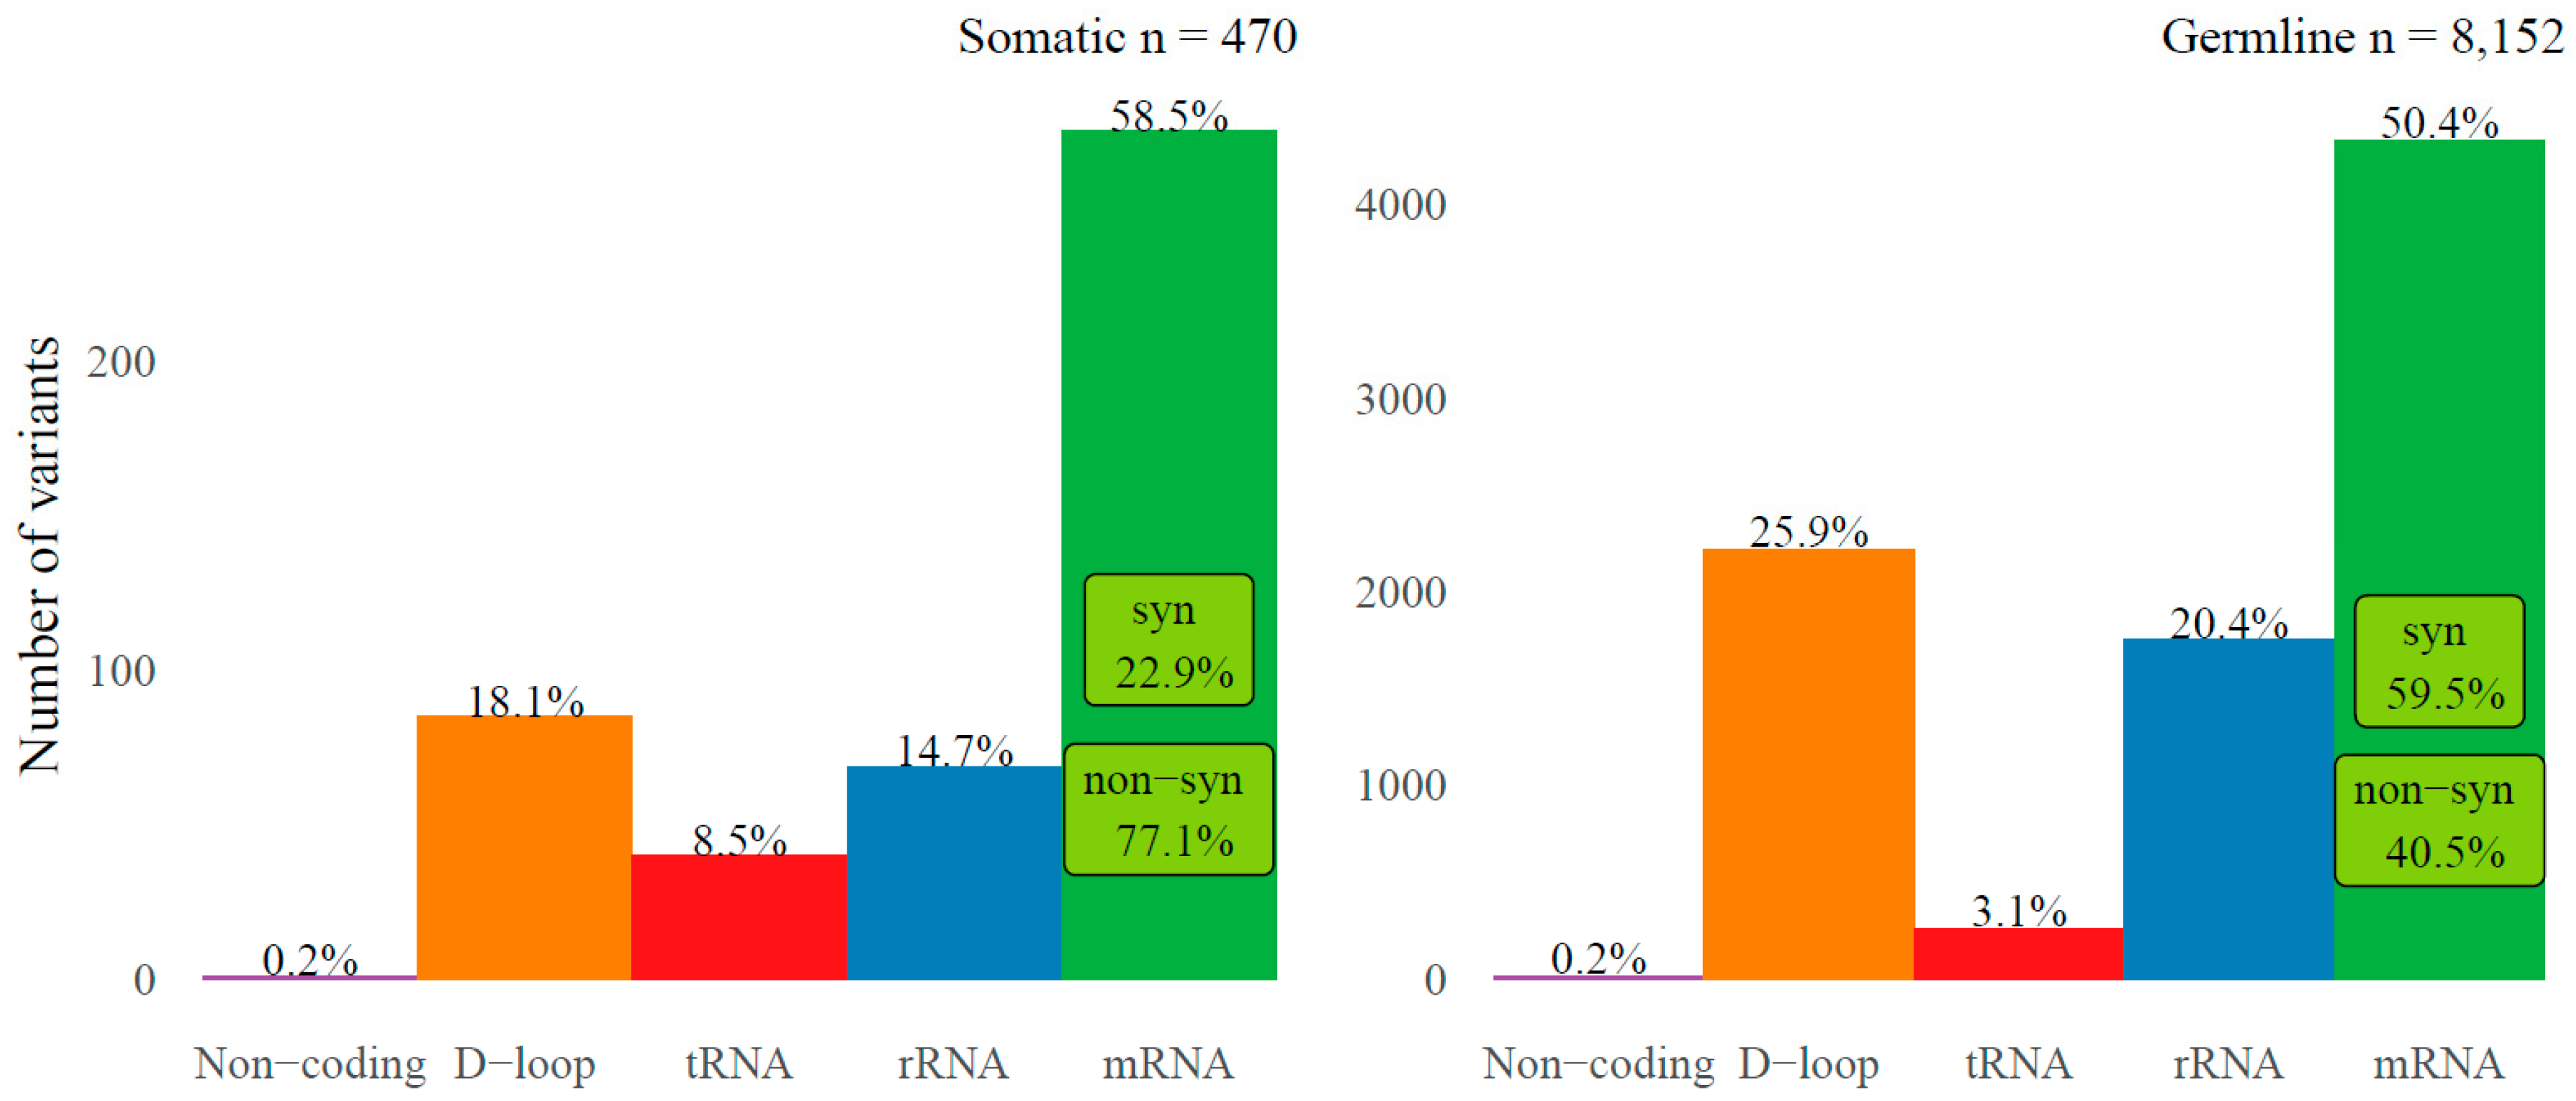
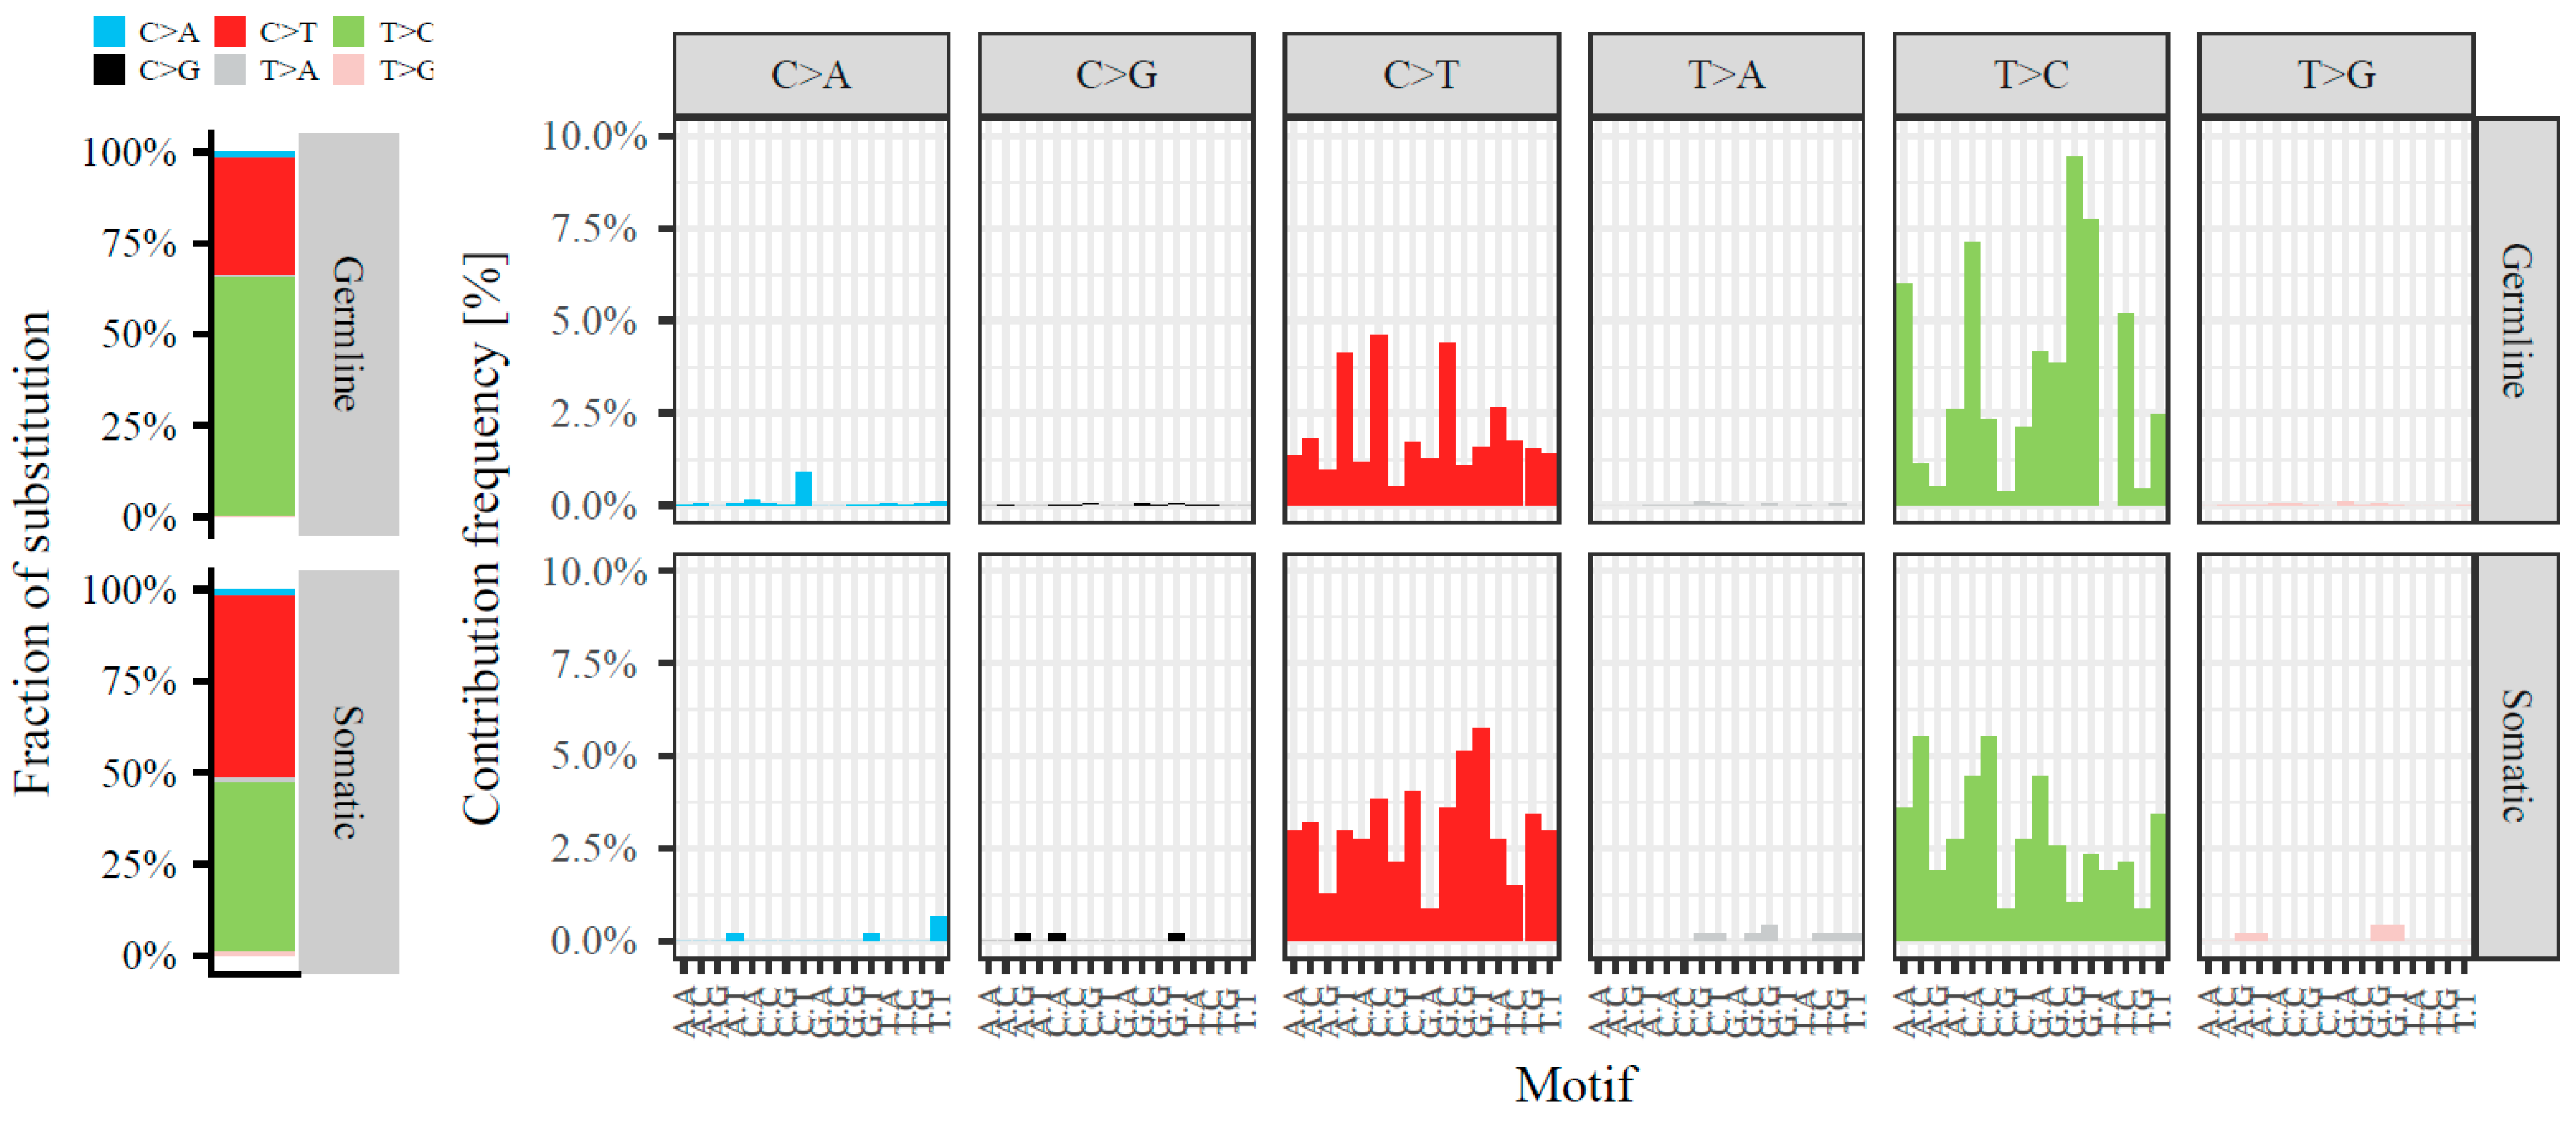
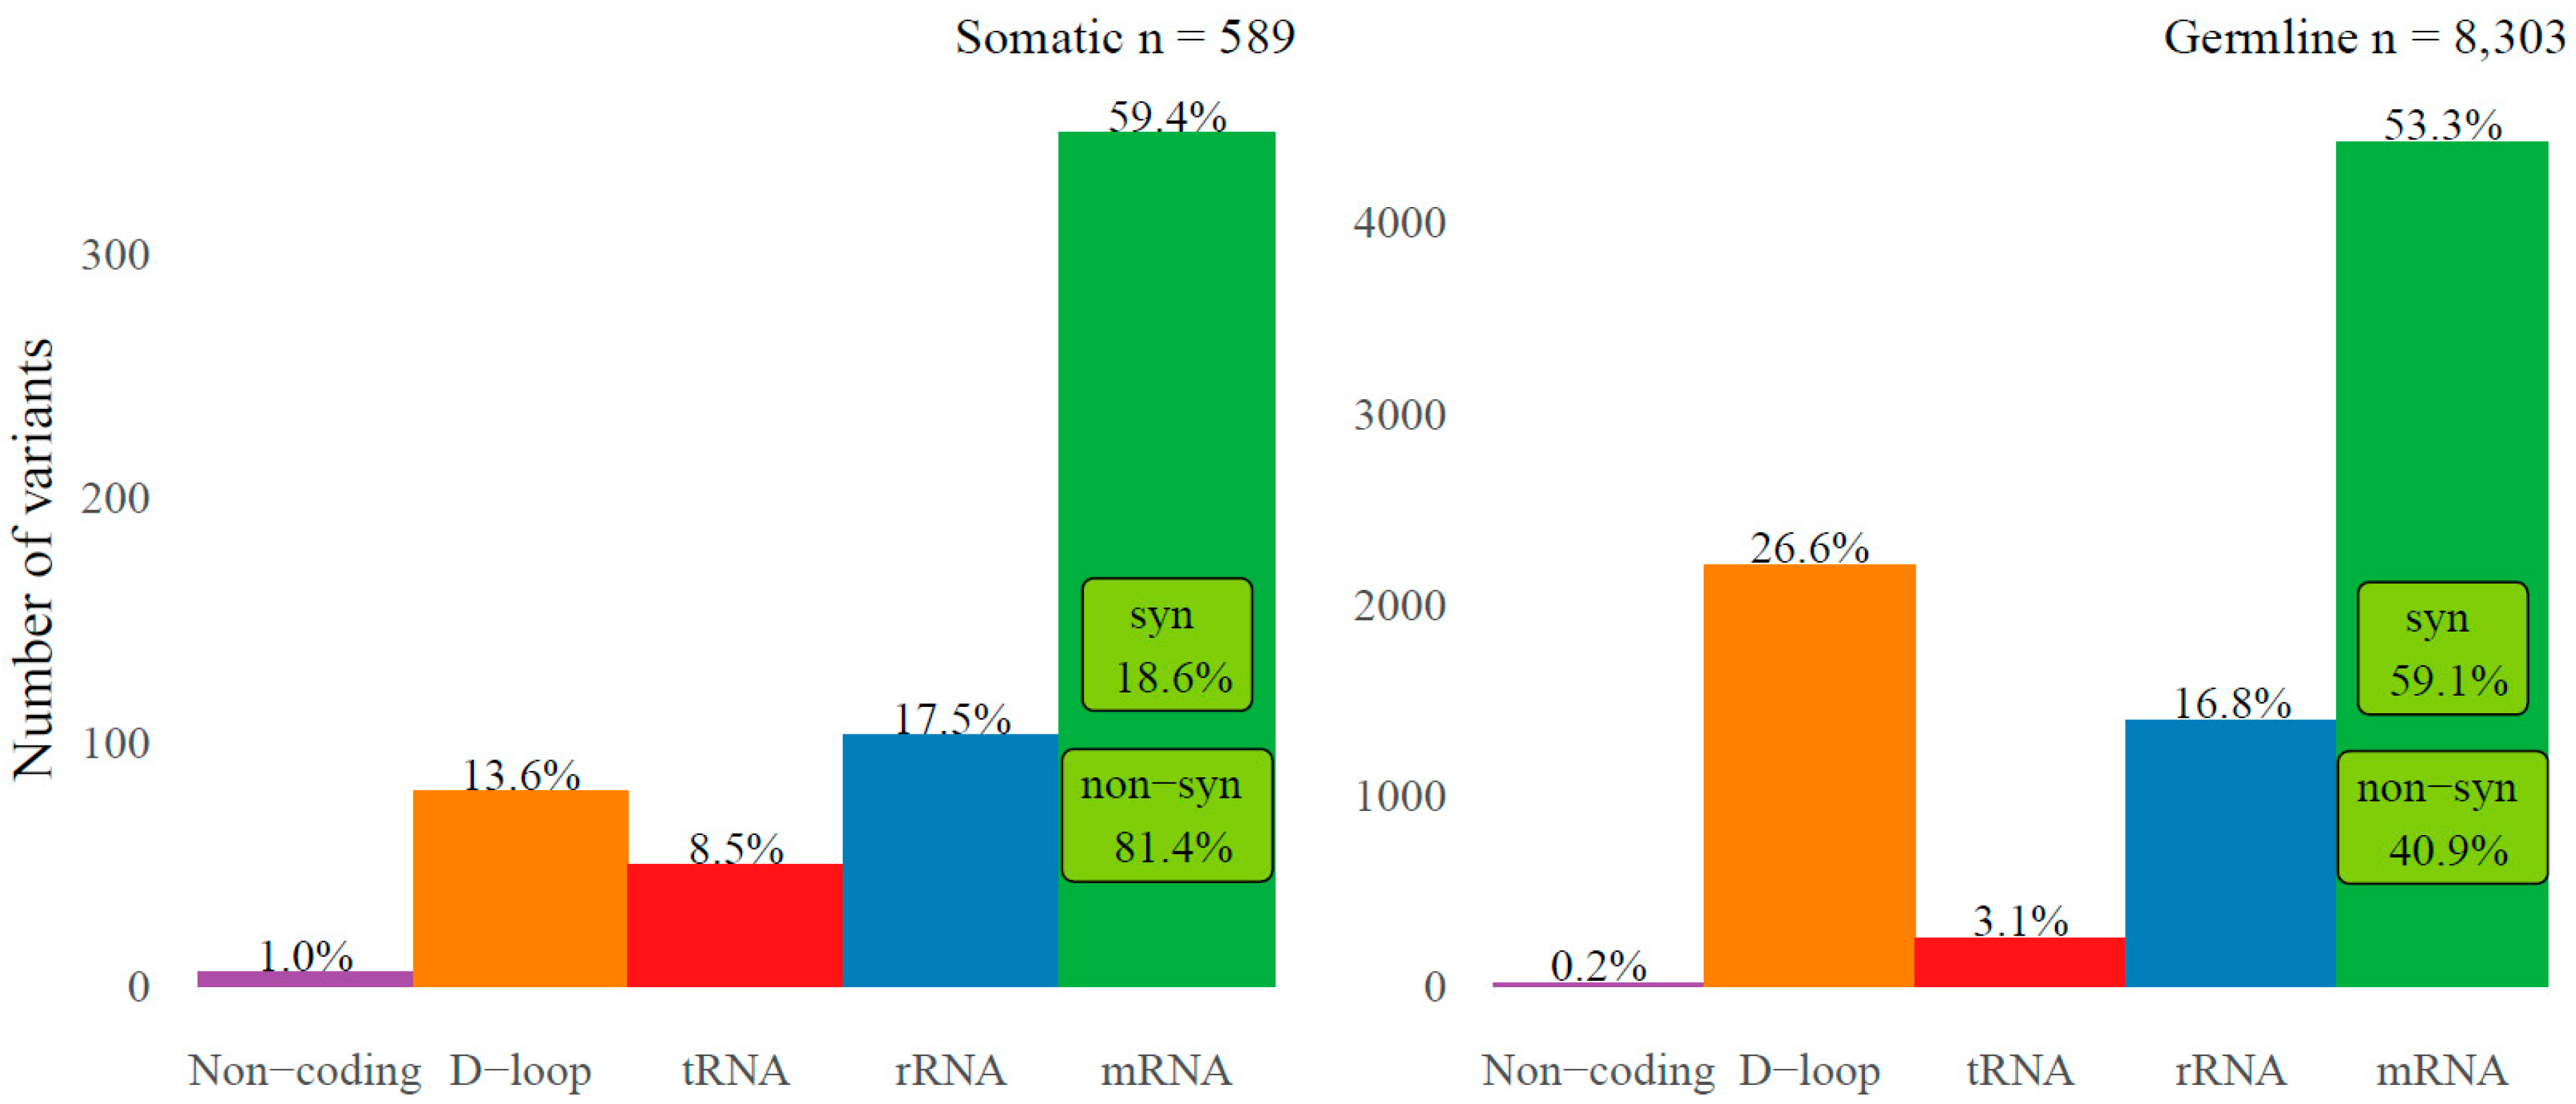
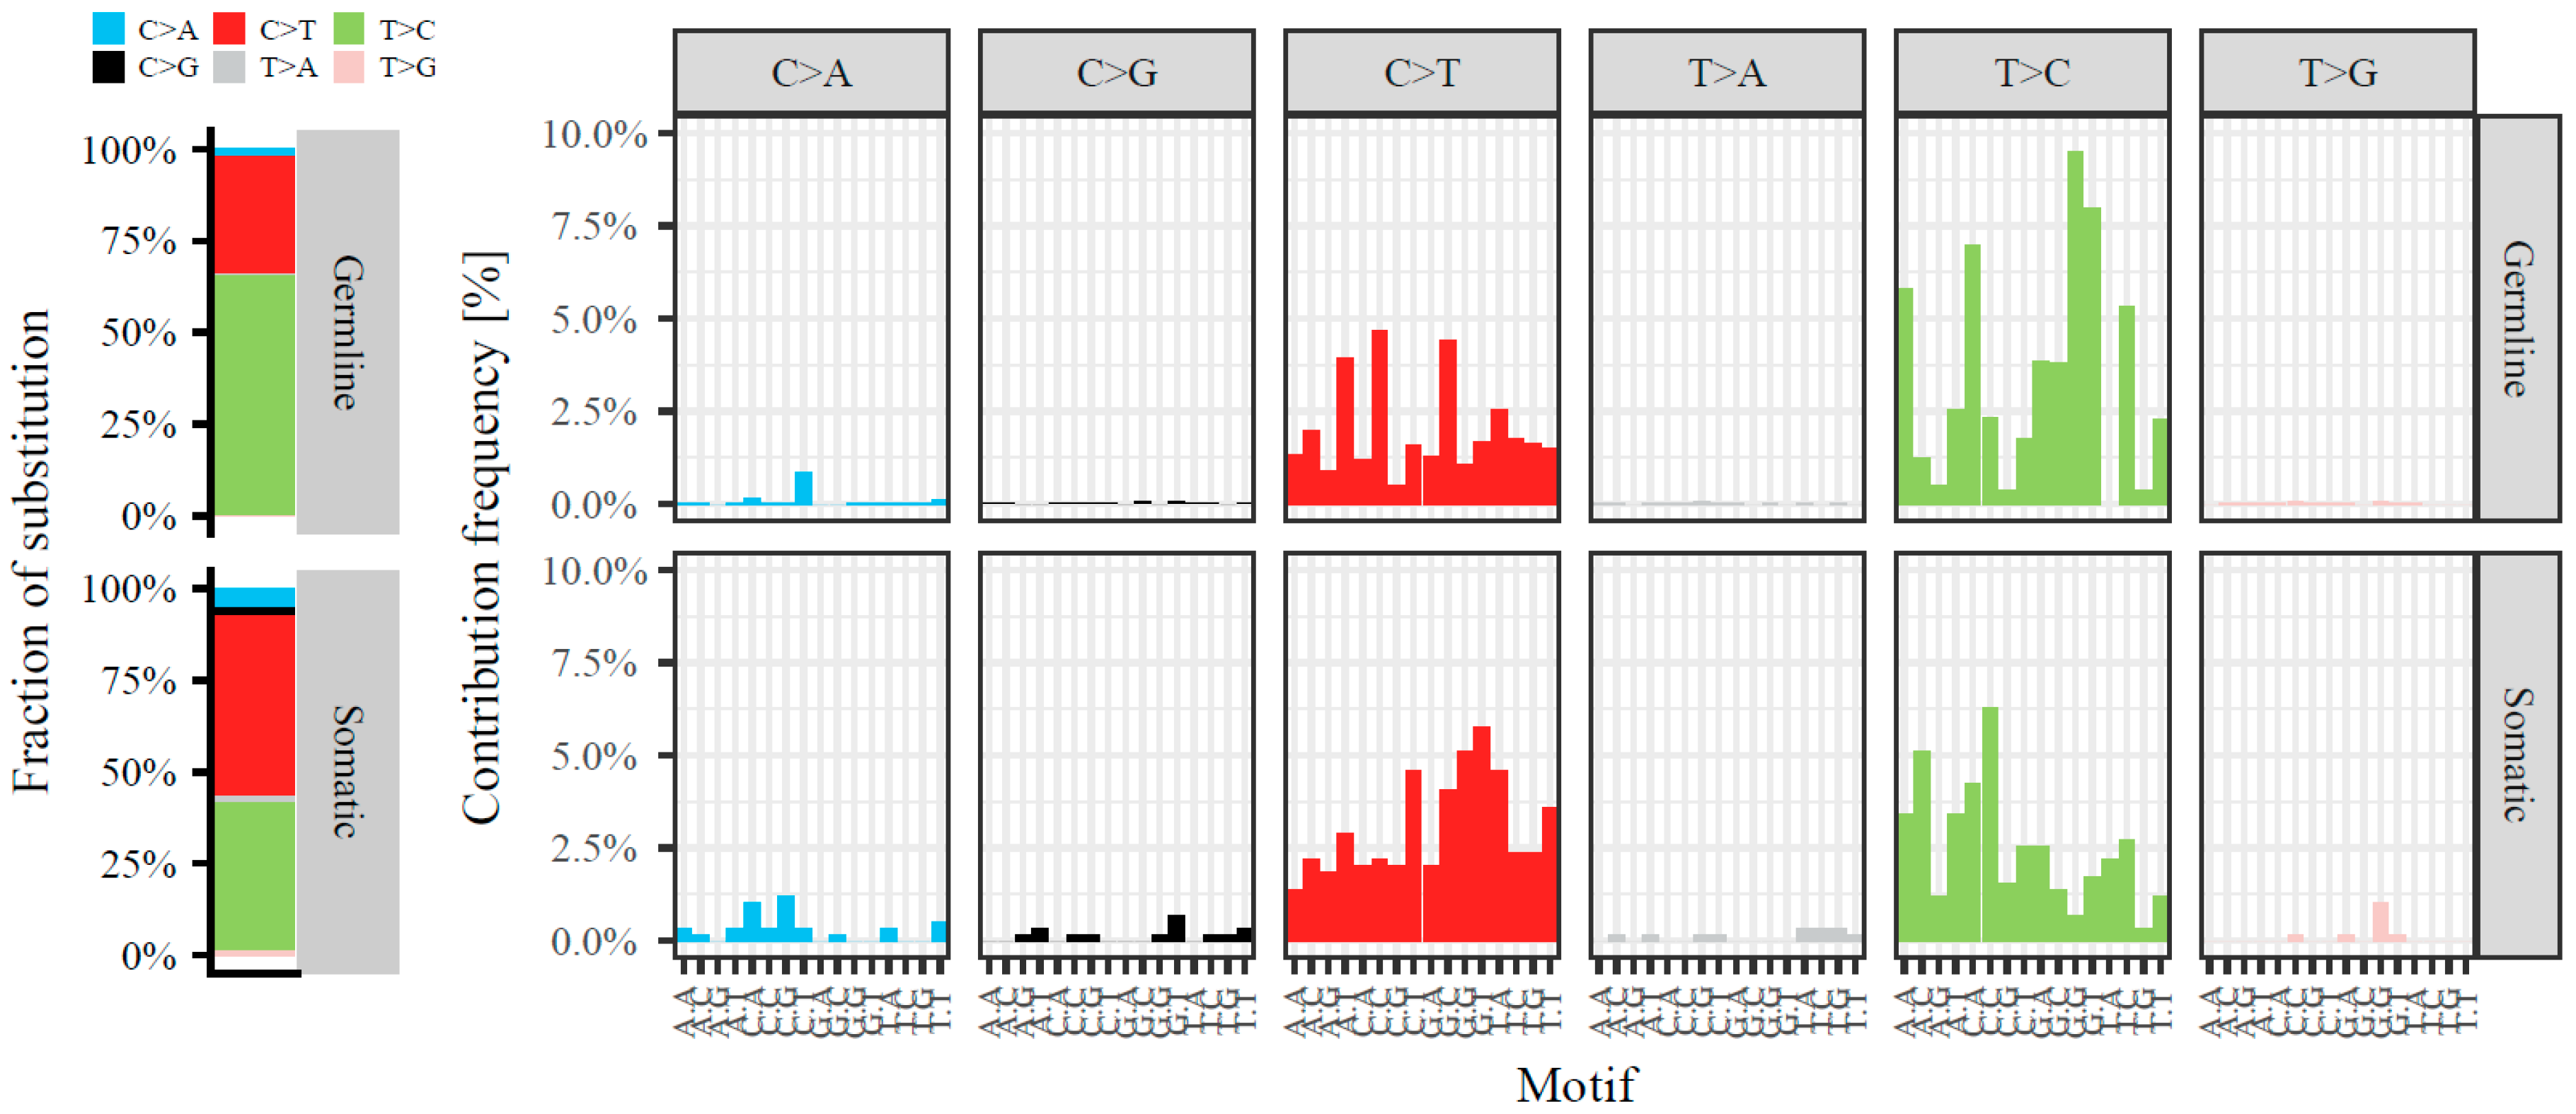
2.1. Somatic Variants in mtRNA

Variant calling resulted in a total of 9063 single nucleotide variants (SNVs) on 1600 positions and 84 small insertions or deletions (INDELs) on 38 positions of the mitochondrial genome within the 344 cases (Figure 1). Since INDELs were only a minority, our focus was on the SNVs only. We defined SNVs as somatically acquired tumor variants when not associated with the individual’s haplotype (n = 7235 excluded, 80%) or with heteroplasmic allele frequency of ≤95% (n = 917 excluded, 10%). Also, we defined the variants at position 2617 (r.2617a>u and r.2617a>g, present in respectively n = 340 and n = 101 cases) as not tumor-specific because (1) they have been described previously as RNA-DNA differences in blood cells of non-cancer patients [18,19] and (2) we confirmed their presence in a transcriptomic dataset of normal specimens of various tissue types including breast tissue [20] (Supplementary Materials Table S1). After these exclusions, a total of 470 somatic variants on 429 positions were identified.
Our dataset has overlapping cases (n = 165) with the dataset published by Ju et al. [15] concerning somatic mitochondrial variants in tumor and matched normal specimens at the DNA level. This allowed us to directly compare called variants between the two datasets (see also Appendix A) to evaluate presence, classification and allele frequency of variants. Since variants at position 2617 are known RNA-DNA differences (see above) and indeed not called in the DNA dataset, these were not included in this comparison. A total of respectively 3997 and 4009 SNVs were called at the RNA and DNA level within the primary tumor specimens of the 165 cases. The majority of the variants were called at both the RNA and DNA level (n = 3889, respectively 97.3% and 97.0%), whereas a small fraction was only called at either the RNA or the DNA level (respectively n = 108 (2.7%) and n = 120 (3.0%) variants) (Figure 2). Of the variants detected at both the RNA and DNA level, only a few (n = 10, 0.3%) had a discrepancy in classification as either ‘somatic’ or ‘germline’ (Figure 2). Also, good consistency was observed in allele frequency at the RNA and DNA level (linear fit coefficient of 0.92 for all variants and 0.96 for somatic tumor variants). From this we concluded that presence, classification and allele frequency of variants was consistent between the RNA and the DNA level (as elaborated on in the Appendix A).
We then continued to further decipher the somatic mtRNA variants in our dataset (n = 470 in n = 344 cases). The variant allele frequency of the somatic variants was distributed with a peak at the lower and at the upper end of allele frequencies (Supplementary Materials Figure S1). There was no correlation between the variant allele frequency and the percentage of invasive tumor cells in the evaluated specimen (Spearman correlation coefficient rho = 0.03, p = 0.5). The detected somatic variants were distributed along the entire mitochondrial genome (Figure 1), with 40 (8.5%) variants located in the tRNA genes, 69 (14.7%) in rRNA genes, 85 (18.1%) in the D-loop, 1 (0.2%) in the non-coding regions, and 275 (58.5%) in the mRNA genes of which 212 (77.1%) had a nonsynonymous effect on the coding amino acid (Figure 3). However, relative to their genomic size (9.0% tRNA genes, 15.1% rRNA genes, 6.8% D-loop, 0.4% non-coding and 68.7% mRNA genes) more variants were present in the D-loop and fewer in the mRNA genes (Fisher exact p < 0.001). Also in comparison to the germline variants (variants that were associated with the haplogroup of that individual or with an allele frequency > 95%, n = 8152) there was a difference in genomic distribution (Fisher’s exact p < 0.001) with fewer somatic variants in the D-loop but more in the tRNA and mRNA genes, and an enrichment for somatic nonsynonymous mRNA variants (Figure 3). The positions of somatic variants were much more conserved among species compared to the germline variants (Mann-Whitney test p < 0.001), as measured by the fraction of species that harbor the reference sequence at that position (Conservation Index of respectively median (IQR) 0.93 (0.36) and 0.76 (0.69)). A total of 69 (15%) somatic variants were recurrent and positioned on 28 mitochondrial positions. The majority of the somatic variants (95%) represented the typical replication-coupled mtDNA substitution pattern with predominantly C > T and T > C transitions as described previously [15,16,21] in a nucleotide context similar to the germline variants (Figure 4). However, compared to the detected germline variants the ratio between C > T and T > C variants is shifted (Fisher exact p < 0.001) with an increased number of C > T transitions among the somatic variants (Figure 4).
In the entire cohort, there are 112 (33%) cases with 0 somatic variants, 97 (28%) with 1 somatic variant, and 135 (39%) with more than 1 somatic variant (range 2 to 7). Of the cases with more than 1 somatic variant, 82 (61%) had a difference > 20% allele frequency between variants, indicative for (sub-)clonality.

2.2. Somatic Mitochondrial Variants in Relation to Somatic Variants in the Nuclear Genome

Next, to gain more insight into the relation between the mutational processes shaping mtDNA and nDNA, we associated the amount of somatic mtRNA variants with the number of somatic variants induced by the known major mutational patterns shaping the nDNA. For this purpose, we obtained for the overlapping cases (n = 268) the number of nDNA variants as published by Nik-Zainal et al. [17]. There was no statistically significant association between the number of somatic mtRNA variants and the total number of somatic variants in the nuclear DNA (Spearman correlation coefficient rho = 0.01, p = 0.8). Next, we combined per case the number of variants in nDNA associated with the mutational processes as described by Nik-Zainal et al. [17]: age-related (signatures 1 and 5), APOBEC-related (signatures 2 and 13) and homologous-recombination deficiency-related (signatures 3 and 8) processes. No statistically significant associations were observed between the number of somatic mtRNA variants and any of these three mutational processes (all Kruskal-Wallis p > 0.2). Note that only two samples within the dataset contained variants associated with mismatch-repair deficiency (signatures 6, 20 and 26), and none of samples contained variants associated with the signatures of unknown etiology (signatures 17, 18 and 30), as a consequence of which these specific subgroups could not be evaluated.

2.3. Mitochondrial Gene Expression

To estimate the expression and transcript processing of the mitochondrial genome for each case, transcripts per million (TPM, log2-transformed) were calculated for the entire mtDNA and each mitochondrial-encoded gene individually. Expression of the entire mtDNA—normalized against the nuclear genome and thus evaluated as driven by mtDNA content and transcription rate—was high and showed minor variability among the 344 cases (median 19.9210 TPM, IQR 0.0045). Within the 37 mitochondrial-encoded genes—normalized within the mitochondrial genome and thus evaluated as driven by processing of the polycistronic transcripts—the levels for genes encoding tRNAs were lowest (median 12.52 TPM, IQR 1.32), followed by mRNAs (median 15.37 TPM, IQR 0.31) and rRNAs (median 16.83 TPM, IQR 0.48). Most variability was observed in levels of tRNAs. Also, distinct correlation clusters were observed between the expression levels of the genes encoding mRNAs, tRNAs and rRNAs, where among genes a positive correlation was present per gene-type, but between different gene-types a negative correlation was present (Figure 5). No correlation was observed between the number of mtRNA variants and expression of the entire mtDNA (Spearman correlation coefficient rho = −0.02, p = 0.7).

2.4. Association with Clinicopathological Parameters

Lastly, we explored how these findings correlate with relevant clinical parameters. We analysed the number of somatic mtRNA variants (grouped variable as 0 variants, 1 variant and >1 variant per tumor, Table 1) and the expression of the entire mitochondrial contig (continuous variable, Table 1) in relation to traditional clinicopathological variables including age at diagnosis (n = 291 cases), tumor size (T-stage) (n = 216 cases), pathological grade (n = 282 cases), estrogen receptor (ER) status (n = 291 cases) and progesterone receptor (PR) status (n = 288 cases). Due to the low numbers of patients with HER2-amplified (n = 2 cases) and presenting with metastases at primary diagnosis (n = 3 cases), these clinicopathological variables were not evaluated. Age at diagnosis was statistically significant associated with both the number of somatic mtRNA variants (Kruskal-Wallis p = 0.022) and expression of the entire mtDNA (Spearman correlation coefficient rho = 0.11, p = 0.049), where a higher age corresponded to more somatic mtRNA variants and higher expression of the entire mtDNA. Also, a highly statistically significant association was observed between expression of the entire mtDNA and hormone receptor status (as evaluated at the protein level), with increased mtDNA expression in the ER-positive and in the PR-positive tumors (respectively Mann-Whitney U test p < 0.001 and p = 0.006). In fact, also a significant correlation was observed between expression of the entire mtDNA and RNA expression of ESR1 or PGR (respectively Spearman correlation coefficient rho = 0.19 p < 0.001 and rho = 0.17 p = 0.001, n = 344 and n = 342 cases).

3. Discussion

In this work, we explored genomic changes in and expression of the mitochondrial genome within primary breast tumors, and their correlation with clinicopathological variables.
Within our breast tumor dataset, the fraction of reads mapping to the mitochondrial contig of the reference genome (median 15%) is in line with previous findings in non-tumorous breast samples: within the Illumina Body Tissue Atlas ~15% of the sequencing reads mapped to the mitochondrial genome (n = 1) [22], and within the Genotype-Tissue Expression (GTEx) Consortium ~15–20% of the transcriptional output was of mitochondrial origin (n = 27) [23]. This is in line with the requirement for functional mitochondria within cancer cells [24]. This also indicates that although the expression of the mitochondrial genome has been shown to be decreased in breast tumors compared to tumor-adjacent normal mammary tissue [11], the extent to which this occurs is less extreme than observed among tissue types (e.g., a much lower fraction of mitochondrial reads in blood (<5%) or much higher fraction in kidney (>50%) [23]). Nevertheless, we observed an association between expression of the entire mtDNA and ER status (measured at protein-level), with marginally higher expression in ER-positive tumors and a similar observation for PR status (protein-level) (Table 1). In addition, also RNA expression of ESR1 and PGR was positively correlated with expression of the entire mitochondrial contig. The relation between expression of mtDNA and clinicopathological parameters has not been evaluated by others, but when we associated the data reported by Reznik et al. [11] on mtRNA expression within the TCGA-BRCA dataset (n = 656 cases) we observe a similar correlation for ER status (Kruskal-Wallis p = 0.006, Supplementary Materials Table S2 and none for the other clinicopathological variables (all p > 0.05 Supplementary Materials Table S2). In pre-clinical models, there appears to be a link between ER and mitochondrial activity: exposure to estrogens increases mitochondrial expression and oxygen consumption in ER-positive [25,26] but not in ER-negative breast cancer cells [26]. Similarly, ER-negative breast cancer cell lines show lower mitochondrial respiration and a stronger dependency on glycolysis in comparison to ER-positive breast cancer cells [27]. Unfortunately, measurements on mitochondrial activity comparing ER-positive and ER-negative clinical specimens are to our knowledge not reported in the literature, and thus the effect of differences in ESR1 levels on mitochondrial activity in primary breast tumors remains currently unknown. Interestingly, uptake values of fluorodeoxyglucose (FDG) in positron emission tomography (PET)—a visualization of glucose uptake reflecting the increased rate of glycolysis in the tumor—appears to be higher in ER-negative cases [28,29,30,31,32,33,34], indicative that indeed metabolic differences are present between the subtypes. Additional studies should be performed to identify if there are differences in mitochondrial (oxidative phosphorylation) function among breast cancer subtypes and the potential clinical relevance of these findings, such as predictive and prognostic potential.
We also observed distinctive clustering of tRNA genes, which is in line with the tRNA punctuation model: when processing the polycistronic transcripts, tRNA genes are excised and due their small size (<75 base pairs) tRNAs are more likely to be lost during the RNA extraction and/or library preparation procedures, whereas the mRNA and rRNA genes are retained (>200 base pairs). Notably, we did not observe differences in this distinct pattern between the ER-positive and the ER-negative cases (Supplementary Materials Figures S2 and S3), and thus the processing of the polycistronic transcripts does not seem to differ between these two subtypes.
Our findings on the number, genomic distribution, and substitution pattern of mtDNA variants within the mitochondrial transcriptome are in line with previous studies on variants within the mitochondrial genome in other cancer types [8,15,16,21,35,36] (see also Appendix A). We observe an increased number of somatic variants in the D-loop and fewer in mRNA genes than expected by genomic size, which might be explained by the gene-dense constitution of mtDNA: variants in the D-loop potentially have less destructive effects whereas variants in the mRNA genes might have detrimental effects on the function of the oxidative phosphorylation system, and thus will be selected against. Also, the structural conformation of the D-loop (a triple-stranded structure) could make it more prone to damage. However, compared to germline variants in our dataset there are fewer variants in the D-loop and more in the tRNA and mRNA genes, and enrichment for nonsynonymous variants. This might be explained by the typical mutation pattern shaping mtDNA, which has been shaping the germline variants and thus the trivial positions have already been altered, as suggested by Ju et al. [15]. In line with this, the conservation of variants among species—the fraction of species that harbor the reference sequence at that position—was much higher for somatic variants than for the germline variants, which can be explained by the same hypothesis. Adding to this, compared to the detected germline variants there is an increased number of C > T transitions among the somatic variants (Figure 4). Note that the functional effect of somatic mtDNA variants on mitochondrial function is dependent on the actual position (e.g., protein-coding regions) and consequence (e.g., stop-gain or nonsynonymous) of the variant in combination with their heteroplasmy level within the tumor cell, rather than merely the number of somatic variants observed.Adjusting variant allele frequency to account for sample purity (percentage of tumor cells within the specimen) is often applied for nuclear-encoded genes to obtain information on the allele frequency of variants in the tumor cells. However, this is not possible for mtDNA variants in tumor tissue specimens: the number of mtDNA molecules per cell largely varies among cell types and thus the non-tumor cells present in the specimen do not have the regular two copies as the nuclear genome would have, but contain multiple mtDNA copies of an unknown number. As a result, whereas allele frequency of variants could give information on possible constraints on variants, we did not perform analysis on it since it is impossible to estimate the actual allele frequency of variants in the mitochondria of tumor cells. Nevertheless, we show that majority of the samples with more than 1 somatic variant harbor a difference in variant allele frequency between variants, indicative for (sub-)clonality. This corresponds to the hypothesis that mtDNA variants are either expanded or lost [37] and that the mutations occur separated in time [15].
Also noteworthy is that with the current methodologies applied by us and by others—namely the use of non-micro dissected tumor specimens and blood as matched normal DNA—we cannot be completely sure that the detected somatic mtDNA mutations are tumor-specific. First, tumor tissue specimens consist of multiple cell types, including the tumor cells but also non-neoplastic cells such as immune cells and cells from the mammary epithelium, all with variable mtDNA content. Secondly, (somatic) mtDNA variant heteroplasmy patterns can differ within an individual across tissues [38,39,40,41]. Thus, the somatic variants were either acquired in the tumor, the normal somatic epithelium, or even in other cell types present within the specimen.
We did not observe associations between the number of somatic mtRNA variants and the three major mutational processes shaping the nDNA within breast tumors. This is in line with the hypothesis that mutations within the mitochondrial genome are mainly due to fidelity of the mitochondrial polymerase [42] and thereby hardly due to exogenous factors [15]. Accordingly, in our evaluation of associations with clinicopathological parameters we observed a statistically significant association between the number of mtRNA somatic variants and age at diagnosis. Previous work on somatic variants at the DNA level also revealed a correlation with older age of diagnosis (n = 381 [15] and n = 58 cases [35]). Previous work in a small cohort also showed associations between number of somatic variants in mtDNA and higher TNM and higher histological grade (n = 58 cases [35]), which we did not observe. Please note that there are differences in the composition of the cohorts; our dataset does not exactly represent the breast cancer population as seen in daily practice, with an underrepresentation of ERBB2-amplified cases (Supplementary Materials Table S3).
By using data at the RNA level, we intended to minimize the interference of NUMTs with evaluation of mtDNA expression and variant calling, since their expression in the nucleus is negligibly low [11,43]. Especially in defining heteroplasmic mtDNA variants in DNA data, NUMTs have been shown to be a complicating issue with non-identical positions misinterpreted as heteroplasmic variants [44,45,46,47,48]. Note that we do observe a few heteroplasmic variants at the DNA-only level (Appendix A). However, using data at the RNA level comes with the trade-off that only variants in expressed regions are detected and thus variants in non-expressed regions are missed. Since mtDNA is a gene-dense entity, we estimate that the number of missed variants should be low. Indeed, in our direct comparison of samples with variants at the RNA and DNA level, we show that this is maximally ~3% of the variants (DNA-only variants). Similar to these findings, the comparison by Stewart et al. [16] on somatic variants at the RNA and DNA level showed 7 of the 130 variants (5%) detected at only the DNA level within their set of 100 breast cancer specimens. Another trade-off using RNA is the additional step to generate cDNA, which might induce false positive calls by mistakes of the reverse transcriptase. Again based on our direct comparison of samples with variants at the RNA and DNA level, the number of false positives is maximally 3% of the detected variants (RNA-only variants). Though, besides false positives, these RNA-only variants might actually be RNA-DNA differences for example caused by RNA-editing [49], or true variants not called at the DNA level.

4. Materials and Methods

4.1. Data

We studied all patients with RNA sequencing data within the ICGC BASIS consortium, of which the cohort has been described previously [17] and data deposited in the European-Genome Phenome Archive (accession code EGAS00001001178). Briefly, for a total of 348 primary breast tumors we generated duplex-specific nuclease-based RNA sequencing data. Four samples were excluded from analyses due to potential cross-contamination (see below). We did not apply a threshold on tumor cell percentage within the specimen for inclusion in this study. Clinicopathological data and the nuclear somatic mutation catalogue were obtained from the Supplementary Tables as provided by Nik-Zainal et al. [17]. Expression levels of ESR1, PGR (quantile normalized FPKM, log2 transformed) were obtained as described previously [50]. A complete dataset on all variables used in our analyses is provided in Supplementary Materials Table S3. In addition, we used publically available RNA sequencing data of twelve human tissue specimens obtained via a similar sequencing approach [20], that has been deposited in NCBI’s Gene Expression Omnibus (GEO) (accession code GSE45326). Also, we used the mtDNA variants called by Ju et al. [15] from whole-genome or whole-exome sequencing data of DNA from the primary breast tumor specimens and matched normal tissue specimens as provided in their Supplementary Tables.

4.2. Bioinformatics

Sequencing reads were aligned using STAR v2.4.2.a [51] against the Genome Reference Consortium Human Build 38 (GRCh38, GenBank assembly GCA_000001405.15), which contains as the mitochondrial contig the revised Cambridge Reference Sequence (rCRS). Only non-duplicated uniquely mapped reads on mtDNA were used for further analysis, to avoid the potential use of improper assigned nuclear insertions of mitochondrial origin (NUMTs, mitochondrial pseudogenes). Note that RNA expression of NUMTs has been shown to be absent or negligibly low [11,43]. Total read depth was estimated based on the read length (75 nucleotides) and mtDNA size (16,569 nucleotides). FeatureCounts v 1.4.6 [52] was used to count mapped reads using mtDNA as the meta-feature and each genomic region (13 mRNAs, 22 tRNAs, 2 rRNAs) as the features, allowing multi-overlapping reads (-O) because of the polycistronic nature of mitochondrial RNA transcripts. We normalized read counts to transcripts per million (TPM) for the entire mitochondrial contig (mtDNA read counts versus total read counts assigned to genes in GRCh38, defined as entire mtDNA levels) and for each mitochondrial-encoded gene (gene read counts versus total mtDNA read counts, defined as <gene> levels). In this way, the TPM for the entire mtDNA represents the total amount of mtRNA influenced by both mtDNA content, transcription rate and transcript stability, whereas the TPM for each mitochondrial-encoded gene represents the variation in gene expression driven by processing of the polycistronic transcripts and transcript stability [53]. A complete dataset of all expression levels is provided in Supplementary Materials Table S4. Variants alternative to rCRS were called using GATK HaplotypeCaller 3.4-46-gbc02625 [54] using default settings (including downsampling_type = BY_SAMPLE, downsample_to_coverage = 500, standard_min_confidence_ threshold_for_calling = 20). In this way, maximum depth of coverage is controlled at each locus, resulting in a more even coverage of variants between the samples. Hard-filtering was applied to the called variants for quality by depth (QD > 2), alternative depth (AD of ALT > 10) and strand odds ratio (variants with allele frequency ≤ 95% i.e., heteroplasmic variants: SOD < 4 for SNVs and SOD < 10 for INDELs; variants with allele frequency > 95% i.e., (near) homoplasmic: no filtering). In this way, the allele frequency of detected variants was high and confident enough to be a true variant and likely no sequencing errors or PCR mistakes. In addition, after visual inspection of variants (Integrative Genomics Viewer [55,56]), potential false positive calls in challenging regions were excluded: positions surrounding the homopolymer region 301–315 (“D310”), positions 512–513 due to a repetitive sequence, alternative C calls at positions 16,182–16,183 and 16,189 due to polyC sequences, and alternative A at positions 4264, 5513 and 12,138–12,139 due to polyA sequences. A complete dataset of all remaining variants is provided in Supplementary Materials Table S5. All remaining single nucleotide variants were used in a nucleotide BLAST against the human reference sequence (NCBI’s nucleotide web blast, https://blast.ncbi.nlm.nih.gov) with the surrounding reference sequence (30 bases 5′ and 30 bases 3′) to uncover potential NUMT events, but none were recovered. The conservation index (45 species conservation) for the protein-coding genes, tRNAs and rRNAs were obtained via SNV Query in Mitomaster [57]. The haplotype of each case was estimated by using the heteroplasmic and homoplasmic variants in HaploGrep v2 [58]. Sample cross-contamination was estimated using only the heteroplasmic variants (allele frequency ≤ 95%) in haplotype assignment. This identified four samples with heteroplasmic contamination of another haplotype, therefore these samples were excluded from analyses. Sample mismatch between cases with variants called in both RNA (our dataset) and DNA (dataset Ju et al. [15]) sequencing data (n = 168) was estimated by haplotyping based on all near-homoplasmic variants (allele frequency > 95%), and comparison of the obtained haplogroup. Mismatch was observed for 13 patients, but after manual inspection specificity could be confirmed for 10 patients by the presence of private variants. Two patients with a clear mismatch, and one patient ambiguous in mismatch, were excluded from the RNA-DNA comparison analyses (n = 165 remaining).

4.3. Statistics

Performed statistical tests are reported in the results section. All statistical tests were two-sided, and P values smaller than 0.05 were considered as statistically significant. Outliers data points in boxplots are defined as Q1−1.5*IQR or Q3+1.5*IQR. Analyses were performed in R version 3.3.2 (https://cran.r-project.org). Data analyses included usage of the following packages: the set of tidyverse, ggcorplot, SomaticSignatures [59] and VennDiagram [60].

5. Conclusions

To conclude, in this explorative study on the role of mtRNA in breast cancer, we found that somatic variants at the DNA level are reflected at the RNA level with no hotspot mutations and great heterogeneity across tumors. We confirm that the number of somatic variants within the mitochondrial transcriptome is not associated with the mutational processes shaping the nuclear genome but instead, is associated with age of diagnosis. Furthermore, we show that mitochondrial expression is related to ER status. The exact consequence of the observed differences in mtRNA expression and the detected somatic variants on cancer metabolism and clinical outcome warrants further study.

Supplementary Materials

The following are available online at https://www.mdpi.com/2072-6694/10/12/500/s1, Figure S1: Histogram of variant allele frequency of the somatic mitochondrial RNA variants of 344 primary breast tumor cases, Figure S2: Correlation matrix of expression of all 37 mitochondrial-encoded genes of 81 ER-negative primary breast tumor cases, Figure S3: Correlation matrix of expression of all 37 mitochondrial-encoded genes of 210 ER-positive primary breast tumor cases, Table S1: Position 2617 in normal tissue specimens, Table S2: Association between mtRNA expression and clinicopathological variables in TCGA-BRCA, Table S3: Clinicopathological and other variables per sample (n = 344 cases), Table S4: Expression levels of mtRNA per sample (n = 344 cases), Table S5: Variants in mtRNA per sample (n = 344 cases).

Author Contributions

Conceptualization, M.J.A.W., M.S., J.A.F., S.S. and J.W.M.M.; Formal analysis, M.J.A.W. and M.S.; Funding acquisition, J.W.M.M.; Methodology, M.J.A.W. and M.S.; Supervision, J.A.F., S.S. and J.W.M.M.; Writing—original draft, M.J.A.W.; Writing—review & editing, M.J.A.W., M.S., J.A.F., S.S. and J.W.M.M.

Funding

The data used in this work has been funded through the ICGC Breast Cancer Working group by the Breast Cancer Somatic Genetics Study (BASIS) (FP7/2010-2014, grant agreement number 242006) and the Triple Negative project (Wellcome Trust grant reference 077012/Z/05/Z).

Acknowledgments

We acknowledge all members of the ICGC Breast Cancer Working Group.

Conflicts of Interest

The authors declare no conflict of interest.

Appendix A

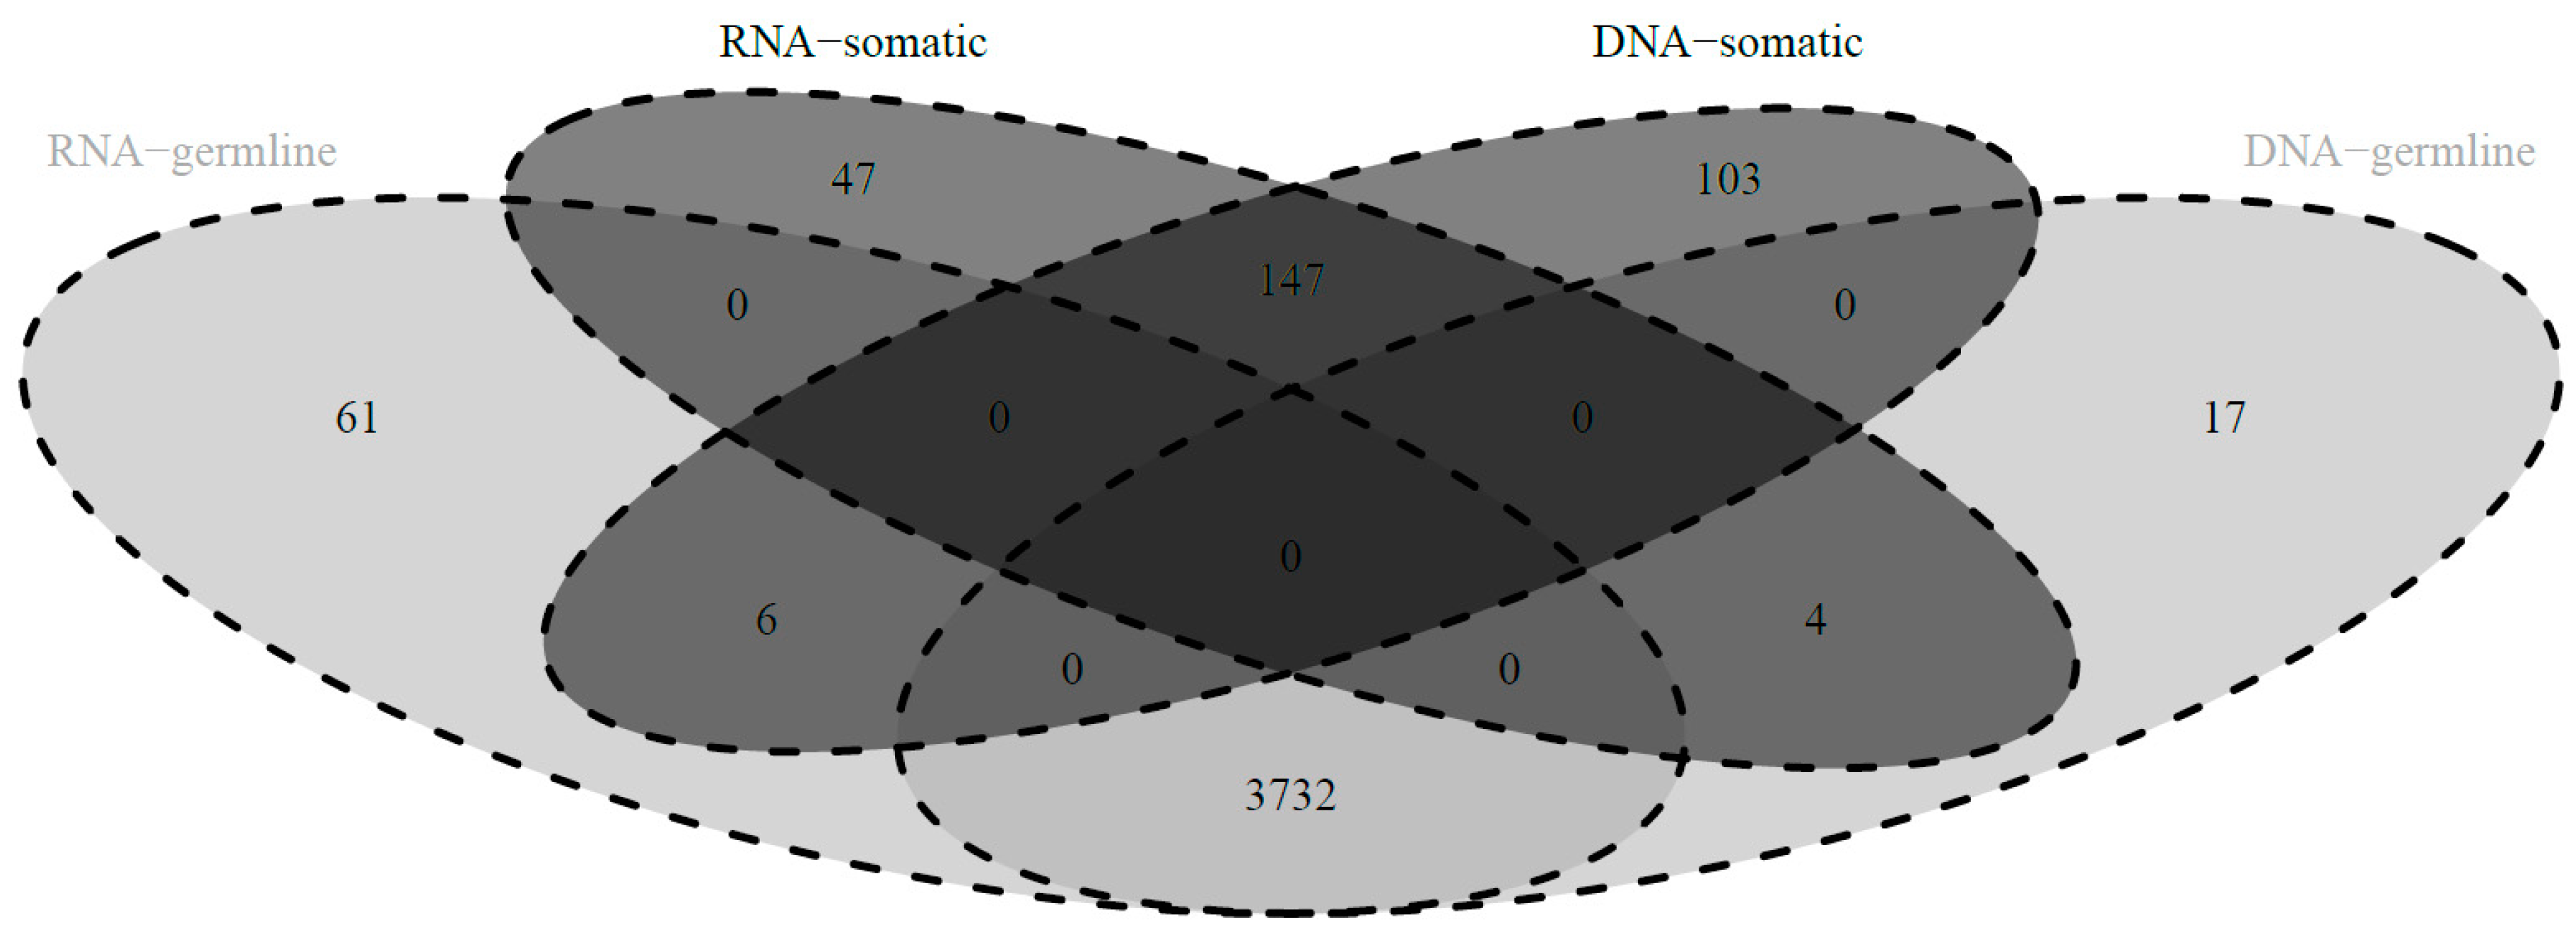
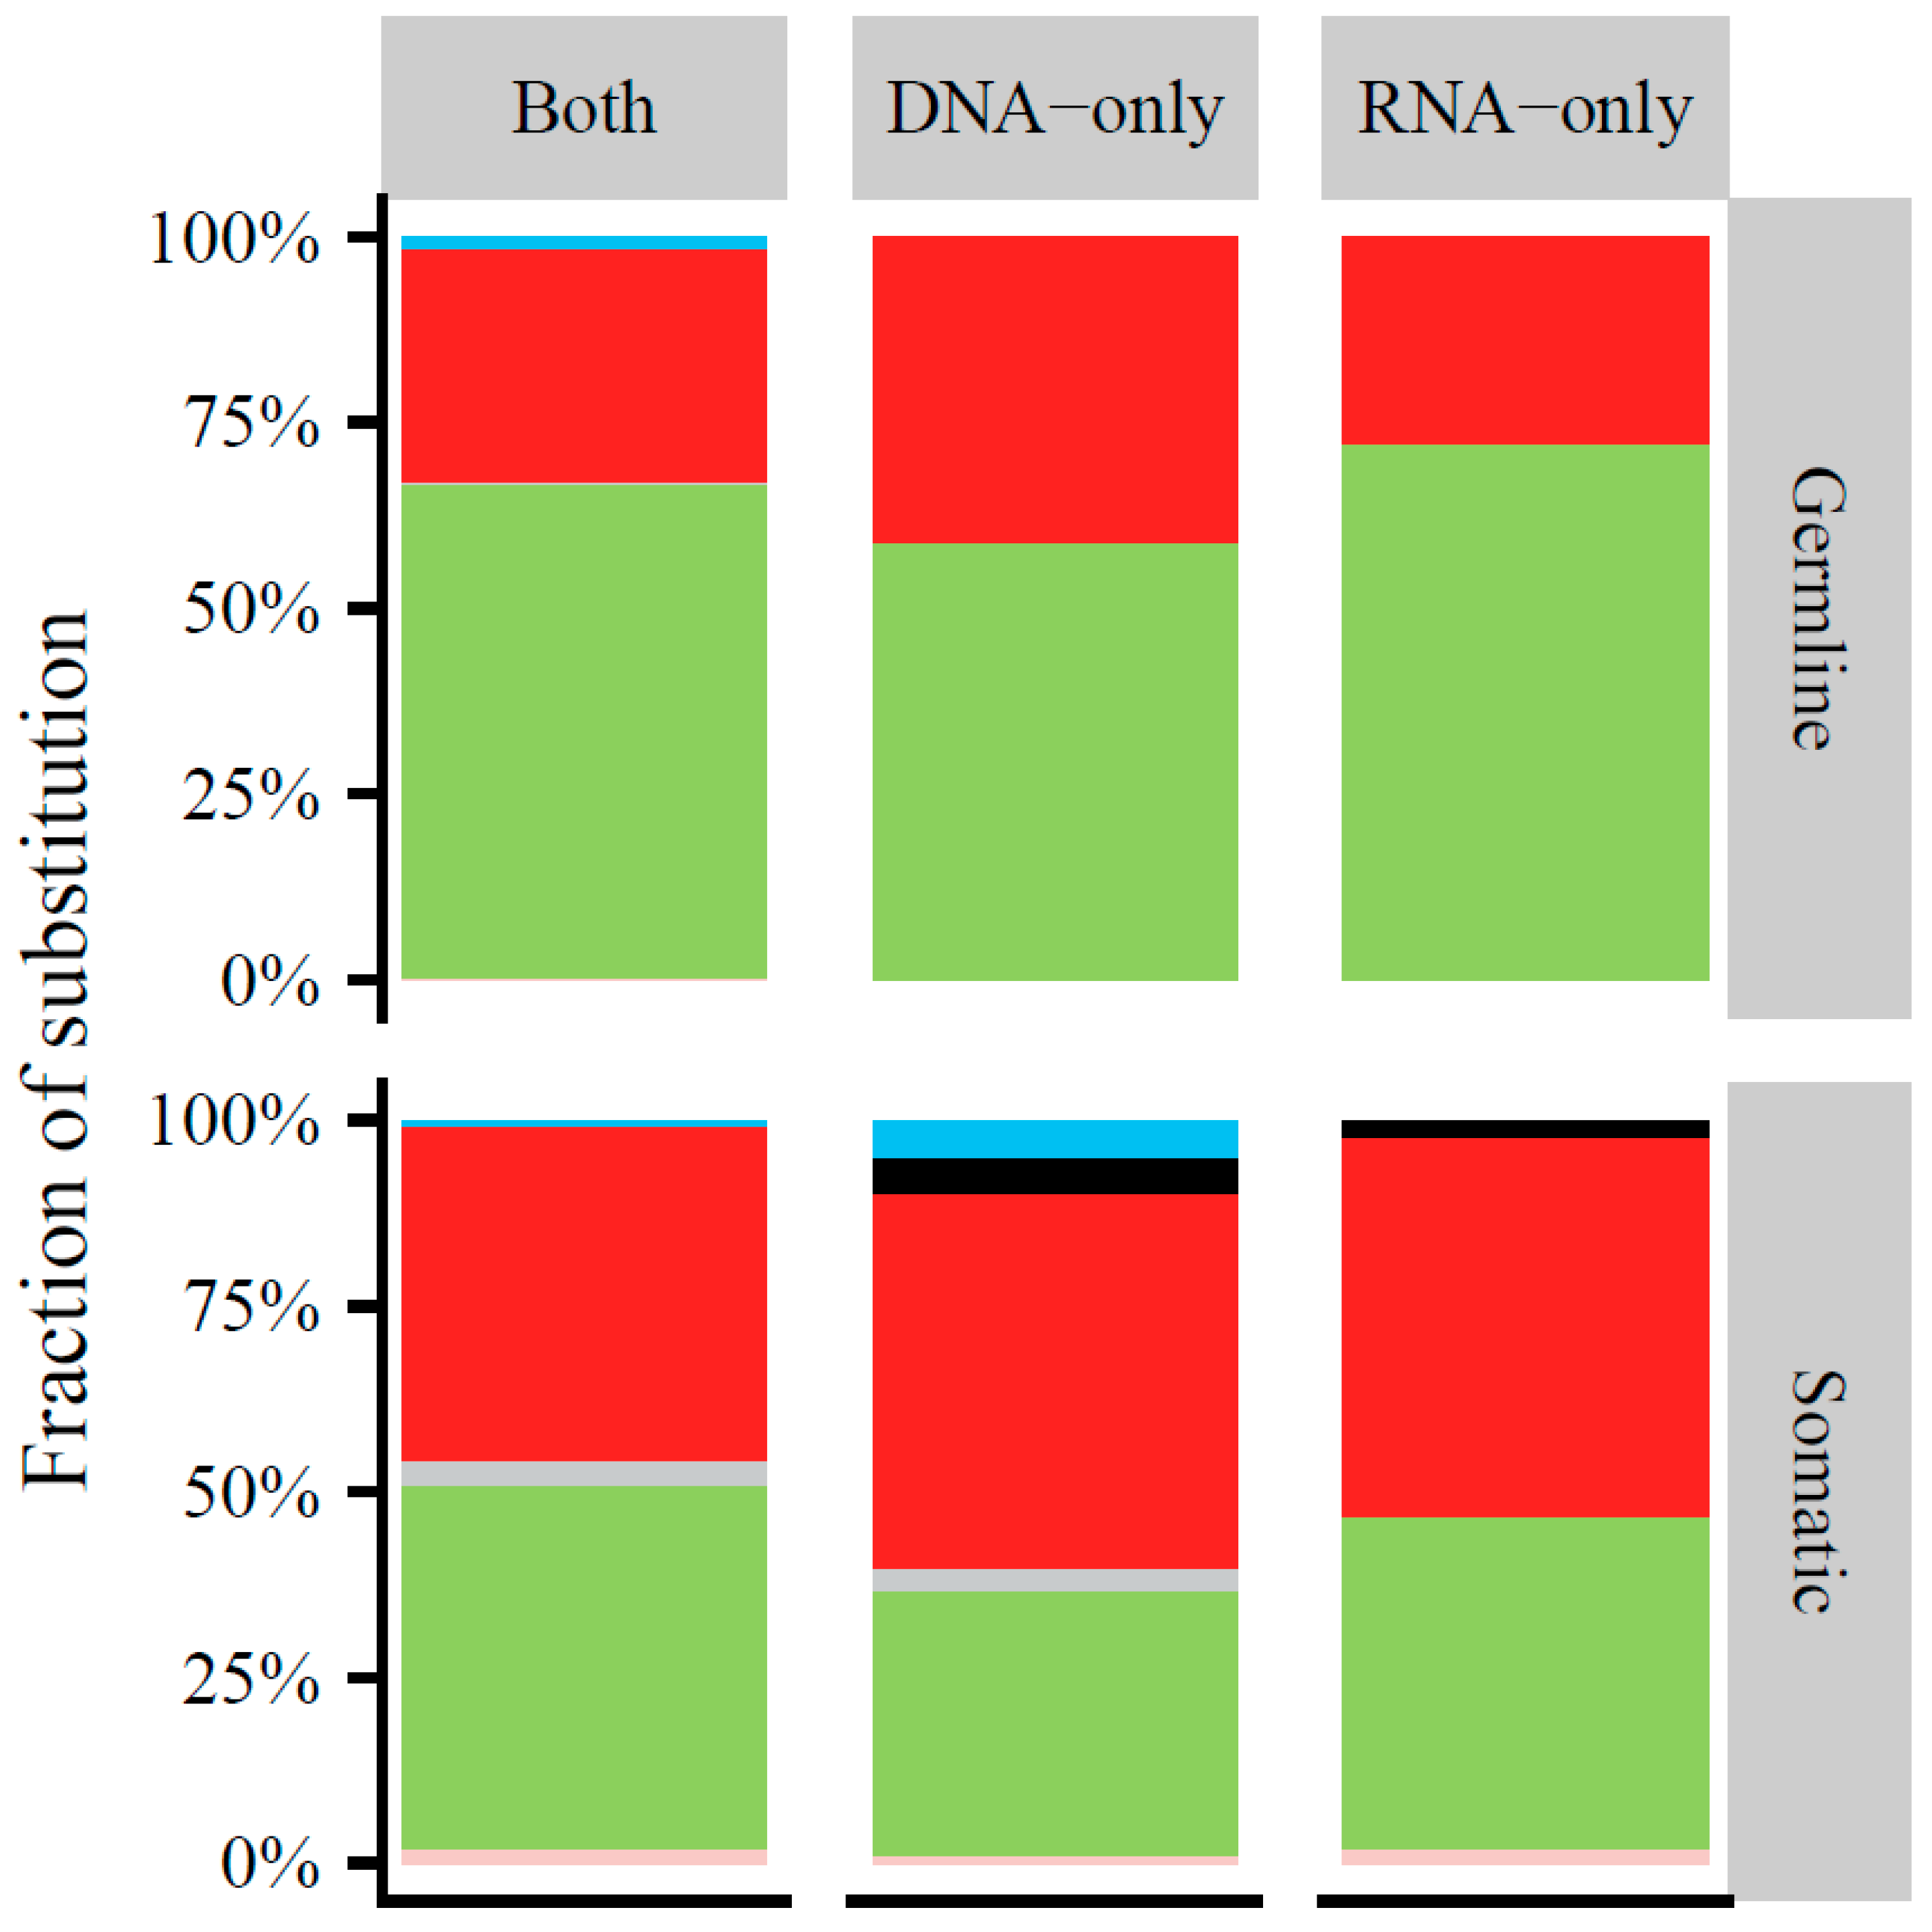
Appendix A.1. Comparison of Mitochondrial Variants at the RNA and DNA Level

By using the dataset published by Ju et al. [15] concerning somatic mitochondrial variants in tumor and matched normal specimens at the DNA level, we intended to compare mitochondrial variants called in primary breast tumor tissue specimens at the RNA and the DNA level. Their dataset includes a total of n = 381 breast tumor specimens, of which n = 165 cases are overlapping with our dataset.
The DNA dataset contains 8892 single nucleotide variants (SNVs) on 1744 positions within the 381 cases (Figure A1), of which 589 variants classified as somatic (using VarScan2, see Ju et al. [15]).
Figure A1. Variants in the mitochondrial DNA of 381 primary breast tumor cases. Position on the mitochondrial genome (circle) and their variant allele frequency (increasing % from inner-to-outer) of all variants identified in the 381 cases. Somatic or germline origin in respectively closed black or open grey circles. Genes and their direction of transcription (arrows) in red (+strand) or blue (−strand).
Cancers 10 00500 g0a1
The variant allele frequency of these somatic variants was distributed with a peak at the lower end of allele frequencies (Figure A2). The detected somatic variants were distributed along the entire mitochondrial genome (Figure A1), with 50 (8.5%) variants located in the tRNA genes, 103 (17.5%) in rRNA genes, 80 (13.6%) in the D-loop, 6 (1.0%) in the non-coding regions, and 350 (59.4%) in the mRNA genes of which 285 (81.4%) had a nonsynonymous effect on the coding amino acid (Figure A3). Relative to their genomic size (9.0% tRNA genes, 15.1% rRNA genes, 6.8% D-loop, 0.4% non-coding, 68.7% mRNA genes) more variants were present in the D-loop and fewer in the mRNA genes (Fisher exact p < 0.001). Also compared to the germline variants, there is a difference in genomic distribution: fewer somatic variants in the D-loop but more in the tRNA and mRNA genes, and an enrichment for somatic nonsynonymous mRNA variants (Fisher exact p < 0.001) (Figure A3). The positions of somatic variants were much more conserved among species compared to the germline variants (Mann-Whitney test p < 0.001), as measured by the fraction of species that harbor the reference sequence at that position (Conservation Index of respectively median (IQR) 0.96 (0.36) and 0.76 (0.69)).
Figure A2. Histogram of variant allele frequency of the somatic mitochondrial DNA variants of 381 primary breast tumor cases. Histogram of the variant allele frequency (horizontal) of the somatic mitochondrial DNA variants detected in the 381 primary breast tumor cases.
Cancers 10 00500 g0a2
Figure A3. Genomic distribution of mitochondrial DNA variants of 381 primary breast tumor cases. Genomic distribution is depicted for somatic (left) or germline (right) variants in either non-coding (purple), the D-loop (orange), tRNA (red), rRNA (blue) or mRNA (green) regions of the mitochondrial genome. The percentage of total is indicated at the top of the bars. The percentage of substitutions in the mRNA regions with either a synonymous or nonsynonymous effect is indicated within the mRNA bar (light green).
Cancers 10 00500 g0a3
A total of 74 (12.6%) somatic variants were recurrent and positioned on 34 mitochondrial positions. Also, majority of the somatic variants (89.5%) represented the typical replication-coupled mtDNA substitution pattern with predominantly C > T and T > C transitions in a nucleotide context similar to the germline variants (Figure A4). Compared to the detected germline variants the ratio between C > T and T > C variants is shifted (Fisher exact p < 0.001) with an increased number of C > T transitions among the somatic variants (Figure A4). In the cohort, there are 101 (26%) cases with 0 somatic variants, 117 (31%) with 1 somatic variant, and 163 (43%) with more than 1 somatic variant (range 2 to 7). Of the cases with more than 1 somatic variant, 103 (63%) had a difference >20% allele frequency between variants, indicative for (sub-)clonality.
When comparing these findings at the DNA level with our findings at the RNA level, no differences were observed in genomic distribution of the somatic variants (Fisher’s exact p = 0.1), the conservation index of somatic variants (Mann-Whitney test p = 0.4), and the recurrence rate (Fisher’s exact p = 0.3). However, the substitutional pattern differed, with a higher fraction of C > A substitutions at the DNA level (4.8%) compared to the RNA level (1.1%) (Fisher’s exact p < 0.001).
Figure A4. Somatic spectrum of mitochondrial DNA variants of 381 primary breast tumor cases. The contribution of the six possible base substitutions (C > A in blue, C > G in black, C > T in red, T > A in grey, T > C in green and T > G in pink) (left) and the context of each substitution (bases immediately 5′ and 3′ to each variant in the reference genome) (right) are depicted for the germline (top) and somatic (bottom) variants (left).
Cancers 10 00500 g0a4

Appendix A.2. Direct Comparison of Mitochondrial Variants at the RNA and DNA Level of Overlapping Cases

We next focused on the variants called within the overlapping cases within our RNA and the published DNA dataset (n = 165 cases). As stated in the main manuscript text, of the variants detected at both the RNA and DNA level only a few (n = 10, 0.3%) had a discrepancy in classification as either ‘somatic’ or ‘germline’ (resp. n = 4 and n = 6, Table A1). These were misclassifications at the RNA level, mainly due to the absence of information on the matched normal tissue: variants misclassified as ‘germline’ at the RNA level had allele frequencies > 95%, indicative for germline origin, but were not detected in the matched normal DNA whereas they were present in the matched tumor DNA and thus of somatic origin. Also, variants misclassified as ‘somatic’ at the RNA level had allele frequencies between 85% and 95% allele frequency, but were detected in the matched normal DNA as well as the matched tumor DNA and thus of germline origin. Also, of the variants detected at both the RNA and DNA level, only a few variants (n = 7, 0.2%) showed a strong deviation in variant frequency (>30% difference) (n = 3 germline and n = 4 somatic) (Table A2). In contrast to previous observations that mainly variants in tRNAs have allelic imbalances [9], none of them occurred at tRNA sites.
We continued evaluating the variants called within the overlapping cases present at either only the DNA or only the RNA level. A total of 120 variants (3.0%) were only called at the DNA level (103 somatic and 17 germline) (Table A2) and 108 variants (2.7%) were present at only the RNA level (47 somatic and 61 germline) (Table A3). Within the aligned reads of the RNA data (BAM file) we inspected if variants called at the DNA-only level were truly not present at the RNA level or just not called (Table A2). Majority of the called DNA variants were present in the RNA alignment data but not called by our used algorithm (n = 108, 90%), a few variants were not (sufficiently) covered (n = 5, 4%), and some were sufficiently covered but truly not present as alternative allele (n = 7, 6%). Unfortunately, we were unable to visually inspect variants in the DNA alignment data (not available) and thus the relevance of variants present at only the RNA level was not evaluable. Interestingly, when evaluating the substitution pattern of variants detected at both the RNA and DNA level (Figure A5), and at either the RNA or DNA level, the higher fraction of C > A substitutions at the DNA level compared to the RNA level appeared mainly due to variants called at only the DNA level.
Given these results, the differences we observe in called variants at the RNA and DNA level is likely an effect of differences in either the expression at the RNA level (biological) the calling algorithms used (technical).
Figure A5. Somatic spectrum of mitochondrial DNA and mitochondrial RNA variants of the 165 overlapping primary breast tumor cases. The contribution of the six possible base substitutions (C > A in blue, C > G in black, C > T in red, T > A in grey, T > C in green and T > G in pink) are depicted for the germline (top) and somatic (bottom) variants detected in both (left) the DNA (middle) or the RNA (right) datasets.
Cancers 10 00500 g0a5
Table A1. Positions misclassified at RNA versus DNA.
SampleVariantDepth RNA
Tumor
VAF RNA
Tumor
Class RNAVariantDepth DNA
Tumor
VAF DNA
Tumor
Depth DNA
Normal
VAF DNA
Normal
Class DNA
P_6042ar.199u>c195399.3%Germlineg.199T>C658567.1%2080.5%Somatic
P_9571ar.1010a>c165597.1%Germlineg.1010A>C21,84094.9%7630.0%Somatic
P_6409ar.4344u>c14697.9%Germlineg.4344T>C16,06868.9%17070.1%Somatic
P_6043ar.5353g>a109997.6%Germlineg.5353G>A20,51488.0%5440.0%Somatic
P_5956ar.11453g>a165596.6%Germlineg.11453G>A21,21496.3%42300.0%Somatic
P_9568ar.14841a>g187797.4%Germlineg.14841A>G12,06086.5%8060.1%Somatic
P_4982ar.94g>a69891.1%Somaticg.94G>A964399.8%144999.5%Germline
P_4982ar.152u>c61493.0%Somaticg.152T>C11,73899.8%209099.0%Germline
P_8622ar.497c>u3984.6%Somaticg.497C>T11,02099.8%197599.5%Germline
P_4963ar.16302a>g70894.7%Somaticg.16302A>G704297.3%786086.6%Germline
Table A2. Variants called at only the mtDNA level.
SampleVariantGeneDepth DNA
Tumor
VAF DNA
Tumor
Depth DNA
Normal
VAF DNA
Normal
Depth RNA
Tumor
VAF RNA
Tumor
Concordant?
P_6719ag.2A>TControl-Region814.94590150.00na
P_6409ag.66G>TControl-Region17123.2746506440.16na
P_9569ag.73A>GControl-Region611811.431460101011.58Yes
P_6719ag.185G>AControl-Region319399.72342199.1810100.00Yes
P_9592ag.195T>CControl-Region70124.0426720.0410763.35Yes
P_4977ag.263A>GControl-Region10,036100214299.919100.00Yes
P_9597ag.293T>CControl-Region256812.27810015037.25Yes
P_4847ag.307C>AControl-Region127522.9821240.092280.00No
P_4958ag.316G>AControl-Region351310.656982.723763.99Yes
P_5947ag.319T>CControl-Region29424.1111850.25101526.21Yes
P_5947ag.321T>CControl-Region31844.7412270.08101726.16Yes
P_4847ag.346T>CControl-Region155731.3423000.0430437.17Yes
P_4847ag.347G>AControl-Region149231.3720300.0530535.08Yes
P_11340ag.456C>TControl-Region835199.846299.787100.00Yes
P_9571ag.462C>TControl-Region17,65399.9358499.830-Yes
P_6719ag.462C>TControl-Region530099.87571899.884100.00Yes
P_4069ag.462C>TControl-Region910899.8917601002195.24Yes
P_9571ag.489T>CControl-Region18,13399.986191002100.00Yes
P_6719ag.489T>CControl-Region579899.91597799.974100.00Yes
P_4069ag.489T>CControl-Region940899.97176610018100.00Yes
P_6422ag.549C>TControl-Region15,22499.76945499.271593.33Yes
P_5928ag.730A>TMT-RNR112,33412.93395050564.94Yes
P_11389ag.903T>CMT-RNR111,5684.761006050530.26Yes
P_6413ag.1284T>CMT-RNR1841625.525890.0450301.83Yes
P_11399ag.1320G>AMT-RNR161734.471995050390.02No*
P_4845ag.1464G>AMT-RNR1649612.9679020.1950186.50Yes
P_6719ag.1748G>AMT-RNR210,39625.3190000.06467410.68Yes
P_9754ag.1758T>CMT-RNR210,0213.4225410.0450351.81Yes
P_8618ag.1906G>CMT-RNR280943.4359530.0350380.02No*
P_11384ag.1913G>AMT-RNR284944.0720900.0550310.58Yes
P_9592ag.1939G>AMT-RNR216,3243.5964320.0650222.59Yes
P_6413ag.1987G>AMT-RNR2881711.4724980.0449721.57Yes
P_11380ag.2024C>TMT-RNR212,99614.06647050242.31Yes
P_11377ag.2343G>AMT-RNR278523.481118050490.04No*
P_9572ag.2492G>AMT-RNR213,6393.436710.1550495.27Yes
P_7221ag.2571G>AMT-RNR284103.2224880.0850073.40Yes
P_11374ag.2695G>AMT-RNR247713.981416050450.71Yes
P_4976ag.2716G>AMT-RNR221,4897.318,2430.0649964.06Yes
P_5950ag.3065T>CMT-RNR273715.241548048703.72Yes
P_8980ag.3068G>AMT-RNR215,12512.6533740.1249974.16Yes
P_9573ag.3097T>CMT-RNR210,2499.235920.1750365.90Yes
P_7215ag.3617T>CMT-ND112,6143.242196014004.07Yes
P_11375ag.3715G>CMT-ND190983.73390.5948891.82Yes
P_4080ag.4153G>AMT-ND114,4507.722590.04533.77Yes
P_6411ag.4308G>AMT-TI13,7803.72109707386.91Yes
P_7218ag.4336T>CMT-TQ11,43299.92181100366.67Yes
P_8979ag.4399T>CMT-TQ733820.37157202920.69Yes
P_4833ag.4412G>AMT-TM10,5325.8640780.02103987.20Yes
P_4072ag.4429G>AMT-TM16,36055.9422450.0454885.22Yes
P_9777ag.4582T>CMT-ND2333617.9924390190.00na
P_11819ag.4924G>AMT-ND273579.1140360.0537606.97Yes
P_4080ag.5581A>GNon-Coding17,80699.66266999.960-Yes
P_6728ag.5582A>GNon-Coding13,65999.3411,65799.919100.00Yes
P_4982ag.5703G>AMT-TN13,40191.422760.04196389.61Yes
P_4971ag.5920G>AMT-CO162023.5815170.0743767.24Yes
P_11340ag.6255G>AMT-CO111,9066.16824016389.77Yes
P_6422ag.6673T>CMT-CO120,0904.3912,2780.0210805.28Yes
P_9574ag.6724T>CMT-CO110,5496.03871050186.10Yes
P_9574ag.7191T>CMT-CO111,2046.129320.1150245.77Yes
P_11377ag.7207G>AMT-CO184215.851093050362.76Yes
P_7214ag.7219G>AMT-CO111,1683.362565049833.45Yes
P_4080ag.7595G>AMT-CO217,88020.3727890.0730.00na
P_7219ag.7652T>CMT-CO290007.726540.0447877.65Yes
P_11336ag.7935T>CMT-CO295865.425940.3449857.36Yes
P_9592ag.8213G>AMT-CO215,8893.6360090.0249643.28Yes
P_4967ag.8249G>AMT-CO213,9413.2177400.0350310.85Yes
P_9572ag.8269G>CMT-CO265393.174041.2448580.00No
P_11372ag.8270C>TNon-Coding144798.4818496.2475599.75Yes
P_9002ag.8278C>GNon-Coding269415.55756.6730920.00No
P_9572ag.8290G>CNon-Coding60595.733702.43961.04na
P_9572ag.8291A>CNon-Coding62174.683822.36935.38Yes
P_3989ag.8448T>CMT-ATP811,9808.6853000.0250421.23Yes
P_7214ag.8547T>CMT-ATP8/679243.1418350.0539490.20Yes
P_4977ag.8860A>GMT-ATP613,07599.99362699.974697.83Yes
P_9754ag.9053G>AMT-ATP610,8194.922532050113.47Yes
P_9001ag.9078T>CMT-ATP614,7295.894970.220453.03Yes
P_4958ag.9181A>GMT-ATP6901039.3522210487049.96Yes
P_5936ag.9285A>TMT-CO3673211.5134080.0349166.96Yes
P_6413ag.9286T>CMT-CO3677111.7919890.249045.69Yes
P_11337ag.9429G>AMT-CO316,2363.47404049753.50Yes
P_5960ag.9497T>CMT-CO310,9473.272603049612.80Yes
P_11336ag.9594C>TMT-CO310,6595.656230.1648455.49Yes
P_9567ag.9645G>AMT-CO311,6476.367000.1450213.94Yes
P_9847ag.10177G>AMT-ND322,7903.0518,6850.0234037.35Yes
P_7426ag.10463T>CMT-TR981799.98130099.927100.00Yes
P_9757ag.10747T>CMT-ND4L69987.8222290.04496310.50Yes
P_11336ag.10838A>GMT-ND410,9509.52617050065.81Yes
P_5936ag.11195G>AMT-ND471268.7336150.0349237.39Yes
P_9582ag.11477G>AMT-ND411,7263.7712,8860.0249635.00Yes
P_7206ag.11825G>AMT-ND412,2933.5410940.0949995.82Yes
P_4266ag.11984T>CMT-ND414,00613.1787780.0349519.41Yes
P_9755ag.12154C>TMT-TH81163.716030.062638.75Yes
P_7221ag.12618G>AMT-ND590566.125550.0428538.24Yes
P_8981ag.12769G>AMT-ND510,6217.0631080.0349768.16Yes
P_5930ag.12771G>AMT-ND510,26511.833150049729.61Yes
P_6413ag.12977T>CMT-ND5734034.121230.0949422.47Yes
P_4847ag.13099G>AMT-ND513,8055.1649720.0249311.60Yes
P_7409ag.13156C>TMT-ND587904.5525990.0448917.56Yes
P_5946ag.13178G>AMT-ND557408.8928460.07348311.08Yes
P_8979ag.13198G>AMT-ND511,7898.592741028777.92Yes
P_11336ag.13272C>AMT-ND596605.48579046032.00Yes
P_8979ag.13496C>AMT-ND510,9855.523320.0439165.80Yes
P_11374ag.13531G>AMT-ND547315.141252050073.87Yes
P_11391ag.13567A>GMT-ND5132223.83856050090.86Yes
P_11372ag.14112C>AMT-ND5855310.112510.08495910.71Yes
P_8611ag.14197T>CMT-ND610,5775.0147130.0450055.97Yes
P_7215ag.14447T>CMT-ND613,7763.472242023212.76Yes
P_11374ag.14760G>AMT-CYB596119.2814210.079210.00No
P_4959ag.14788T>CMT-CYB13,25010.1782080.1246086.45Yes
P_9570ag.14888G>AMT-CYB15,4663.84517036495.10Yes
P_5954ag.14939T>CMT-CYB80333.3926330.0429596.69Yes
P_4982ag.15012T>CMT-CYB22,6668.3943480.0550167.93Yes
P_5950ag.15093G>AMT-CYB80825.261601050377.72Yes
P_9582ag.15170G>AMT-CYB11,7593.4613,0820.0238999.69Yes
P_11342ag.15242G>AMT-CYB11,7453.32373043396.04Yes
P_9582ag.15854T>CMT-CYB10,5456.8912,7110.0638957.01Yes
P_4977ag.15970T>CMT-TP19,78399.9652321003100.00Yes
P_4847ag.16033G>AControl-Region14,3327.5955560.0227320.48Yes
P_7433ag.16147C>TControl-Region15,1741138740.0328731.98Yes
P_9539ag.16293A>GControl-Region26839.584700.2133159.20Yes
Table A3. Variants at only the mtRNA level.
SampleVariantGeneClassDepth RNA TumorVAF RNA TumorComment
P_4982ar.72u>cControl-RegionSomatic31820.44True variant (mutually exclusive 73G, 94T)
P_6406ar.72u>cControl-RegionGermline190699.79True variant
P_9589ar.73a>gControl-RegionGermline59299.83True variant
P_5959ar.73a>gControl-RegionGermline954100.00True variant
P_11394ar.73a>gControl-RegionGermline923100.00True variant
P_11389ar.146u>cControl-RegionGermline69499.71True variant
P_8978ar.146u>cControl-RegionGermline37199.73True variant (phased with 185A and 204C)
P_8611ar.146u>cControl-RegionGermline159999.75True variant (phased with 195C)
P_8981ar.146u>cControl-RegionGermline308100.00True variant
P_8609ar.152u>cControl-RegionSomatic144869.96True variant (phased with 195C)
P_10014ar.152u>cControl-RegionGermline227295.38True variant
P_4606ar.152u>cControl-RegionGermline9898.98True variant
P_4266ar.152u>cControl-RegionGermline95699.37True variant
P_8618ar.152u>cControl-RegionGermline43799.77True variant
P_8979ar.152u>cControl-RegionGermline371100.00True variant
P_4261ar.182c>uControl-RegionSomatic122077.54True variant
P_11383ar.185g>aControl-RegionGermline30199.67True variant (phased with 150T and 228A)
P_5928ar.185g>aControl-RegionGermline723100.00True variant (phased with 188G and 228A)
P_9592ar.188a>gControl-RegionGermline81499.63True variant (phased with 185A and 228A)
P_5928ar.188a>gControl-RegionGermline716100.00True variant (phased with 185A and 228A)
P_5956ar.188a>gControl-RegionGermline1450100.00True variant (phased with 185A and 228A)
P_9571ar.188a>gControl-RegionGermline37100.00True variant (phased with 185A, 222T and 228A)
P_4069ar.189a>gControl-RegionGermline997100.00True variant
P_11372ar.195u>cControl-RegionGermline71599.72True variant (phased with 152C and 263G)
P_8978ar.228g>aControl-RegionSomatic57382.72True variant (phased with 185A, 204C, 263G)
P_11383ar.228g>aControl-RegionGermline58599.83True variant (phased with 185A, 263G, 295T)
P_9597ar.263a>gControl-RegionGermline234199.83True variant (phased with 228A and 295T)
P_10010ar.263a>gControl-RegionGermline133199.85True variant
P_7238ar.263a>gControl-RegionGermline138899.86True variant (phased with 295T)
P_8611ar.263a>gControl-RegionGermline194899.95True variant (phased with 195C)
P_8830ar.263a>gControl-RegionGermline892100.00True variant (phased with 207A and 234G)
P_7238ar.295c>uControl-RegionGermline76699.48True variant (phased with 263G)
P_5956ar.295c>uControl-RegionGermline112199.91True variant (phased with 263G)
P_6732ar.295c>uControl-RegionGermline545100.00True variant
P_9597ar.295c>uControl-RegionGermline1272100.00True variant (phased with 228A and 263G)
P_7316ar.456c>uControl-RegionGermline8895.45True variant
P_9758ar.1604g>aMT-TVSomatic15923.27True variant
P_11399ar.1669g>aMT-TVSomatic53441.20True variant
P_6730ar.1973g>aMT-RNR2Somatic117157.05True variant
P_4977ar.2166c>uMT-RNR2Somatic143318.42Potential artefact; at start of read ACCxATA context
P_10010ar.2300g>aMT-RNR2Somatic206613.84True variant (in DNA! 2300G>A, 9106|5497|37.64%)
P_7431ar.2416u>cMT-RNR2Somatic85584.80True variant
P_6406ar.3109u>cMT-RNR2Somatic140738.38True variant
P_4963ar.3283g>aMT-TL1Somatic90829.52True variant
P_4606ar.3535u>cMT-ND1Somatic220392.74True variant
P_4080ar.3705g>aMT-ND1Somatic5194.12True variant
P_5942ar.3796a>gMT-ND1Germline203298.43True variant
P_9754ar.3913g>aMT-ND1Somatic168512.11True variant
P_7219ar.4282g>aMT-TISomatic7635.53True variant
P_6733ar.4360g>aMT-TQSomatic5440.74True variant
P_6728ar.4408g>aMT-TMSomatic19917.09True variant
P_6043ar.4986a>gMT-ND2Somatic207339.22True variant
P_4847ar.5479u>cMT-ND2Somatic89013.03Potential artefact; at end of read TCCxACC context
P_9567ar.6569c>uMT-CO1Somatic177388.72True variant
P_4970ar.7045u>cMT-CO1Somatic76112.22True variant
P_9847ar.7146a>gMT-CO1Germline75798.15True variant
P_9757ar.7579u>cMT-TDSomatic10916.51True variant
P_11383ar.7698u>cMT-CO2Somatic227712.60True variant
P_9541ar.7765a>gMT-CO2Somatic79717.69True variant
P_4976ar.7895u>cMT-CO2Somatic236828.08True variant
P_11819ar.8149a>gMT-CO2Somatic66092.58True variant
P_7216ar.8286u>cNon-CodingSomatic36449.73True variant
P_8978ar.8408c>uMT-ATP8Germline223999.60True variant
P_4604ar.9989u>cMT-CO3Germline30298.68True variant
P_4833ar.10306a>cMT-ND3Somatic100435.26True variant
P_4976ar.11718g>aMT-ND4Somatic130492.33True variant
P_6722ar.11899u>cMT-ND4Germline69195.37True variant (phased with 11914A)
P_8978ar.12763g>aMT-ND5Somatic160289.20True variant
P_9754ar.12876c>uMT-ND5Germline147897.29True variant
P_6411ar.13528a>gMT-ND5Somatic170191.59True variant
P_4983ar.13552g>aMT-ND5Somatic156991.65True variant
P_9002ar.14389c>uMT-ND6Somatic171893.95True variant
P_5930ar.14721g>cMT-TESomatic30227.81True variant (phased with 14766T)
P_8978ar.15495u>cMT-CYBSomatic181294.09True variant
P_11337ar.15607a>gMT-CYBGermline95999.06True variant
P_4982ar.15904c>uMT-TTSomatic34434.01True variant (overlapping 15927A)
P_4982ar.15927g>aMT-TTSomatic34436.92True variant (overlapping with 15904)
P_4847ar.16092u>cControl-RegionGermline183899.78True variant
P_11389ar.16093u>cControl-RegionSomatic74512.62True variant
P_9582ar.16093u>cControl-RegionSomatic75312.88True variant (phased with 16126C)
P_4072ar.16093u>cControl-RegionGermline104127.76True variant
P_9567ar.16093u>cControl-RegionSomatic245992.19True variant
P_4955ar.16093u>cControl-RegionGermline129898.69True variant
P_4970ar.16104c>uControl-RegionGermline80081.88True variant
P_8979ar.16184c>uControl-RegionGermline317100.00True variant
P_4606ar.16186c>uControl-RegionGermline18196.69True variant
P_8830ar.16209u>cControl-RegionGermline863100.00True variant (phased with 16171A, 16183C, 16188C, 16233T, 16258T)
P_8830ar.16223c>uControl-RegionGermline1197100.00True variant (phased with 16171A, 16183C, 16188C, 1609C, 16258T)
P_9002ar.16235a>gControl-RegionGermline140982.82True variant (phased with 16183C, 16184A, 16189C, 16217C)
P_11338ar.16235a>gControl-RegionSomatic218893.01True variant (phased with 16293G and 16304C)
P_6730ar.16267c>uControl-RegionSomatic216734.98True variant
P_6732ar.16278c>uControl-RegionSomatic266147.35True variant
P_9575ar.16290c>uControl-RegionSomatic153025.16True variant (phased with 16265C, 16291T, 16335G)
P_11341ar.16293a>gControl-RegionGermline1205100.00True variant (phased with 16331C, 16354T)
P_9582ar.16294c>uControl-RegionGermline87099.89True variant (phased with 16304C)
P_9847ar.16294c>uControl-RegionGermline731100.00True variant (phased with 16278T, 16293G, 16311C, 16360T)
P_9582ar.16304u>cControl-RegionGermline66399.85True variant (phased with 16294T)
P_9596ar.16311u>cControl-RegionGermline80298.63True variant
P_5956ar.16311u>cControl-RegionGermline757100.00True variant
P_9761ar.16336g>aControl-RegionGermline1571100.00True variant
P_9541ar.16342u>cControl-RegionGermline80699.75True variant
P_11381ar.16356u>cControl-RegionGermline146699.86True variant
P_9568ar.16362u>cControl-RegionGermline123299.84True variant (phased with 16304C)
P_5946ar.16362u>cControl-RegionGermline327100.00True variant
P_9599ar.16362u>cControl-RegionGermline376100.00True variant (phased with 16325C)
P_11819ar.16362u>cControl-RegionGermline373100.00True variant
P_10010ar.16519u>cControl-RegionSomatic73256.15True variant
P_6730ar.16540c>uControl-RegionSomatic114261.56True variant (phased with 16519C)

References

  1. Ojala, D.; Montoya, J.; Attardi, G. tRNA punctuation model of RNA processing in human mitochondria. Nature 1981, 290, 470–474. [Google Scholar] [CrossRef] [PubMed]
  2. Reznik, E.; Miller, M.L.; Senbabaoglu, Y.; Riaz, N.; Sarungbam, J.; Tickoo, S.K.; Al-Ahmadie, H.A.; Lee, W.; Seshan, V.E.; Hakimi, A.A.; et al. Mitochondrial DNA copy number variation across human cancers. Elife 2016, 5. [Google Scholar] [CrossRef]
  3. Mambo, E.; Chatterjee, A.; Xing, M.; Tallini, G.; Haugen, B.R.; Yeung, S.C.; Sukumar, S.; Sidransky, D. Tumor-specific changes in mtDNA content in human cancer. Int. J. Cancer 2005, 116, 920–924. [Google Scholar] [CrossRef] [PubMed] [Green Version]
  4. Yu, M.; Zhou, Y.; Shi, Y.; Ning, L.; Yang, Y.; Wei, X.; Zhang, N.; Hao, X.; Niu, R. Reduced mitochondrial DNA copy number is correlated with tumor progression and prognosis in Chinese breast cancer patients. IUBMB Life 2007, 59, 450–457. [Google Scholar] [CrossRef] [PubMed] [Green Version]
  5. Tseng, L.M.; Yin, P.H.; Chi, C.W.; Hsu, C.Y.; Wu, C.W.; Lee, L.M.; Wei, Y.H.; Lee, H.C. Mitochondrial DNA mutations and mitochondrial DNA depletion in breast cancer. Genes Chromosomes Cancer 2006, 45, 629–638. [Google Scholar] [CrossRef]
  6. Fan, A.X.; Radpour, R.; Haghighi, M.M.; Kohler, C.; Xia, P.; Hahn, S.; Holzgreve, W.; Zhong, X.Y. Mitochondrial DNA content in paired normal and cancerous breast tissue samples from patients with breast cancer. J. Cancer Res. Clin. Oncol. 2009, 135, 983–989. [Google Scholar] [CrossRef]
  7. Barekati, Z.; Radpour, R.; Kohler, C.; Zhang, B.; Toniolo, P.; Lenner, P.; Lv, Q.; Zheng, H.; Zhong, X.Y. Methylation profile of TP53 regulatory pathway and mtDNA alterations in breast cancer patients lacking TP53 mutations. Hum. Mol. Genet. 2010, 19, 2936–2946. [Google Scholar] [CrossRef] [Green Version]
  8. McMahon, S.; LaFramboise, T. Mutational patterns in the breast cancer mitochondrial genome, with clinical correlates. Carcinogenesis 2014, 35, 1046–1054. [Google Scholar] [CrossRef] [PubMed]
  9. Bai, R.K.; Chang, J.; Yeh, K.T.; Lou, M.A.; Lu, J.F.; Tan, D.J.; Liu, H.; Wong, L.J. Mitochondrial DNA content varies with pathological characteristics of breast cancer. J. Oncol. 2011, 2011, 496189. [Google Scholar] [CrossRef] [PubMed]
  10. Hsu, C.W.; Yin, P.H.; Lee, H.C.; Chi, C.W.; Tseng, L.M. Mitochondrial DNA content as a potential marker to predict response to anthracycline in breast cancer patients. Breast J. 2010, 16, 264–270. [Google Scholar] [CrossRef]
  11. Reznik, E.; Wang, Q.G.; La, K.; Schultz, N.; Sander, C. Mitochondrial respiratory gene expression is suppressed in many cancers. Elife 2017, 6. [Google Scholar] [CrossRef] [PubMed]
  12. Warburg, O. On the origin of cancer cells. Science 1956, 123, 309–314. [Google Scholar] [CrossRef] [PubMed]
  13. Weerts, M.J.; Sieuwerts, A.M.; Smid, M.; Look, M.P.; Foekens, J.A.; Sleijfer, S.; Martens, J.W. Mitochondrial DNA content in breast cancer: Impact on in vitro and in vivo phenotype and patient prognosis. Oncotarget 2016, 7, 29166–29176. [Google Scholar] [CrossRef] [PubMed] [Green Version]
  14. Weerts, M.J.A.; Hollestelle, A.; Sieuwerts, A.M.; Foekens, J.A.; Sleijfer, S.; Martens, J.W.M. Low tumor mitochondrial DNA content is associated with better outcome in breast cancer patients receiving anthracycline-based chemotherapy. Clin. Cancer Res. 2017, 23, 4735–4743. [Google Scholar] [CrossRef] [PubMed]
  15. Ju, Y.S.; Alexandrov, L.B.; Gerstung, M.; Martincorena, I.; Nik-Zainal, S.; Ramakrishna, M.; Davies, H.R.; Papaemmanuil, E.; Gundem, G.; Shlien, A.; et al. Origins and functional consequences of somatic mitochondrial DNA mutations in human cancer. Elife 2014, 3. [Google Scholar] [CrossRef] [PubMed] [Green Version]
  16. Stewart, J.B.; Alaei-Mahabadi, B.; Sabarinathan, R.; Samuelsson, T.; Gorodkin, J.; Gustafsson, C.M.; Larsson, E. Simultaneous DNA and RNA mapping of somatic mitochondrial mutations across diverse human cancers. PLoS Genet. 2015, 11, e1005333. [Google Scholar] [CrossRef] [PubMed]
  17. Nik-Zainal, S.; Davies, H.; Staaf, J.; Ramakrishna, M.; Glodzik, D.; Zou, X.; Martincorena, I.; Alexandrov, L.B.; Martin, S.; Wedge, D.C.; et al. Landscape of somatic mutations in 560 breast cancer whole-genome sequences. Nature 2016, 534, 47–54. [Google Scholar] [CrossRef] [Green Version]
  18. Bar-Yaacov, D.; Avital, G.; Levin, L.; Richards, A.L.; Hachen, N.; Rebolledo Jaramillo, B.; Nekrutenko, A.; Zarivach, R.; Mishmar, D. RNA-DNA differences in human mitochondria restore ancestral form of 16S ribosomal RNA. Genome Res. 2013, 23, 1789–1796. [Google Scholar] [CrossRef]
  19. Hodgkinson, A.; Idaghdour, Y.; Gbeha, E.; Grenier, J.C.; Hip-Ki, E.; Bruat, V.; Goulet, J.P.; de Malliard, T.; Awadalla, P. High-resolution genomic analysis of human mitochondrial RNA sequence variation. Science 2014, 344, 413–415. [Google Scholar] [CrossRef]
  20. Nielsen, M.M.; Tehler, D.; Vang, S.; Sudzina, F.; Hedegaard, J.; Nordentoft, I.; Orntoft, T.F.; Lund, A.H.; Pedersen, J.S. Identification of expressed and conserved human noncoding RNAs. RNA 2014, 20, 236–251. [Google Scholar] [CrossRef]
  21. Grandhi, S.; Bosworth, C.; Maddox, W.; Sensiba, C.; Akhavanfard, S.; Ni, Y.; LaFramboise, T. Heteroplasmic shifts in tumor mitochondrial genomes reveal tissue-specific signals of relaxed and positive selection. Hum. Mol. Genet. 2017, 3798753. [Google Scholar] [CrossRef] [PubMed]
  22. Mercer, T.R.; Neph, S.; Dinger, M.E.; Crawford, J.; Smith, M.A.; Shearwood, A.M.; Haugen, E.; Bracken, C.P.; Rackham, O.; Stamatoyannopoulos, J.A.; et al. The human mitochondrial transcriptome. Cell 2011, 146, 645–658. [Google Scholar] [CrossRef] [PubMed]
  23. Mele, M.; Ferreira, P.G.; Reverter, F.; DeLuca, D.S.; Monlong, J.; Sammeth, M.; Young, T.R.; Goldmann, J.M.; Pervouchine, D.D.; Sullivan, T.J.; et al. Human genomics. The human transcriptome across tissues and individuals. Science 2015, 348, 660–665. [Google Scholar] [CrossRef] [PubMed]
  24. Jia, D.; Park, J.H.; Jung, K.H.; Levine, H.; Kaipparettu, B.A. Elucidating the Metabolic Plasticity of Cancer: Mitochondrial Reprogramming and Hybrid Metabolic States. Cells 2018, 7. [Google Scholar] [CrossRef] [PubMed]
  25. Chen, J.Q.; Delannoy, M.; Cooke, C.; Yager, J.D. Mitochondrial localization of ERalpha and ERbeta in human MCF7 cells. Am. J. Physiol. Endocrinol. Metab. 2004, 286, E1011–E1022. [Google Scholar] [CrossRef] [PubMed]
  26. Mattingly, K.A.; Ivanova, M.M.; Riggs, K.A.; Wickramasinghe, N.S.; Barch, M.J.; Klinge, C.M. Estradiol stimulates transcription of nuclear respiratory factor-1 and increases mitochondrial biogenesis. Mol. Endocrinol. 2008, 22, 609–622. [Google Scholar] [CrossRef] [PubMed]
  27. Pelicano, H.; Zhang, W.; Liu, J.; Hammoudi, N.; Dai, J.; Xu, R.H.; Pusztai, L.; Huang, P. Mitochondrial dysfunction in some triple-negative breast cancer cell lines: Role of mTOR pathway and therapeutic potential. Breast Cancer Res. 2014, 16, 434. [Google Scholar] [CrossRef] [PubMed]
  28. Wang, C.L.; MacDonald, L.R.; Rogers, J.V.; Aravkin, A.; Haseley, D.R.; Beatty, J.D. Positron emission mammography: Correlation of estrogen receptor, progesterone receptor, and human epidermal growth factor receptor 2 status and 18F-FDG. AJR Am. J. Roentgenol. 2011, 197, W247–W255. [Google Scholar] [CrossRef]
  29. Yoon, H.J.; Kang, K.W.; Chun, I.K.; Cho, N.; Im, S.A.; Jeong, S.; Lee, S.; Jung, K.C.; Lee, Y.S.; Jeong, J.M.; et al. Correlation of breast cancer subtypes, based on estrogen receptor, progesterone receptor, and HER2, with functional imaging parameters from (6)(8)Ga-RGD PET/CT and (1)(8)F-FDG PET/CT. Eur. J. Nucl. Med. Mol. Imaging 2014, 41, 1534–1543. [Google Scholar] [CrossRef]
  30. Gil-Rendo, A.; Martinez-Regueira, F.; Zornoza, G.; Garcia-Velloso, M.J.; Beorlegui, C.; Rodriguez-Spiteri, N. Association between [18F]fluorodeoxyglucose uptake and prognostic parameters in breast cancer. Br. J. Surg. 2009, 96, 166–170. [Google Scholar] [CrossRef]
  31. Ikenaga, N.; Otomo, N.; Toyofuku, A.; Ueda, Y.; Toyoda, K.; Hayashi, T.; Nishikawa, K.; Tanaka, M. Standardized uptake values for breast carcinomas assessed by fluorodeoxyglucose-positron emission tomography correlate with prognostic factors. Am. Surg. 2007, 73, 1151–1157. [Google Scholar] [PubMed]
  32. Mavi, A.; Cermik, T.F.; Urhan, M.; Puskulcu, H.; Basu, S.; Yu, J.Q.; Zhuang, H.; Czerniecki, B.; Alavi, A. The effects of estrogen, progesterone, and C-erbB-2 receptor states on 18F-FDG uptake of primary breast cancer lesions. J. Nucl. Med. 2007, 48, 1266–1272. [Google Scholar] [CrossRef] [PubMed]
  33. Nakajo, M.; Kajiya, Y.; Kaneko, T.; Kaneko, Y.; Takasaki, T.; Tani, A.; Ueno, M.; Koriyama, C.; Nakajo, M. FDG PET/CT and diffusion-weighted imaging for breast cancer: Prognostic value of maximum standardized uptake values and apparent diffusion coefficient values of the primary lesion. Eur. J. Nucl. Med. Mol. Imaging 2010, 37, 2011–2020. [Google Scholar] [CrossRef] [PubMed]
  34. Osborne, J.R.; Port, E.; Gonen, M.; Doane, A.; Yeung, H.; Gerald, W.; Cook, J.B.; Larson, S. 18F-FDG PET of locally invasive breast cancer and association of estrogen receptor status with standardized uptake value: Microarray and immunohistochemical analysis. J. Nucl. Med. 2010, 51, 543–550. [Google Scholar] [CrossRef] [PubMed]
  35. Tseng, L.M.; Yin, P.H.; Yang, C.W.; Tsai, Y.F.; Hsu, C.Y.; Chi, C.W.; Lee, H.C. Somatic mutations of the mitochondrial genome in human breast cancers. Genes Chromosomes Cancer 2011, 50, 800–811. [Google Scholar] [CrossRef] [PubMed]
  36. Tan, D.J.; Bai, R.K.; Wong, L.J. Comprehensive scanning of somatic mitochondrial DNA mutations in breast cancer. Cancer Res. 2002, 62, 972–976. [Google Scholar] [PubMed]
  37. Coller, H.A.; Khrapko, K.; Bodyak, N.D.; Nekhaeva, E.; Herrero-Jimenez, P.; Thilly, W.G. High frequency of homoplasmic mitochondrial DNA mutations in human tumors can be explained without selection. Nat. Genet. 2001, 28, 147–150. [Google Scholar] [CrossRef]
  38. Samuels, D.C.; Li, C.; Li, B.; Song, Z.; Torstenson, E.; Boyd Clay, H.; Rokas, A.; Thornton-Wells, T.A.; Moore, J.H.; Hughes, T.M.; et al. Recurrent tissue-specific mtDNA mutations are common in humans. PLoS Genet. 2013, 9, e1003929. [Google Scholar] [CrossRef]
  39. He, Y.; Wu, J.; Dressman, D.C.; Iacobuzio-Donahue, C.; Markowitz, S.D.; Velculescu, V.E.; Diaz, L.A., Jr.; Kinzler, K.W.; Vogelstein, B.; Papadopoulos, N. Heteroplasmic mitochondrial DNA mutations in normal and tumour cells. Nature 2010, 464, 610–614. [Google Scholar] [CrossRef] [Green Version]
  40. Li, M.K.; Schroder, R.; Ni, S.Y.; Madea, B.; Stoneking, M. Extensive tissue-related and allele-related mtDNA heteroplasmy suggests positive selection for somatic mutations. Proc. Natl. Acad. Sci. USA 2015, 112, 2491–2496. [Google Scholar] [CrossRef] [Green Version]
  41. Calloway, C.D.; Reynolds, R.L.; Herrin, G.L., Jr.; Anderson, W.W. The frequency of heteroplasmy in the HVII region of mtDNA differs across tissue types and increases with age. Am. J. Hum. Genet. 2000, 66, 1384–1397. [Google Scholar] [CrossRef] [PubMed]
  42. Johnson, A.A.; Johnson, K.A. Exonuclease proofreading by human mitochondrial DNA polymerase. J. Biol. Chem. 2001, 276, 38097–38107. [Google Scholar] [CrossRef] [PubMed]
  43. Collura, R.V.; Auerbach, M.R.; Stewart, C.B. A quick, direct method that can differentiate expressed mitochondrial genes from their nuclear pseudogenes. Curr. Biol. 1996, 6, 1337–1339. [Google Scholar] [CrossRef]
  44. Ramos, A.; Barbena, E.; Mateiu, L.; del Mar Gonzalez, M.; Mairal, Q.; Lima, M.; Montiel, R.; Aluja, M.P.; Santos, C. Nuclear insertions of mitochondrial origin: Database updating and usefulness in cancer studies. Mitochondrion 2011, 11, 946–953. [Google Scholar] [CrossRef] [PubMed]
  45. Parr, R.L.; Maki, J.; Reguly, B.; Dakubo, G.D.; Aguirre, A.; Wittock, R.; Robinson, K.; Jakupciak, J.P.; Thayer, R.E. The pseudo-mitochondrial genome influences mistakes in heteroplasmy interpretation. BMC Genomics 2006, 7, 185. [Google Scholar] [CrossRef] [PubMed]
  46. Parfait, B.; Rustin, P.; Munnich, A.; Rotig, A. Co-amplification of nuclear pseudogenes and assessment of heteroplasmy of mitochondrial DNA mutations. Biochem. Biophys. Res. Commun. 1998, 247, 57–59. [Google Scholar] [CrossRef]
  47. Albayrak, L.; Khanipov, K.; Pimenova, M.; Golovko, G.; Rojas, M.; Pavlidis, I.; Chumakov, S.; Aguilar, G.; Chavez, A.; Widger, W.R.; et al. The ability of human nuclear DNA to cause false positive low-abundance heteroplasmy calls varies across the mitochondrial genome. BMC Genomics 2016, 17, 1017. [Google Scholar] [CrossRef]
  48. Hazkani-Covo, E.; Zeller, R.M.; Martin, W. Molecular poltergeists: Mitochondrial DNA copies (numts) in sequenced nuclear genomes. PLoS Genet. 2010, 6, e1000834. [Google Scholar] [CrossRef]
  49. Knoop, V. When you can’t trust the DNA: RNA editing changes transcript sequences. Cell Mol. Life Sci. 2011, 68, 567–586. [Google Scholar] [CrossRef]
  50. Smid, M.; Rodriguez-Gonzalez, F.G.; Sieuwerts, A.M.; Salgado, R.; Prager-Van der Smissen, W.J.; Vlugt-Daane, M.V.; van Galen, A.; Nik-Zainal, S.; Staaf, J.; Brinkman, A.B.; et al. Breast cancer genome and transcriptome integration implicates specific mutational signatures with immune cell infiltration. Nat. Commun. 2016, 7, 12910. [Google Scholar] [CrossRef] [Green Version]
  51. Dobin, A.; Gingeras, T.R. Mapping RNA-seq reads with STAR. Curr. Protoc. Bioinformatics 2015, 51, 11.14.1–11.14.19. [Google Scholar] [CrossRef] [PubMed]
  52. Liao, Y.; Smyth, G.K.; Shi, W. featureCounts: An efficient general purpose program for assigning sequence reads to genomic features. Bioinformatics 2014, 30, 923–930. [Google Scholar] [CrossRef] [PubMed]
  53. Idaghdour, Y.; Hodgkinson, A. Integrated genomic analysis of mitochondrial RNA processing in human cancers. Genome Med. 2017, 9, 36. [Google Scholar] [CrossRef] [PubMed]
  54. Van der Auwera, G.A.; Carneiro, M.O.; Hartl, C.; Poplin, R.; Del Angel, G.; Levy-Moonshine, A.; Jordan, T.; Shakir, K.; Roazen, D.; Thibault, J.; et al. From FastQ data to high confidence variant calls: The Genome Analysis Toolkit best practices pipeline. Curr. Protoc. Bioinformatics 2013, 43, 11.10.1–11.10.33. [Google Scholar] [CrossRef] [PubMed]
  55. Thorvaldsdottir, H.; Robinson, J.T.; Mesirov, J.P. Integrative Genomics Viewer (IGV): High-performance genomics data visualization and exploration. Brief Bioinform. 2013, 14, 178–192. [Google Scholar] [CrossRef] [PubMed]
  56. Robinson, J.T.; Thorvaldsdottir, H.; Winckler, W.; Guttman, M.; Lander, E.S.; Getz, G.; Mesirov, J.P. Integrative genomics viewer. Nat. Biotechnol. 2011, 29, 24–26. [Google Scholar] [CrossRef] [PubMed] [Green Version]
  57. Lott, M.T.; Leipzig, J.N.; Derbeneva, O.; Xie, H.M.; Chalkia, D.; Sarmady, M.; Procaccio, V.; Wallace, D.C. mtDNA variation and analysis using Mitomap and Mitomaster. Curr. Protoc. Bioinformatics 2013, 44, 1.23.1–1.23.26. [Google Scholar] [CrossRef] [PubMed]
  58. Weissensteiner, H.; Pacher, D.; Kloss-Brandstatter, A.; Forer, L.; Specht, G.; Bandelt, H.J.; Kronenberg, F.; Salas, A.; Schonherr, S. HaploGrep 2: Mitochondrial haplogroup classification in the era of high-throughput sequencing. Nucleic Acids Res. 2016, 44, W58–W63. [Google Scholar] [CrossRef]
  59. Gehring, J.S.; Fischer, B.; Lawrence, M.; Huber, W. SomaticSignatures: Inferring mutational signatures from single-nucleotide variants. Bioinformatics 2015, 31, 3673–3675. [Google Scholar] [CrossRef]
  60. Chen, H.; Boutros, P.C. VennDiagram: A package for the generation of highly-customizable Venn and Euler diagrams in R. BMC Bioinform. 2011, 12, 35. [Google Scholar] [CrossRef]
Figure 1. Variants in the mitochondrial RNA of 344 primary breast tumor cases. Position on the mitochondrial genome (circle) and their variant allele frequency (increasing % from inner-to-outer) of all variants identified in the 344 cases. Somatic or germline origin in respectively closed black or open grey circles. Genes and their direction of transcription (arrows) in red (+strand) or blue (−strand). Note that variants on position 2617 (known RNA-DNA differences) are not shown.
Cancers 10 00500 g001
Figure 2. Classification of variants detected in the mitochondrial RNA and in the mitochondrial DNA of 165 primary breast tumor cases. Venn-diagram depicting classification of variants as either somatic (black) or germline (grey) at the RNA level and the DNA level.
Cancers 10 00500 g002
Figure 3. Genomic distribution of mitochondrial RNA variants of 344 primary breast tumor cases. Genomic distribution is depicted for somatic (left) or germline (right) variants in either non-coding (purple), the D-loop (orange), tRNA (red), rRNA (blue) or mRNA (green) regions of the mitochondrial genome. The percentage of total is indicated at the top of the bars. The percentage of substitutions in the mRNA regions with either a synonymous or nonsynonymous effect is indicated within the mRNA bar (light green). Note that variants at position 2617 (known RNA-DNA differences) are not included.
Cancers 10 00500 g003
Figure 4. Somatic spectrum of mitochondrial RNA variants of 344 primary breast tumor cases. The contribution of the six possible base substitutions (C > A in blue, C > G in black, C > T in red, T > A in grey, T > C in green and T > G in pink) (left) and the context of each substitution (bases immediately 5′ and 3′ to each variant in the reference genome) (right) are depicted for the germline (top) and somatic (bottom) variants (left). Note that variants on position 2617 (known RNA-DNA differences) are not included.
Cancers 10 00500 g004
Figure 5. Correlation matrix of expression of all 37 mitochondrial-encoded genes of 344 primary breast tumor cases. Correlation matrix depicting the Spearman correlation between all 37 mitochondrial-encoded genes (text of tRNA genes in red, rRNA genes in blue, mRNA genes in green). Color intensity and the size of the circle are proportional to the correlation coefficients.
Cancers 10 00500 g005
Table 1. Association between number of somatic tumor mtRNA variants or expression of the entire mtDNA and clinicopathological variables.
VariableNo. of CasesmtRNA Somatic VariantspmtRNA Expressionp
0 Variants1 Variant>1 VariantsMedian (IQR) TPM
Age 0.022 a 0.049 d
56 (28–85)291 (100%)53 (17)55 (23)61 (24) 0.11 c
unknown53
Tumor size 0.07 b 0.051 a
T1 ≤ 2 cm76 (35.2%)33.8%25.0%44.4% 19.9202 (0.0043)
T2 > 2–5 cm109 (50.5%)47.9%64.1%42.0% 19.9207 (0.0045)
T3 > 5 cm31 (14.4%)18.3%10.9%13.6% 19.9223 (0.0047)
unknown128
Grade 0.4 b 0.1 a
I24 (8.5%)9.9%12.2%5.1% 19.9202 (0.0037)
II111 (39.4%)40.7%35.1%41.0% 19.9216 (0.0044)
III147 (52.1%)49.5%52.7%53.8% 19.9209 (0.0049)
unknown62
ER 0.3 b <0.001 a
Negative81 (27.8%)21.7%31.2%30.3% 19.9196 (0.0050)
Positive210 (72.2%)78.3%68.8%69.7% 19.9216 (0.0041)
unknown53
PR 0.5 b 0.006 a
Negative102 (35.4%)31.5%40.5%35.0% 19.9204 (0.0048)
Positive186 (64.6%)68.5%59.5%65.0% 19.9215 (0.0042)
unknown56
For each subgroup within the clinicopathological variable, the number of cases and either the fraction of patients within the mtRNA somatic variant groups (0, 1 or more than 1) or the mtRNA expression (TPM, log2 transformed) is indicated. a Kruskal-Wallis (multiple groups) or Mann-Whitney (two groups) p-value. b Fisher exact p-value. c Spearman correlation coefficient. d Spearman correlation p-value.

