Cytoplasmic p21 Mediates 5-Fluorouracil Resistance by Inhibiting Pro-Apoptotic Chk2

 , , , , , , and
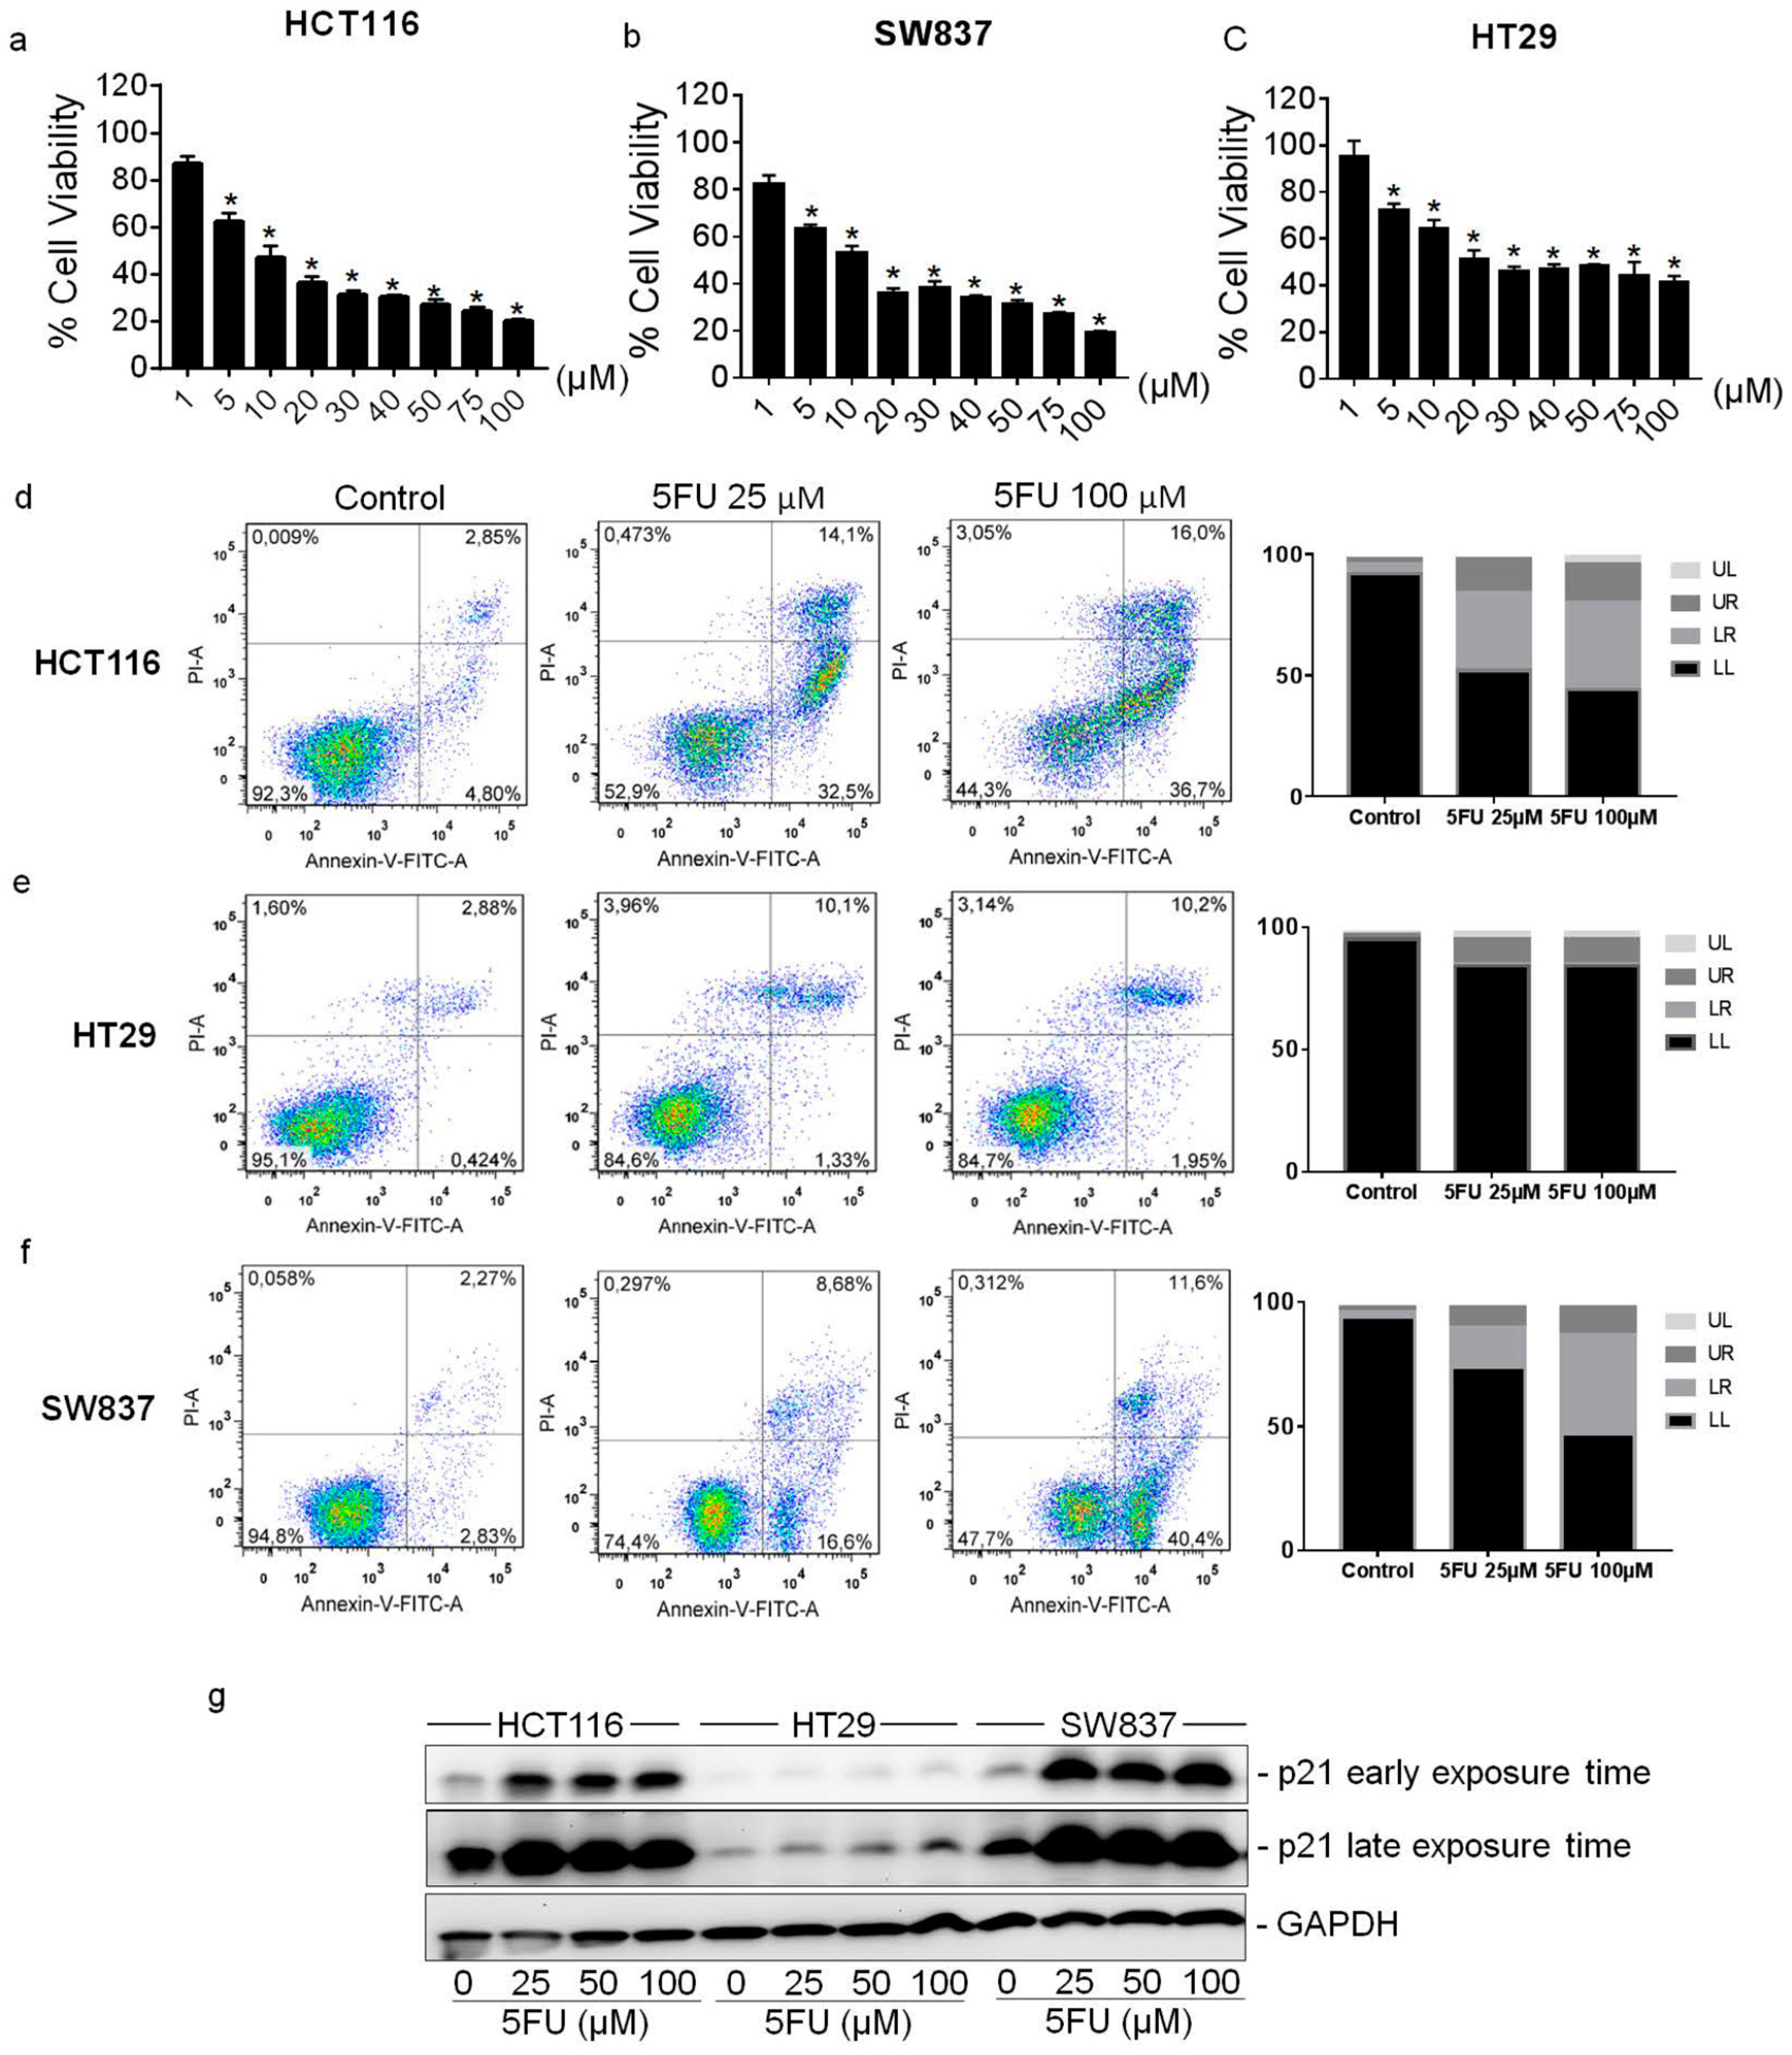
Abstract
:1. Introduction
2. Results
2.1. Cytotoxic Effect of 5FU on Colorectal Cancer Cell Lines
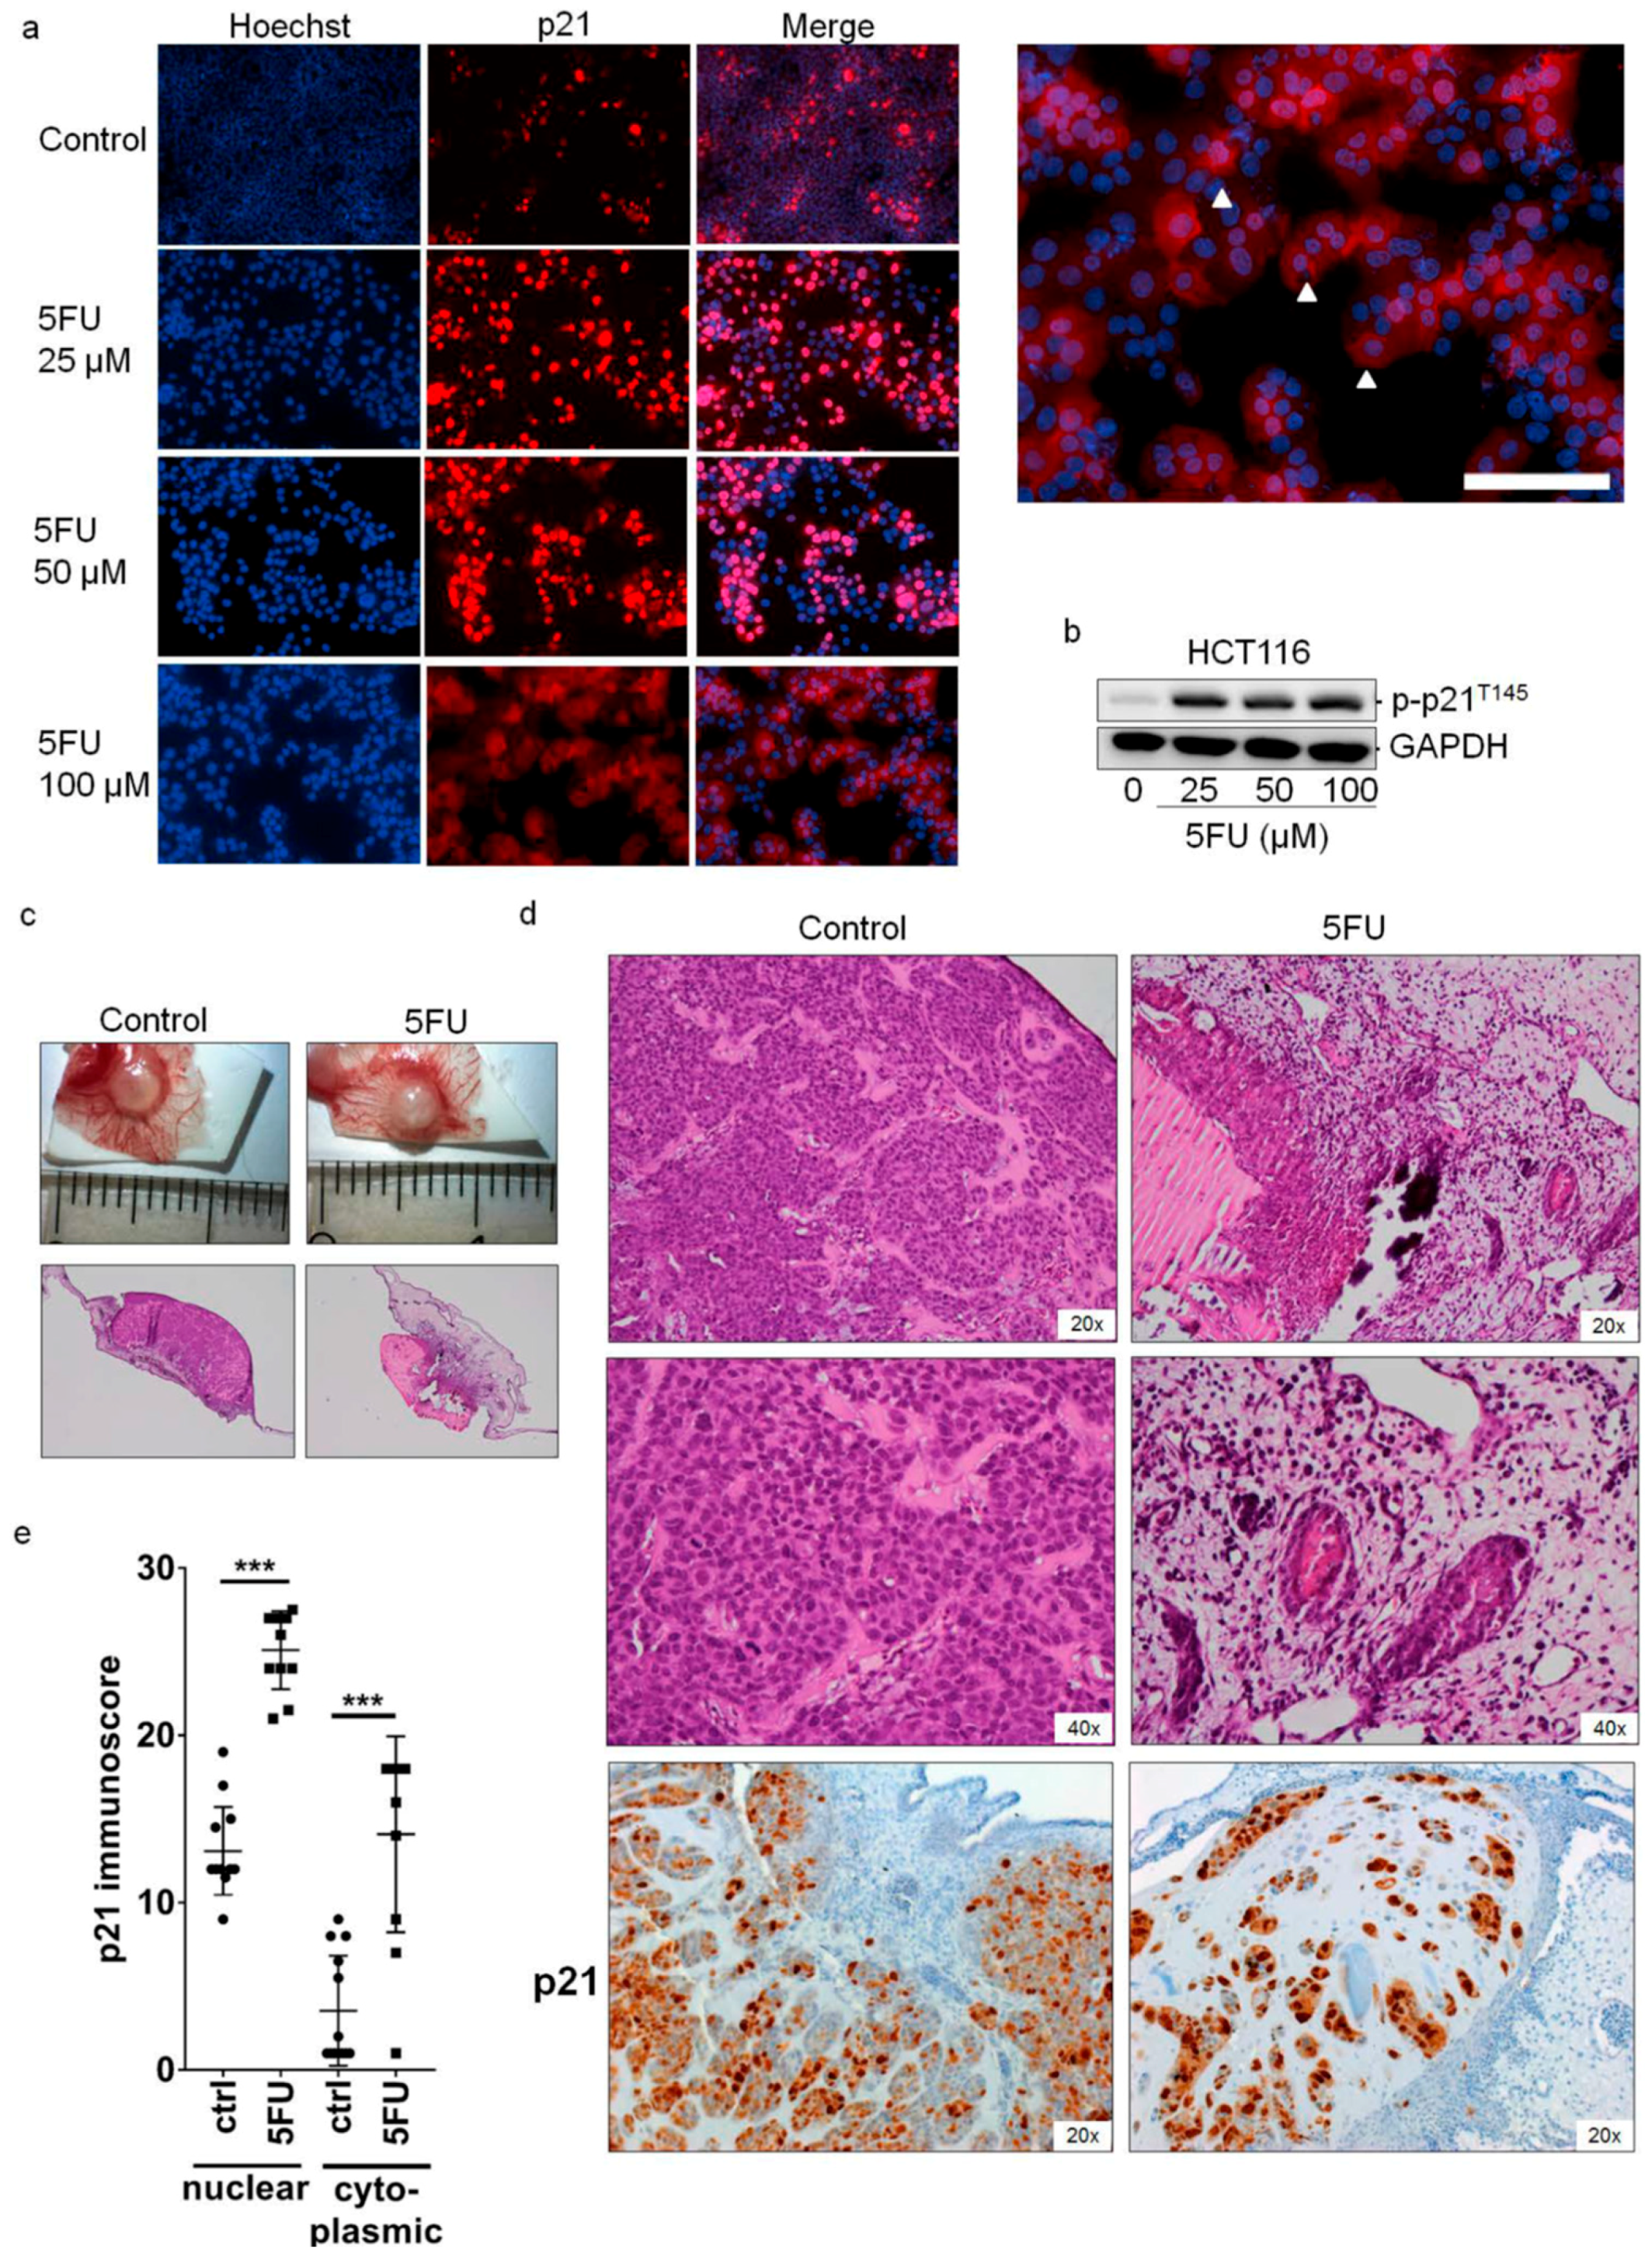
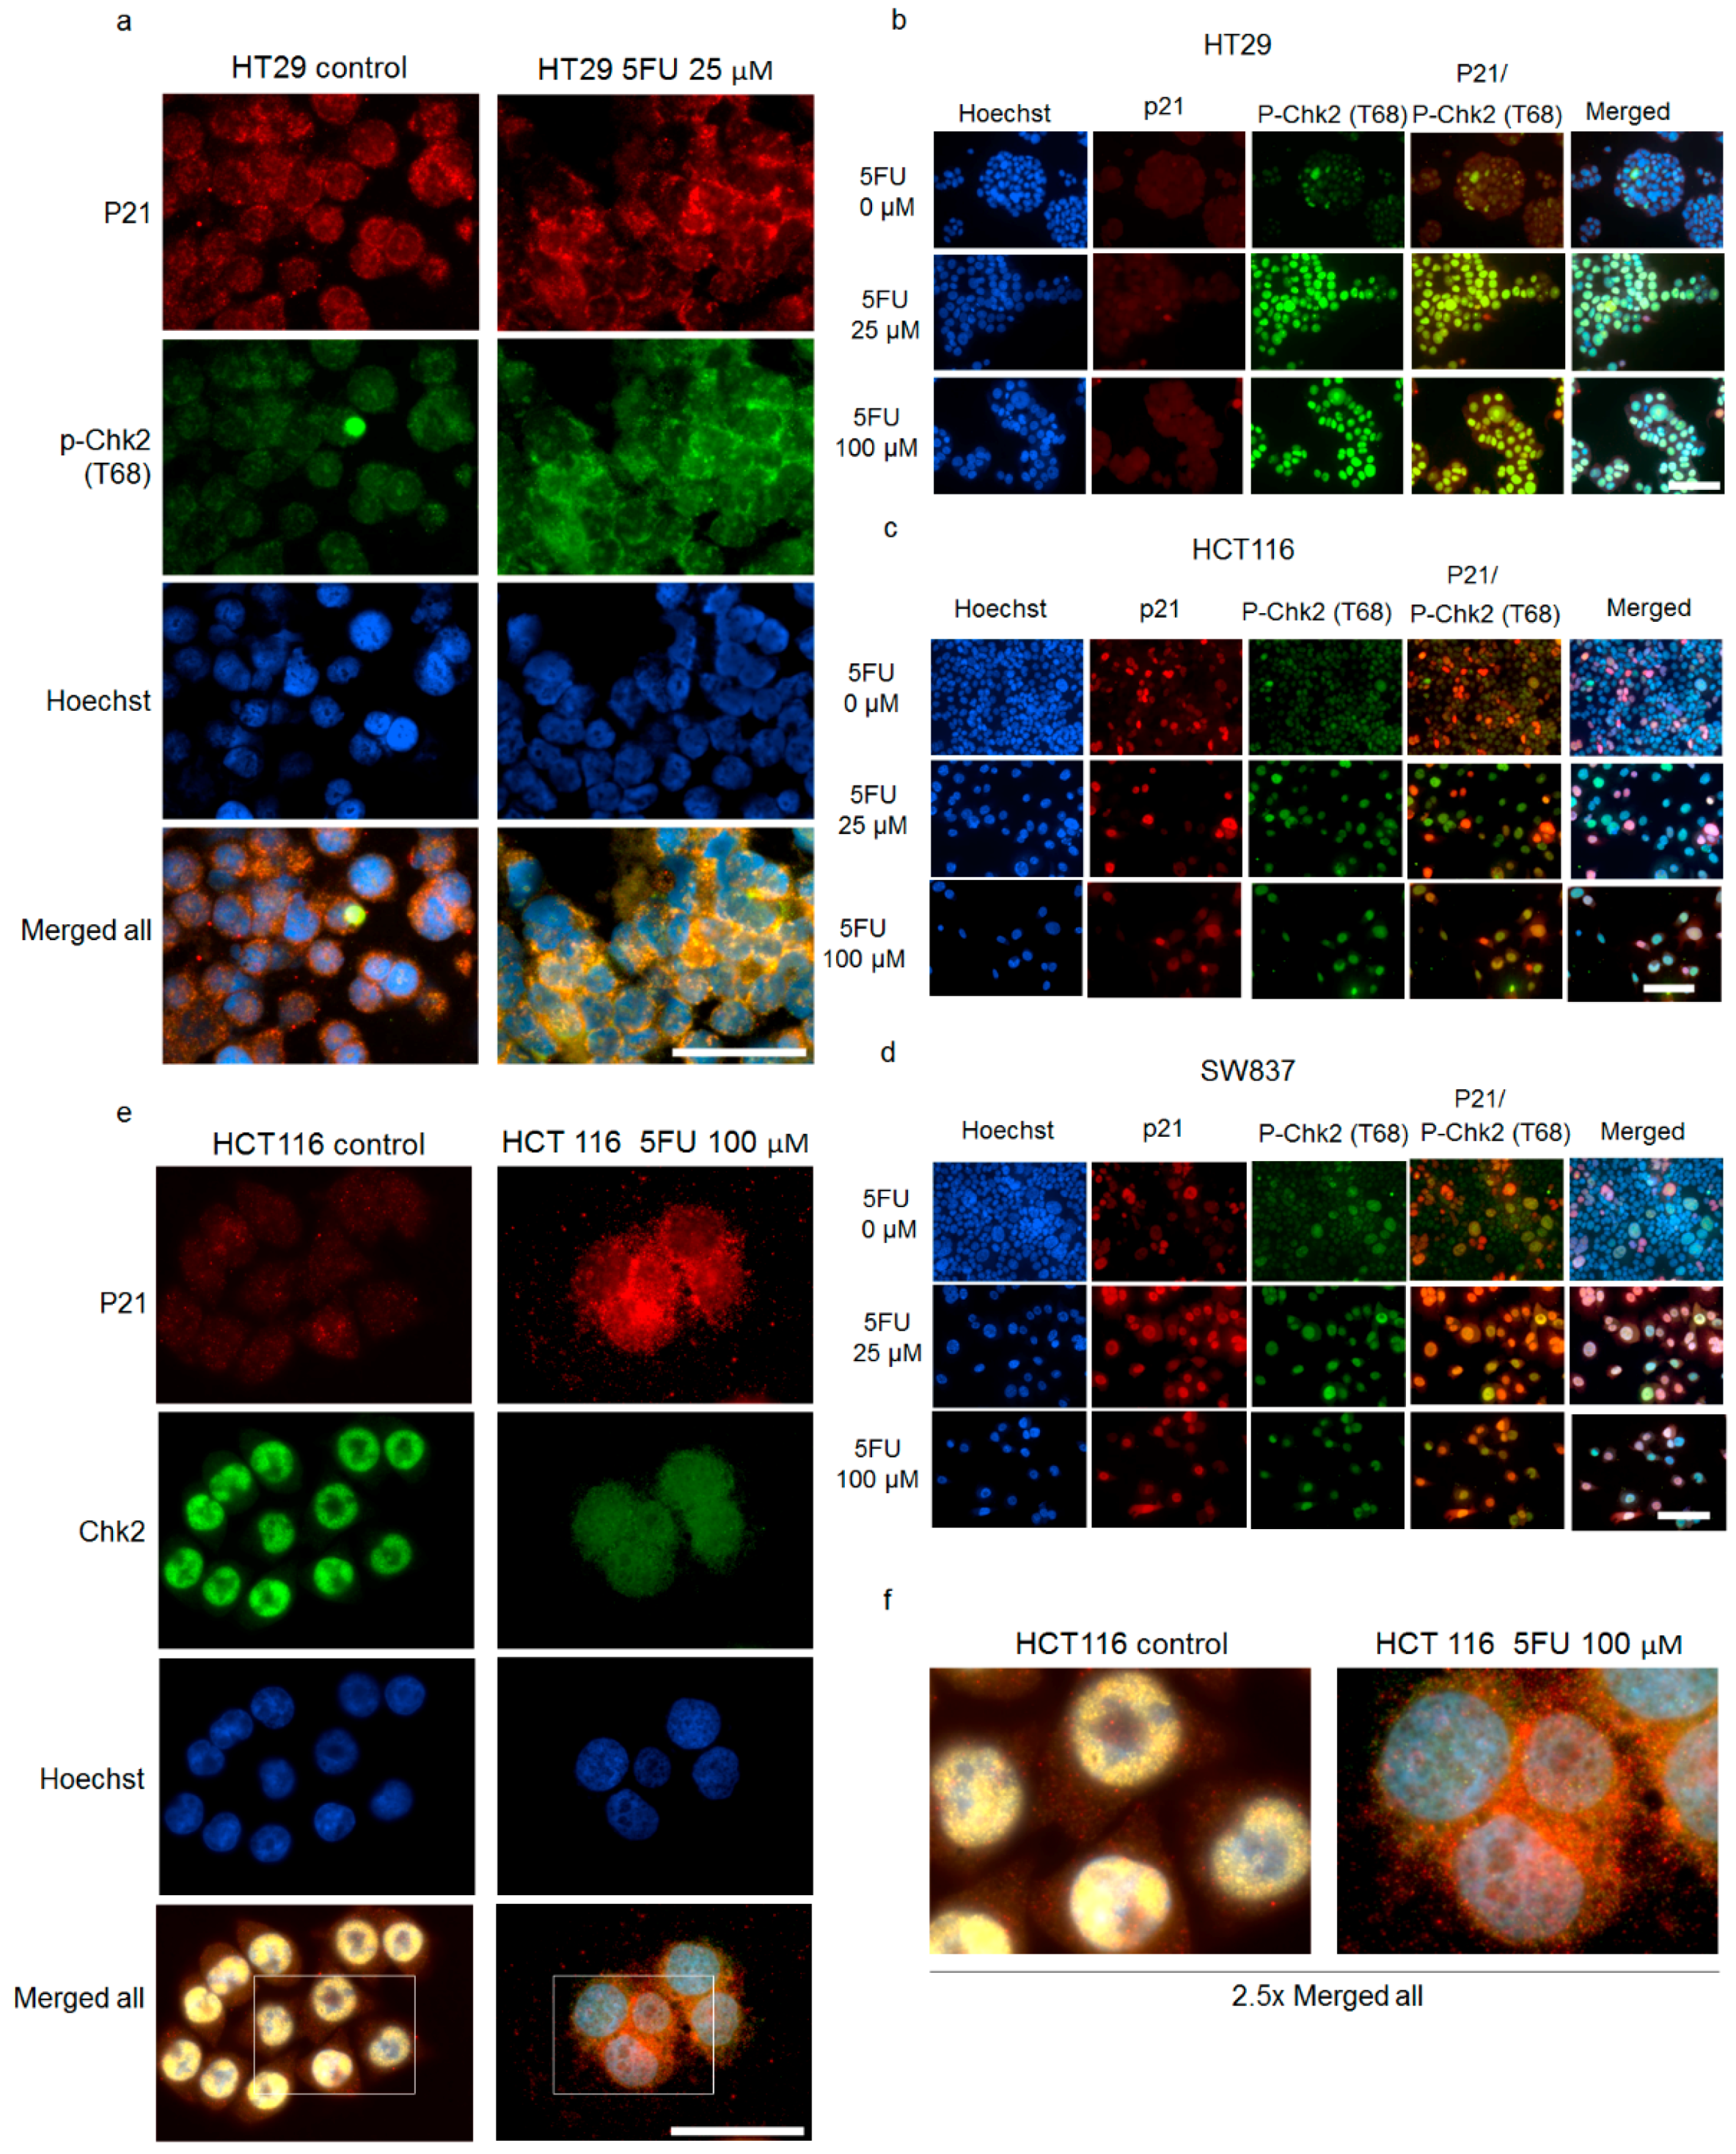
2.2. Cytoplasmic Localization of p21 in 5FU-Resistant Cells In Vitro and In Vivo
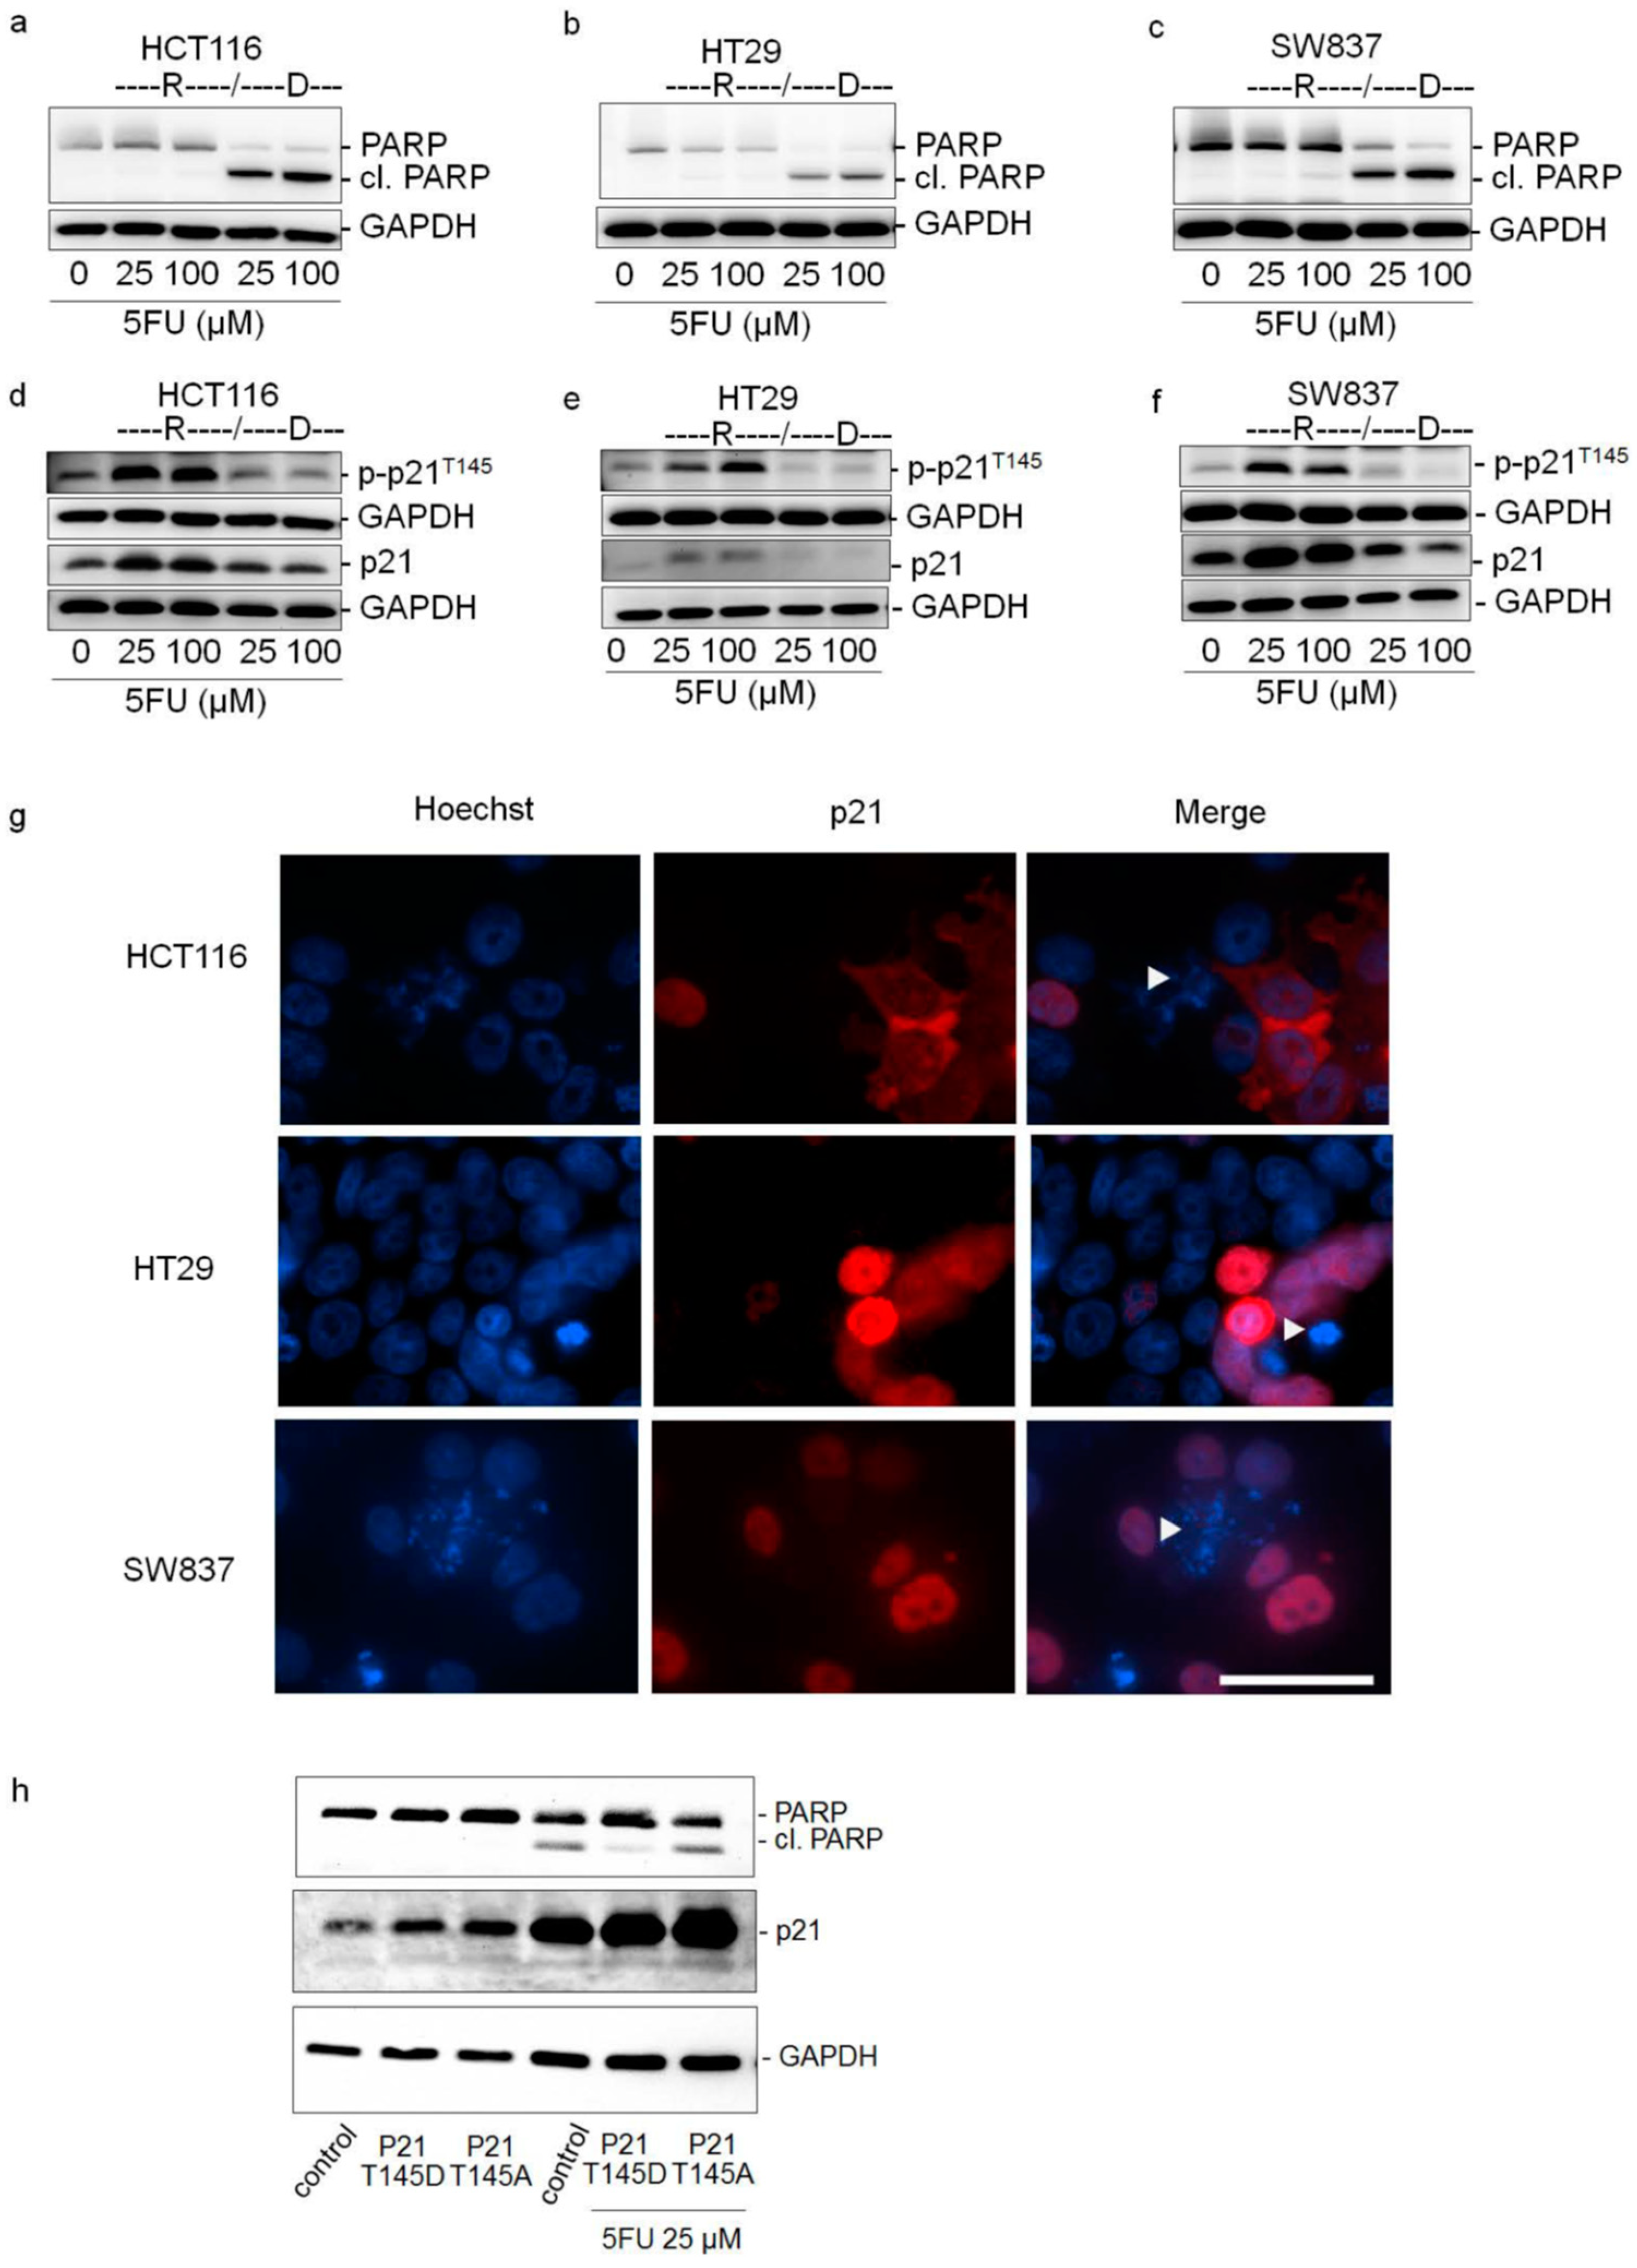
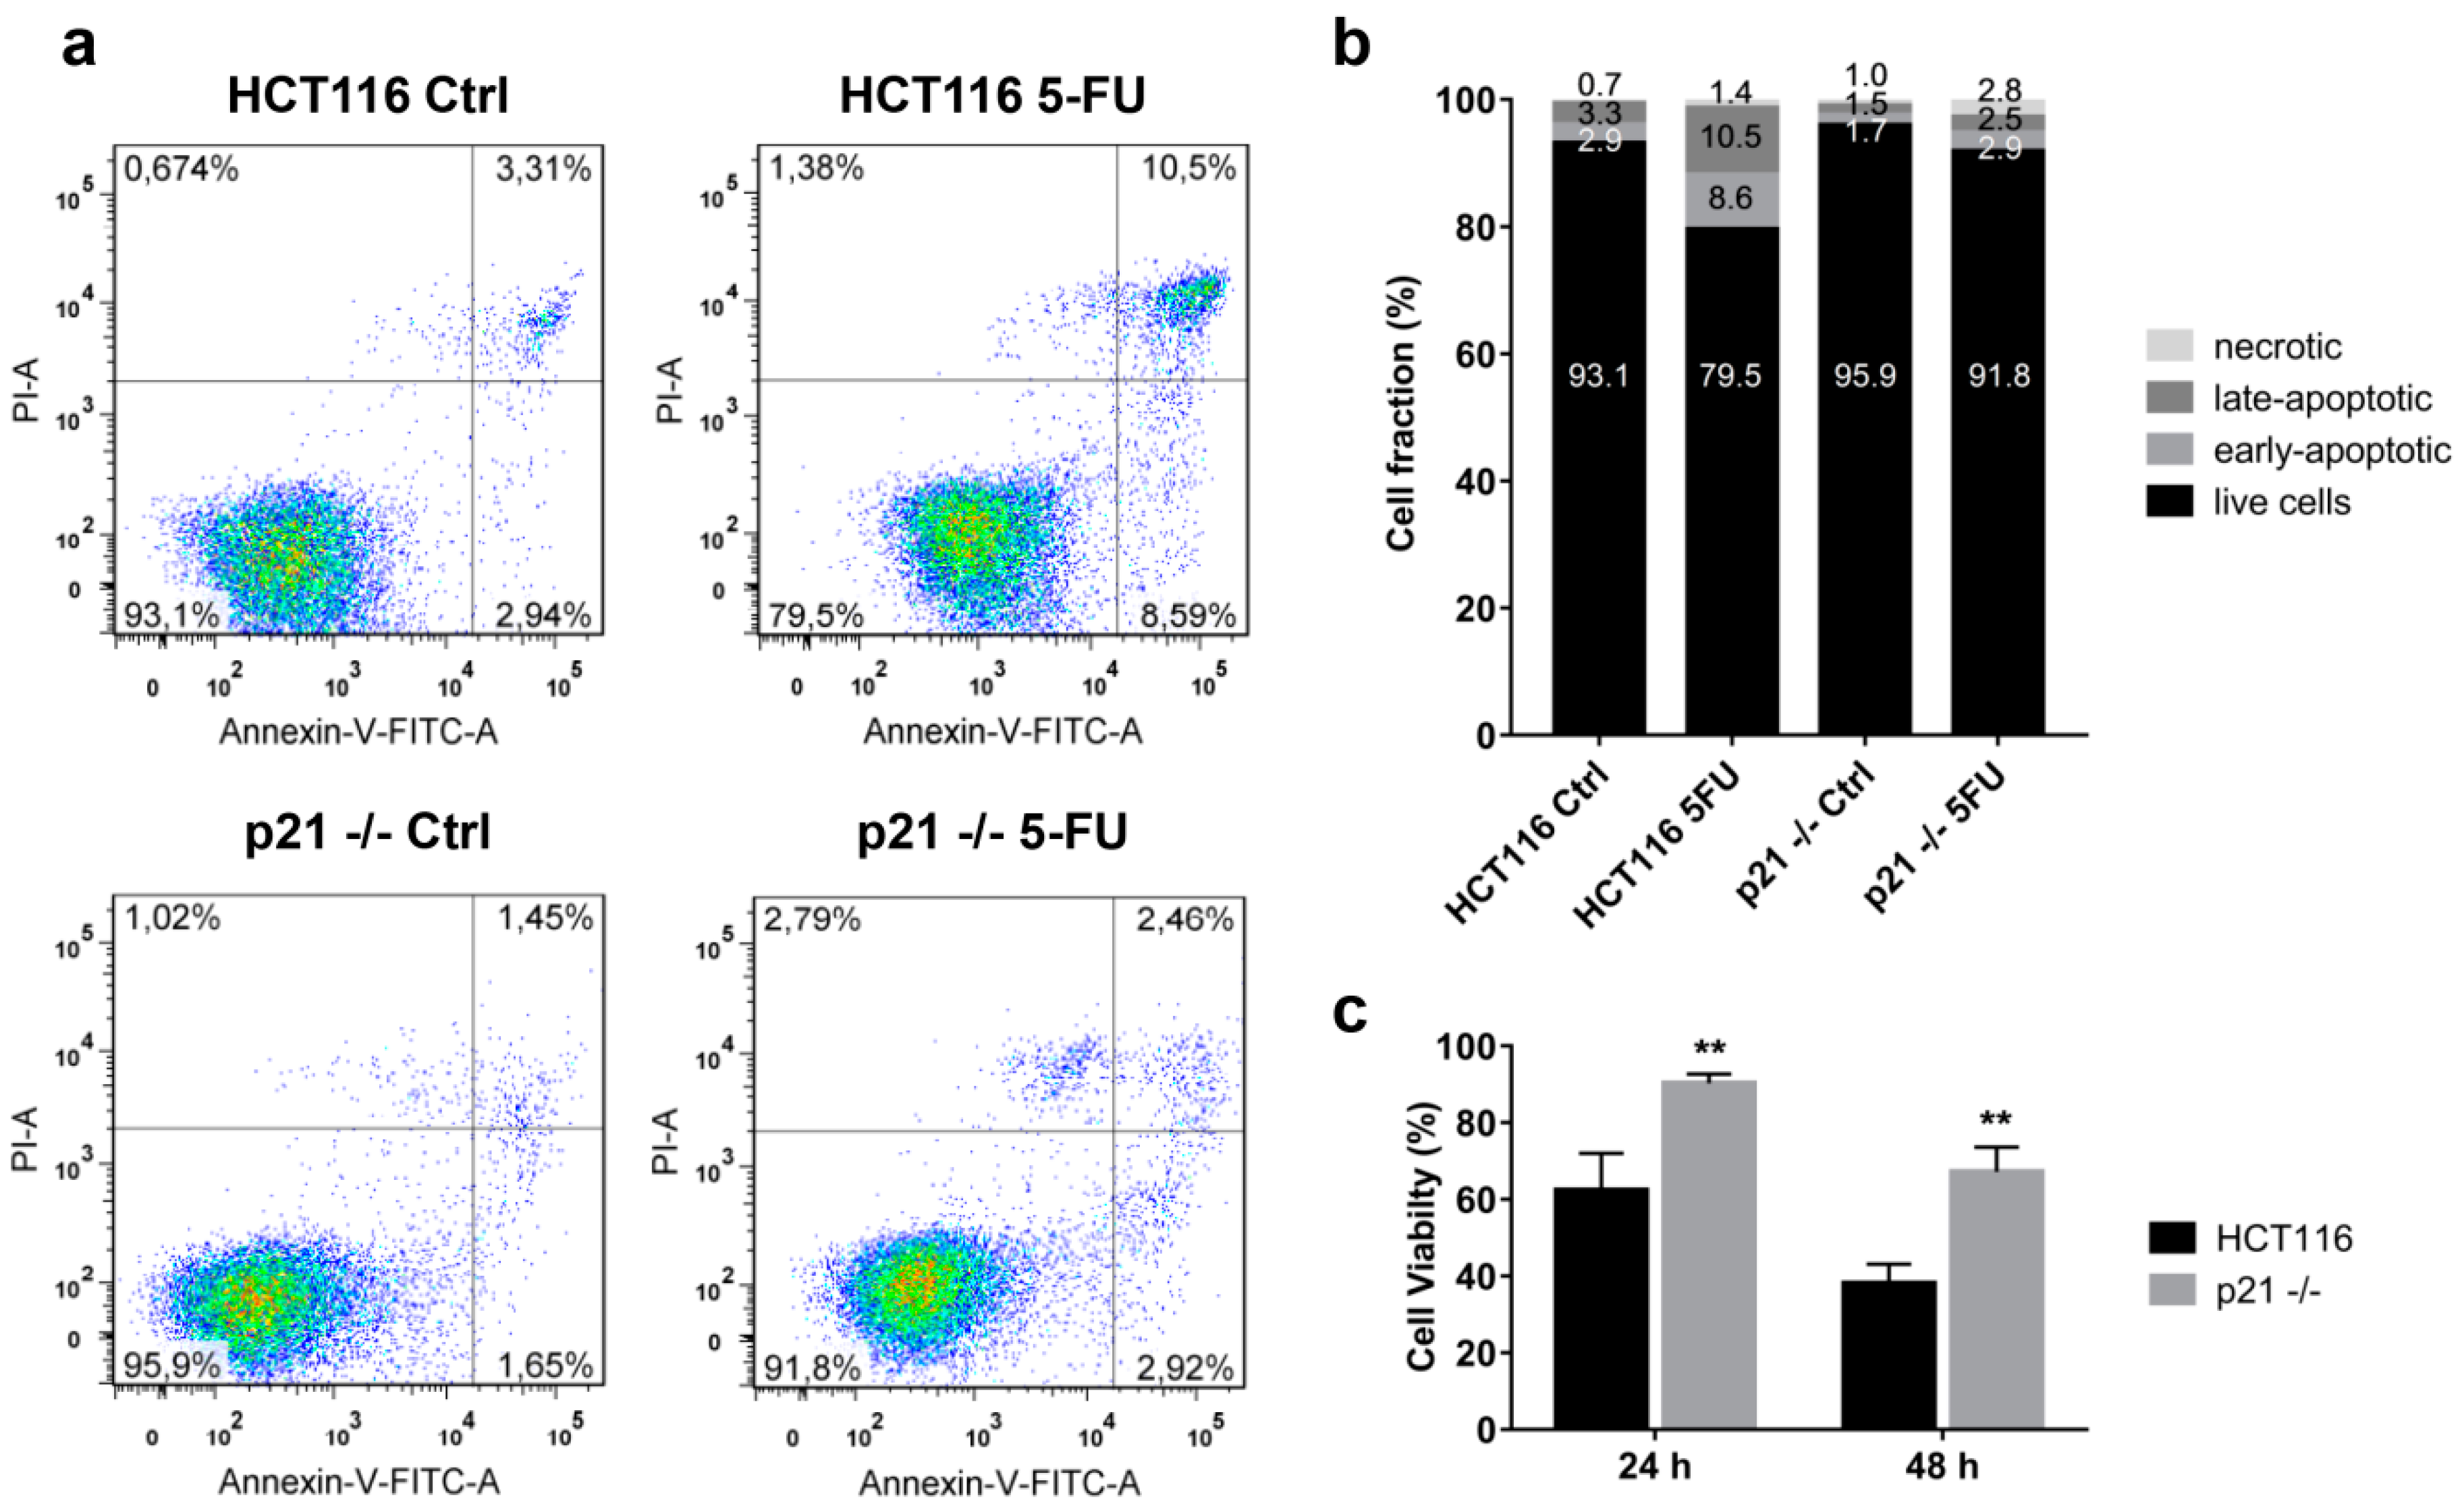
2.3. Cytoplasmic p21 Induces Apoptosis Resistance after 5FU Treatment
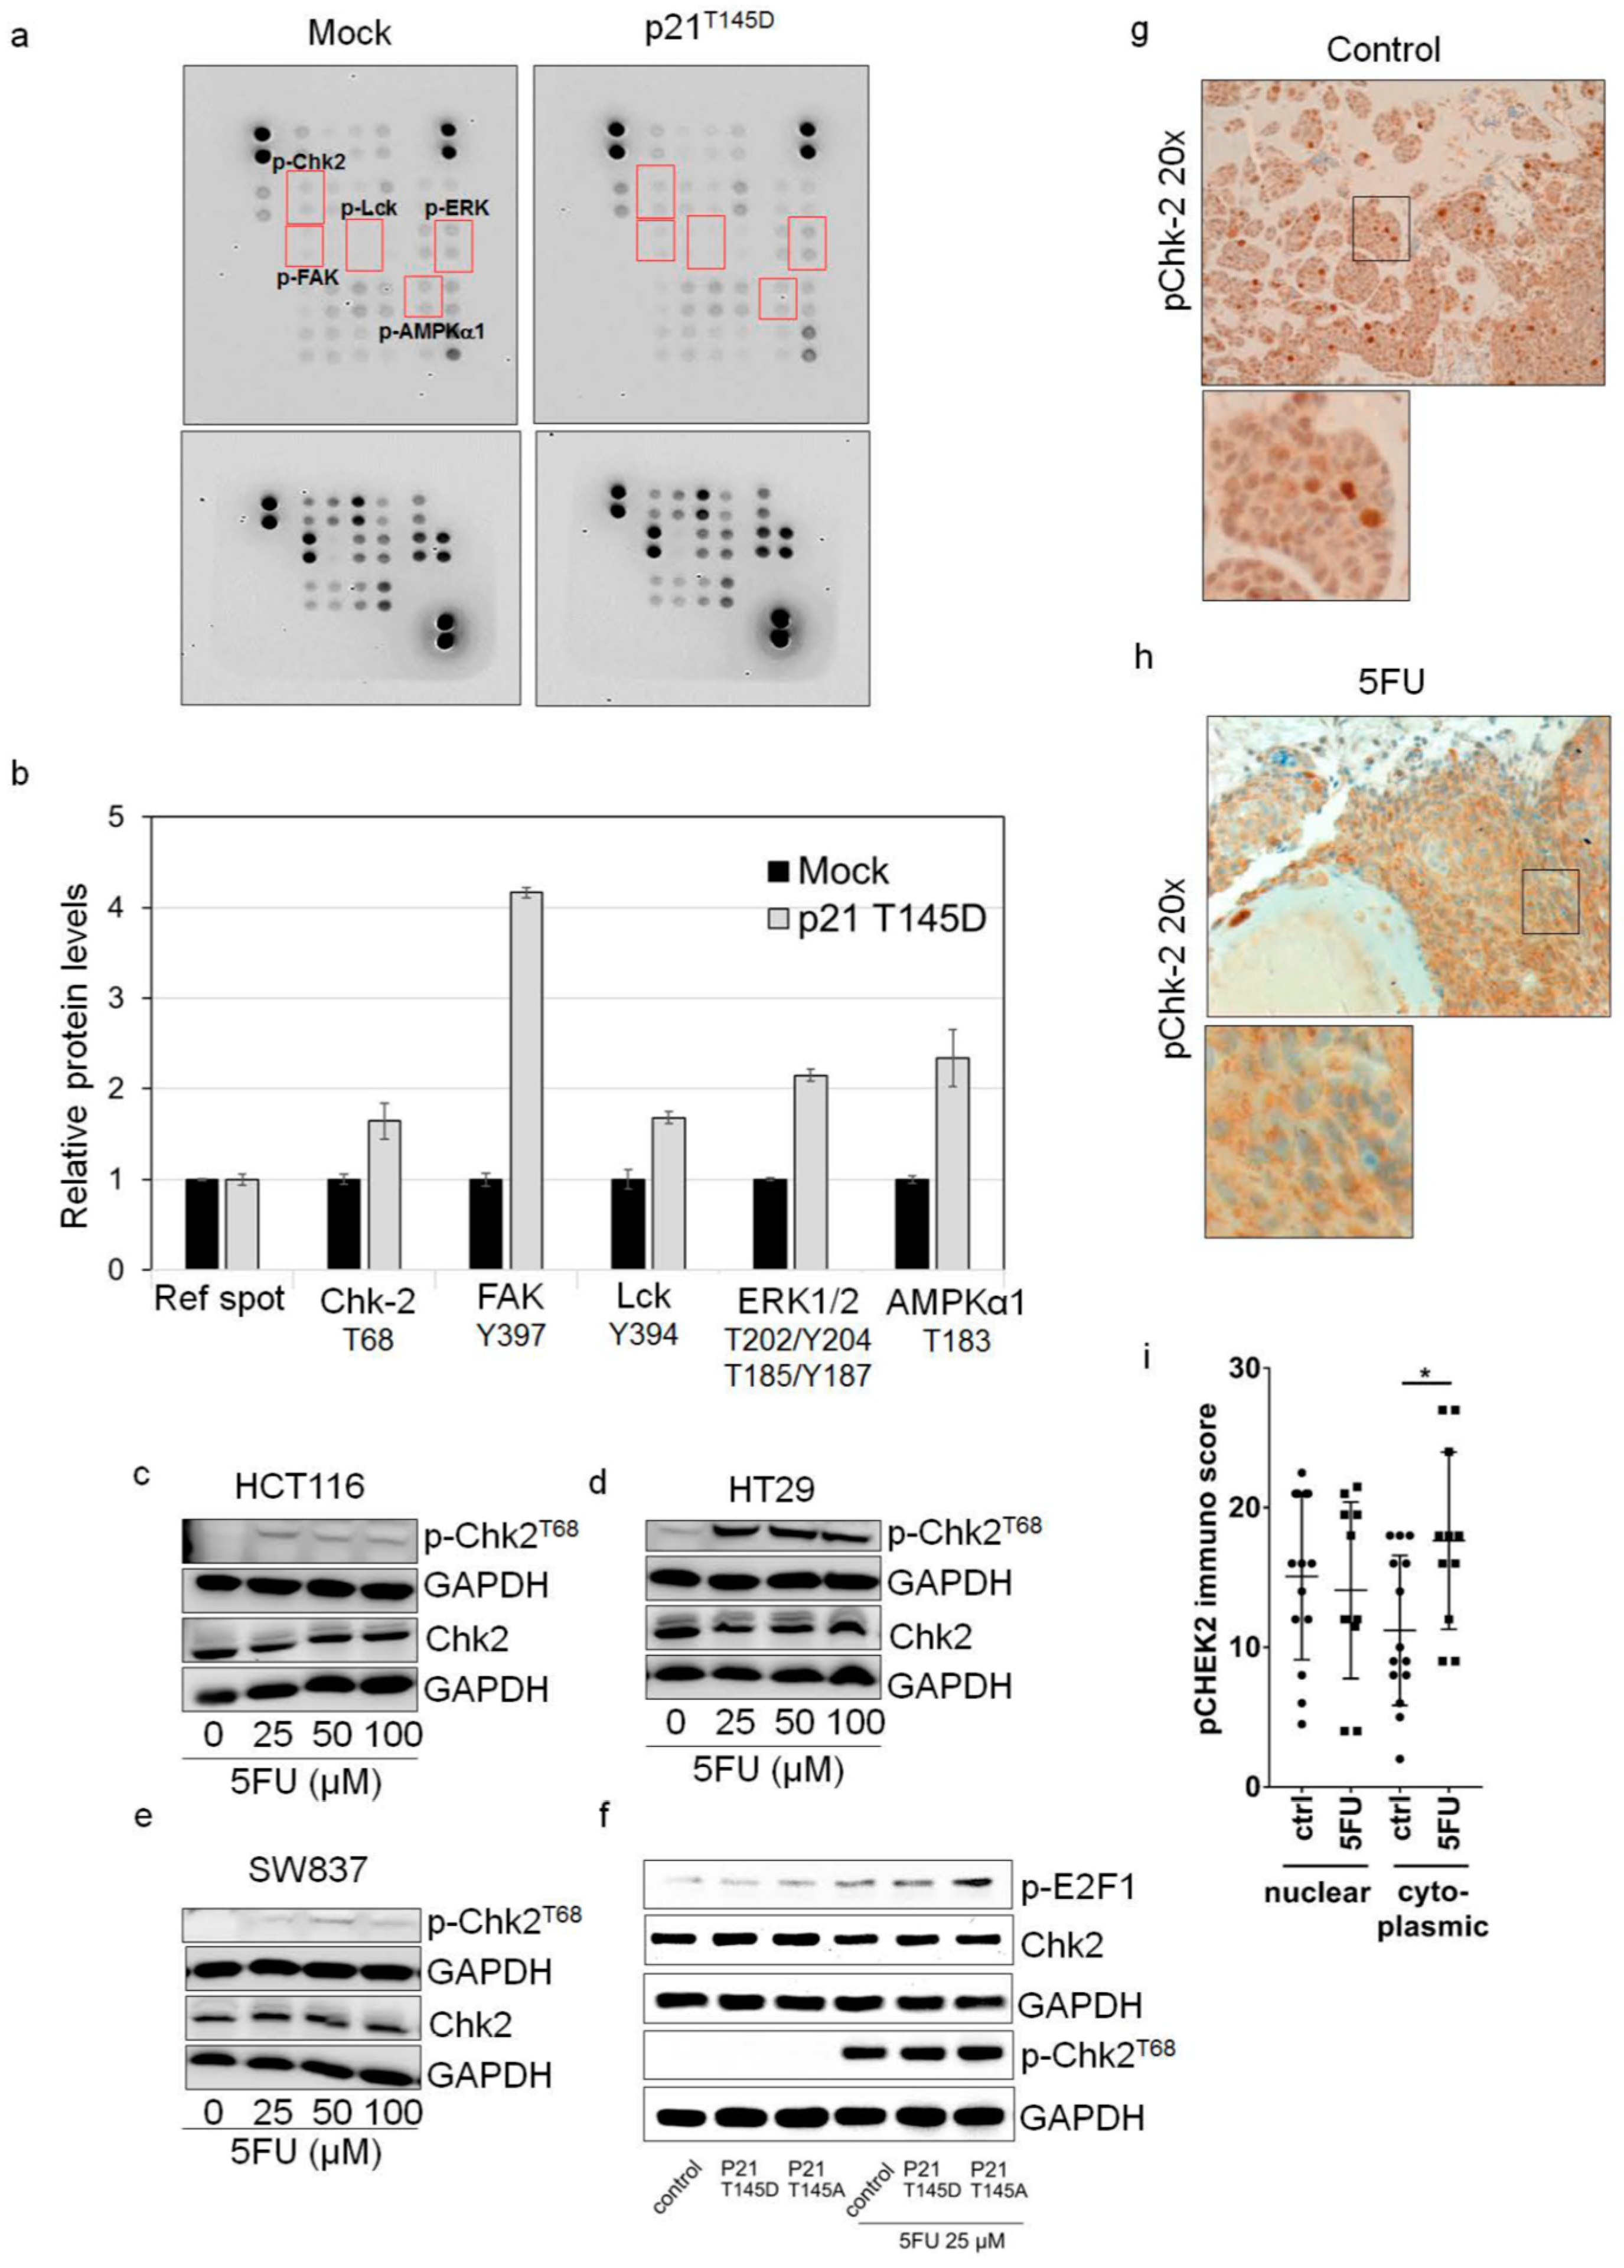
2.4. Cytoplasmic p21 Activates Cell Survival Signals and Attenuates the Pro-Apoptotic Effect of Chk2 In Vitro and In Vivo
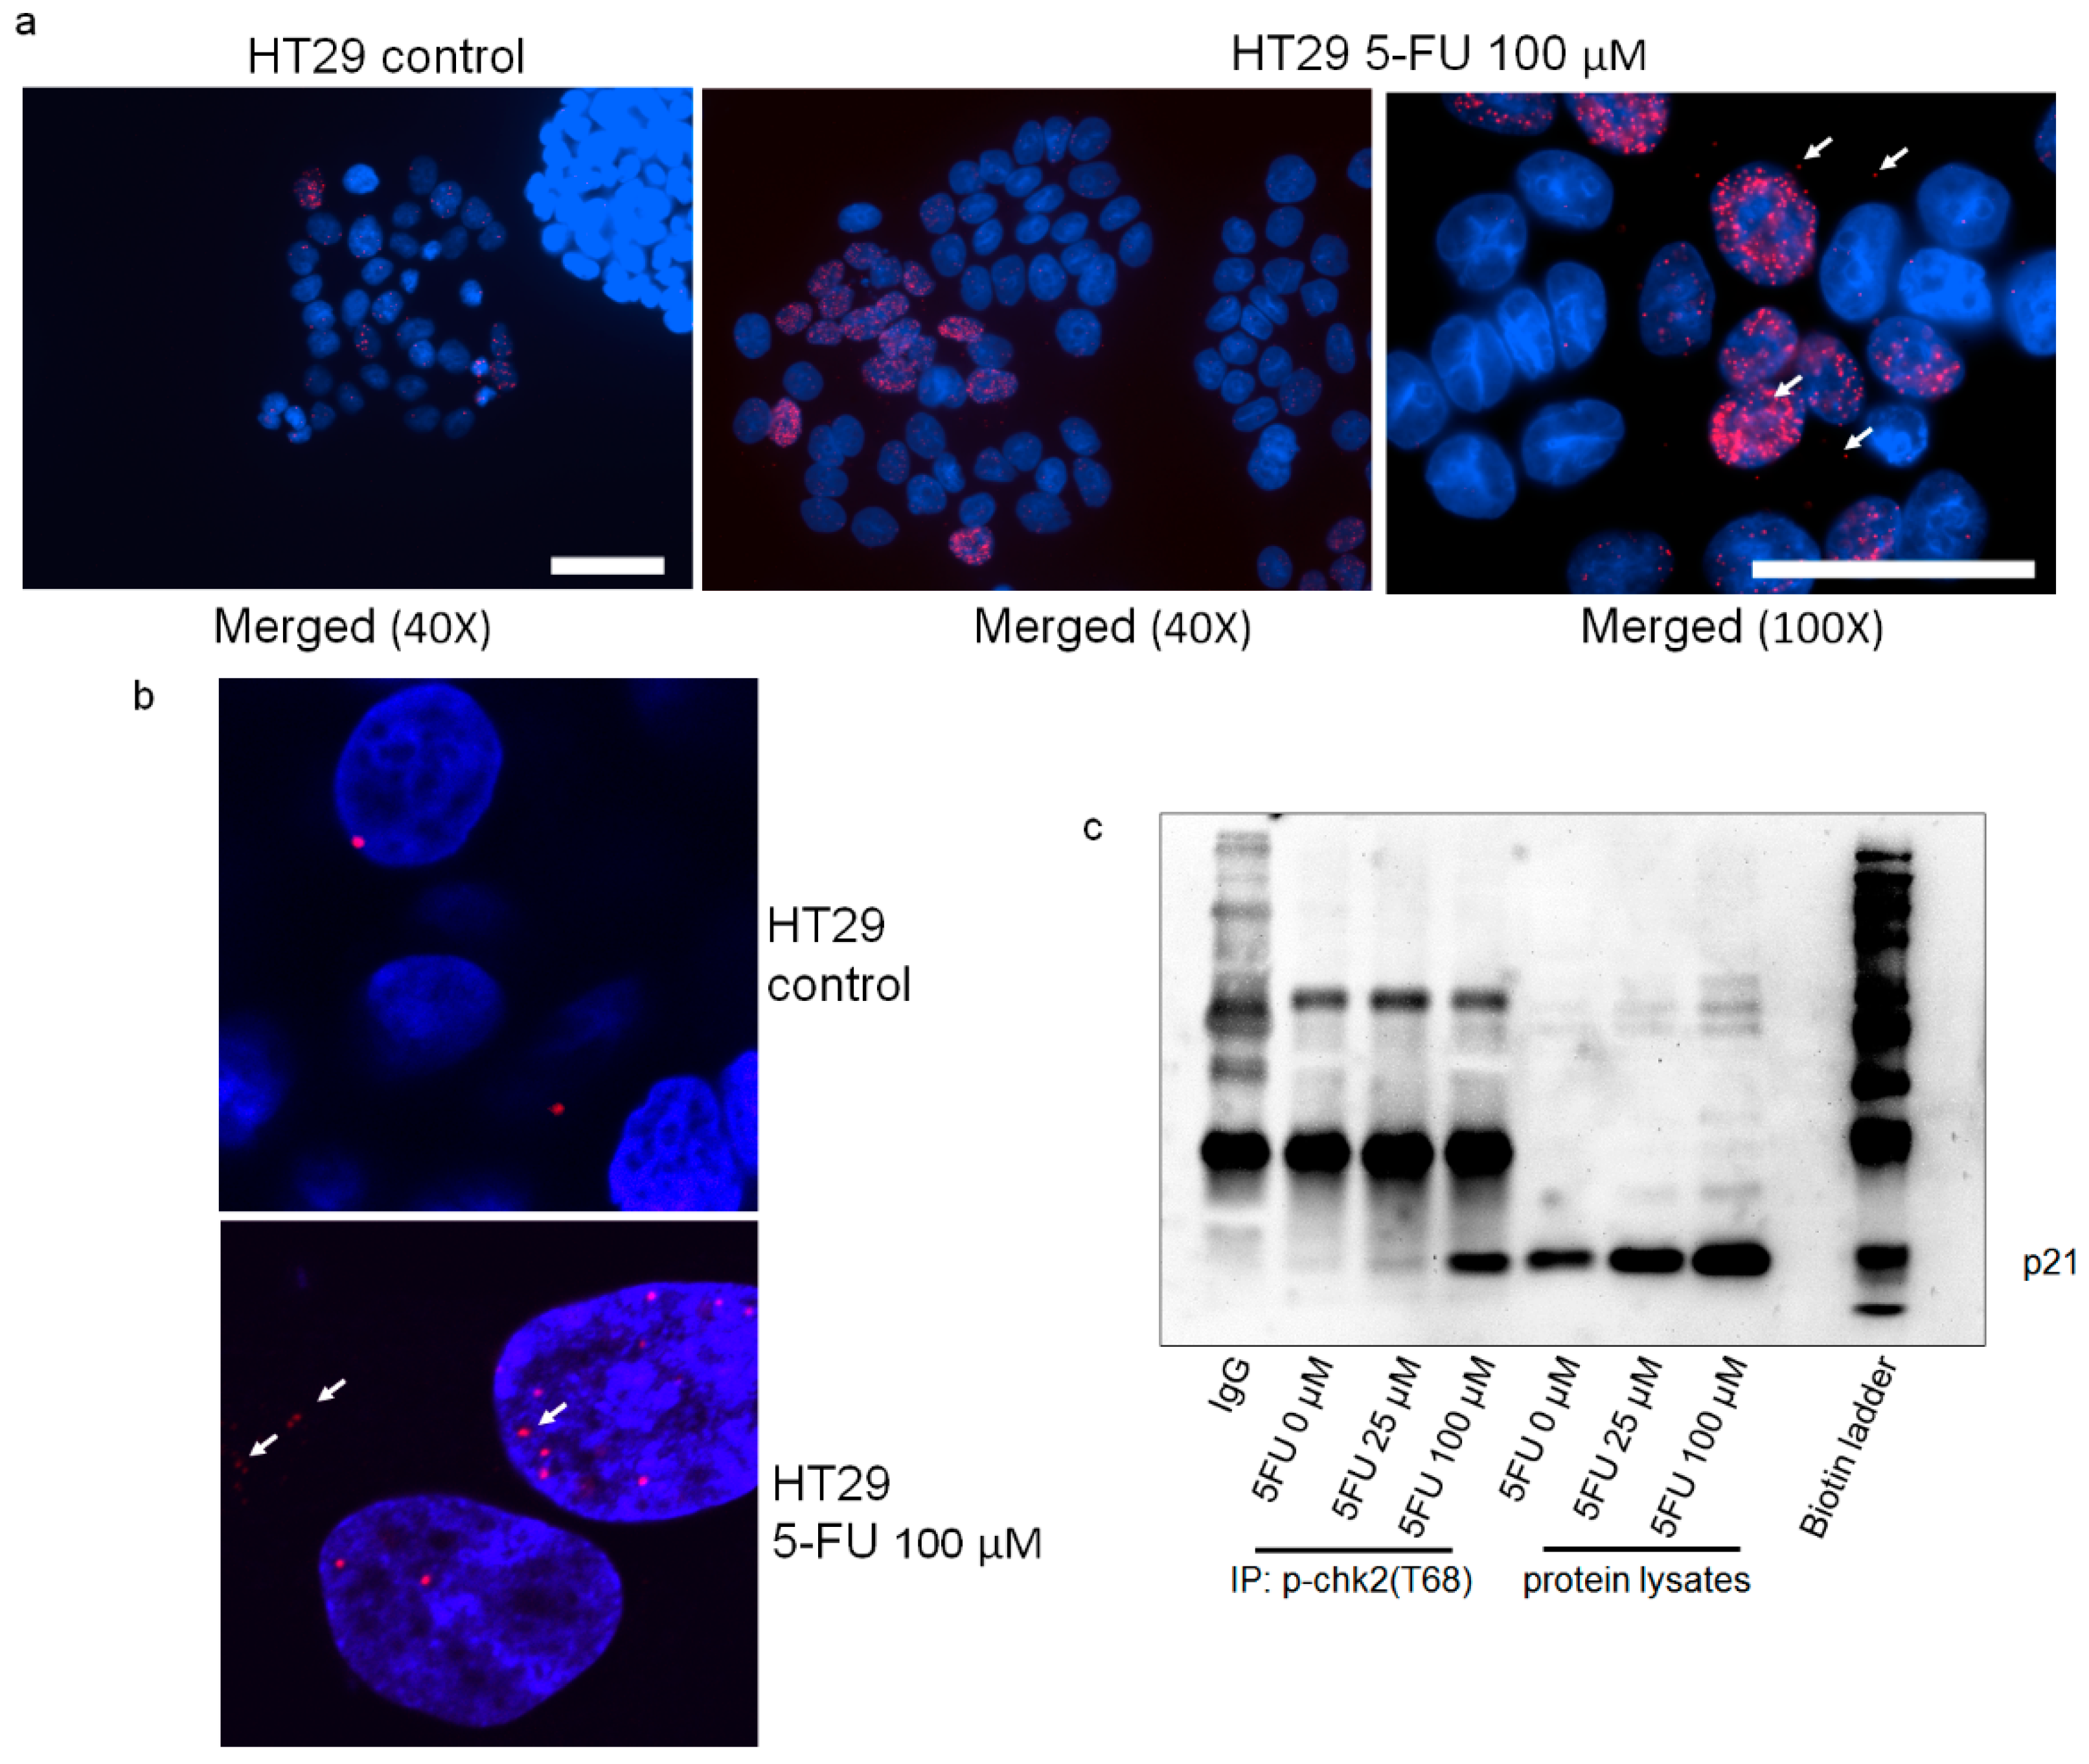
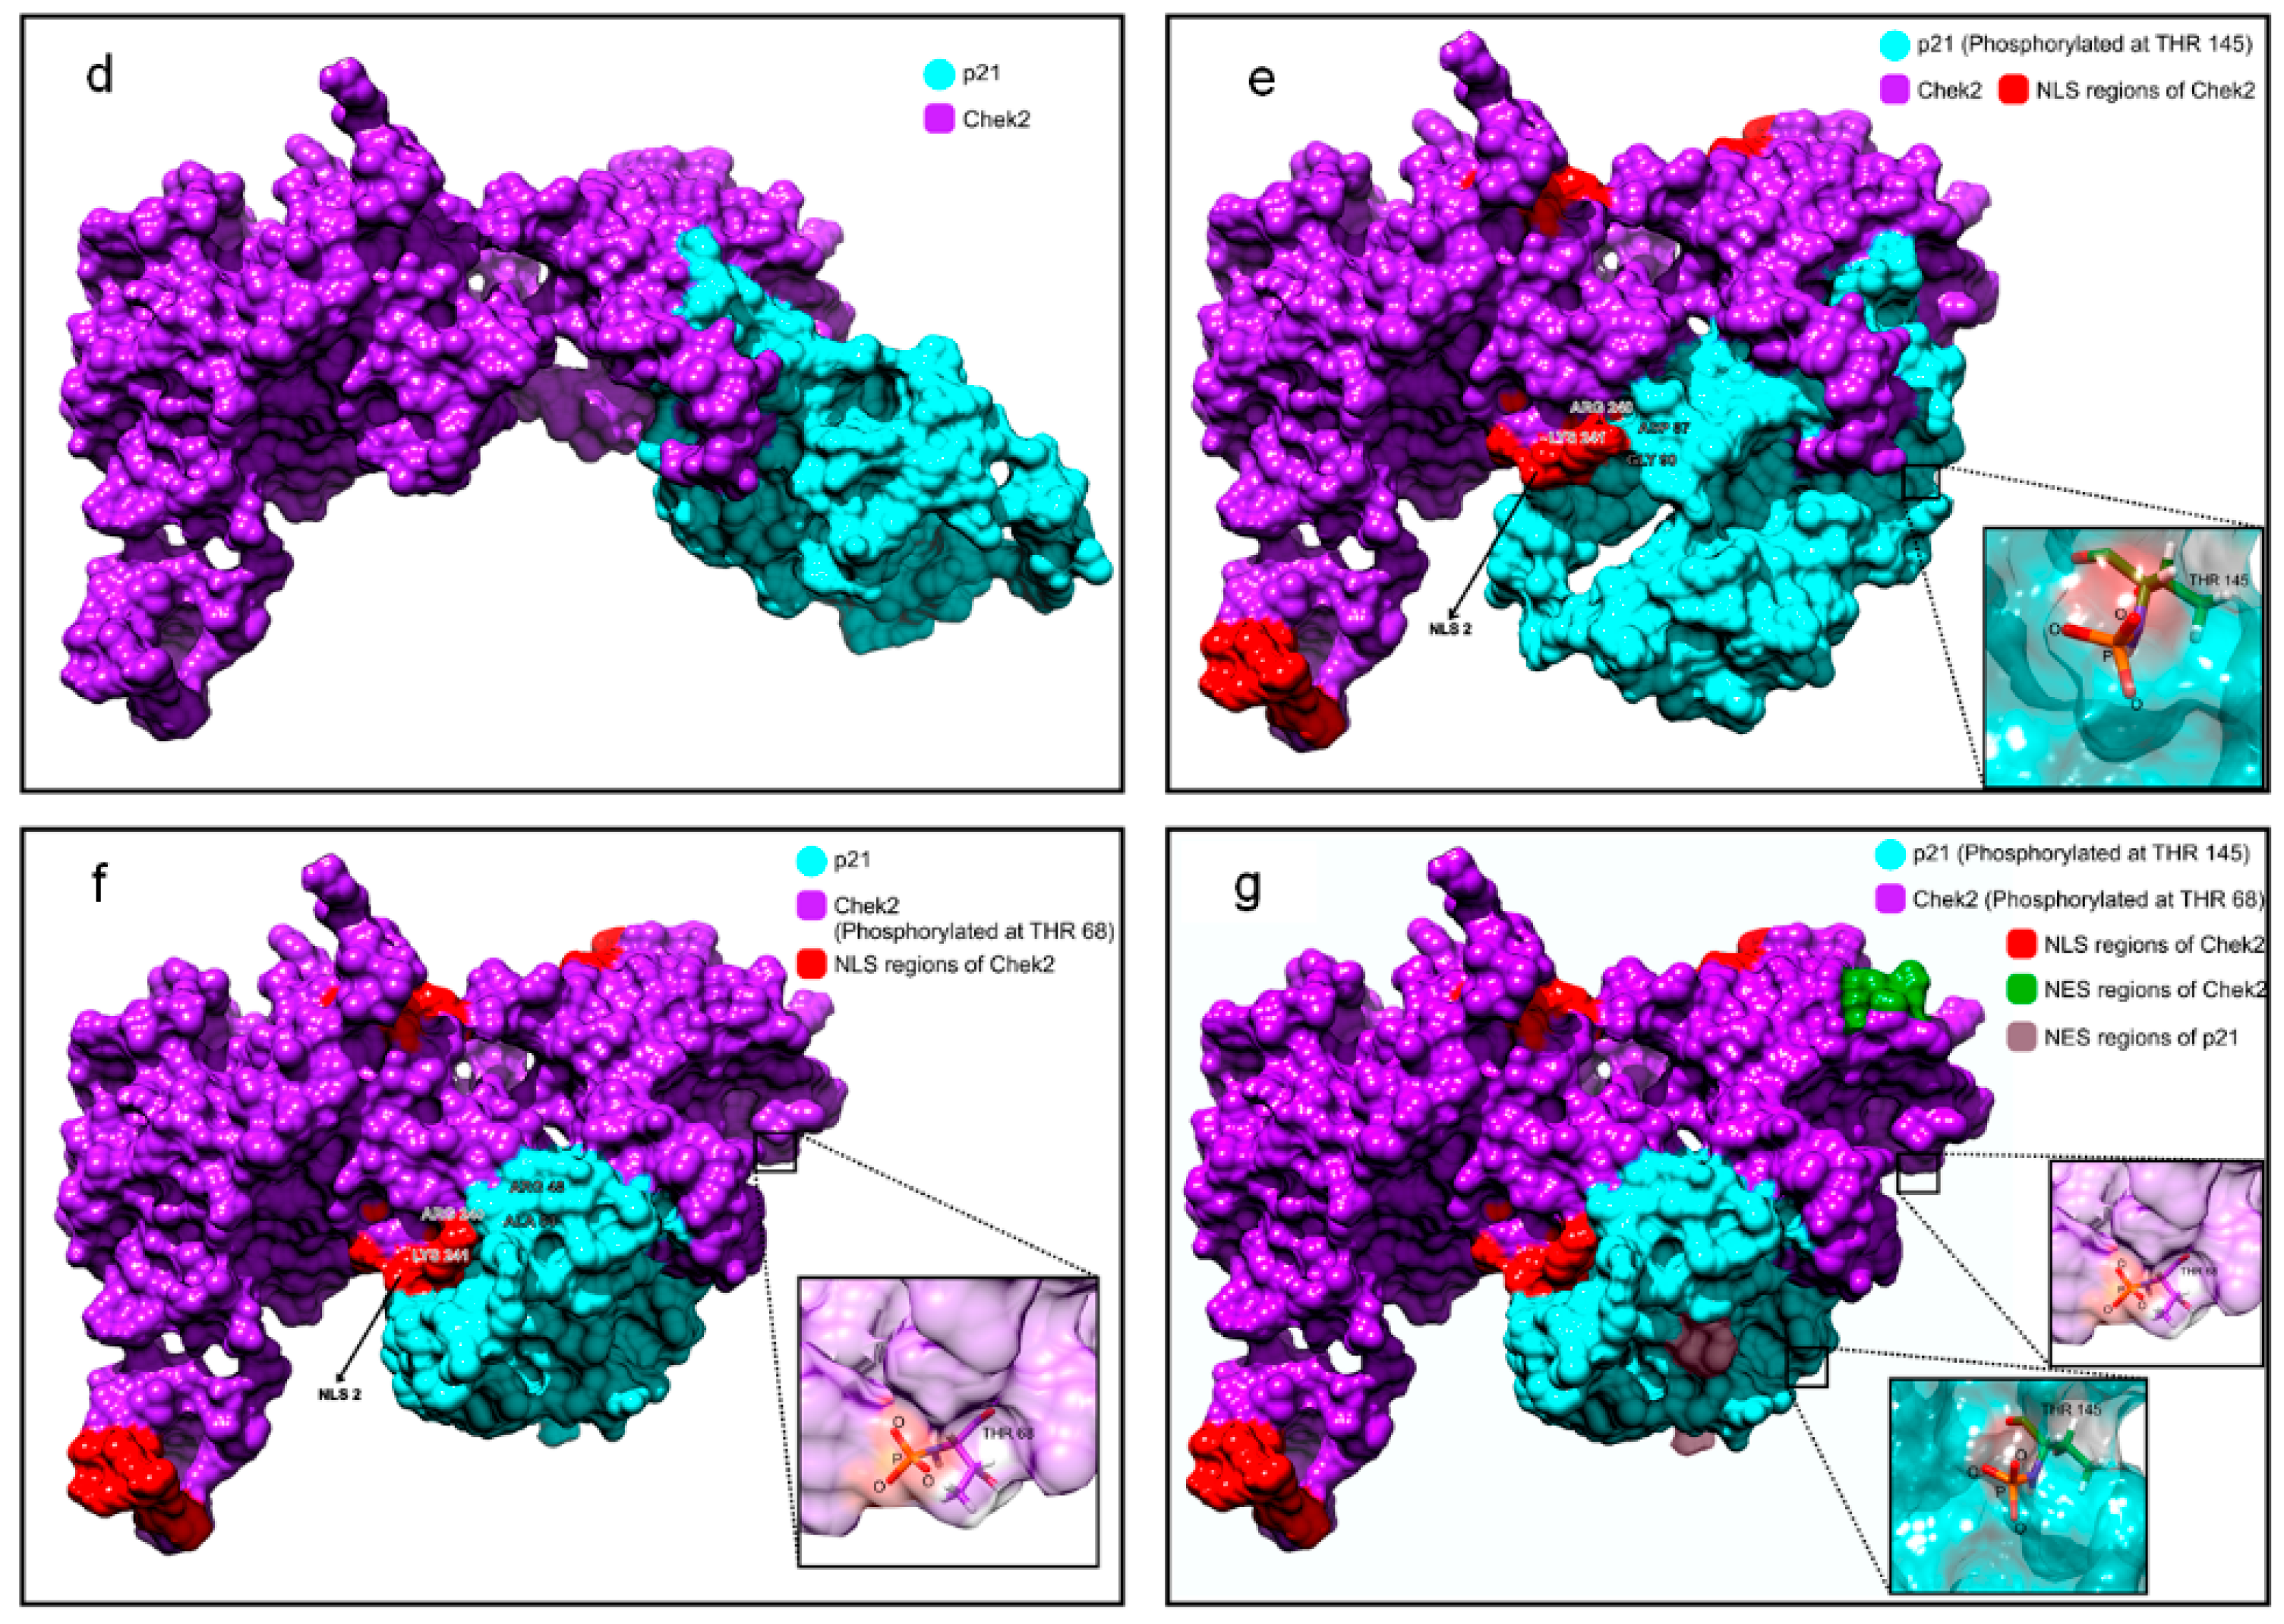
2.5. p21 Interacts with p-Chk2 in 5FU-Resistant Cells
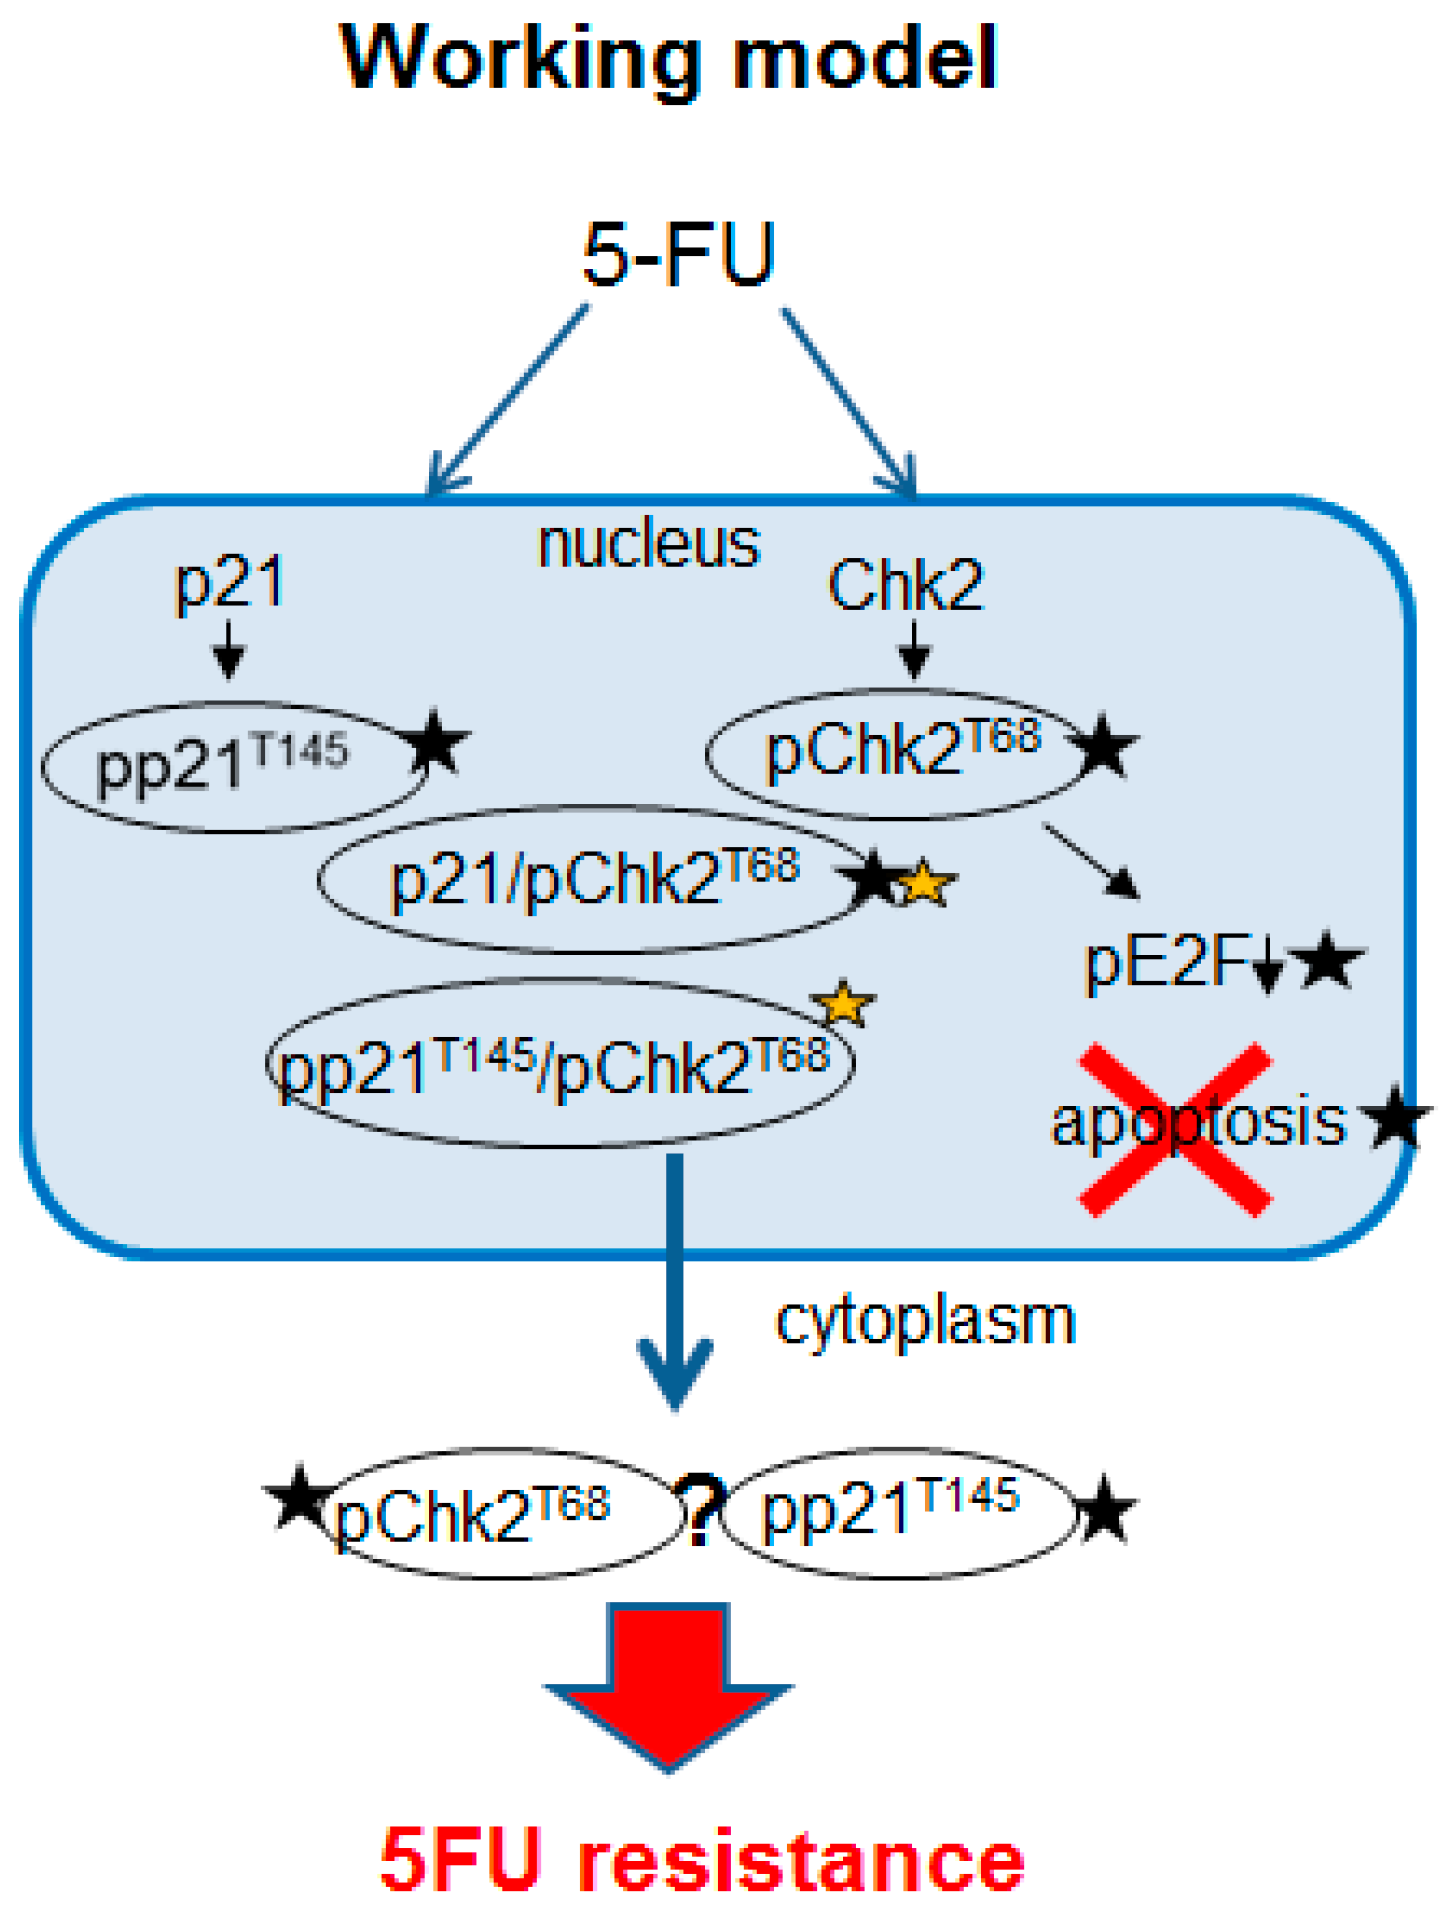
3. Discussion
4. Material and Methods
4.1. Cell Lines
4.2. Cytotoxicity Assay
4.3. Annexin-Propidium Iodide Apoptosis Assay by Flow Cytometry
4.4. Western Blot Analysis
4.5. Immunofluorescence
4.6. Plasmids and Transfection
4.7. Immunoprecipitation
4.8. Human Phospho-Kinase Antibody Array
4.9. Chorioallantoic Membrane Assay (CAM Assay)
4.10. Immunohistochemistry (IHC) Staining Assay
4.11. Proximity Ligation Assay (In Situ PLA)
4.12. Structural Modeling
4.13. Statistics
5. Conclusions
Supplementary Materials
Author Contributions
Funding
Acknowledgments
Conflicts of Interest
References
- Longley, D.B.; Harkin, D.P.; Johnston, P.G. 5-fluorouracil: Mechanisms of action and clinical strategies. Nat. Rev. Cancer 2003, 3, 330–338. [Google Scholar] [CrossRef] [PubMed]
- Efficacy of adjuvant fluorouracil and folinic acid in colon cancer. International Multicentre Pooled Analysis of Colon Cancer Trials (IMPACT) investigators. Lancet 1995, 345, 939–944. [Google Scholar]
- Zhang, N.; Yin, Y.; Xu, S.J.; Chen, W.S. 5-Fluorouracil: Mechanisms of resistance and reversal strategies. Molecules 2008, 13, 1551–1569. [Google Scholar] [CrossRef] [PubMed]
- Abbas, T.; Dutta, A. p21 in cancer: Intricate networks and multiple activities. Nat. Rev. Cancer 2009, 9, 400–414. [Google Scholar] [CrossRef] [PubMed]
- Zhang, S.; Hu, B.; You, Y.; Yang, Z.; Liu, L.; Tang, H.; Bao, W.; Guan, Y.; Shen, X. Sorting nexin 10 acts as a tumor suppressor in tumorigenesis and progression of colorectal cancer through regulating chaperone mediated autophagy degradation of p21(Cip1/WAF1). Cancer Lett. 2018, 419, 116–127. [Google Scholar] [CrossRef] [PubMed]
- Singh, K.; Dong, Q.; TimiriShanmugam, P.S.; Koul, S.; Koul, H.K. Tetrandrine inhibits deregulated cell cycle in pancreatic cancer cells: Differential regulation of p21(Cip1/Waf1), p27(Kip1) and cyclin D1. Cancer Lett. 2018, 425, 164–173. [Google Scholar] [CrossRef] [PubMed]
- Winters, Z.E.; Leek, R.D.; Bradburn, M.J.; Norbury, C.J.; Harris, A.L. Cytoplasmic p21WAF1/CIP1 expression is correlated with HER-2/ neu in breast cancer and is an independent predictor of prognosis. Breast Cancer Res. 2003, 5, R242–R249. [Google Scholar] [CrossRef] [PubMed]
- Perez-Tenorio, G.; Berglund, F.; Esguerra Merca, A.; Nordenskjold, B.; Rutqvist, L.E.; Skoog, L.; Stal, O. Cytoplasmic p21WAF1/CIP1 correlates with Akt activation and poor response to tamoxifen in breast cancer. Int. J. Oncol. 2006, 28, 1031–1042. [Google Scholar] [CrossRef] [PubMed]
- Shiraki, K.; Wagayama, H. Cytoplasmic p21(WAF1/CIP1) expression in human hepatocellular carcinomas. Liver Int. 2006, 26, 1018–1019. [Google Scholar] [CrossRef] [PubMed]
- Cheung, T.H.; Lo, K.W.; Yu, M.M.; Yim, S.F.; Poon, C.S.; Chung, T.K.; Wong, Y.F. Aberrant expression of p21(WAF1/CIP1) and p27(KIP1) in cervical carcinoma. Cancer Lett. 2001, 172, 93–98. [Google Scholar] [CrossRef]
- Ferrandina, G.; Stoler, A.; Fagotti, A.; Fanfani, F.; Sacco, R.; De Pasqua, A.; Mancuso, S.; Scambia, G. p21WAF1/CIP1 protein expression in primary ovarian cancer. Int. J. Oncol. 2000, 17, 1231–1235. [Google Scholar] [CrossRef] [PubMed]
- Shah, M.A.; Kortmansky, J.; Motwani, M.; Drobnjak, M.; Gonen, M.; Yi, S.; Weyerbacher, A.; Cordon-Cardo, C.; Lefkowitz, R.; Brenner, B.; et al. A phase I clinical trial of the sequential combination of irinotecan followed by flavopiridol. Clin. Cancer Res. 2005, 11, 3836–3845. [Google Scholar] [CrossRef] [PubMed]
- Rau, B.; Sturm, I.; Lage, H.; Berger, S.; Schneider, U.; Hauptmann, S.; Wust, P.; Riess, H.; Schlag, P.M.; Dorken, B.; et al. Dynamic expression profile of p21WAF1/CIP1 and Ki-67 predicts survival in rectal carcinoma treated with preoperative radiochemotherapy. J. Clin. Oncol. 2003, 21, 3391–3401. [Google Scholar] [CrossRef] [PubMed]
- Child, E.S.; Mann, D.J. The intricacies of p21 phosphorylation: Protein/protein interactions, subcellular localization and stability. Cell Cycle 2006, 5, 1313–1319. [Google Scholar] [CrossRef] [PubMed]
- Kondo, S.; Barna, B.P.; Kondo, Y.; Tanaka, Y.; Casey, G.; Liu, J.; Morimura, T.; Kaakaji, R.; Peterson, J.W.; Werbel, B.; et al. WAF1/CIP1 increases the susceptibility of p53 non-functional malignant glioma cells to cisplatin-induced apoptosis. Oncogene 1996, 13, 1279–1285. [Google Scholar] [PubMed]
- Lincet, H.; Poulain, L.; Remy, J.S.; Deslandes, E.; Duigou, F.; Gauduchon, P.; Staedel, C. The p21(cip1/waf1) cyclin-dependent kinase inhibitor enhances the cytotoxic effect of cisplatin in human ovarian carcinoma cells. Cancer Lett. 2000, 161, 17–26. [Google Scholar] [CrossRef]
- Helt, C.E.; Rancourt, R.C.; Staversky, R.J.; O’Reilly, M.A. p53-dependent induction of p21(Cip1/WAF1/Sdi1) protects against oxygen-induced toxicity. Toxicol. Sci. 2001, 63, 214–222. [Google Scholar] [CrossRef] [PubMed]
- Zhang, X.; Song, X.; Yin, S.; Zhao, C.; Fan, L.; Hu, H. p21 induction plays a dual role in anti-cancer activity of ursolic acid. Exp. Biol. Med. (Maywood) 2016, 241, 501–508. [Google Scholar] [CrossRef] [PubMed]
- Gorospe, M.; Cirielli, C.; Wang, X.; Seth, P.; Capogrossi, M.C.; Holbrook, N.J. p21(Waf1/Cip1) protects against p53-mediated apoptosis of human melanoma cells. Oncogene 1997, 14, 929–935. [Google Scholar] [CrossRef] [PubMed]
- Asada, M.; Yamada, T.; Ichijo, H.; Delia, D.; Miyazono, K.; Fukumuro, K.; Mizutani, S. Apoptosis inhibitory activity of cytoplasmic p21(Cip1/WAF1) in monocytic differentiation. EMBO J. 1999, 18, 1223–1234. [Google Scholar] [CrossRef] [PubMed]
- Suzuki, A.; Tsutomi, Y.; Miura, M.; Akahane, K. Caspase 3 inactivation to suppress Fas-mediated apoptosis: Identification of binding domain with p21 and ILP and inactivation machinery by p21. Oncogene 1999, 18, 1239–1244. [Google Scholar] [CrossRef] [PubMed]
- Suzuki, A.; Tsutomi, Y.; Akahane, K.; Araki, T.; Miura, M. Resistance to Fas-mediated apoptosis: Activation of caspase 3 is regulated by cell cycle regulator p21WAF1 and IAP gene family ILP. Oncogene 1998, 17, 931–939. [Google Scholar] [CrossRef] [PubMed]
- Xia, X.; Ma, Q.; Li, X.; Ji, T.; Chen, P.; Xu, H.; Li, K.; Fang, Y.; Weng, D.; Weng, Y.; et al. Cytoplasmic p21 is a potential predictor for cisplatin sensitivity in ovarian cancer. BMC Cancer 2011, 11, 399. [Google Scholar] [CrossRef] [PubMed]
- Koster, R.; di Pietro, A.; Timmer-Bosscha, H.; Gibcus, J.H.; van den Berg, A.; Suurmeijer, A.J.; Bischoff, R.; Gietema, J.A.; de Jong, S. Cytoplasmic p21 expression levels determine cisplatin resistance in human testicular cancer. J. Clin. Investig. 2010, 120, 3594–3605. [Google Scholar] [CrossRef] [PubMed] [Green Version]
- Heliez, C.; Baricault, L.; Barboule, N.; Valette, A. Paclitaxel increases p21 synthesis and accumulation of its AKT-phosphorylated form in the cytoplasm of cancer cells. Oncogene 2003, 22, 3260–3268. [Google Scholar] [CrossRef] [PubMed] [Green Version]
- Zhou, B.P.; Liao, Y.; Xia, W.; Spohn, B.; Lee, M.H.; Hung, M.C. Cytoplasmic localization of p21Cip1/WAF1 by Akt-induced phosphorylation in HER-2/neu-overexpressing cells. Nat. Cell Biol. 2001, 3, 245–252. [Google Scholar] [CrossRef] [PubMed]
- Kim, E.J.; Kang, G.J.; Kang, J.I.; Boo, H.J.; Hyun, J.W.; Koh, Y.S.; Chang, W.Y.; Kim, Y.R.; Kwon, J.M.; Maeng, Y.H.; et al. Over-activation of AKT signaling leading to 5-Fluorouracil resistance in SNU-C5/5-FU cells. Oncotarget 2018, 9, 19911–19928. [Google Scholar] [CrossRef] [PubMed]
- Manapov, F.; Muller, P.; Rychly, J. Translocation of p21(Cip1/WAF1) from the nucleus to the cytoplasm correlates with pancreatic myofibroblast to fibroblast cell conversion. Gut 2005, 54, 814–822. [Google Scholar] [CrossRef] [PubMed]
- Gravina, G.L.; Senapedis, W.; McCauley, D.; Baloglu, E.; Shacham, S.; Festuccia, C. Nucleo-cytoplasmic transport as a therapeutic target of cancer. J. Hematol. Oncol. 2014, 7, 85. [Google Scholar] [CrossRef] [PubMed]
- Boulares, A.H.; Yakovlev, A.G.; Ivanova, V.; Stoica, B.A.; Wang, G.; Iyer, S.; Smulson, M. Role of poly(ADP-ribose) polymerase (PARP) cleavage in apoptosis. Caspase 3-resistant PARP mutant increases rates of apoptosis in transfected cells. J. Biol. Chem. 1999, 274, 22932–22940. [Google Scholar] [CrossRef] [PubMed]
- Chaitanya, G.V.; Alexander, J.S.; Babu, P.P. PARP-1 cleavage fragments: Signatures of cell-death proteases in neurodegeneration. Cell Commun. Signal. 2010, 8, 31. [Google Scholar] [CrossRef] [PubMed]
- Zhou, B.B.; Bartek, J. Targeting the checkpoint kinases: Chemosensitization versus chemoprotection. Nat. Rev. Cancer 2004, 4, 216–225. [Google Scholar] [CrossRef] [PubMed]
- Stevens, C.; Smith, L.; La Thangue, N.B. Chk2 activates E2F-1 in response to DNA damage. Nat. Cell Biol. 2003, 5, 401–409. [Google Scholar] [CrossRef] [PubMed]
- Antoni, L.; Sodha, N.; Collins, I.; Garrett, M.D. CHK2 kinase: Cancer susceptibility and cancer therapy—Two sides of the same coin? Nat. Rev. Cancer 2007, 7, 925–936. [Google Scholar] [CrossRef] [PubMed]
- Huang, D.Y.; Chang, Z.F. Interaction of human thymidine kinase 1 with p21(Waf1). Biochem. J. 2001, 356, 829–834. [Google Scholar] [CrossRef] [PubMed]
- Cayrol, C.; Knibiehler, M.; Ducommun, B. p21 binding to PCNA causes G1 and G2 cell cycle arrest in p53-deficient cells. Oncogene 1998, 16, 311–320. [Google Scholar] [CrossRef] [PubMed] [Green Version]
- Chen, W.; Sun, Z.; Wang, X.J.; Jiang, T.; Huang, Z.; Fang, D.; Zhang, D.D. Direct interaction between Nrf2 and p21(Cip1/WAF1) upregulates the Nrf2-mediated antioxidant response. Mol. Cell 2009, 34, 663–673. [Google Scholar] [CrossRef] [PubMed]
- Li, H.; Xie, B.; Rahmeh, A.; Zhou, Y.; Lee, M.Y. Direct interaction of p21 with p50, the small subunit of human DNA polymerase delta. Cell Cycle 2006, 5, 428–436. [Google Scholar] [CrossRef] [PubMed]
- Webb, B.; Sali, A. Comparative Protein Structure Modeling Using MODELLER. Curr. Protoc. Bioinform. 2014, 47, 5.6.1–5.6.32. [Google Scholar] [CrossRef] [PubMed] [Green Version]
- Comeau, S.R.; Gatchell, D.W.; Vajda, S.; Camacho, C.J. ClusPro: A fully automated algorithm for protein-protein docking. Nucleic Acids Res. 2004, 32, W96–W99. [Google Scholar] [CrossRef] [PubMed]
- Pettersen, E.F.; Goddard, T.D.; Huang, C.C.; Couch, G.S.; Greenblatt, D.M.; Meng, E.C.; Ferrin, T.E. UCSF Chimera—A visualization system for exploratory research and analysis. J. Comput. Chem. 2004, 25, 1605–1612. [Google Scholar] [CrossRef] [PubMed]
- Tina, K.G.; Bhadra, R.; Srinivasan, N. PIC: Protein Interactions Calculator. Nucleic Acids Res. 2007, 35, W473–W476. [Google Scholar] [CrossRef] [PubMed]
- Karimian, A.; Ahmadi, Y.; Yousefi, B. Multiple functions of p21 in cell cycle, apoptosis and transcriptional regulation after DNA damage. DNA Repair (Amst) 2016, 42, 63–71. [Google Scholar] [CrossRef] [PubMed]
- Huff, V. Wilms’ tumours: About tumour suppressor genes, an oncogene and a chameleon gene. Nat. Rev. Cancer 2011, 11, 111–121. [Google Scholar] [CrossRef] [PubMed]
- Stepanenko, A.A.; Vassetzky, Y.S.; Kavsan, V.M. Antagonistic functional duality of cancer genes. Gene 2013, 529, 199–207. [Google Scholar] [CrossRef] [PubMed]
- Kreis, N.N.; Louwen, F.; Yuan, J. Less understood issues: p21(Cip1) in mitosis and its therapeutic potential. Oncogene 2015, 34, 1758–1767. [Google Scholar] [CrossRef] [PubMed]
- Vincent, A.J.; Ren, S.; Harris, L.G.; Devine, D.J.; Samant, R.S.; Fodstad, O.; Shevde, L.A. Cytoplasmic translocation of p21 mediates NUPR1-induced chemoresistance: NUPR1 and p21 in chemoresistance. FEBS Lett. 2012, 586, 3429–3434. [Google Scholar] [CrossRef] [PubMed]
- Li, X.L.; Hara, T.; Choi, Y.; Subramanian, M.; Francis, P.; Bilke, S.; Walker, R.L.; Pineda, M.; Zhu, Y.; Yang, Y.; et al. A p21-ZEB1 complex inhibits epithelial-mesenchymal transition through the microRNA 183-96-182 cluster. Mol. Cell Biol. 2014, 34, 533–550. [Google Scholar] [CrossRef] [PubMed]
- Findlay, V.J.; Wang, C.; Watson, D.K.; Camp, E.R. Epithelial to mesenchymal transition and the cancer stem cell phenotype: Insights from cancer biology with therapeutic implications for colorectal cancer. Cancer Gene Ther. 2014, 21, 181–187. [Google Scholar] [CrossRef] [PubMed]
- Romanov, V.S.; Rudolph, K.L. p21 shapes cancer evolution. Nat. Cell Biol. 2016, 18, 722–724. [Google Scholar] [CrossRef] [PubMed]
- Aliouat-Denis, C.M.; Dendouga, N.; Van den Wyngaert, I.; Goehlmann, H.; Steller, U.; van de Weyer, I.; Van Slycken, N.; Andries, L.; Kass, S.; Luyten, W.; et al. p53-independent regulation of p21Waf1/Cip1 expression and senescence by Chk2. Mol. Cancer Res. 2005, 3, 627–634. [Google Scholar] [CrossRef] [PubMed]
- Dai, B.; Zhao, X.F.; Mazan-Mamczarz, K.; Hagner, P.; Corl, S.; Bahassi el, M.; Lu, S.; Stambrook, P.J.; Shapiro, P.; Gartenhaus, R.B. Functional and molecular interactions between ERK and CHK2 in diffuse large B-cell lymphoma. Nat. Commun. 2011, 2, 402. [Google Scholar] [CrossRef] [PubMed]
- Ninsontia, C.; Phiboonchaiyanan, P.P.; Chanvorachote, P. Zinc induces epithelial to mesenchymal transition in human lung cancer H460 cells via superoxide anion-dependent mechanism. Cancer Cell Int. 2016, 16, 48. [Google Scholar] [CrossRef] [PubMed]
- Feoktistova, M.; Geserick, P.; Leverkus, M. Crystal Violet Assay for Determining Viability of Cultured Cells. Cold Spring Harb. Protoc. 2016, 2016, pdb.prot087379. [Google Scholar] [CrossRef] [PubMed]
- El-Baba, C.; Mahadevan, V.; Fahlbusch, F.B.; Mohan, S.S.; Rau, T.T.; Gali-Muhtasib, H.; Schneider-Stock, R. Thymoquinone-induced conformational changes of PAK1 interrupt prosurvival MEK-ERK signaling in colorectal cancer. Mol. Cancer 2014, 13, 201. [Google Scholar] [CrossRef] [PubMed]
- Klockenbusch, C.; Kast, J. Optimization of formaldehyde cross-linking for protein interaction analysis of non-tagged integrin beta1. J. Biomed. Biotechnol. 2010, 2010, 927585. [Google Scholar] [CrossRef] [PubMed]
- Yang, J.; Yan, R.; Roy, A.; Xu, D.; Poisson, J.; Zhang, Y. The I-TASSER Suite: Protein structure and function prediction. Nat. Methods 2015, 12, 7–8. [Google Scholar] [CrossRef] [PubMed]


© 2018 by the authors. Licensee MDPI, Basel, Switzerland. This article is an open access article distributed under the terms and conditions of the Creative Commons Attribution (CC BY) license (http://creativecommons.org/licenses/by/4.0/).
Share and Cite
Maiuthed, A.; Ninsontia, C.; Erlenbach-Wuensch, K.; Ndreshkjana, B.; Muenzner, J.K.; Caliskan, A.; Ahmed P., H.; Chaotham, C.; Hartmann, A.; Vial Roehe, A.; et al. Cytoplasmic p21 Mediates 5-Fluorouracil Resistance by Inhibiting Pro-Apoptotic Chk2. Cancers 2018, 10, 373. https://doi.org/10.3390/cancers10100373
Maiuthed A, Ninsontia C, Erlenbach-Wuensch K, Ndreshkjana B, Muenzner JK, Caliskan A, Ahmed P. H, Chaotham C, Hartmann A, Vial Roehe A, et al. Cytoplasmic p21 Mediates 5-Fluorouracil Resistance by Inhibiting Pro-Apoptotic Chk2. Cancers. 2018; 10(10):373. https://doi.org/10.3390/cancers10100373
Chicago/Turabian StyleMaiuthed, Arnatchai, Chuanpit Ninsontia, Katharina Erlenbach-Wuensch, Benardina Ndreshkjana, Julienne K. Muenzner, Aylin Caliskan, Husayn Ahmed P., Chatchai Chaotham, Arndt Hartmann, Adriana Vial Roehe, and et al. 2018. "Cytoplasmic p21 Mediates 5-Fluorouracil Resistance by Inhibiting Pro-Apoptotic Chk2" Cancers 10, no. 10: 373. https://doi.org/10.3390/cancers10100373