Next Article in Journal
Manipulation of Self-Assembled Microparticle Chains by Electroosmotic Flow Assisted Electrorotation in an Optoelectronic Device
Next Article in Special Issue
Ultrafast Laser Engraving Method to Fabricate Gravure Plate for Printed Metal-Mesh Touch Panel
Previous Article in Journal
Magnetic Actuation Based Motion Control for Microrobots: An Overview
Previous Article in Special Issue
Experimental and Numerical Simulation Research on Micro-Gears Fabrication by Laser Shock Punching Process
 
 
Correction published on 2 April 2018, see Micromachines 2018, 9(4), 164.
Article

A Monolithic Micro-Tensile Tester for Investigating Silicon Dioxide Polymorph Micromechanics, Fabricated and Operated Using a Femtosecond Laser

by
Christos-Edward Athanasiou
* and
Yves Bellouard
Galatea lab, STI/IMT, Ecole Fédérale Polytechnique de Lausanne (EPFL), Rue de la Maladière, 71b, Neuchâtel CH-2002, Switzerland
*
Author to whom correspondence should be addressed.
Micromachines 2015, 6(9), 1365-1386; https://doi.org/10.3390/mi6091365
Submission received: 9 August 2015 / Revised: 7 September 2015 / Accepted: 10 September 2015 / Published: 21 September 2015
(This article belongs to the Special Issue Laser Micromachining and Microfabrication)

Abstract

:
Mechanical testing of materials at the microscales is challenging. It requires delicate procedures not only for producing and handling the specimen to be tested, but also for applying an accurate and controlled force. This endeavor is even more challenging when it comes to investigating the behavior of brittle materials such as glass. Here, we present a microtensile tester for investigating silica glass polymorphs. The instrument is entirely made of silica and for which the same femtosecond laser is not only used for fabricating the device, but also for operating it (loading the specimen) as well as for performing in situ measurements. As a proof-of-concept, we present a stress-strain curve of fused silica for unprecedented high tensile stress of 2.4 GPa, as well as preliminary results of the elastic modulus of femtosecond laser-affected zones of fused silica, providing new insights on their microstructures and mechanical behavior.

Graphical Abstract

1. Introduction

Materials in small structures such as nanowires or thin films show mechanical properties different than those measured in their bulk counterparts [1,2]. Illustrative examples are gold thin films that undergo a dramatic increase of yield strengths at submicron scales [3]. Investigating how mechanical properties evolve while scaling down objects is therefore essential for designing robust microsystems and requires adapted experimental tools and procedures.
The main challenge is to apply a controlled stress-state in a reproducible manner and, thus, without damaging the specimens under test, while yet generating measurable displacements with high resolution and accuracy [4,5]. Various techniques have been proposed so far. The bulge test [6,7], nano-indentation [8,9,10], and the microscale tensile testing [11,12,13,14] are among the most established ones, while others such as the dynamic (resonant) test [15,16,17], the M-test [18], and the application of Raman microscopy for stress/strain measurement at the micro/nano scale [19,20] are more specialized, with limited applications.
The bulge test uses curvature measurement of a thin film membrane. While this technique can be used to determine stress in the film, the measured properties are influenced by interfacial effects that limit the stress level that can be reached. The manipulation and fabrication of thin membranes can be particularly difficult.
Nanoindentation on the other hand, measures the hardness of a material by applying a microindenter into a substrate with a controlled displacement and measured force. The test can be performed on virtually any kind of substrate. However, this technique suffers from a lack of direct link between the measured hardness and the uniaxial mechanical characteristics due to a limited knowledge of the deformation field under the indenter [21]. Additional effects have to be carefully considered such as pile-up and sinking-in (the upward extrusion of displaced material so as to form a raised crater is known as pile-up while the tendency of the material to be depressed around the indentation is known as sinking-in behavior [22]), as well as the influence of surface roughness.
Micro-tensile testing of freestanding materials finally is a natural extension of the classical macroscale tensile tester and produces direct material’s stress-strain uniaxial characteristic. Various micro-tensile testers have been proposed [11,12,13,14]. There, the main difficulty—besides the instrument design itself, is the test specimen preparation and manipulation. Micro-tensile testers are designed for specific kind of materials. To date, despite the importance of silica glass in various technological fields such as optics, electronics and chemistry [23,24,25,26], such a tool is missing for investigating the micromechanical behavior of these materials.
Fused silica, the glassy phase of SiO2, fractures according to the weakest-link model [27,28]. Surface flaws act as stress concentrators where nucleation of cracks can take place. Its breaking strength is, therefore, dictated by the presence of surface flaws rather than by the intrinsic strength of the Si–O bond (which has a particularly high strength, estimated in the order of 21 GPa [29]). At the nano-scale, silica glass is found to exhibit unconventional behavior such as “pseudoductility” [30]. Molecular dynamics simulations suggest that a fracture in silica glass proceeds through the growth and coalescence of nanoscale cavities [31,32]. Custers [33] in 1949 and more recently, Celarie et al. [34] and Bellouard [35] experimentally verified the existence of nanoductile mode and plastic flow. Despite these works, the mechanical behavior of SiO2 at microscales remains largely unexplored, due to the inherent experimental difficulties associated with it.
In this paper, we present a monolithic tensile tester for investigating the micro-mechanics of silicon dioxide polymorphs. The device is fabricated and fully operated by a femtosecond laser. This measurement method allows the material’s testing without mechanical interactions as well as further miniaturization of the test specimens, ultimately down to the nanoscale.
In the first part of the paper, we give an overview of the device and focus on the working principle of the flexure-based tensile tester. In the second part, the physical mechanisms that enable the same femtosecond laser to apply a given stress on the structure are discussed. Finally, as a demonstration, the measured stress–strain curve of a micron-scale fused silica test structure is presented up to unprecedented high tensile stress of 2.4 GPa.

2. Microtensile Tester Design and Working Principle

2.1. Working Principle

The instrument consists of a monolithic mechanism (shown in Figure 1a,b) that includes a load cell (Part A in Figure 1a), the test beam (number (#)3 in Part A), and an amplification stage (Part B) to measure the deformation of the test beam.
Figure 1. (a) Monolithic micro-tensile tester seen through an optical microscope. The overall dimensions of the system are 15 mm × 15 mm. Part A is the loading cell and part B is the displacement amplification sensor. The test beam (#3 in part A) is also shown magnified in the inset. (b) Graphical representation of the micro-tensile tester. Note that the dimensions of the device used here are not the real ones, but were chosen for a clearer understanding of the device’s operation. (c) Photoelasticity image of the test beam. (d) Magnified view of the system’s displaced lever beam.
Micromachines 06 01365 g001
The device is fabricated using a two-step femtosecond laser-based process described in detail elsewhere [36,37]. The silica substrate is first exposed to low-energy femtosecond laser pulses. As a result, the material structure is locally modified, resulting in an accelerated etching rate in laser-exposed regions [38]. The follow-up etching step is performed in a low concentration hydrofluoric HF bath (2.5%). This process has the capability of producing three-dimensional devices with aspect ratio typically of 1:100 [39,40], or even higher when using KOH etchant [41].
In another paper [42], we have demonstrated that laser-affected zones in silica exhibit a net volume expansion. We use this principle to expand the lateral bars in a controlled manner by juxtaposing laser-affected zones consisting of lines written across the volume. To mechanically load the specimen, we re-expose the two transverse bars (part 1 and 2 in Figure 1a) to the same femtosecond laser. Figure 2 further illustrates the loading process. We call these laser-affected structures, “stressors”. The modeling of this loading process is discussed in a separate section.
To measure the beam elongation resulting from the stress load (typically a tenth, to a few % of the beam length), the displacement is mechanically amplified using a two-stage flexure-based lever mechanism (part B in Figure 1a) connected in parallel to the main load cell. When a load is applied, the load cell induces a mechanical moment on the flexure that rotates, causing an amplified displacement of the lever. The kinematics and working principle of this amplification mechanism are further discussed in the next paragraphs.
Finally, with the use of the same laser, yet at much lower pulse energy, so that no further modification is made to the material, we measure the displacement of the lever amplification beam (Figure 1d) using the third harmonic optical signal generated while scanning the beam across the specimen’s surface [43,44,45,46,47,48,49].
Figure 2. Illustration of the loading cell’s working principle. The two loading bars (red areas) expand during femtosecond laser exposure resulting in the loading of the middle (blue) test beam.
Micromachines 06 01365 g002

2.2. Test Beam Dimensioning

In this section, we evaluate the stress in the test beam as a function the number of laser-written lines defining the volume expansion of the load cell. Let ALB, ATB be the cross-sections of the laser-exposed beams (“LB”) and the test beam (“TB”), respectively, and likewise, σLB and σTB the corresponding stresses in both beams. The stress in the test beam is simply expressed as:
σ LB σ TB = A TB A LB  and  σ LB = E LB ε LB σ TB = E TB n ε LB ( A TB A LB )
where εLB is the strain induced by the volume variation induced to the laser-affected beams, ETB is the elastic modulus of fused silica, ELB is the elastic modulus of the composite material formed in the fused silica matrix following laser-exposure, and n is the number of stressors induced in the system.

2.3. Loading Cell

Laser-affected zones consisting of unit lines induce an overall expansion of the lateral bars shown in Figure 2a. The volume exposed to the laser is inhomogeneous and consists of a composite structure of modified and unmodified zones. Note that single laser-affected zones, for the energy level considered here (i.e., for the pulse duration used in these experiments [50]), consist of an arrangement of periodic nanoplanes [51]. Here, we examine a simple stiffness model to predict the behavior of the ensemble, and in particular, the behavior when individual planes are written one after another.
As a first approximation, we model the sidebars under loading as a spring arranged in parallel with the elongated laser-affected zone as shown in Figure 3b. We express k2 as the stiffness of the laser-affected volume and k1 as the stiffness of the non-affected sidebars.
This model is a simplification since it does not take into account interfacial energy between the various domains (laser affected, pristine, etc.). Nevertheless, it provides a first insight—reasonably accurate—of the mechanical behavior of the ensemble.
If n is the number of stressors machined in the system, the total stiffness variation is simply the addition of the two parallel stiffnesses (as shown in Figure 3b) of the springs k1 and k2 and is given by the following equation:
Stiffness = E SiO 2 a 1 b 1 a 0 b 0 n t + E Laser Affected Zone a 0 b 0 ( n 1 ) t
In this model, we make the following assumptions:
(1) The laser-written structures are treated as “homogenized”; in other words, we neglect fine structures like nanogratings [51], but consider it as a homogeneous material, albeit of lower density than the pristine material.
(2) The shear stress that is transferred from the laser-affected zone to the pristine fused silica is considered low and negligible. It is analytically calculated using a shear-lag model [52,53,54] further described in the appendix. The maximum corresponding principle stress transferred to the laser-unaffected sidebars via the development of shear stresses at the interface of the laser-affected and laser unaffected zones occurs when z = l equals to:
σ z ( z ) = E SiO 2 ε applied sin h ( l k )
where:
k = E SiO 2 W p 2 μ SiO 2
Here μ SiO 2 is the shear modulus of fused silica. The length and width of the pristine region are denoted by l and WP respectively (Figure 3d). For εapplied = 1 μm, WP = 10 μm, we find that the corresponding shear stress transferred from pristine material to the laser affected zone is σz = 24 MPa. This value is rather low and justifies the assumption considered in the first place.
Figure 3. (a) 2D visualization of the loading process during the writing of the stressors. The mechanical energy that develops due to the localized material expansion, results in the principal loading of the sidebars. (b) Simplified spring model of the loading process. (c) Parameters used to describe a single stressor. (d) Close-up view of the stress development due to shear stress taking place at the interface of the laser-affected and laser-unaffected zones. According to the shear-lag model developed in [52,53,54]: the displacement of the pristine material u0(z) is known; the unknown displacement of the laser-affected zones is denoted by u(z). The corresponding shear strain in the laser-affected zone is [u(z) − u0(z)]/WP.
Micromachines 06 01365 g003

2.4. Lever Amplification Mechanism

The displacements induced in the system are particularly small (a few tens of nanometers) to be detected accurately with common microscopy tools. To measure the deformation resulting from the elongation of the test beam, we use a two-stage in-plane motion amplification mechanism. The mechanism is itself composed of a slider-crank kinematic to convert the linear motion into a rotational one around a pivot point defined by a four-bar mechanism, defining a remote center of rotation. The lever amplification kinematics is illustrated using pivot joints (Figure 4a). A lever pivots around a point (point C1 in Figure 4a) anchored to a fixed body. Two bars (bars 1 and 2 in Figure 4b) fixed at their one end (from the kinematics point of view each bar is equivalent with two pivots) form a hinge, which is used to interface the linear motion of the actuator with the angular motion of the pivot. The loading cell (illustrated as a dashpot in Figure 4a) forming the input of the mechanism is attached at one end while the output of the mechanism is at the other end of the lever (part B in Figure 1a and magnified in Figure 1d). The second stage of the amplification acts exactly like the first one, scaling up the input linear motion even more. The amplification level for small angles θ of the end-effector bar (Figure 4a) is simply the ratio of the output displacement of the mechanism and the input displacement induced in the system.
Figure 4. (a) Kinematics of the displacement amplification mechanism. The circles represent one-degree-of-freedom rotation pivot joints. The bars represent rigid links. The dash lines indicate the kinematics being operated. The end-effector is body B. (b) Scanning electron microscope view of part of the displacement amplification sensor fabricated using femtosecond laser machining and chemical etching
Micromachines 06 01365 g004
To achieve the high-precision requirements and achieve a monolithic design, the kinematics is implemented using flexures. Flexures are commonly used in precision engineering to approximate kinematics using elastic elements since at least the 1920s (see for instance the work from Sears [55]). Modern treatises are numerous and the reader interested in the topic can refer to [56,57,58,59].

2.5. Mechanical Guidance

A mechanical guidance is needed to obtain uniform loading conditions on the test beam. Here, we implement it with four leaf springs of equal length (#6 in Figure 1a), attached on one side to the rigid element of the loading cell and to a fixed reference on their other end (as shown in Figure 5a). This construction allows for a rectilinear movement of the loading cell, albeit with a non-linear stiffness (Figure 5b). The force-displacement relationship of this system is given by [59]:
F 6 w t E s i o 2 δ 4 3 δ l 3 6   w l 3   c o t h 3 2 ( δ w )
where δ is the displacement of the loading cell from its initial position, w the width, l the length of and t the thickness of the guiding flexures. A double-compound flexure could also be used to achieve rectilinear motion with a linear stiffness, but at the expense of occupying more real estate on the substrate and adding more complexity. The over guided-one used here, is a compromise between linearity versus volume required. Although this guiding mechanism is not linear, here it is essentially used in its quasi-linear regime (Figure 5b), since the displacements are extremely small.
Figure 5. (a) Mechanical guidance principle of the loading cell. (b) The characteristic force-deformation curve of the guidance which consists of four parallel leaf-springs is shown here. The parameters (w = 100 μm, l = 5000 μm and t = 230 μm) chosen for this graph correspond to the parameters of the fabricated device. Here, the guidance is used in its quasi-linear regime.
Micromachines 06 01365 g005

3. Experimental Results

3.1. Manufacturing

Our experimental setup consists of a femtosecond laser, positioning stages and a 250 μm thick silica substrate (synthetic silica with high OH content). The laser (Amplitude Systèmes, Bordeaux, France) emits 275 fs-pulses at 1030 nm from an Yb-fiber amplifier operating at 800 kHz. The laser beam is focused using a 20× objective (OFR-20X-1054, Thorlabs, NJ, USA) with a numerical aperture (NA) of 0.40. The linear positioning stages, on which the specimen is mounted, provide three degrees of freedom with a resolution of 0.1 μm and a repeatability of 0.2 μm at the used operated speeds.
For the fabrication of the device, a scanning speed of 12 mm/s with pulse energy of 250 nJ is used. The complete exposure step took approximately two hours. After laser exposure, the device is etched for twenty four hours in HF.
The re-exposure of the specimen to induce the desired volume variation is implemented by scanning adjacent lines with a writing speed of 10 mm/s and with energy per pulse of 220 nJ. The re-exposure step requires approximately eight hours.
For the device fabrication circular polarization is used while for the re-exposure step linear polarization perpendicular to the scanning directions is applied (so that the highest possible volume variation for the given pulse energy is induced [42]).
It should be noted that the process was not optimized for speed, and the manufacturing time could be significantly reduced (by an order of magnitude), for instance, by using higher writing speeds and/or repetition rates.

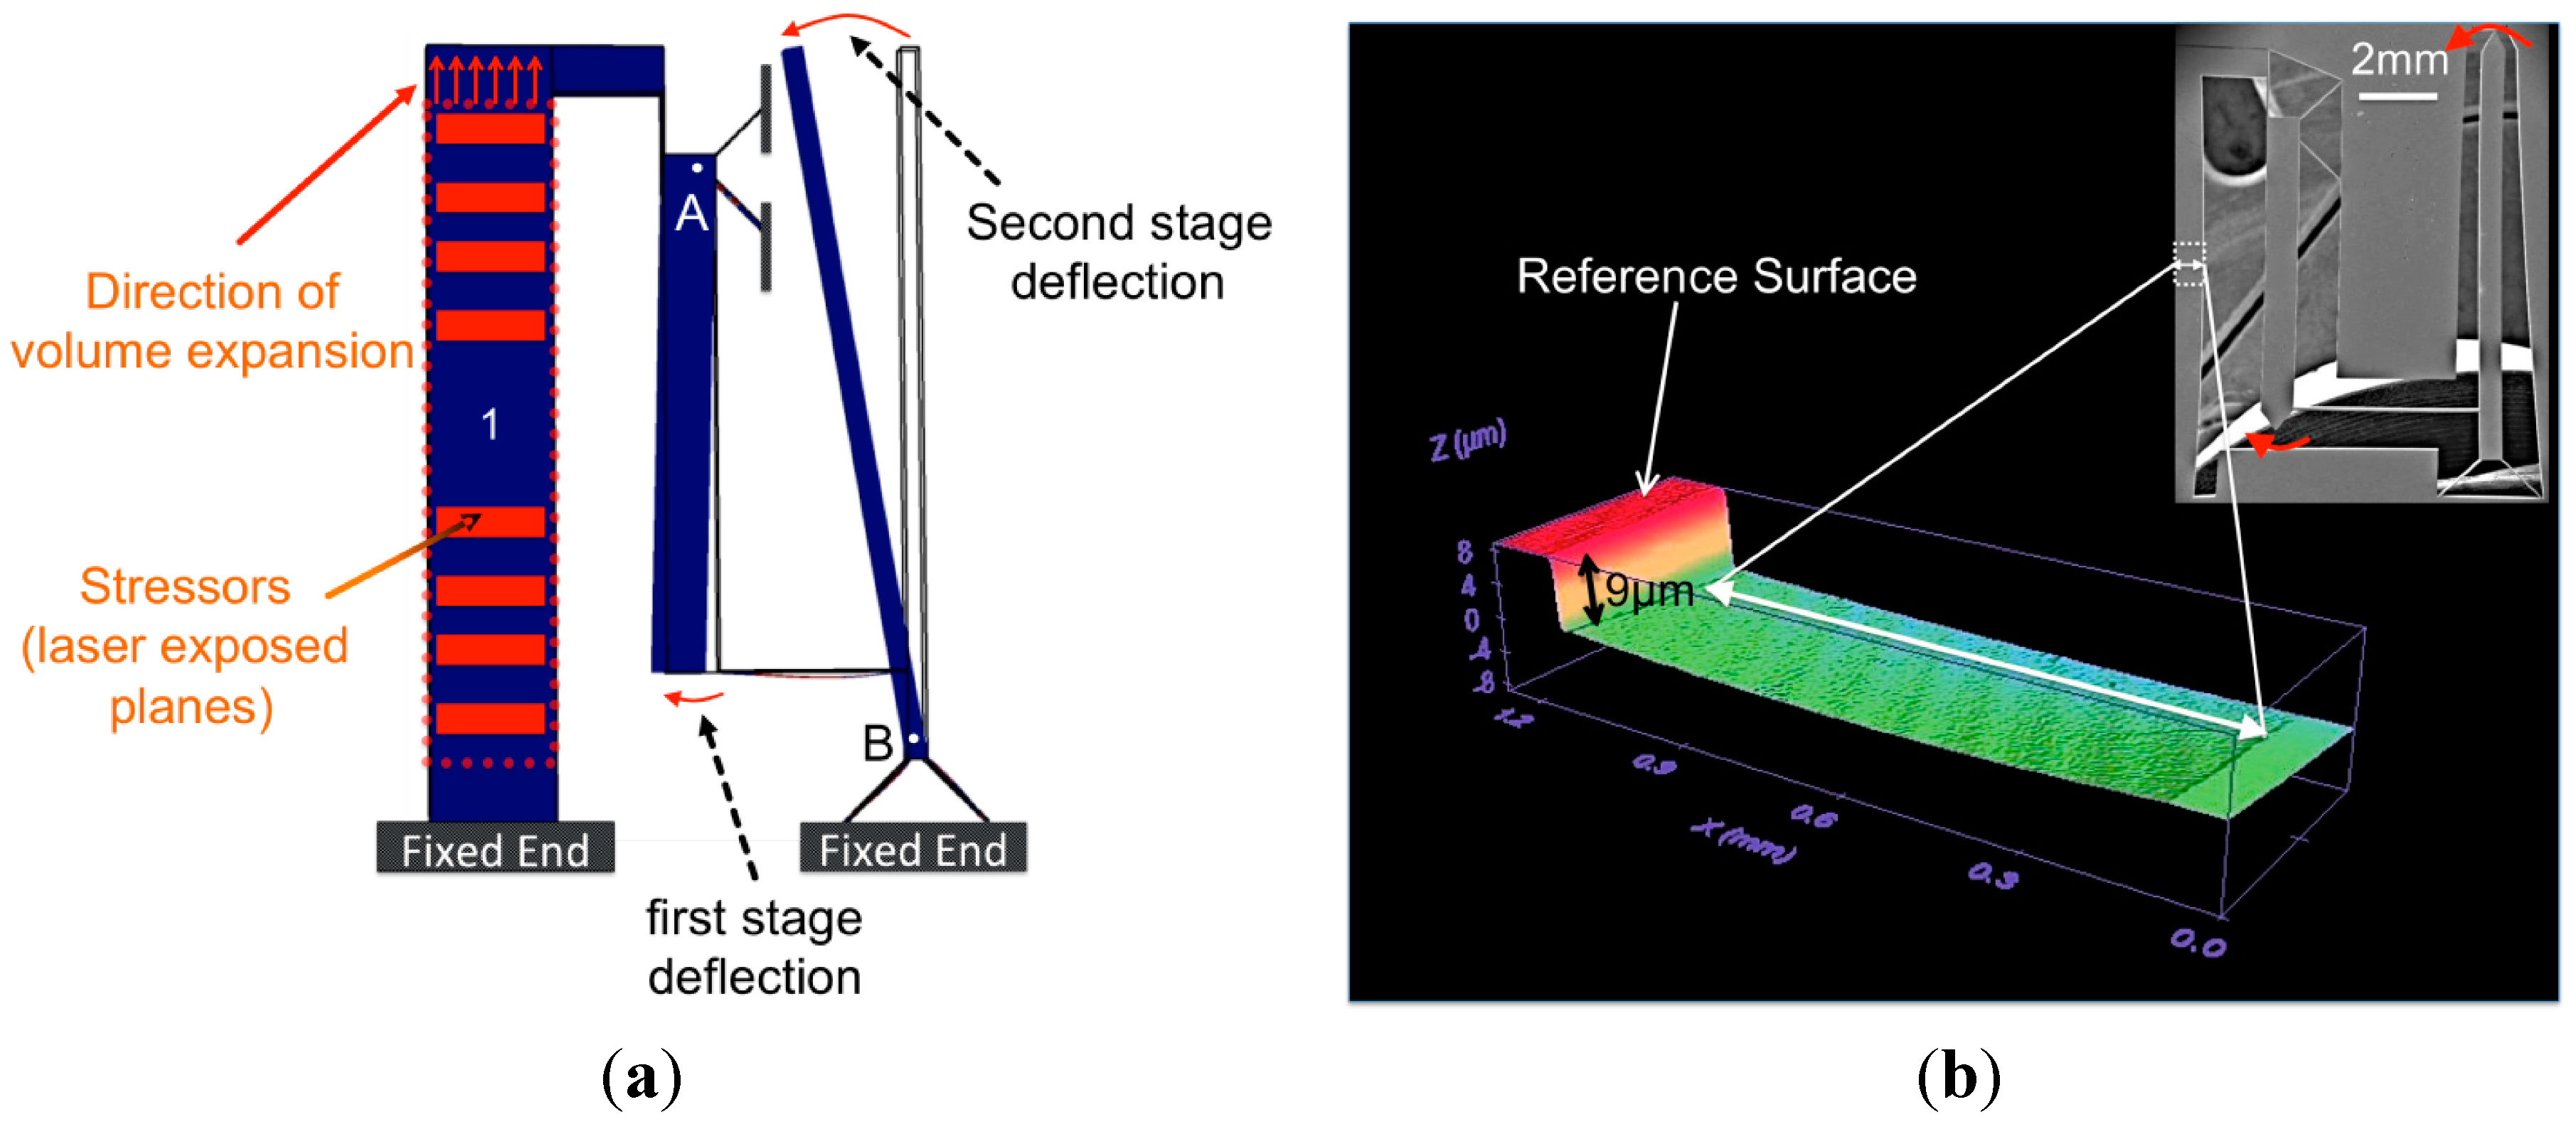
3.2. Stressors Model Validation and Optimization

The same mechanism used for the amplification of the strain in the tensile tester is also used for the quantitative evaluation of the stressors model. This time, the mechanism is not attached to the load cell but to bar 1 (Figure 6a). Upon the writing of stressors, the response of the mechanism is studied. From this response, the volume variation induced in the system can be evaluated.
Figure 6. (a) A finite element analysis of the deformed system is illustrated. The same mechanism used for the amplification of the strain in the tensile tester is also used stand-alone (attached only to bulk fused silica-bar 1) for the quantitative evaluation of the stressors model. The red boxes in bar 1 represent the machined stressors. (b) Using white light interferometry for measuring the profile of the deformed device, a significant volume variation was found and attributed to out-of-plane motion.
Micromachines 06 01365 g006
As illustrated in Figure 6b, we observed an out-of-plane motion of the system. The profile of the moving bar (bar 1 in Figure 6a) revealed that 60% of the induced volume variation in the system was allocated to undesired out-of-plane displacement. As illustrated in Figure 7, by correcting the experimental data for the out-of-plane factor, we find that the measured volume variation and the one predicted by the analytical model (described in Section 2.3) matches rather well for lower estimated values of the elastic modulus of laser affected zones. This observation is consistent with the existence of less dense material in laser-affected zones formed of nanogratings [51]. Indeed, Canning et al. reported on the presence of a porous structure [60,61] and Bricchi et al. on the existence of form birefringence due to a periodic modulation of the refractive index and in particular the presence of a lower refractive index in the nanoplanes [62]. The porous material supports a lower refractive index (itself consistent with a lower density material) and, in turn, a possible significant decrease of elastic modulus.
The elastic properties of porous materials can be predicted by the empirical relationship of Phani and Nuyogi [63]:
E porous = E 0 ( 1 p p c ) f
where Eporous is the effective elastic modulus of the porous material with porosity p, E0 is the elastic modulus of solid material, pc is the porosity at which the effective elastic modulus becomes zero and f is the parameter dependent on the pore geometry [63]. From the images by the work of Canning et al. [60], the pores in the laser-affected zones are of complex shapes and interconnected. Based on these images, we estimate the porosity of the zones to range between 0.4 and 0.5. The value of the characteristic exponent f is for almost all the investigated materials in the range of 1.10–1.70 [64]. Porous materials with high concentration in surface heterogeneities and cracks have a low value of this parameter. Here, as an example we will use a conservative value (f = 1.20). Finally, as noted by Wagh et al. [65] fittings of experimental data for different materials often give pc = 1 and this is the value we adopt for this example.
Indeed, as indicated in Table 1, the values found for the different cases of porosity validate the above discussion of the decreased elastic modulus of the laser-affected zones.
Figure 7. Analytical model for different values of elastic modulus for the laser-affected zones and experimental data of the induced volume variation in the device. The experimental data were corrected with the measured factor of out-of-plane motion displacement of the device.
Micromachines 06 01365 g007
Table 1. Estimation of the laser-affected zones elastic modulus of the using the Phani-Nuyogi empirical relationship [63].
Elastic Modulus of Laser-Affected Zones for Different Porosity ParametersEporous (GPa)
p = 0.4041.1
p = 0.4537.8
p = 0.5034.0
To investigate the origin of the out-of-plane motion upon laser machining in bulk fused silica, we use a method based on the deflection of micro-cantilevers [66]. The working principle is outlined in Figure 8. A cantilever, entirely made out of fused silica, is exposed locally to a laser beam, but only close to its anchoring point, and only in the upper part (just below the surface, so that the surface remains continuous and unaffected). In the cantilever portion exposed to the laser beam, the modified zones and the unaffected layers form a bimorph composite structure.
When a volume expansion occurs in the laser-affected zone, the bimorph element will bend down. Essentially, the bimorph zone forms a hinge. The cantilever arm amplifies any resulting displacement providing a simple and efficient method for increasing the variation’s measurement range and achieving high-resolution measurement of laser-induced volume changes. The two different loading cases studied are targeting the quantitative evaluation of the induced volume variation in the upper and the bottom part of the stressors in the bulk of the material.
The value of the strain is different for the two cases, as illustrated in Table 2. The net volume variation induced by lines written at the bottom of the stressors is lower than the one induced by the one written at the top of the stressors, inducing a net bending moment.
Figure 8. (a) Method for measuring laser-induced volume variation in fused silica using cantilever deflection. The laser exposure takes place only near the anchoring point of the cantilever and only in its upper-half thickness and forms a bimorph composite structure that induces local bending of the cantilever. The deflection measured at the tip of the cantilever is effectively amplified by the length of the cantilever. The two different configurations result to different absolute values of induced volume variations, due to the spherical aberration effect. (b) A sketch map of focusing across a plane surface from air into the sample. O1 is the crossing point of the light axis across the interface, F0 is the geometrical focus in air, F1 is the focus under the paraxial approximation, fd = |O1F1| = n|O1F0| is the focusing depth, F3 is the focus of the marginal rays, and Δ = |F1F3| is the foci range (focal displacement).
Micromachines 06 01365 g008
Table 2. Volume variation measured using the microcantilevers bending method. Three cantilevers were measured.
For Given Exposure Conditions (NA), Pulse Energy + Writing SpeedTip Deflection (μm)Mean Value of the Volume Variation %
Loading case 142.041.542.00.0011
Loading case 253.052.553.00.0009
The difference in volume variation observed between the two loading cases is attributed to a dispersion of the focus due to spherical aberration effects. In particular, as demonstrated in [67], the nonlinear interaction zone extends as the foci range Δ (Figure 8b) depends linearly on the focusing depth:
Δ = f d n ( n 2 ( N A ) 1 ( N A ) 2 2 n )
where n is the refractive index of fused silica, NA = sinθ, and fd is defined as the focusing depth. This leads to lower intensity distribution in the laser-affected zone and finally a lower state of induced volume variation.
By taking advantage of the difference in volume variation estimated by the cantilevers method, we optimize the shape of the laser-affected zones and achieve a uniform induced deformation to the system. Note that similar results that are acquired with the polygonal cross-sectioned stressors (Figure 9a) can also be reached by rectangular cross-sectioned stressors (as the ones applied in Figure 6a), as long as the laser power is modulated across the depth of the machined rectangle.
Figure 9. (a) Side view of the laser-affected bars that load the tensile tester. Optimized pattern structure of the sequential scanning of stressors for achieving uniform loading conditions. (b), (c) Parameters used to describe a single stressor. (d) Simplified spring model of the loading process.
Micromachines 06 01365 g009
The optimized pattern structure of the sequential scanning of stressors gives us the opportunity to refine the previously discussed model Section 2.3). Nevertheless, in this case we can subdivide the stressors into the laser-affected part and the unaffected part. Therefore we express k2 as the laser-affected volume, k1 as the stiffness of the laser unaffected sidebars under loading as a spring arranged in parallel to the elongated spring, and k3 as a parallel spring to k1 and k2 (as shown in Figure 3a,b).
If n is the number of stressors machined in the system, the total elongation variation is given by the following equation:
Stiffness = k 3 ( k 1 + k 2 ) k 1 k 2 + k 2 k 3 + k 1 k 3
where:
k 1 = E SiO 2 a 1 b 1 a 0 b 0 n W , k 2 = E Laser Affected Zone a 0 b 0 ( n 1 ) W , k 3 = E SiO 2 ( W + t ) b 0 2 ( L n W )
Here, for simplicity we model the laser-affected zones as a homogeneous material. A more rigorous approach—but outside the scope of this paper—would be to express the laser-affected zones as a composite material containing of a periodic arrangement of porous planes (nanogratings) in a pristine silica matrix.

3.3. Third-Harmonics Generation (THG) as an In Situ Metrology Tool

Various tools can perform spatial displacement measurements at the microscale. However, all the available techniques require repositioning of the device on the laser stages after each single measurement, which can eventually turn into a destructive process due to the difficulties when manipulating brittle micron-scale specimens. To overcome such problems, the same laser as the one that fabricated and operated the device is used to measure the output displacements of the amplification sensor. Thanks to this method, the strain of the test beam is estimated without interacting mechanically with the specimen and without moving the tensile tester from the laser platform, after the stressors have been produced.
Third harmonic generation (THG) is a nonlinear process that occurs in all materials [68]. In general, THG is inhibited under tight focusing conditions because of a phase mismatch [68]. It is a surface- enhanced phenomenon due to its dependence on the different susceptibilities and/or refractive indices of the materials that form an interface. Its nature allows depth-resolved imaging and for this reason its use has been extensively reported for imaging and for obtaining structural information of a wide range of transparent materials from glass and laser-modified glass to biological specimens [43,44,45,46,47,48,49]. Here, by taking advantage of the sensitivity of the THG process to interfaces, we adopt it for in situ metrology. For the measurements, the laser is operated at much lower pulse energy (energy per pulse of 70 nJ, 800 kHz), so that no modification is made in the material. Using the THG intensity peak (see Figure 10a) observed at air/material interfaces, we are able to define the edge positions. The measurement accuracy of this method is estimated to be less than 250 nm and depends on the laser spot size as well as the mechanical stages resolution.
Figure 10. (a) Illustration of the formation of the third harmonic generation signal (THG) across the edge of a test sample. Regions one and two are close to the side edge of the material. In region one there is a decay of the signal, which is attributed to internal reflections. The spike in region two indicates reflection at the interface and thanks to it we can define the edge of the material. (b) Illustration of the THG signal across the surface of a calibration pattern made of known-size grooves. The red labels are extracted from the THG trace.
Micromachines 06 01365 g010

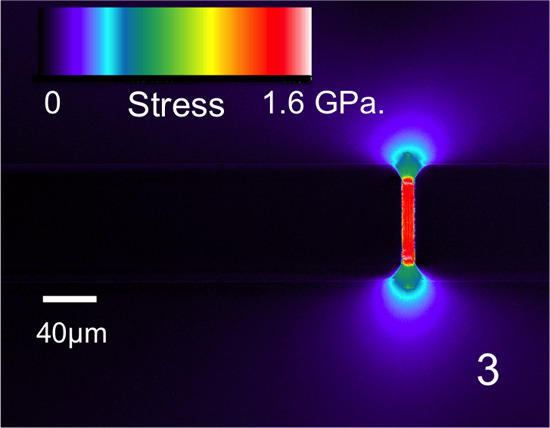
3.4. Stress Monitoring through Photoelasticity

Stress estimation is facilitated through photoelasticity, which gives a direct measurement of the induced stress in the test beam [69,70]. False color intensity retardance maps (Figure 1c) of the loaded test beam are generated with a standard microscope (Olympus BX51, Tokyo, Japan) fitted with a commercial system to measure optical retardance (LC-Polscope, CRI, Cambridge, MA, USA). The measured retardance of these patterns is directly related to the induced stress through a local change in the difference of the refractive index. Finally, the difference between the principal stresses is calculated using the following equation:
σ 1 σ 1 =   R T ( C 1 C 2 )
where C1C2 = C = 3.55 × 10⁻¹² Pa−1 for fused silica at the microscope’s operated wavelength of 546 nm and is related to the piezo-optical coefficients by:
C = ( n 3 2 ) ( π 11 π 12 )
where π11 and π22 are the piezo-optic constants for fused silica and n is the refractive index of the material at 546 nm (the wavelength used by the instrument). T is the thickness of the sample and R is the measured retardance, respectively.
Considering the operating wavelength of the instrument, the retardance measurement spans between 0 and 273 nm. At higher retardance levels higher orders of fringes are observed. The final retardance is calculated taking into account the higher orders and according to the equation:
R f = R m + K λ 2
where Rf is the final retardance, Rm the retardance measured in the test beam, k is the number of orders, and λ is the wavelength at which the instrument operates.

3.5. Example of Stress Measurements on a Silica Micro-Beam

The retardance map is used to extrapolate the stress seen through a small surface of 4 μm2 in the center of the test beam (Figure 11).
The stress level was calculated using Equation (10) and taking into account the Poisson ratio of the material (ν = 0.165). Before the test beam’s failure its stress level was estimated between 2.7 and 3.0 GPa. This value is consistent with the ones measured in [35]. The bone-shaped specimen was designed with the dimensions of (L × W × D) 90 μm × 9 μm × 53 μm. Its in-plane dimensions were measured using third harmonics generation metrology, while its thickness was estimated by scanning electron microscopy measurements.
The strain of the test beam was based on the measured displacement of the amplification sensor. The amplification factor of the sensor was adjusted using finite element method simulations (COMSOL Multiphysics Software) using the post-etching dimensions of the device. The gage length of the test beam is calculated using the profile of the retardance values along the test beam and was verified by the stress profile simulated on the test beam.
As a proof of concept, the elastic modulus of fused silica is estimated (Figure 12) and is consistent with the values commonly found in the literature, ranging between 72 and 73 GPa [71]. For the extrapolation of the elastic modulus, the slope of the stress-strain curve was used. The error values of the stress measurements in the first data points was low, therefore the error bars are not visible.
Figure 11. Stress map of the test beam just before its failure. The stress is uniformly distributed along the length and the thickness of the test beam.
Micromachines 06 01365 g011
Figure 12. A typical stress–strain curve is illustrated. The elastic modulus is estimated at 72.8 GPa with a relative error of 2.1 GPa.
Micromachines 06 01365 g012
The fracture was brittle, and occurred at the end of the gage section as indicated in Figure 13, where stress–concentration is found at the location predicted by finite element method simulation (COMSOL). The stresses highest value is at the circled points being larger there by 15% than that in the central section. Although the fracture pattern morphology does not give a clear indication where the crack was first initiated, it seems likely and highly probable that the crack was initiated from this point. Nevertheless, this example suggests that we have not yet reached the point where the fracture is only governed by the inner strength of the material and not by material interface quality. Improving the surface quality further could lead us closer to the actual limit of the material.
Figure 13. Tested specimen under the scanning electron microscope (right) and a virtual experiment using finite element analysis simulation software illustrated (left). The circled area has a stress concentration factor of 1.15.
Micromachines 06 01365 g013

3.6. Error Analysis for the Experimental Technique

There are several contributing sources of error in the experimental procedure [72]. The first originates in the measurements of the stress. The error in the thickness measurement introduced by the optical microscopy measurement of the test beam is significantly affecting the calculated stress of the test beam. The error of the retardance-measuring instrument (LC-Polscope) contributes, as well, in the stress calculation.
The stress uncertainty is calculated from the equation:
u σ = ( 1 C t ) 2 u R 2 + ( R C t 2 ) 2 u t 2
where R is the measured retardance in the test beam, uR is the uncertainty of the retardance measurement, t is the thickness of the test beam, ut is the uncertainty of the thickness measurements, and is C = 3.55 × 10⁻¹² Pa−1 as indicated in Section 3.4.
The second source of error stems from the displacement amplification mechanism. Here, the main sources of uncertainty are the original measurement of the test beam’s length and the output displacements of the displacement amplification sensor. Therefore, the error of the strain measurements is calculated as follows:
u ε = ( 1 L ) 2 u ε 2 + ( Δ l L 2 ) 2 u L 2
where L is the original length of the test beam, uL is the uncertainty of the measured length, Δl is the output displacement of the displacement amplification sensor and uε is the uncertainly of the measured displacement, normalized with the amplification factor of the sensor.

4. Conclusions and Outlook

A novel technique to perform microtensile testing is proposed in which the material under test is itself, sculpted into a tensile tester. This configuration offers the capability to perform an experiment without mechanically interacting with the specimen. Along with the design of the instrument itself, the associated measurement tools for reaching ultra-high stress levels are proposed. High strain resolution of 50 nm and minimizing of the bending stress level to less than 1% of the desired uniaxial stress is demonstrated. As a proof of concept, we performed tensile testing of the fused silica reaching stress levels up to 2.4 GPa.
The monolithic micro-tensile tester is primarily designed for testing silica. It offers a particularly suitable platform to unravel the micro-mechanical behavior of silica’s laser-induced composites, which remain largely unexplored in the micro- and nanoscale. Indeed, it provides the opportunity to further optically modify the test beam after fabrication, by using the same femtosecond laser that is used for the processing and operation of the device. By shaping the laser’s pulses and/or parameters, different kinds of polymorphs can be embedded in the test beam, forming a laser-induced composite material that will ultimately be characterized.
Nonetheless, this instrument is not only applicable for uniaxial loading of silica’s laser-polymorphs. It could be adapted for testing other materials, such as one axis nano-materials or thin films, pending that an adequate specimen microstructuring process or attachment process, compatible with the instrument fabrication process itself, is found.
The main limitation of this instrument is that it can only be used for single cycle loading experiments due to the irreversibility of the loading process.
In parallel with the development of the micro-tensile tester, we presented our preliminary results on the change of the elastic modulus of fused silica upon femtosecond laser exposure in the laser exposure regime where nanogratings form. A decreased elastic modulus is reported that we link to the presence of the porous structure observed inside nanograting lamellas.

Acknowledgments

The authors acknowledge the financial support of the European Research Council (Galatea project, ERC-2012-StG-307442) and thank Ben McMillen for helping setting up the third-harmonic generation sensing measurements in our laser platform. The first author acknowledges Hossein E. Amirabadi for his help with the simulations.

Author Contributions

Christos-Edward Athanasiou, as part of his Ph.D. thesis work, designed the device, performed the experiments and wrote the manuscript. Yves Bellouard conceived, designed and supervised the research. Both authors participated to the manuscript’s revisions and improvements as well as the data analysis.

Conflicts of Interest

The authors declare no conflict of interest.

Appendix

Derivation of the Shear-Lag Model

Using the shear-lag model proposed in [52,53,54], the stress at the pristine material close to the interface between the two different faces of the material is evaluated. The length and width of the pristine regions are denoted by l and WP in Figure 3d. In the model, the laser affected material undergoes uniform displacement uo(z) = zεapplied; the displacement field in the pristine region is assumed to be uniform throughout the thickness of the material. The shear stress in the pristine region can be expressed as:
τ ( z ) = μ SiO 2 u ( z ) u 0 ( z ) W P
The shear stress at the interface causes normal stress in the laser-modified material. A force balance for an infinitesimal segment of the modified material yields:
τ ( z ) = W P d σ z d z = W P E SiO 2 d 2 u d z 2
Equating (A1) and (A2) results in a second order ordinary differential Equation in u(z).
k 2 d 2 u d z 2 = u ( z ) ε applied z
where
k = E SiO 2 W 2 P μ SiO 2
Two boundary conditions are needed to solve Equation (A3):
u ( z = 0 ) = 0
σ z ( z ) = E SiO 2 d u d x | z = l = 0
The solution to Equation (A3) is then given by:
u ( z ) = k ε applied ( 1 cosh ( z k ) )
The corresponding stress field generated on the pristine sidebars from the laser-modified material is:
σ z ( z ) = E SiO 2 d u d z = E SiO 2 ε applied sinh ( z k )
The maximum stress occurs in the top of the laser-modified zones where z = l, that is:
σ z ( l ) = E SiO 2 ε applied sinh ( l k )

References

  1. Nix, D.W. Exploiting new opportunities in materials research by remembering and applying old lessons. MRS Bull. 2009, 34, 82–91. [Google Scholar] [CrossRef]
  2. Nix, D.W. Mechanical properties of thin films. Metall. Trans. A 1989, 20, 2217–2245. [Google Scholar] [CrossRef]
  3. Greer, J.R.; Oliver, W.C.; Nix, D.W. Size dependence of mechanical properties of gold at the micron scale in the absence of strain gradients. Acta Mater. 2005, 53, 1821–1830. [Google Scholar] [CrossRef]
  4. Srikar, V.T.; Spearing, S.M. A critical review of microscale mechanical testing methods used in the design of microelectromechanical systems. Expe. Mech. 2003, 43, 238–247. [Google Scholar] [CrossRef]
  5. Hemker, K.J.; Sharpe, W.N. Microscale characterization of mechanical properties. Annu. Rev. Mater. Res. 2007, 37, 93–126. [Google Scholar] [CrossRef]
  6. Vlassak, J.J.; Nix, W.D. A new bulge test technique for the determination of young’s modulus and poisson’s ratio of thin films. J. Mater. Res. 1992, 7, 3242–3249. [Google Scholar] [CrossRef]
  7. Hémel, A.; Jacques, A.; Schenk, T.; Ferry, O.; Kruml, T. Investigation of mechanical properties of gold thin films using a bulge test technique. J. Phys. Conf. Ser. 2010, 240, 012163. [Google Scholar] [CrossRef]
  8. Oliver, W.C.; Pharr, G.M. An improved technique for determining hardness and elastic modulus using load and displacement sensing indentation experiments. J. Mater. Res. 1992, 7, 1564–1583. [Google Scholar] [CrossRef]
  9. Oliver, W.C.; Pharr, G.M. Measurement of hardness and elastic modulus by instrumented indentation: Advances in understanding and refinements to methodology. J. Mater. Res. 2004, 19, 3–20. [Google Scholar] [CrossRef]
  10. Schuh, C.A. Nanoindentation studies of materials. Mater. Today 2006, 9, 32–40. [Google Scholar] [CrossRef]
  11. Haque, M.A.; Saif, M.T. Microscale materials testing using mems actuators. J. Microelectromech. Syst. 2001, 10, 146–152. [Google Scholar] [CrossRef]
  12. Haque, M.A.; Saif, M.T. A review of mems-based microscale and nanoscale tensile and bending testing. Expe. Mech. 2003, 43, 248–255. [Google Scholar] [CrossRef]
  13. Liu, R.; Wang, H.; Li, X.; Ding, G.; Yang, C.A. Micro-tensile method for measuring mechanical properties of mems materials. J. Micromech. Microeng. 2008, 18, 065002. [Google Scholar] [CrossRef]
  14. Chasiotis, I.; Knauss, W.G. A New microtensile tester for the study of mems materials with the aid of atomic force microscopy. Expe. Mech. 2002, 42, 51–57. [Google Scholar] [CrossRef]
  15. Petersen, K.E. Dynamic micromechanics on silicon: Techniques and advantages. IEEE Trans. Electron Dev. 1978, 66, 1241–1250. [Google Scholar] [CrossRef]
  16. Petersen, K.E.; Guarnieri, C.R. Young’s modulus measurements of thin films using micromechanics. J. Appl. Phys. 1979, 50, 6761–6766. [Google Scholar] [CrossRef]
  17. Timoshenko, S.; Young, D.H.; Weaver, W. Vibration Problems in Engineering; John Wiley and Sons: New York, NY, USA, 1974. [Google Scholar]
  18. Osterberg, P.M.; Senturia, S.D. M-test: A test chip for MEMS material property measurements using electrostatically actuated test structures. J. Microelectro. Syst. 1997, 6, 107–117. [Google Scholar] [CrossRef]
  19. Gregoriou, V.G.; Brairman, M.S. Vibrational Spectroscopy of Biological and Polymeric Materials; CRC Press: Boca Raton, FL, USA, 2006. [Google Scholar]
  20. Tsoukleri, G.; Parthenios, J.; Papagelis, K.; Jalil, R.; Ferrari, A.; Geim, A.; Novoselov, K.; Galiotis, C. Subjecting a graphine monolayer to tension and compression. Small 2009, 5, 2397–2402. [Google Scholar] [CrossRef] [PubMed]
  21. Charitidis, C.A.; Dragatogiannis, D.A. Finite element analysis, stress–strain distribution and size effects rise during nanoindentation of welded aluminum alloy. Int. J. Struct. Integr. 2013, 4, 78–90. [Google Scholar]
  22. Tabor, D. The Hardness of Metals; Oxford University Press: New York, NY, USA, 2000. [Google Scholar]
  23. Stathis, J.H. Reliability Limits for the gate insulator in CMOS technology. IBM J. Res. Dev. 2002, 46, 265–286. [Google Scholar] [CrossRef]
  24. Strege, M.; Lagu, A. Separation of DNA restriction fragments by capillary electrophoresis using coated fused silica capillaries. Anal. Chem. 1991, 63, 1233–1236. [Google Scholar] [CrossRef] [PubMed]
  25. Marshall, G.D.; Ams, M.; Withford, M.J. Direct laser written waveguide-bragg gratings in bulk fused silica. Opt. Lett. 2006, 31, 2690–2691. [Google Scholar] [CrossRef] [PubMed]
  26. Schaap, A.; Rohrlack, T.; Bellouard, Y. Optical classification of algae species with a glass lab-on-a-chip. Lab Chip 2012, 12, 1527–1532. [Google Scholar] [CrossRef] [PubMed]
  27. Kurkjian, C.R.; Albarino, R.V.; Krause, J.T.; Vazirani, H.N.; DiMarcello, F.V.; Torza, S.; Schonhorn, H. Strength of 0.04–50-m lengths of coated fused silica fibers. Appl. Phys. Lett. 1976, 28, 588–590. [Google Scholar] [CrossRef]
  28. Jayatilaka, A.S.; Trustrum, K. Statistical approach to brittle fracture. J. Mater. Sci. 1977, 12, 1426–1430. [Google Scholar] [CrossRef]
  29. Griffith, A.A. The phenomena of rupture and flow in solids. Phil. Trans. R. Soc. Lond. A 1921, 221, 163–198. [Google Scholar] [CrossRef]
  30. Marsh, D.M. Plastic flow and fracture of glass. Proc. R. Soc. Lond. A 1964, 282, 33–43. [Google Scholar] [CrossRef]
  31. Rountree, C.L.; Kalia, R.K.; Lidorikis, E.; Nakaro, A.; van Brutzel, L.; Vashishta, P. Atomistic aspects of crack propagation in brittle materials Multimillion atom molecular dynamics simulations. Annu. Rev. Mater. Res. 2002, 32, 377–400. [Google Scholar] [CrossRef]
  32. Kalia, R.K.; Nakano, A.; Vashishta, P.; Rountree, C.L.; van Brutzel, L.; Ogata, S. Multiresolution atomistic simulations of dynamic fracture in nanostructured ceramics and glasses. Int. J. Fract. 2003, 121, 71–79. [Google Scholar] [CrossRef]
  33. Custers, J.F.H. Plastic deformation of glass during scratching. Nature 1949, 164, 627–627. [Google Scholar] [CrossRef]
  34. Célarié, F.; Prades, S.; Bonamy, D.; Ferrero, L.; Bouchaud, E.; Guillot, C.; Marlière, C. Glass breaks like metal, but at the nanometer scale. Phys. Rev. Lett. 2003, 90, 075504. [Google Scholar] [CrossRef] [PubMed]
  35. Bellouard, Y. On the Bending Strength of Fused Silica Flexures Fabricated by Ultrafast Lasers [Invited]. Opt. Mater. Express 2011, 1, 816–831. [Google Scholar] [CrossRef]
  36. Bellouard, Y.; Said, A.; Dugan, M.; Bado, P. Fabrication of high-aspect ratio, micro-fluidic channels and tunnels using femtosecond laser pulses and chemical etching. Opt. Express 2004, 12, 2120–2129. [Google Scholar] [CrossRef] [PubMed]
  37. Gattass, R.R.; Mazur, E. Femtosecond laser micromachining in transparent materials. Nat. Photonics 2008, 2, 219–225. [Google Scholar] [CrossRef]
  38. Marcinkevičius, A.; Juodkazis, S.; Watanabe, M.; Miwa, M.; Matsuo, S.; Misawa, S.; Nishii, J. Femtosecond laser-assisted three-dimensional microfabrication in silica. Opt. Lett. 2001, 26, 277–279. [Google Scholar] [CrossRef]
  39. Bellouard, Y. Femtosecond laser-based production of 3D micro- and nano- devices in transparent substrate: A step toward system-materials. In Proceedings of SPIE, San Francisco, CA, USA, 8–9 September 2015.
  40. Yang, T.; Bellouard, Y. A three-dimentional monolithic dielectrophoretic actuator, fabricated by femtosecond laser and chemical etching. J. Micromech. Microeng. 2015, in press. [Google Scholar] [CrossRef]
  41. Kiyama, S.; Matsuo, S.; Hashimoto, S.; Morihira, Y. Examination of etching agent and etching mechanism on femotosecond laser microfabrication of channels inside vitreous silica substrates. J. Phys. Chem. C 2009, 113, 11560–11566. [Google Scholar] [CrossRef]
  42. Champion, A.; Bellouard, Y. Direct volume variation measurements in fused silica specimens exposed to femtosecond laser. Opt. Mater. Express 2012, 2, 789–798. [Google Scholar] [CrossRef]
  43. Barad, Y.; Eisenberg, H.; Horowitz, M.; Silberberg, Y. Nonlinear scanning laser microscopy by third harmonic generation. Appl. Phys. Lett. 1997, 70, 922–924. [Google Scholar] [CrossRef]
  44. Squier, J.A.; Müller, M. Third-harmonic generation imaging of laser-induced breakdown in glass. Appl. Opt. 1999, 38, 5789–5794. [Google Scholar] [CrossRef] [PubMed]
  45. Marshall, G.D.; Jesacher, A.; Thayil, A.; Withford, M.J.; Booth, M. Three-dimensional imaging of direct-written photonic structures. Opt. Lett. 2011, 36, 695–697. [Google Scholar] [CrossRef] [PubMed]
  46. Tsang, T. Optical third-harmonic generation at interfaces. Phys. Rev. A 1995, 52, 4116–4125. [Google Scholar] [CrossRef] [PubMed]
  47. Schins, J.M.; Schrama, T.; Squier, J.; Brakenhoff, G.J.; Müller, M. Determination of material properties by use of third-harmonic generation microscopy. J. Opt. Soc. Am. B 2002, 19, 1627–1634. [Google Scholar] [CrossRef]
  48. Schaffer, C.B.; der Au, J.A.; Mazur, E.; Squier, J.A. Micromachining and material change characterization using femtosecond laser oscillators. In Proceedings of SPIE, San Jose, CA, USA, 20 January 2002.
  49. Oron, D.; Yelin, D.; Tal, E.; Raz, S.; Fachima, R.; Silberberga, Y. Depth-resolved structural imaging by third-harmonic generation microscopy. J. Struct. Biol. 2004, 147, 3–11. [Google Scholar] [CrossRef]
  50. Bhardwaj, V.R.; Simova, E.; Rajeev, P.P.; Hnatovsky, C.; Taylor, R.S.; Rayner, D.M.; Corkum, P.B. Optically produced arrays of planar nanostructures inside fused silica. Phys. Rev. Lett. 2006, 96, 057404. [Google Scholar] [CrossRef] [PubMed]
  51. Shimotsuma, Y.; Kazansky, P.G.; Qiu, J.; Hirao, K. Self-organized nanogratings in glass irradiated by ultrashort light pulses. Phys. Rev. Lett. 2003, 91, 247405. [Google Scholar] [CrossRef] [PubMed]
  52. Clyne, T.W. A simple development of the shear lag theory appropriate for composites with a relatively small modulus mismatch. Mater. Sci. Eng. A 1989, 122, 183–192. [Google Scholar] [CrossRef]
  53. Nairn, J.A. On the use of shear-lag methods for analysis of stress transfer in unidirectional composites. Mech. Mater. 1997, 26, 63–80. [Google Scholar] [CrossRef]
  54. Kotha, S.P.; Kotha, S.; Guzelsu, N. A shear-lag model to account for interaction effects between inclusions in composites reinforced with rectangular platelets. Compos. Sci. Technol. 2000, 60, 2147–2158. [Google Scholar] [CrossRef]
  55. Sears, J.E. A symmetrically opening optical slit. J. Sci. Instrum. 1933, 10, 376–377. [Google Scholar]
  56. Smith, S.T. Flexures: Elements of Elastic Mechanisms; CRC Press: Boca Raton, FL, USA, 2000. [Google Scholar]
  57. Bellouard, Y. Microrobotics: Methods and Applications; CRC Press: Boca Raton, FL, USA, 2010. [Google Scholar]
  58. Howell, L.L. Compliant Mechanisms; John Wiley & Sons: Hoboken, NJ, USA, 2001. [Google Scholar]
  59. Henein, S. Conception des structures articulées à guidages flexibles de haute précision. Ph.D. Thesis, École Polytechnique Fédérale de Lausanne, Lausanne, Switzerland, June 2000. [Google Scholar]
  60. Canning, J.; Lancry, M.; Cook, K.; Weickman, A.; Brisset, F.; Poumellec, B. Anatomy of a femtosecond laser processed silica waveguide [invited]. Opt. Mater. Express 2011, 1, 998–1008. [Google Scholar] [CrossRef]
  61. Lancry, M.; Poumellec, B.; Canning, J.; Cook, K.; Poulin, J.C.; Brisset, F. Ultrafast nanoporous silica formation driven by femtosecond laser irradiation: In the heart of nanogratings. Laser Phononics Rev. 2013, 7, 953–962. [Google Scholar] [CrossRef]
  62. Bricchi, E.; Klappauf, B.G.; Kazansky, P.G. Form birefringence and negative index change created by femtosecond direct writing in transparent materials. Opt. Lett. 2004, 29, 119–121. [Google Scholar] [CrossRef] [PubMed]
  63. Phani, K.K.; Niyogi, S.K. Young’s modulus of porous brittle solids. J. Mater. Sci. 1987, 22, 257–263. [Google Scholar] [CrossRef]
  64. Kovacik, J. Correlation between the Young’s modulus and porosity in porous materials. J. Mater. Sci. Lett. 1999, 18, 1007–1010. [Google Scholar] [CrossRef]
  65. Wagh, A.S.; Poeppel, R.B.; Singh, J.P. Open pore description of mechanical properties of ceramics. J. Mater. Sci. 1991, 26, 3862–3868. [Google Scholar] [CrossRef]
  66. Stoney, G.G. The tension of metallic films deposited by electrolysis. Proc. R. Soc. Lond. A 1909, 82, 172–175. [Google Scholar] [CrossRef]
  67. Sun, Q.; Jiang, H.; Liu, Y.; Zhou, Y.; Yang, H.; Gong, Q. Effect of spherical aberration on the propagation of a tightly focused femtosecond laser pulse inside fused silica. J. Opt. A Pure Appl. Opt. 2005, 7, 655–659. [Google Scholar] [CrossRef]
  68. Shen, Y.R. The Principles of Nonlinear Optics; Wiley-Interscience: New York, NY, USA, 1984. [Google Scholar]
  69. Vasudevan, T.N.; Krishnan, R.S. Dispersion of the stress-optic coefficient in glasses. J. Phys. D: Appl. Phys. 1972, 5, 2283–2287. [Google Scholar] [CrossRef]
  70. Bellouard, Y.; Colomb, T.; Depeursinge, C.; Dugan, M.; Said, A.A.; Bado, P. Nanoindentation and birefringence measurements on fused silica specimen exposed to low-energy femtosecond Pulses. Opt. Express 2006, 14, 8360–8366. [Google Scholar] [CrossRef] [PubMed]
  71. Bansal, N.; Doremus, R.H. Handbook of Glass Properties; Academic Press: Orlando, FL, USA, 1986. [Google Scholar]
  72. Gabauer, W. The Determination of Uncertainties in Tensile Testing; Voest-Alpine Stahl Linz GmbH: Linz, Austria, 2000. [Google Scholar]

