Article

Paper-Based Electrodeposition Chip for 3D Alginate Hydrogel Formation †

1
Department of Mechanical and Biomedical Engineering, City University of Hong Kong, No. 83, Tat Chee Ave, Kowloon, Hong Kong, China
2
College of Electromechanical Engineering, University of Petroleum (East China), No. 66, ChangjiangWest Road, Huangdao District, Qingdao 266600, China
3
City University of Hong Kong Shenzhen Research Institute, 8 Yuexing 1st Road, Shenzhen 518000, China
*
Author to whom correspondence should be addressed.
This paper is an extended version of our paper published in the 10th Annual IEEE International Conference on Nano/Micro Engineered and Molecular Systems (IEEE NEMS 2015), Xi’an, China, 7–11 April 2015.
Micromachines 2015, 6(10), 1546-1559; https://doi.org/10.3390/mi6101438
Submission received: 6 September 2015 / Accepted: 13 October 2015 / Published: 15 October 2015

Abstract

:
Hydrogel has been regarded as one significant biomaterial in biomedical and tissue engineering due to its high biocompatibility. This paper proposes a novel method to pattern calcium alginate hydrogel in a 3D way via electrodeposition process based on a piece of paper. Firstly, one insulating paper with patterned holes is placed on one indium tin oxide (ITO) glass surface, which is put below another ITO glass. Then, 1% sodium alginate solution with 0.25% CaCO3 nano particles is filled between these two glasses. In the bottom glass, patterns of electrodes followed patterns of holes on the insulating layer. Hydrogel forms on patterned electrodes when electrochemical potential is applied due to electrodeposition. The experiments demonstrate that the pattern of alginate hydrogels follows the pattern of electrodes exactly. In addition, the hydrogel’s height is controllable by applied potential and reaction time. An equivalent circuit model and a hydrogel growth model have been built to predict the electrodeposition current and hydrogel’s growth. This method for gel formation is easy and cheap since the main material is one piece of insulated paper, which provides an easy and controllable method for 3D hydrogel patterning.

Graphical Abstract

1. Introduction

3D cell culture is one critical technique in biomedical and tissue engineering, since cell culture in three dimensions can better reproduce the environment cells, tissues and organs experience in vivo compared with 2D cell culture [1,2]. For instance, human breast epithelial cells grow into tumor cells in a 2D culture system but then show normal behavior after those cells are transferred to 3D culture system [3]. Human embryonic stem cells cultured in a 3D way grow more closely to in vivo microenvironment than cells cultured in a 2D way [4]. Thus, the methods of culturing cell in a 3D manner has received increasing interest nowadays to reveal cells’ growth mechanism.
To support the cell in a 3D space, the basic requirement is to fabricate a 3D matrix or scaffold by biocompatible materials, including metals, glasses, ceramics, polymers and so on [5]. Among these materials, alginate hydrogels, as one type of biocompatible polymers, have been used widely in biology and biomedical engineering due to their high water absorptivity and high biocompatibility [6,7]. They are able to mimic architecture of most soft tissues, and the hydrogels’ structure is able to facilitate the transport of nutrients and waste during cells’ growth [8]. In addition to the material, the structure control is another critical aspect, which greatly affect cells’ metabolism in natural. For example, cells’ functions such as gene expression, growth, differentiation and apoptosis are affected by culture matrix or extracellular matrix through transmembrane receptors [9,10]. Control of culture matrix can also be used in design and analysis of biosensors for drug test and toxin detection, since cells have their recognition and reaction mechanisms to external stimulus and cells would show different signals when they are cultured in matrix of different patterns [11,12]. In addition, because control of culture matrix includes locating cells precisely, it can be adopted to fabricate tissue mimics, e.g., blood vessels and bones, with certain cell patterns and microarchitecture in tissue engineering [13,14,15]. Therefore, how to construct the hydrogel in 3D space with high controllability has been an urgent demand in biomedical engineering.
Nowadays, various methods of 3D hydrogel patterning have been proposed. One traditional approach is to construct the 3D hydrogel patterning based on a pre-prepared 3D mask, such as stencil-assisted method [16,17] and photomask-induced method [18]. Although these methods are able to construct the 3D hydrogel successfully, one problem lies in the shape of culture matrix is decided by the shape of mask strictly. If a culture matrix with different structure is required, new mask should be fabricated again, which is time consuming and with a high cost. To address the above issue, some non-mask methods have also been proposed to increase the fabrication flexibility, such as magnetic-induced 3D cell patterning [19], light-induced 3D cell patterning [20], 3D printing [21] and so on. These approaches get rid of the restriction of the 3D mask, but they have some special requirements in practice more or less. For example, in magnetic-induced method, the long-term impact of magnetic particles on cells are still unclear, and the resolution of culture matrix’s shape control by magnetic field is low. In light-induced 3D cell patterning, the used poly-glycol diacrylate-based hydrogel is hard and cells cannot live within it. 3D printing methods have their special requirements on biomaterials and they are difficult to create micro-architectures.
Electrodeposition is able to deposit different kinds of material with different size, ranging from micrometer to meter, and requires relatively simple and cheap equipment. Recently, this technique has gained increasing attention in the biology and biomedical fields [6,7,22,23], and hydrogel patterning through electrodeposition has been adopted in many research works. In reference [22], hydrogel is generated through electrodeposition with rectangle-like electrodes, and reference [6] adopts stick-like electrodes to get vascular-like hydrogel. However, these methods can only fabricate hydrogels of fixed shapes, i.e., rectangle-like and stick-like, and other shapes are not available. In addition, the electrode patterns is usually fabricated based on photolithography technique in clearing room [23,24,25,26], which requires complex process, expensive equipment, and is of high cost in both economy and time.
Herein, we propose a low-cost, simple and fast method for 3D hydrogel patterning by developing a paper-based biochip. First, the mechanism of the gel construction approach is illustrated. Then, the biochip is developed by pasting a patterned-paper on the top of one indium tin oxide (ITO) glass. After that, this plate is assembled with another ITO glass, between which the mixed solution (1% sodium alginate solution with 0.25% CaCO3 particles) is filled. Thus, the hydrogel is able to be constructed on the paper pattern through electrodeposition. Lastly, an equivalent circuit model and a hydrogel growth model are built for the electrodeposition system to predict the electrodeposition system’s electrochemical properties and hydrogel’s growth. Experiment results verify that both pattern and height of hydrogel are controllable and justified the built models.

2. Methods

2.1. Experimental Setup

The schematic of hydrogel construction by paper-based electrodeposition is illustrated in Figure 1. Two pieces of ITO glasses (Huanan Xiangcheng, Shenzhen, China) with size 30 mm × 30 mm are taken as the electrodes, which are connected to a DC power source (E3611A, Agilent, Santa Clara, CA, USA), i.e., the bottom plate as anode and the top plate as cathode. A piece of insulated paper with patterned wholes is pasted on the surface of bottom ITO glass. These two plates are separated by two insulated plastic bars with height 1.45 mm. After that, the mixed solution, 1% sodium alginate solution with 0.25% CaCO3 particles, are filled in the space of the chamber.
After applying the DC voltage between the two plates, the H+ is generated on the hollow region of the paper due to water electrolysis. Then, the H+ reacts with the CaCO3 particles to trigger Ca2+. Lastly, the gel is constructed due to the reaction between Ca2+ and sodium alginate [27]:
2 H 2 O 4 H + + O 2 + 4 e
2 H + + CaC O 3 C a 2 + + H 2 O + C O 2
n Ca 2 + + 2 ( Na C 6 H 7 O 6 ) n ( C 12 H 14 Ca O 12 ) n + 2 n N a +
In this experimental setup, the location of the anode is decided by the shape of the paper, through which the positon and shape of the gel can be controlled. In addition, the height of the gel can be controlled by the deposition time regarding to the reaction equation. Comparing with the traditional electrodes fabrication method in cleaning room, the paper-based chip is easy to fabricate and has the advantages of low cost, high flexibility and less preparation time.
Figure 1. Schematic of experimental setup for fabricating hydrogel by electrodeposition. Two conductive ITO glasses function as electrodes, with the bottom one being the anode and the up one being the cathode. Sodium alginate solution with CaCO3 particles are injected between two electrodes. A piece of insulating paper with patterned holes are put on the upper surface of the bottom ITO glass. Thus, hydrogel’s patterns can be controlled by patterns of holes via electrodeposition process.
Micromachines 06 01438 g001

2.2. Gel Observation

The experimental setup for observing lateral side of hydrogel and measuring hydrogel’s height is shown in Figure 2. After hydrogel is generated, the top ITO glass is moved away, and the hydrogel is rinsed softly with NaCl solution (1% w/v). Then, the bottom ITO glass with hydrogel on it is put on a sloping bench, and the lens of the optical microscope (VHX-1000, Keyence, Osaka, Japan) are tilted by the sloping bench’s tilt angle. As a result, the lateral side of hydrogel can be observed and the hydrogel’s height can be measured based on optical microscope images.
Figure 2. Methods for observing hydrogel’s lateral side. The bottom ITO glass with hydrogel on it is put on a sloping bench, which has a certain tilt angle. Then the optical microscope’s lens are tilted by the sloping bench’s tilt angle. The height of the hydrogel is measured based on the microscopy image.
Micromachines 06 01438 g002

2.3. Preparation of the Mixed Solution

During preparation of the solution, 0.1 g of sodium alginate (Sigma Inc., Marlborough, MA, USA) is put into 10 mL distilled water in a bottle. Then a magnetic stick (Haimen Company, Nantong, China) is put into the bottle, and the solution is stirred with a magnetic stirrer for 4 h until the sodium alginate is completely dissolved. After that, 0.025 g CaCO3 particles (Haofu Chemistry Limited Company, Shanghai, China) are put into the solution, and the solution are stirred for 1 h.

2.4. Preparation of the Paper

The paper (Scotch MagicTape, 3M Company, Maplewood, MN, USA) we used is bought from a stationary store. The holes on insulating layer can be achieved by manual cutting, punching by machines and cutting by programmable machine. In our experiments, holes of millimeter size is fabricated by manual cutting, and the hole of 500 µm in diameter is punched by a microneedle. The patterns on the insulating paper can also be cut by programmable machine, as mentioned in [28]. To be noted, any paper that is insulating and hydrophobic can be used in our experiments.

3. Experiment and Results

3.1. Control of 3D Hydrogel Patterns through Insulating Paper

Electrodes of quadrangle shape are firstly demonstrated to generate hydrogels. The patterned quadrangle hole is 5 mm × 5 mm in size. The concentrations for sodium alginate and CaCO3 are 1% w/v and 0.25% w/v, respectively. 3 V DC potential stood for 12 min before being switched off. Here, a long time, 12 min, is used to achieve hydrogel of large height for easy observation. As we can see later, hydrogel of several hundred micrometers can form in just 1 min, and this time can be reduced by applying a larger DC potential. After that, the top ITO glass was removed. The bottom ITO glass and formed hydrogel on it were rinsed softly with NaCl solution (1% w/
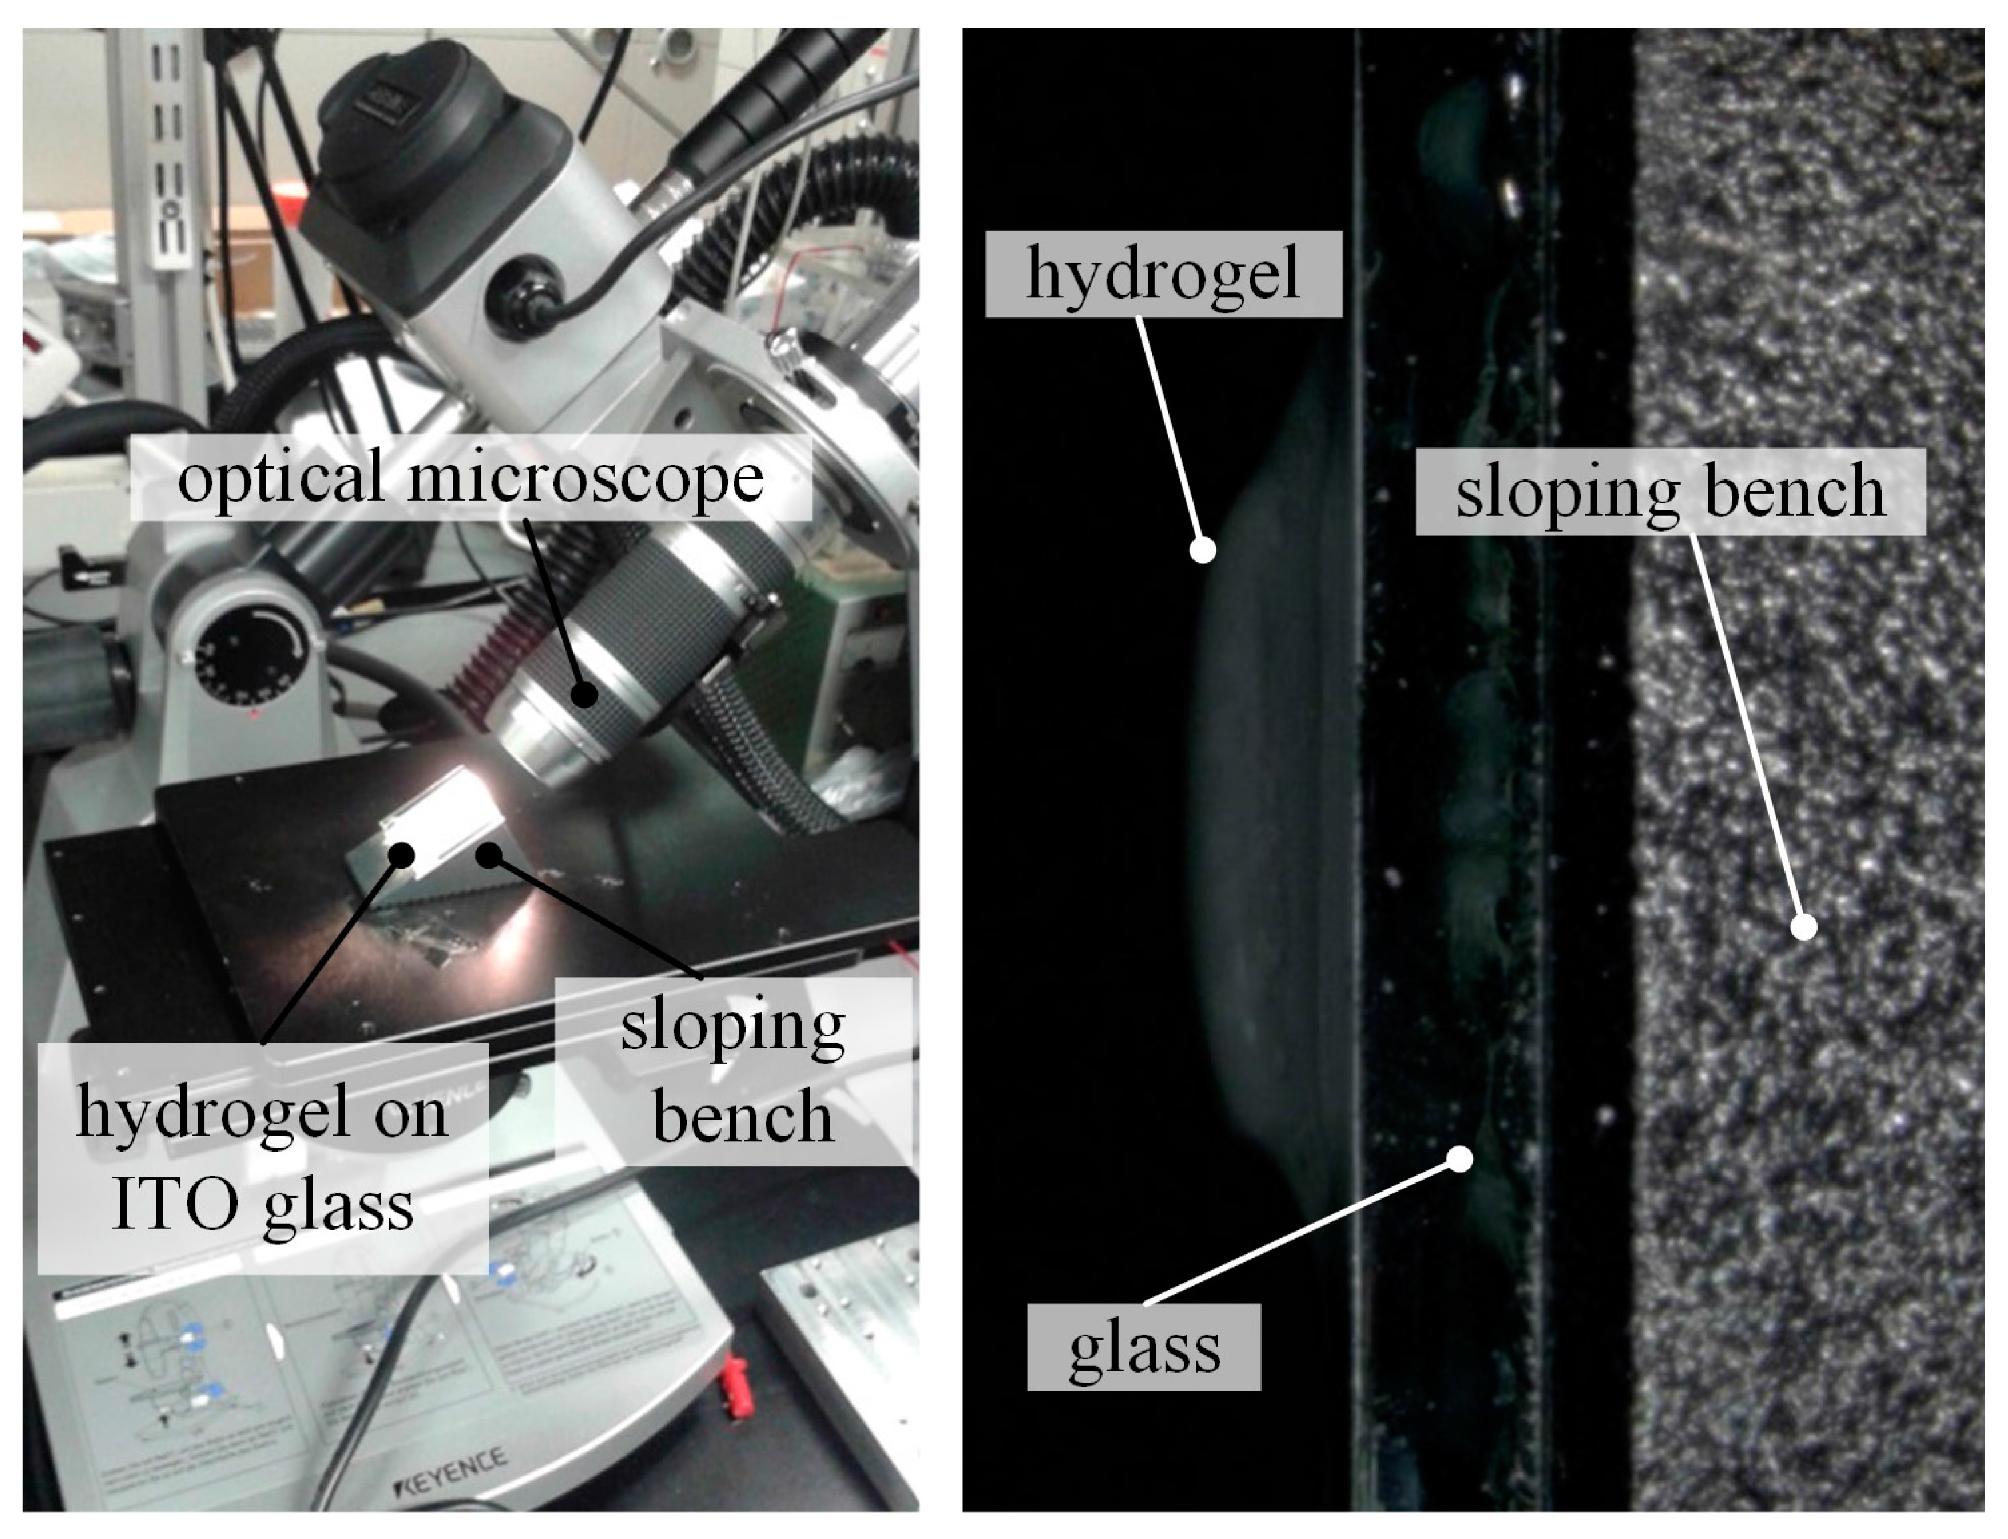
v). After being rinsed, the hydrogel was observed with an optical microscope (VHX-1000, Keyence, Japan) and are shown in Figure 3. The four pictures are imaged at different observation angle, i.e., 0°, 30°, 60° and 90°.
As we can see in 
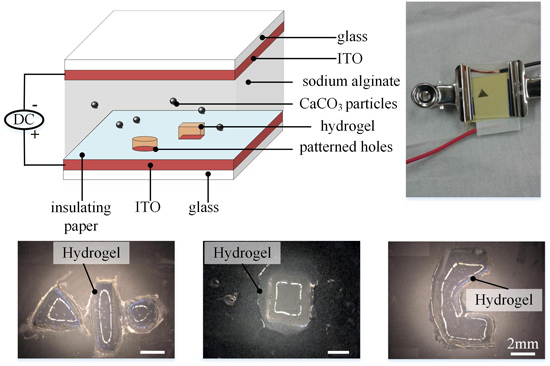
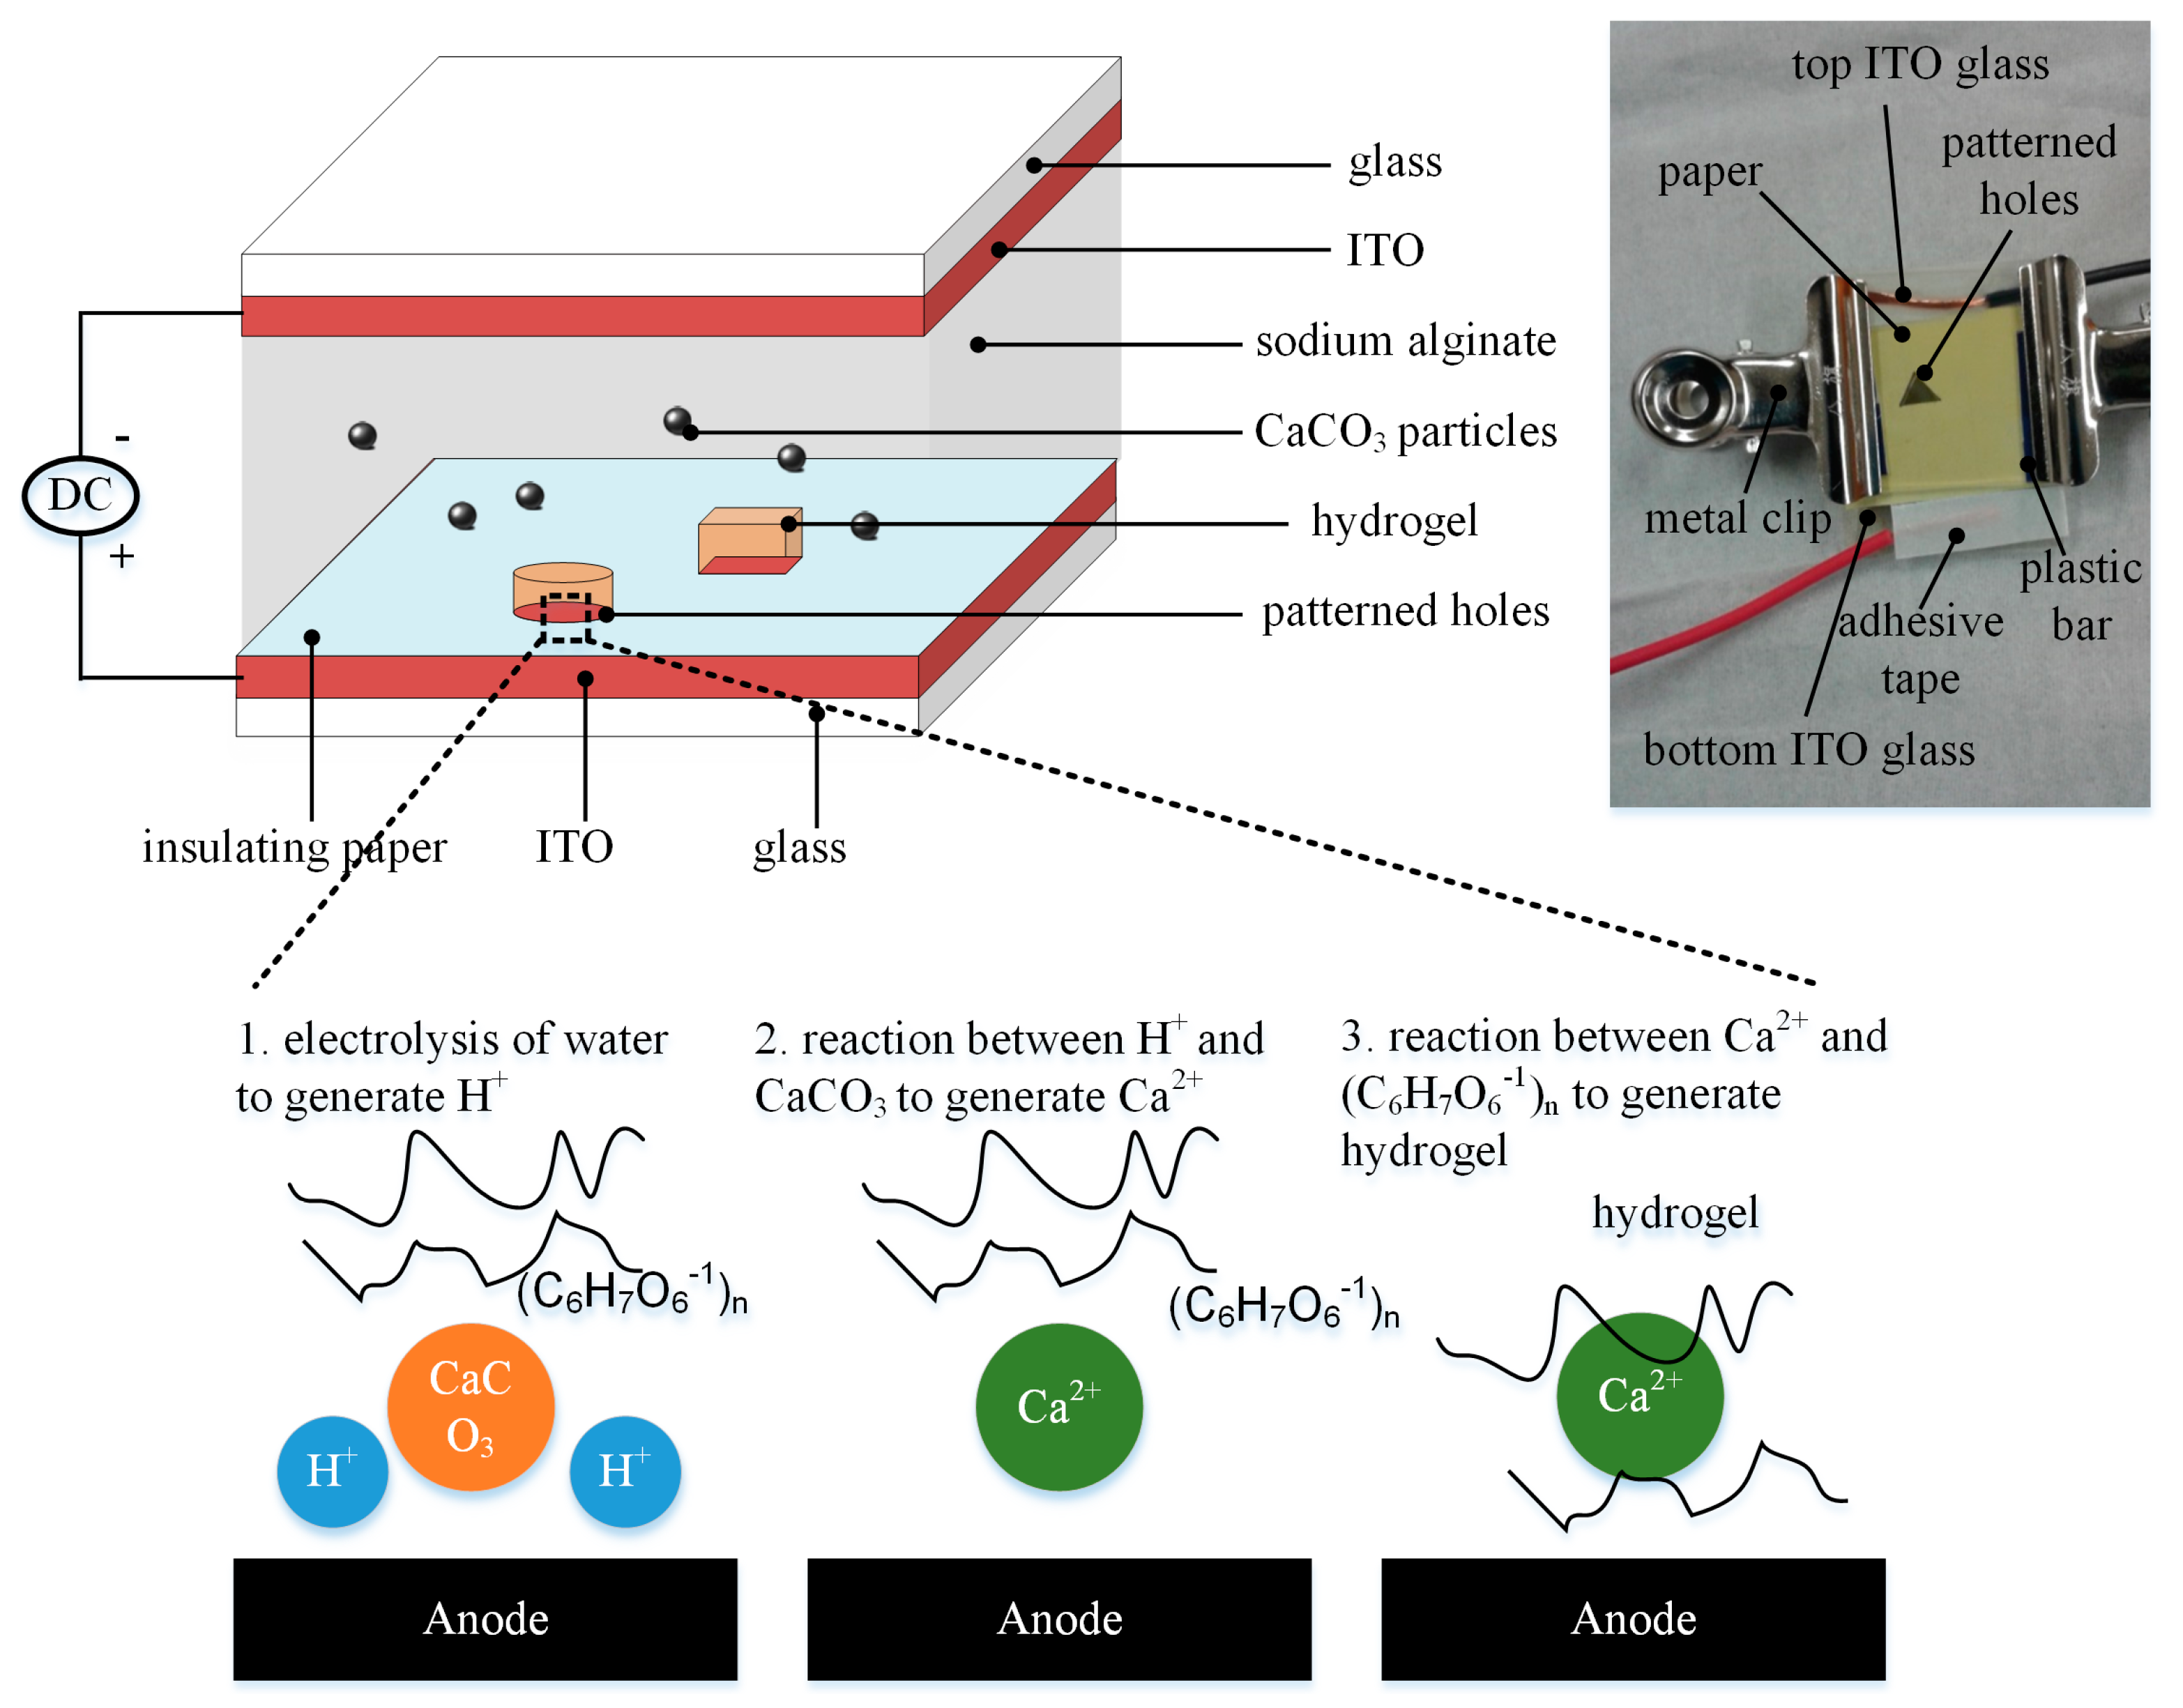
Figure 3, calcium alginate hydrogel only forms on patterned electrodes and hydrogel has the same shape as patterned electrodes. The results have demonstrated that the pattern of hydrogel has been successfully controlled by pattern of electrodes. This is because when a DC potential is applied, only the patterned holes on the bottom ITO glass would electrolyze water and generate hydrogen ions H+ and calcium ions Ca2+. According to Equation (3), Ca2+ ions are required in the process of generating calcium hydrogel. Yet, Ca2+ ions cannot be generated elsewhere except near electrodes, so hydrogel only forms on patterned holes and has the same shape as patterned holes.
Figure 3. Hydrogel of quadrangle shape observed from (a) 0°; (b) 30°; (c) 60° and (d) 90°. Hydrogel is framed by red dashed line. The scale bar is 2 mm.
Micromachines 06 01438 g003
In addition to the quadrangle shape, hydrogels with other shapes can also be fabricated by fabricating different shapes on insulated paper. As illustrated in Figure 4, we prepared the paper pattern with four various shapes, including circle, triangle, rectangle and a “C” letter, and generated the gel following the same electrodeposition process. The results in Figure 4 prove that the gel structure can be controlled easily by designing the paper’s pattern.
Figure 4. (a) Top view and (b) side view of hydrogel of triangle shape, rectangle shape and circle shape on one electrodeposition chip. (c) Top view and (d) side view of hydrogel of letter “C” shape. Hydrogel is framed by red dashed line. The scale bar is 2 mm.
Micromachines 06 01438 g004
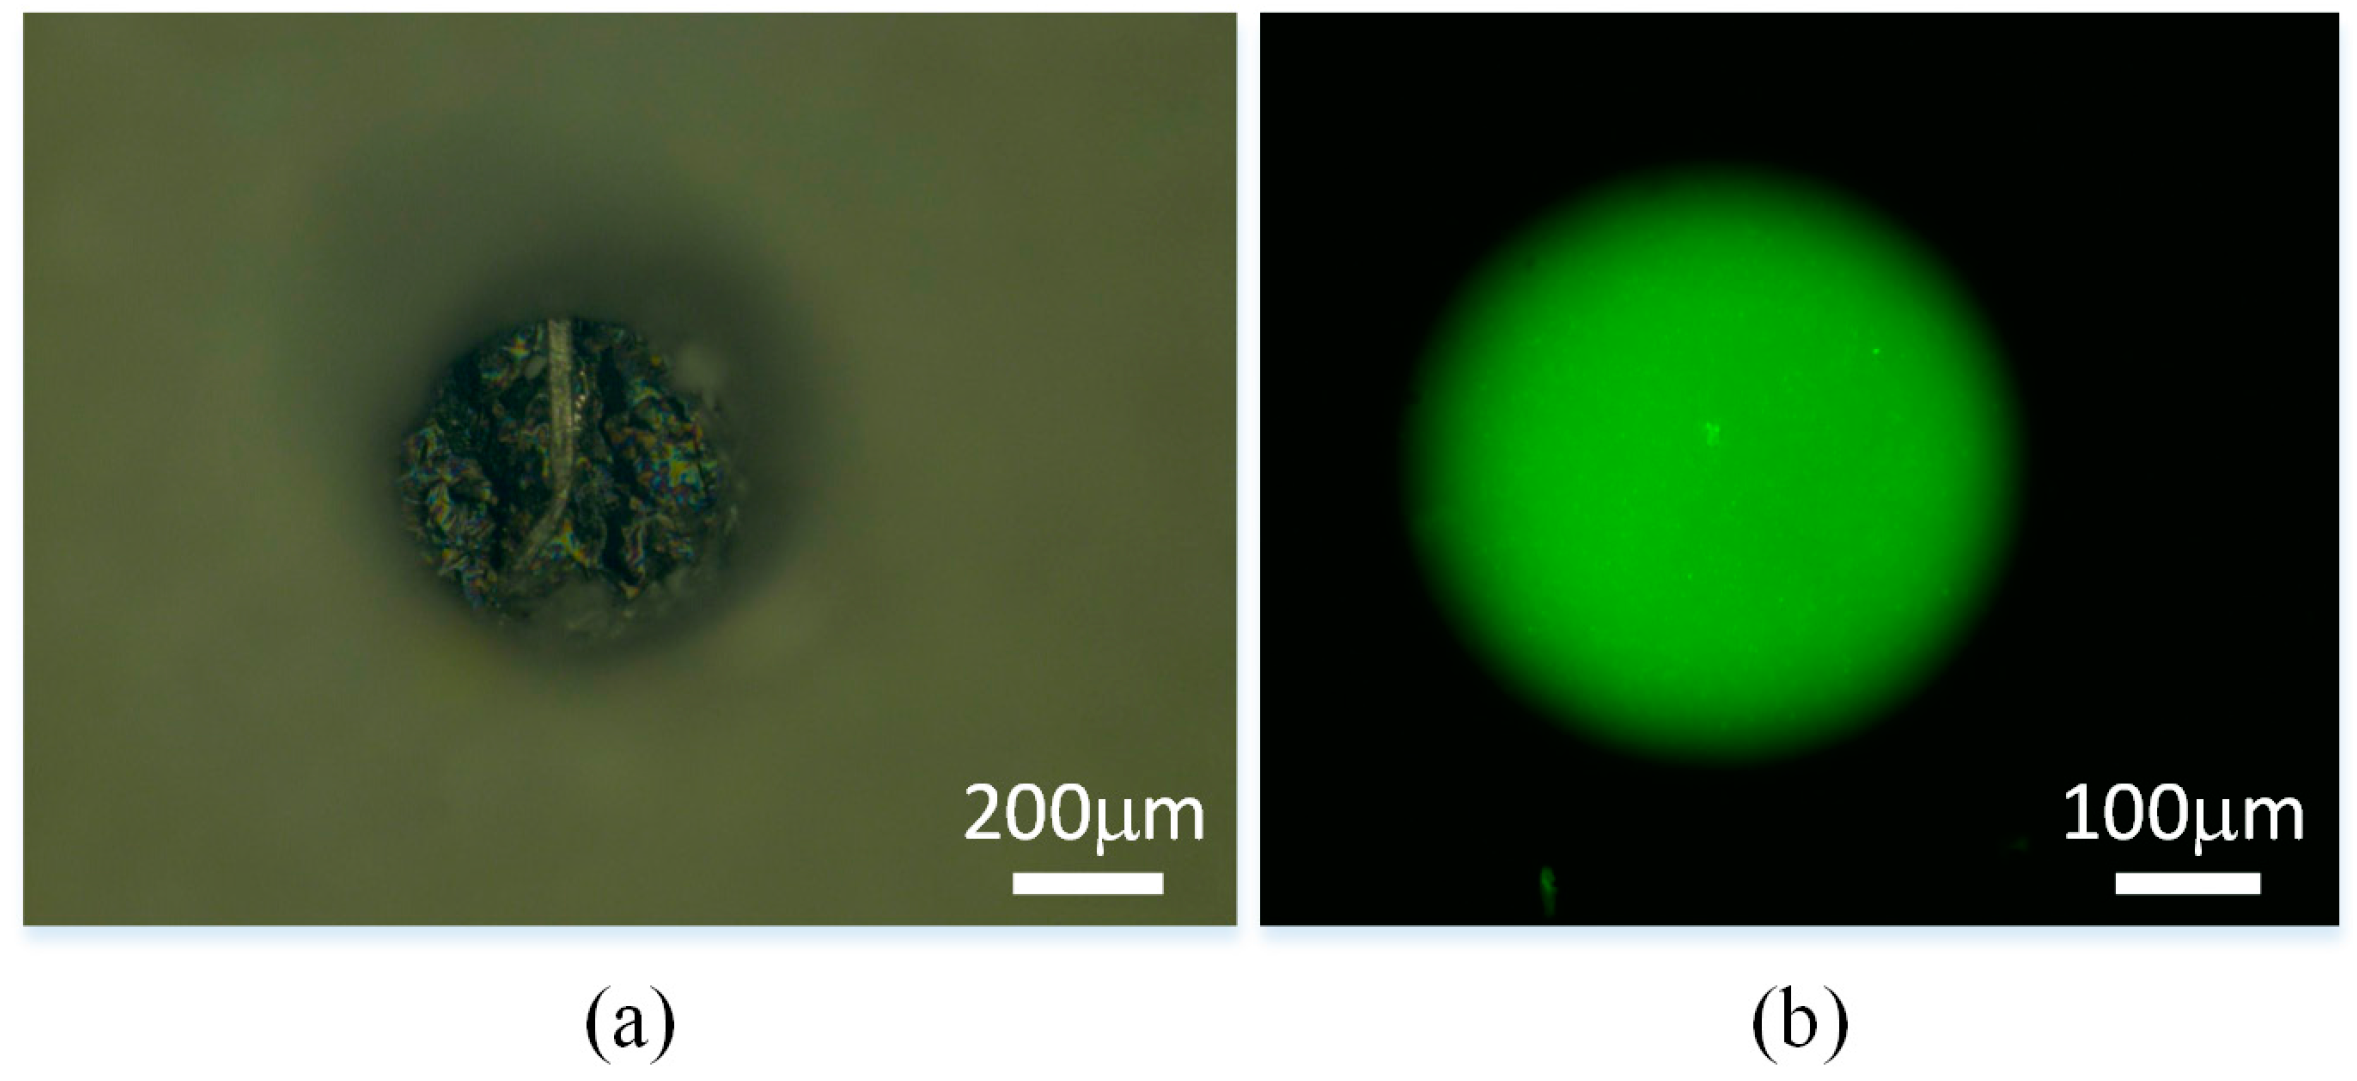
Moreover, this method is also effective for the gel generation with small size. To demonstrate that, a hole of 500 µm is punched with a needle on the paper (Figure 5a) firstly. Considering the alginate hydrogel is a highly water-contained (~98%) material, the gel with 500 µm size is very difficult to observe by optical microscope directly due to the gel’s low contrast to water. Therefore, 2 mg fluorescein 5(6)-isothiocyanate (Sigma, USA) is added into 10 mL sodium alginate solution, and the generated hydrogel is observed with a fluorescence microscope (NI-S-E, Nikon, Tokyo, Japan). As the results shown in Figure 5b, a circular hydrogel of 500 µm in diameter is achieved with accurate contour.
The above experiment results verify that this paper-based electrodeposition chip is able to control the pattern of the alginate hydrogel easily and simply. Hydrogel’s shape and size follow the holes’ shape and size. As a result, hydrogel of different patterns can be achieved by fabricating different patterns on the insulating paper.
Figure 5. (a) Punched hole of 500 µm in diameter and (b) corresponding generated hydrogel observed with fluorescence microscope.
Micromachines 06 01438 g005

3.2. Control of 3D Hydrogel’s Growth

In the previous section, hydrogel’s shapes have been demonstrated to be controllable. In this section, experiments are presented to control hydrogel’s growth, i.e., hydrogel’s height. The experimental setup is shown in Figure 1. In the experiments, the size of patterned holes is 5 mm × 5 mm. The effect of both DC potential and reaction time have been studied. Three different potentials (3.0 V, 3.2 V, 3.4 V) are used. For each potential, hydrogel’s height for different reaction time are measured. The reaction time is chosen to be 1, 2, 3 and 5 min. DC currents during electrodeposition are also measured.
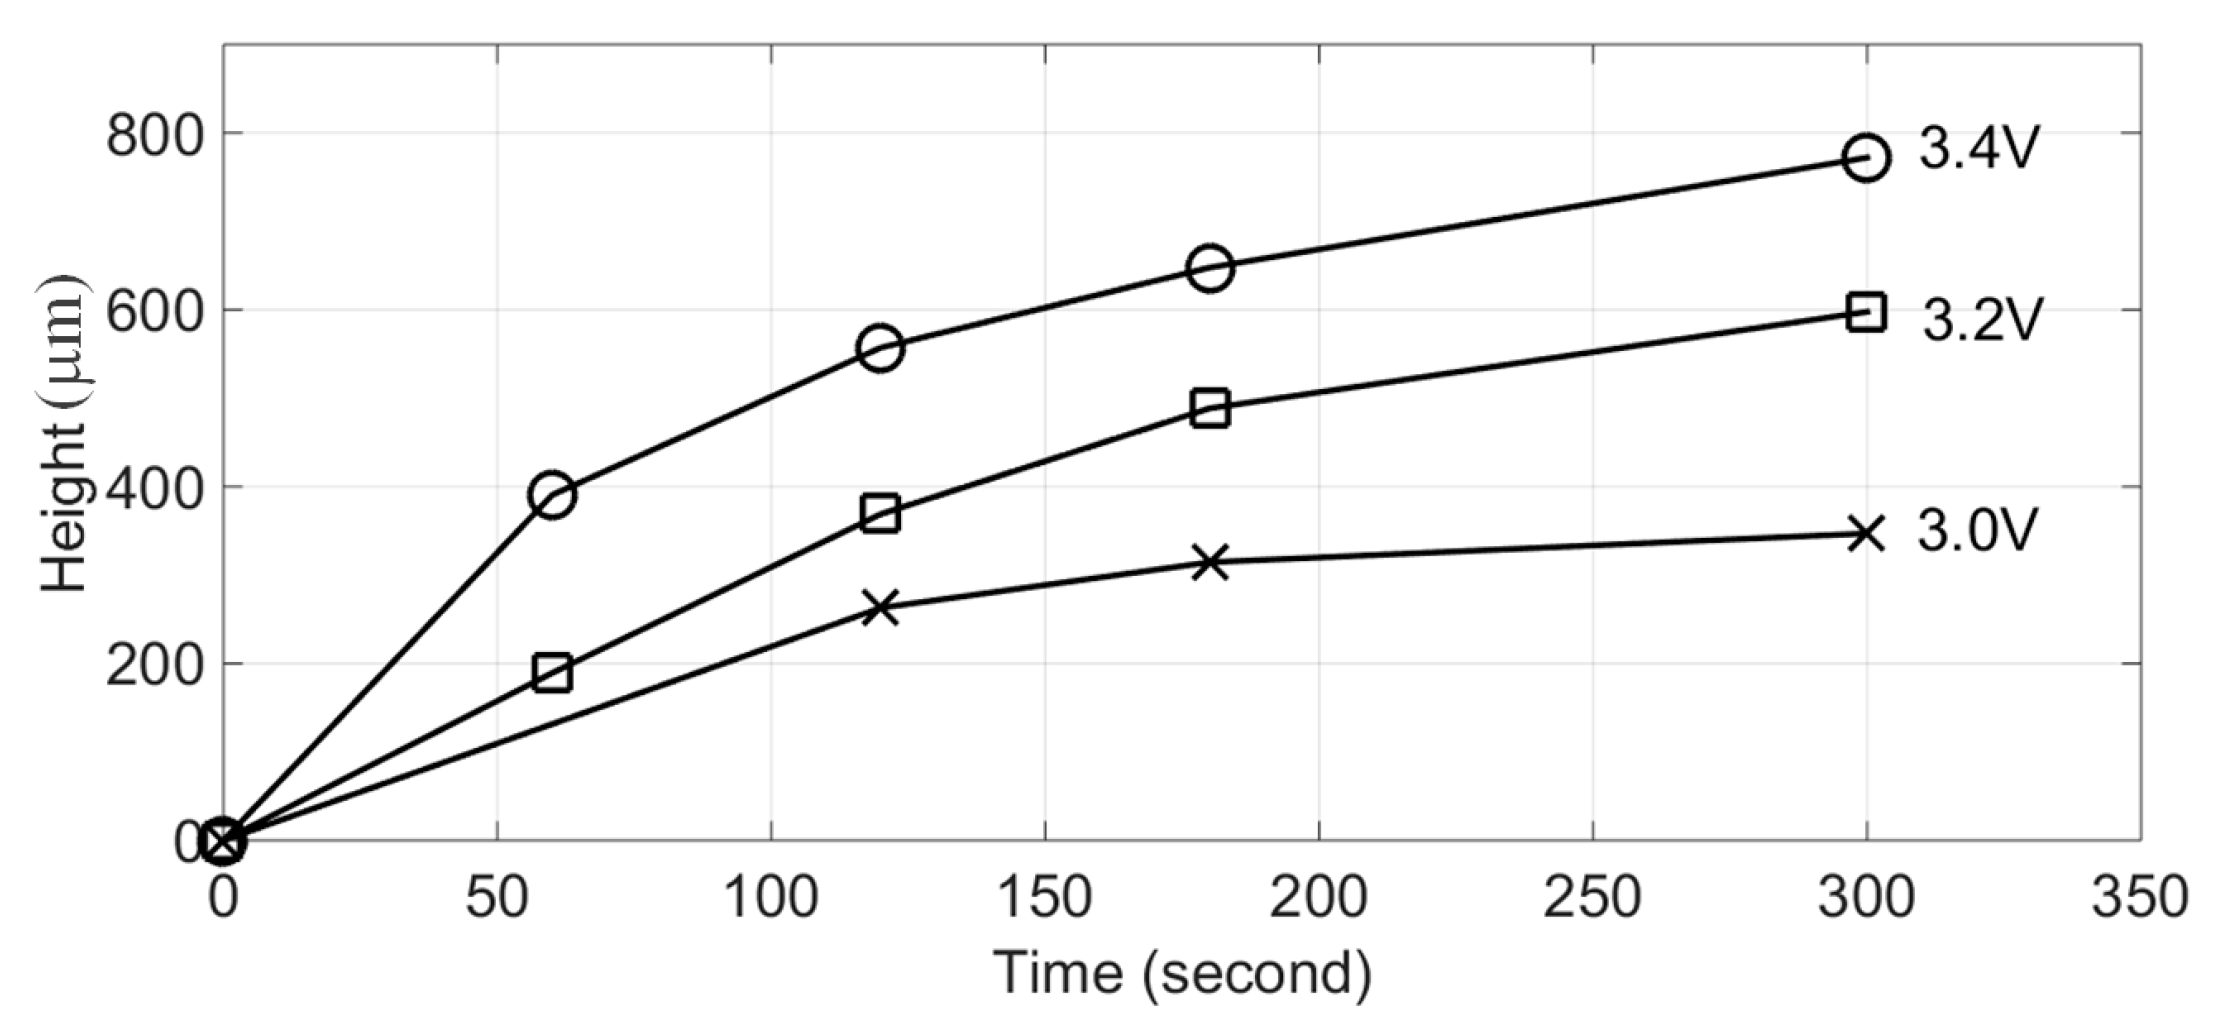
Figure 6 shows time-dependent height of hydrogel for different potentials. In addition to height, the electrodeposition current has also been measured. For each of the three potentials, electrodeposition currents (Figure 7) have been measured for three times. As was expected, longer reaction time leads to higher hydrogel. For a longer time, more H+ would be generated, and therefore more Ca2+ and calcium alginate hydrogel would be generated, so height of hydrogel would increase as time processes. However, the increase rate of hydrogel’s height decreases as time goes on. The first reason for decreasing rate is that as reaction goes on, the concentration of sodium alginate and CaCO3 particles decreases, and then the formation speed of calcium hydrogel would decrease accordingly. The second reason is that some generated hydrogel does not continue to contribute to the hydrogel’s height increase, but instead contributes to the hydrogel’s density increase.
Figure 6. Height of hydrogel for different reaction time and for different DC potential. As time goes on, the concentrations of sodium alginate and CaCO3 particles decrease, which then makes the rate of Ca2+ and hydrogel’s formation decrease. As a result, the increasing rate of hydrogel’s height decreases. The size of patterned electrode is 5 mm × 5 mm.
Micromachines 06 01438 g006
Figure 7. Electrodeposition current for different potential. For each of the three potentials, currents were measured three times. The three measured currents match each other well, which means that the repeatability of proposed 3D hydrogel patterning system is high. The used electrode is 5 mm × 5 mm in size.
Micromachines 06 01438 g007
As shown in Figure 7, the three currents for each potential match each other very well and the differences between the three currents are negligible. It means the repeatability of this 3D cell patterning system is high. From these curves, we can see that the deposition current is at their maximums in the beginning, decrease quickly at the first few seconds, and finally keep stable. The reason for the current’s decrease is that the concentration of sodium alginate and CaCO3 particles is highest at the beginning and at this stage, it is easy for generated H+ to react with CaCO3 particles. Later, as the concentration of sodium alginate and CaCO3 particles decrease, it will become more and more difficult for H+ to react with CaCO3 particles. The decreasing rate of H+ consumption would slow down the process of water’s electrolysis. Thus, the electrodeposition current decreases as time goes on.

3.3. Equivalent Electric Circuit of the Electrodeposition System

Figure 8 gives the electrodeposition system’s equivalent electric circuit. The voltage source V is the applied electrochemical potential. ED is counter potential. This counter potential includes solution’s hydrolysis potential and contact potential drop. Solution’s hydrolysis potential is the minimum potential required to electrolyze solution. The contact potential drop is caused by Warburg elements and contact resistance between wires and ITO plate. When the voltage source V is smaller than counter potential ED, chemical reaction wouldn’t happen. C1 represents the capacitor between two plate electrodes, i.e., two pieces of ITO glass. C1 is decided by the ITO glass’s size, the vertical distance between the two ITO glasses and sodium alginate solution’s permittivity. C2 represents the double layer capacitor between ITO surface and solution and is caused by electrical double layer effect. C2 appears at the interface between ITO glass’s surface and the solution adjacent to ITO glass’s surface, and is decided by solution’s permittivity and thickness of separation layer. Resistor R1 is the equivalent series resistance of C1. Resistor R2 includes the equivalent series resistance of C2 and solution’s resistance. Resistor R3 includes power supply’s internal resistance and wires’ resistance. Unlike usual electrodeposition system with rod electrodes, a capacitor (C1) should be added to represent the plate electrodes’ capacitance.
According to Figure 8, the following equations can be achieved:
{ V E D I R 3 = I 1 R 1 + U 1 I 1 R 1 + U 1 = I 2 R 2 + U 2 I 1 = C 1 d U 1 d t I 2 = C 2 d U 2 d t I = I 1 + I 2
where U1 and U2 are capacitor C1 and C2’s voltage respectively.
Figure 8. The equivalent circuit of the electrodeposition system for hydrogel. V is the applied voltage. ED is counter potential, includes solution’s hydrolysis potential and contact potential drop. C1 represents the capacitor between two plate electrodes. C2 represents the double layer capacitor between ITO surface and solution. Resistor R1 is the equivalent series resistance of C1. Resistor R2 includes the equivalent series resistance of C2 and solution’s resistance. Resistor R3 includes power supply’s internal resistance and wires’ resistance.
Micromachines 06 01438 g008
As we can see in Equation (4), because of R3, current I1 and I2 are coupled together. In order to simplify the calculation and be able to derive an analytical solution/expression for Equation (4), R3 is set to be zero. R3 represents the sum of power supply’s internal resistance and wires’ resistance, so its value is small. In addition, as we can see in Figure 9, the deposition current decreases as time goes on. As a result, setting R3 to be zero would have less and less effect on the accuracy of the built equivalent circuit. After R3 has been set to be zero, the analytical solution for Equation (4) can be given by the following equation:
{ I = V E D R 1 e 1 R 1 C 1 t + V E D R 2 e 1 R 2 C 2 t I 1 = V E D R 1 e 1 R 1 C 1 t I 2 = V E D R 2 e 1 R 2 C 2 t
Figure 9. Measured electrodeposition currents and predicted currents by equivalent circuit for different applied potential. The mean absolute differences between measured currents and predicted currents for DC potentials 3.0, 3.2 and 3.4 V are 0.1776, 0.3037 and 0.5776 A/m2, respectively. The results demonstrate that the predicated currents and measured currents match well. Thus, the built equivalent circuit is justified.
Micromachines 06 01438 g009
Following the process of building an equivalent circuit for the electrodeposition system and deriving an analytical solution for the equivalent circuit, the next step is to calculate parameters in the analytical solution, i.e., Equation (5). Those parameters that need to be calculated include counter potential ED, capacitor C1 and C2, resistor R1 and R2. After those parameters have been computed, the correctness should be tested. In Figure 9, electrodeposition current for three different DC potentials have been measured. Electrodeposition currents for potential 3.4 and 3.2 V will be used to compute parameters and electrodeposition currents for potential 3.0 V will be used to justify the correctness of parameters computation.
Counter potential ED is first computed. When DC potential is initially applied to the electrodeposition cell, the capacitor can be seen as short-circuited. Thus, the equivalent circuit in Figure 8 can be regarded as a circuit only with resistors at the beginning of applying DC potential. This means that the ratio of applied potential minus counter potential to initial electrodeposition current is a constant, which is the equivalent resistance of the built circuit at the instant DC potential is applied. Thereby, the following equation can be achieved:
V 2 E D J d 2 _ 0 S = V 3 E D J d 3 _ 0 S
where applied potential V2, V3 are 3.2 and 3.4 V, respectively; Jd2_0 and Jd3_0 are the initial electrodeposition current density for potential 3.2 and 3.4 V, respectively; S is the anode’s area. Then, the counter potential ED can be achieved as following:
E D = 2.750   V
Next, the electrodeposition current for potential 3.2 and 3.4 V are processed with Matlab’s curve fitting box, and the two currents are expressed as the following equations:
J 2 d = 5.396 × 10 5 e 0.04653 t + 3.126 × 10 5 e 0.002626 t A / m 2
J 3 d = 7.632 × 10 5 e 0.05291 t + 5.640 × 10 5 e 0.002401 t A / m 2
According to Equations (8) and (9), two set of those four parameters: capacitor C1 and C2, resistor R1 and R2, can be achieved, and their values are determined through arithmetic mean value of the two set of results. The results are shown in Table 1. Therefore, the decomposition current can be expressed as:
J = V E D S R 1 e 1 R 1 C 1 t + V E D S R 2 e 1 R 2 C 2 t = V 2.75 0.1296 e 0.002466 t + V 2.75 0.0843 e 0.04948 t
After the expression for electrodeposition current is achieved, their validity can be examined by compared the current got by theory with the current got by experiments. Figure 9 gives the current given by the built equivalent circuit and the current measured during experiments. The mean absolute differences ɛ3.0, ɛ3.2, ɛ3.4 between measured currents and predicted currents for DC potentials 3.0, 3.2 and 3.4 V are:
ε 3.0 = 0.1776 A/m 2
ε 3.2 = 0.3037 A/m 2
ε 3.4 = 0.5776 A/m 2
The results in Figure 9 show that currents by built equivalent circuit and currents by experiments match each other well. This good match justifies the equivalent circuit. Although the overall match between predicted currents and measured currents is very good, the initial difference between them is relatively large. One reason is that resistor R3 is set to be zero to decouple the two differential equations related to the two capacitors in Figure 8, respectively. In addition, other elements, e.g., inductor, affecting the transient state of the equivalent circuit are not considered in the equivalent circuit, which would also result in initial errors.
Table 1. Parameters achieved by curve fitting and the final decided value for parameters in built circuit model.
ParameterR1 (Ω)C1 (F)R2 (Ω)C2 (F)
Group 157586.612 × 10−233356.442 × 10−3
Group 246099.034 × 10−234075.548 × 10−3
Decided value51847.823 × 10−233715.995 × 10−3

3.4. Hydrogel’s Growth Model

As is shown in Equations (1)–(3), the generated mass of hydrogel is proportional to generated number H+. Because generated number of H+ is proportional to the number of electric charges, then the mass of hydrogel is proportional to the number of electric charges, which can be expressed as the following equation:
M = ρ S h = l Q = l J S d t
where ρ is hydrogel’s density; S is hydrogel’s area and h is hydrogel’s height; l is a constant and Q is electric charges; J is current density. Therefore:
h = l J d t ρ
Equation (10) gives the electrodeposition current, which can be divided into two charging currents of capacitors. However, only one charging current contributes to hydrogel’s formation. Capacitor C1’s charging current wouldn’t go through solution, as charges would gather on the two ITO glasses and wouldn’t go through the solution between the two ITO glasses. Thus, only capacitor C2’s charging current contributes Hydrogel’s formation. Then hydrogel’s expression can be achieved by substituting C2’s charging current to Equation (15), and hydrogel’s height can be expressed as the following equation:
h = l S V 2.75 0.0843 e 0.0495 t d t ρ = k ( V 2.75 ) ( 1 e 0.04948 t )
where k is constant that need to be calculated and V is electrochemical potential.
Next, hydrogel’s height for potential 3.2 and 3.4 V are processed with Matlab’s curve fitting box. The calculate k for these two potentials are given in Table 2. The final k is chosen as the mean value of the two calculated k.
Table 2. Constants computed by experiments with 3.2 V and 3.4 V and final mean value for the constant.
Voltage3.2 V3.4 VMean Value
k168617651725.5
Then hydrogel’s height can be given in the following equation:
h = 1725.5 ( V 2.75 ) ( 1 e 0.04948 t )   μm
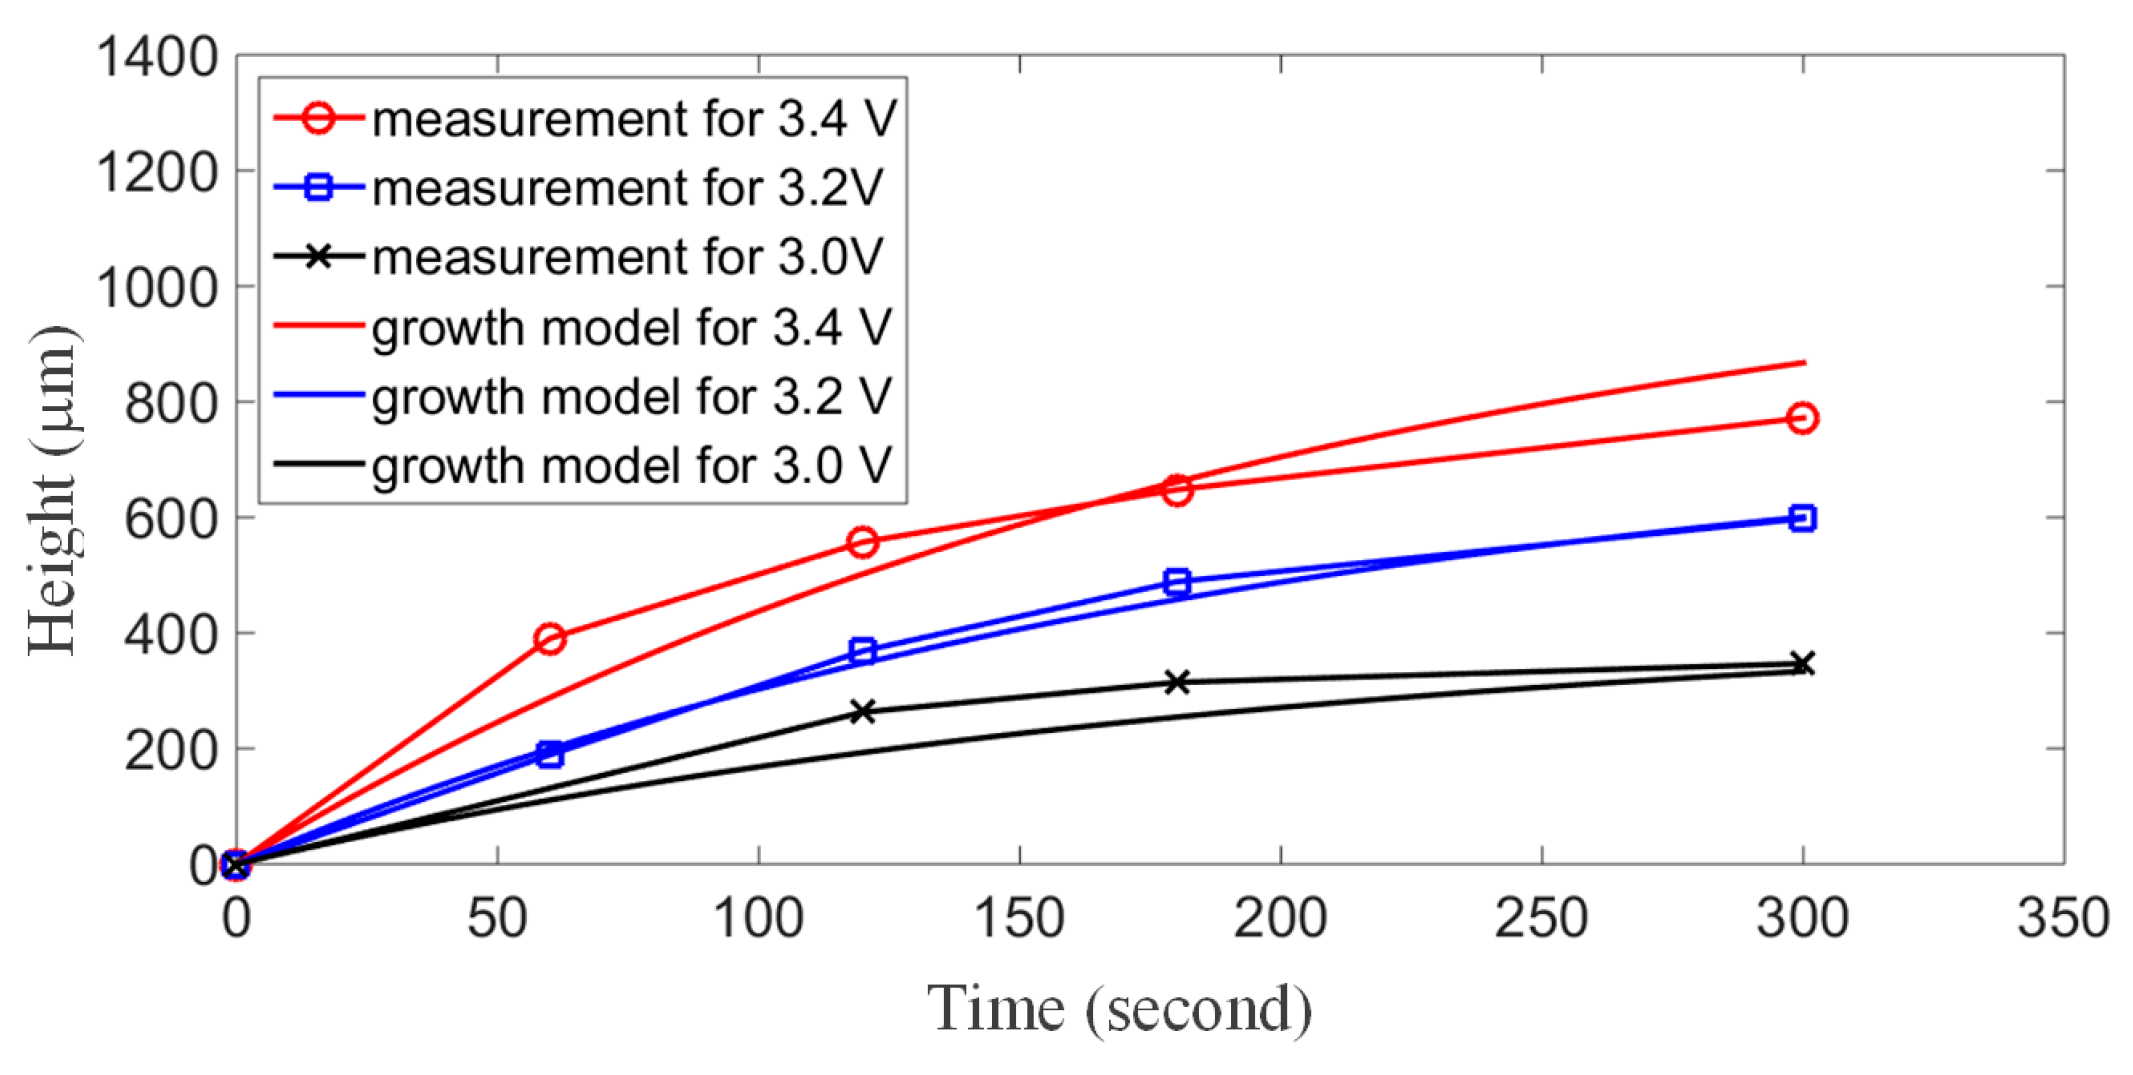
Figure 10 gives hydrogel’s height given by growth model and hydrogel’s height measured during experiments. Overall, hydrogel’s growth model can predict hydrogel growth well. One reason for errors between model and experiments is that during deducing Equation (14), we assume that hydrogel’s height over the area is the same. However, hydrogel’s height over the area is not the same with hydrogel’s center being highest.
Figure 10. Hydrogel’s height given by hydrogel’s growth model and measured during experiments. The results demonstrate that hydrogel’s growth model can reflect the overall change of hydrogel’s height over time.
Micromachines 06 01438 g010

4. Discussion

Construction of 3D gel with a controllable manner is essentially significant in biomedical and tissue engineering. This paper reports a novel paper-based electrodeposition chip to address the above issue. In this approach, the alginate hydrogel’s shapes can be controlled by the paper’s shapes, and the hydrogel’s height can be controlled by applied DC electrochemical potential and reaction time. As a result, the structure of the alginate hydrogel can be constructed flexibly and controllably. In addition, this method is fast, as hydrogel can form within 1 min.
The chemical reaction equation predicate that the generation speed of the gel is proportional to the applied current density. However, in the real practice, the method of controlling the DC voltage is much easier from the view of experimental setup. To make our research is more practical, therefore, we studied the growth of the hydrogel with respect to the applied voltage. The results indicate that the increase rate of hydrogel’s height decreases as time goes on under a constant applied voltage. The reasons for decreasing rate are that the concentration of sodium alginate and CaCO3 particles decrease as reaction goes on, and that some generated hydrogel does not continue to contribute to the hydrogel’s height increase, but instead contributes to the hydrogel’s density increase.
To elucidate the mechanism further, a circuit model was built for the electrodeposition system and the hydrogel’s growth model is built to predict hydrogel’s height change. Unlike the traditional electrodeposition system, the solution is specific and the closely parallel electrodes are used. Therefore, it can be seen that calculated counter potential 2.75 V is larger than the traditional hydrolysis potential 1.26 V. We think this difference may be caused from two reasons: Firstly, in our experiment, expect for water, the solution also contains sodium alginate and CaCO3 particle, which may result in a different electrical property. Secondly, this calculated 2.75 V potential includes not only the solution’s hydrolysis potential and but also contact potential drop. The contact potential drop is caused by Warburg impedance element and contact resistance between wires and ITO plate. This result fit well with our experiment results, and it will help us to understand the electrodeposition process better and provide a guidance for the controllable hydrogel’s growth.
As one of the most common materials in our daily life, the paper has shown hydrogel’s extreme advances in biomedical engineering nowadays, including low cost, simplicity, high availability and so on. For instance, regular commercial papers have been used to fabricate immunoassay analyzer, microfluidic devices and paper-based electronics [29,30,31]. In this research, we developed a paper-based electrodeposition chip for the gel generation. This method only requires an insulating layer to fabricate patterned electrodes, which it is very cheap and simple. Comparing with the electrodes fabrication in cleaning room, the methods of fabricating holes on the paper is much easily and with multi-choices. For instance, in this paper, we can fabricate the small holes by punching and the big shape by cutting easily. Moreover, if we want to fabricate patterns on the paper precisely, we can employ a professional programmable machine [28].
Overall, this paper-based electrodeposition chip provides a new sight for the controllable 3D gel pattern. We believe it would be an important complement to current 3D gel construction method, and benefit the biomedical field, especially due to its high usability. In future work, we will try to a programmable way to control the structure of the gel and apply this system on the study of gel growth and drug test.

5. Conclusions

This paper proposes an easy and simple method for 3D hydrogel patterning by developing a paper-based electrodeposition chip. In this method, an insulating layer with patterned holes is used to pattern calcium alginate hydrogel through electrodeposition. The results demonstrated that patterns of hydrogel would follow the shape of patterned holes precisely, including the patterns with quadrangle, triangle, circle, and letter “C” shape and patterns with different size. In addition, the height of formed hydrogel can be controlled by DC potential during electrodeposition. To elucidate the gel growth mechanism and control the gel growth better, a circuit model and a hydrogel growth model are also built, which match the experimental results well. Comparing with other techniques, this approach has the advantages of low-cost, high usability, fast and high flexibility. We believe it would be an important complement to current 3D gel construction method, and benefit the biomedical field, especially due to its high usability. In the future, we will try to a programmable way to control the structure of the gel and apply this system on the study of gel growth and drug test.

Acknowledgments

This work was supported by the National Natural Science Foundation of China 61403323, and the GRF of Hong Kong 9042218.

Author Contributions

Wenfeng Wan and Gaole Dai contributed equally to this paper. Wenfeng Wan and Gaole Dai did the experiment and drafted the paper. Wenfeng Wan and Lijun Zhang built the equivalent circuit of the electrodeposition system. Yajing Shen designed the experiment and supervised the experiments and the writing.

Conflicts of Interest

The authors declare no conflict of interest.

References

  1. Tibbitt, M.W.; Anseth, K.S. Hydrogels as extracellular matrix mimics for 3D cell culture. Biotechnol. Bioeng. 2009, 103, 655–663. [Google Scholar] [CrossRef] [PubMed]
  2. Huh, D.; Hamilton, G.A.; Ingber, D.E. From 3D cell culture to organs-on-chips. Trends Cell Biol. 2011, 21, 745–754. [Google Scholar] [CrossRef] [PubMed]
  3. Petersen, O.W.; Rønnov-Jessen, L.; Howlett, A.R.; Bissell, M.J. Interaction with basement membrane serves to rapidly distinguish growth and differentiation pattern of normal and malignant human breast epithelial cells. Proc. Natl. Acad. Sci. USA 1992, 89, 9064–9068. [Google Scholar] [CrossRef] [PubMed]
  4. Baharvand, H.; Hashemi, S.M.; Kazemi Ashtian, S.; Farrokhi, A. Differentiation of human embryonic stem cells into hepatocytes in 2D and 3D culture systems in vitro. Int. J. Dev. Biol. 2006, 50, 645–652. [Google Scholar] [CrossRef] [PubMed]
  5. Lee, J.; Cuddihy, M.J.; Kotov, N.A. Three-dimensional cell culture matrices: State of the art. Tissue Eng. B Rev. 2008, 14, 61–86. [Google Scholar] [CrossRef] [PubMed]
  6. Ozawa, F.; Ino, K.; Takahashi, Y.; Shiku, H.; Matsue, T. Electrodeposition of alginate gels for construction of vascular-like structures. J. Biosci. Bioeng. 2013, 115, 459–461. [Google Scholar] [CrossRef] [PubMed]
  7. Wang, Z.; Zhang, X.; Gu, J.; Yang, H.; Nie, J.; Ma, G. Electrodeposition of alginate/chitosan layer-by-layer composite coatings on titanium substrates. Carbohydr. Polym. 2014, 103, 38–45. [Google Scholar] [CrossRef] [PubMed]
  8. Zhao, Y.; Gao, S.; Zhao, S.; Li, Y.; Cheng, L.; Li, J.; Yin, Y. Synthesis and characterization of disulfide-crosslinked alginate hydrogel scaffolds. Mater. Sci. Eng. C 2012, 32, 2153–2162. [Google Scholar] [CrossRef]
  9. Bissell, M.J.; Hall, H.G.; Parry, G. How does the extracellular matrix direct gene expression? J. Theor. Biol. 1982, 99, 31–68. [Google Scholar] [CrossRef]
  10. Watt, F.M.; Huck, W.T.S. Role of the extracellular matrix in regulating stem cell fate. Nat. Rev. Mol. Cell Biol. 2013, 14, 467–473. [Google Scholar] [CrossRef] [PubMed]
  11. Asphahani, F.; Zhang, M. Cellular impedance biosensors for drug screening and toxin detection. Analyst 2007, 132, 835–841. [Google Scholar] [CrossRef] [PubMed]
  12. Pancrazio, J.J.; Whelan, J.P.; Borkholder, D.A.; Ma, W.; Stenger, D.A. Development and application of cell-based biosensors. Ann. Biomed. Eng. 1999, 27, 697–711. [Google Scholar] [CrossRef] [PubMed]
  13. Bose, S.; Vahabzadeh, S.; Bandyopadhyay, A. Bone tissue engineering using 3D printing. Mater. Today 2013, 16, 496–504. [Google Scholar] [CrossRef]
  14. L’Heureux, N.; Dusserre, N.; Konig, G.; Victor, B.; Keire, P.; Wight, T.N.; Chronos, N.A.F.; Kyles, A.E.; Gregory, C.R.; Hoyt, G.; et al. Human tissue-engineered blood vessels for adult arterial revascularization. Nat. Med. 2006, 12, 361–365. [Google Scholar] [CrossRef] [PubMed]
  15. Sergeeva, N.S.; Britaev, T.A.; Sviridova, I.K.; Akhmedova, S.A.; Kirsanova, V.A.; Popov, A.A.; Antokhin, A.I.; Frank, G.A.; Kaprin, A.D. Scleractinium coral aquaculture skeleton: A possible 3D scaffold for cell cultures and bone tissue engineering. Bull. Exp. Biol. Med. 2014, 156, 504–508. [Google Scholar] [CrossRef] [PubMed]
  16. Folch, A.; Jo, B.H.; Hurtado, O.; Beebe, D.J.; Toner, M. Microfabricated elastomeric stencils for micropatterning cell cultures. J. Biomed. Mater. Res. 2000, 52, 346–353. [Google Scholar] [CrossRef]
  17. Choi, J.H.; Lee, H.; Jin, H.K.; Bae, J.S.; Kim, G.M. Micropatterning of neural stem cells and purkinje neurons using a polydimethylsiloxane (PDMS) stencil. Lab Chip 2012, 12, 5045–5050. [Google Scholar] [CrossRef] [PubMed]
  18. Nakanishi, J.; Kikuchi, Y.; Takarada, T.; Nakayama, H.; Yamaguchi, K.; Maeda, M. Photoactivation of a substrate for cell adhesion under standard fluorescence microscopes. J. Am. Chem. Soc. 2004, 126, 16314–16315. [Google Scholar] [CrossRef] [PubMed]
  19. Grogan, S.P.; Pauli, C.; Chen, P.; Du, J.; Chung, C.B.; Kong, S.D.; Colwell, C.W., Jr.; Lotz, M.K.; Jin, S.; D’Lima, D.D. In situ tissue engineering using magnetically guided three-dimensional cell patterning. Tissue Eng. C Methods 2012, 18, 496–506. [Google Scholar] [CrossRef] [PubMed]
  20. Liu, N.; Liang, W.; Liu, L.; Wang, Y.; Mai, J.D.; Lee, G.B.; Li, W.J. Extracellular-controlled breast cancer cell formation and growth using non-UV patterned hydrogels via optically-induced electrokinetics. Lab Chip 2014, 14, 1367–1376. [Google Scholar] [CrossRef] [PubMed]
  21. Sawkins, M.J.; Shakesheff, K.M.; Bonassar, L.; Kirkham, G.R. 3D cell and scaffold patterning strategies in tissue engineering. Recent Pat. Biomed. Eng. 2013, 6, 3–21. [Google Scholar] [CrossRef]
  22. Fusco, S.; Chatzipirpiridis, G.; Sivaraman, K.M.; Ergeneman, O.; Nelson, B.J.; Pane, S. Chitosan electrodeposition for microrobotic drug delivery. Adv. Healthc. Mater. 2013, 2, 1037–1044. [Google Scholar] [CrossRef] [PubMed]
  23. Wu, L.Q.; Lee, K.; Wang, X.; English, D.S.; Losert, W.; Payne, G.F. Chitosan-mediated and spatially selective electrodeposition of nanoscale particles. Langmuir 2005, 21, 3641–3646. [Google Scholar] [CrossRef]
  24. Peters, C.; Fusco, S.; Li, Y.; Kühne, S.; Nelson, B.; Hierold, C. Backside liquid phase photolithography for fabricating self-organizing hydrogel bilayers. Procedia Eng. 2012, 47, 1219–1222. [Google Scholar] [CrossRef]
  25. Wu, L.Q.; Yi, H.; Li, S.; Rubloff, G.W.; Bentley, W.E.; Ghodssi, R.; Payne, G.F. Spatially selective deposition of a reactive polysaccharide layer onto a patterned template. Langmuir 2003, 19, 519–524. [Google Scholar] [CrossRef]
  26. Cheng, Y.; Luo, X.; Tsao, C.Y.; Wu, H.C.; Betz, J.; Payne, G.F.; Bentley, W.E.; Rubloff, G.W. Biocompatible multi-address 3D cell assembly in microfluidic devices using spatially programmable gel formation. Lab Chip 2011, 11, 2316–2318. [Google Scholar] [CrossRef] [PubMed]
  27. Cheng, Y.; Luo, X.; Betz, J.; Payne, G.F.; Bentley, W.E.; Rubloff, G.W. Mechanism of anodic electrodeposition of calcium alginate. Soft Matter 2011, 7, 5677–5684. [Google Scholar] [CrossRef]
  28. Glavan, A.C.; Martinez, R.V.; Maxwell, E.J.; Subramaniam, A.B.; Nunes, R.M.; Soh, S.; Whitesides, G.M. Rapid fabrication of pressure-driven open-channel microfluidic devices in omniphobic RF paper. Lab Chip 2013, 13, 2922–2930. [Google Scholar] [CrossRef] [PubMed]
  29. Badu-Tawiah, A.K.; Lathwal, S.; Kaastrup, K.; Al-Sayah, M.; Christodouleas, D.C.; Smith, B.S.; Whitesides, G.M.; Sikes, H.D. Polymerization-based signal amplification for paper-based immunoassays. Lab Chip 2015, 15, 655–659. [Google Scholar] [CrossRef] [PubMed]
  30. Lessing, J.; Glavan, A.C.; Walker, S.B.; Keplinger, C.; Lewis, J.A.; Whitesides, G.M. Inkjet printing of conductive inks with high lateral resolution on omniphobic “RF paper” for paper-based electronics and mems. Adv. Mater. 2014, 26, 4677–4682. [Google Scholar] [CrossRef] [PubMed]
  31. Thuo, M.M.; Martinez, R.V.; Lan, W.J.; Liu, X.; Barber, J.; Atkinson, M.B.; Bandarage, D.; Bloch, J.F.; Whitesides, G.M. Fabrication of low-cost paper-based microfluidic devices by embossing or cut-and-stack methods. Chem. Mater. 2014, 26, 4230–4237. [Google Scholar] [CrossRef]

