
Improving the Thickness Uniformity of Micro Gear by Multi-Step, Self-Aligned Lithography and Electroforming


Abstract
:1. Introduction
2. Experimental
2.1. Simulation
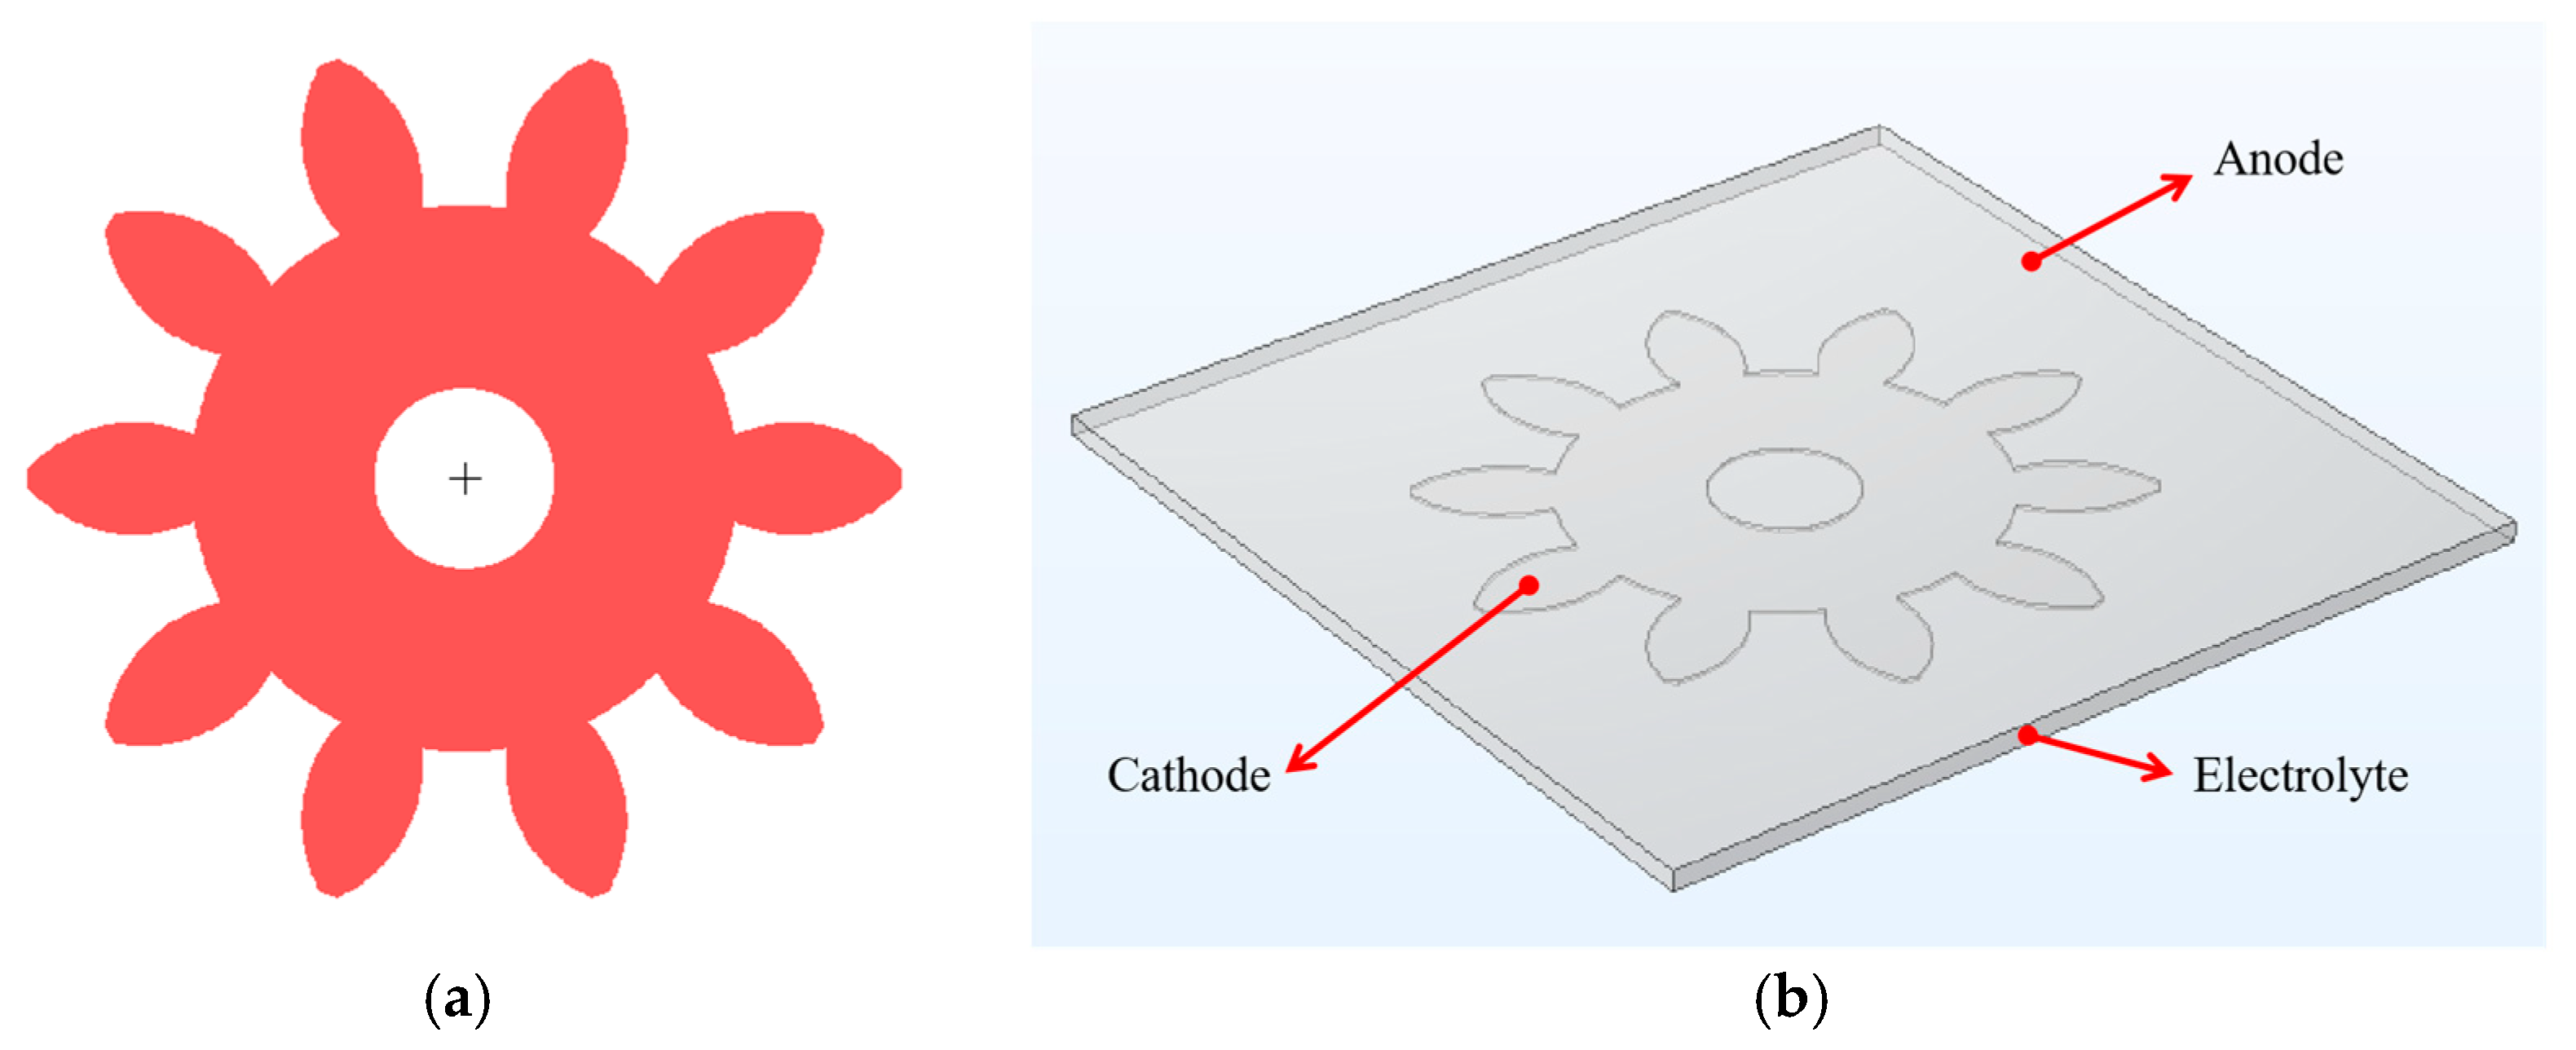
2.1.1. Geometric Model
2.1.2. Electroforming Model
2.2. Experimental Conditions
2.3. Experimental Methods and Processes
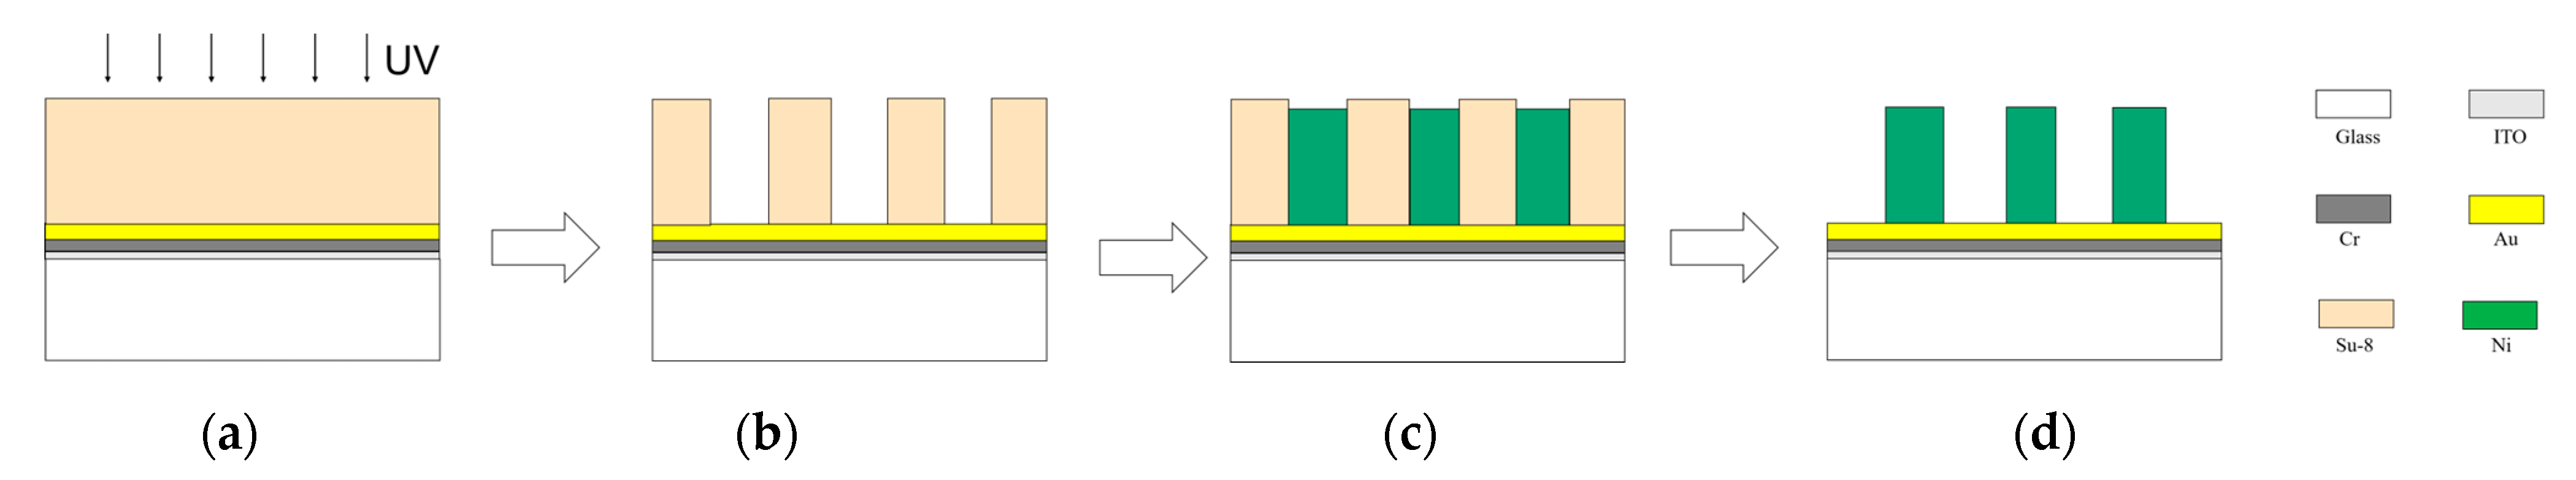
2.3.1. Fabrication Process of the Traditional Fabrication Method
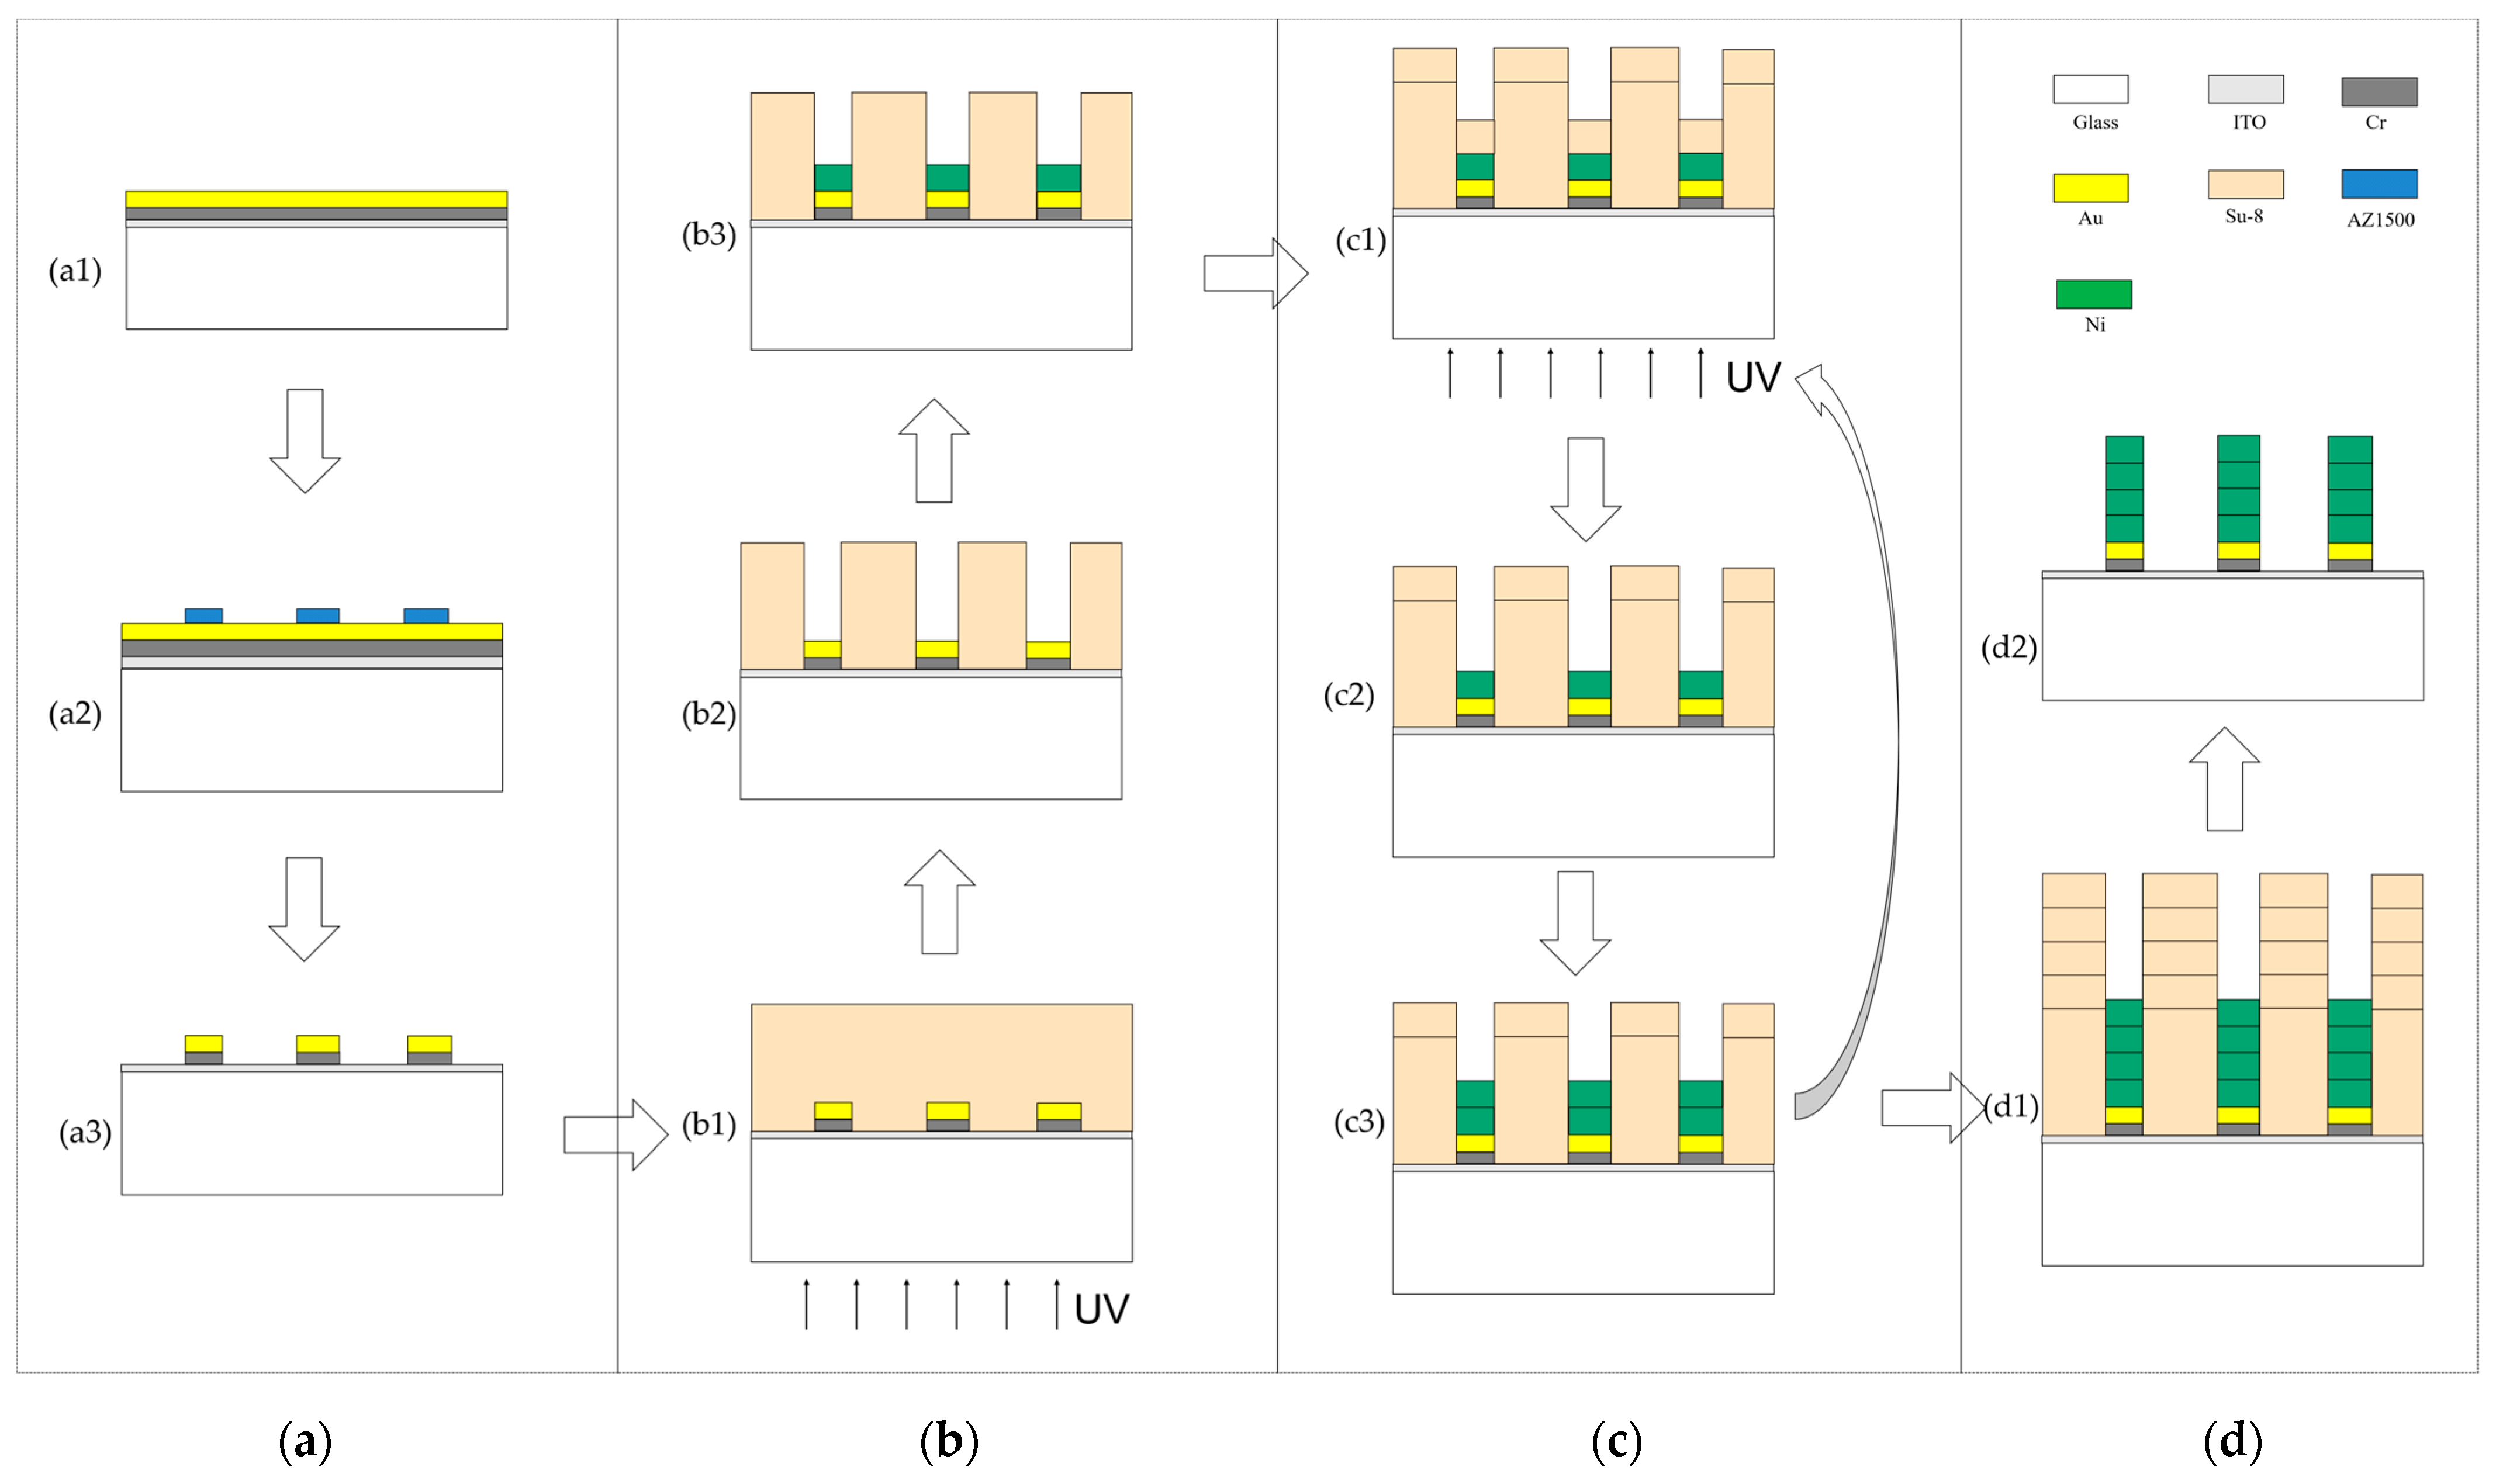
2.3.2. Fabrication Process of the Proposed Fabrication Method
2.4. Measurements
3. Results and Discussion
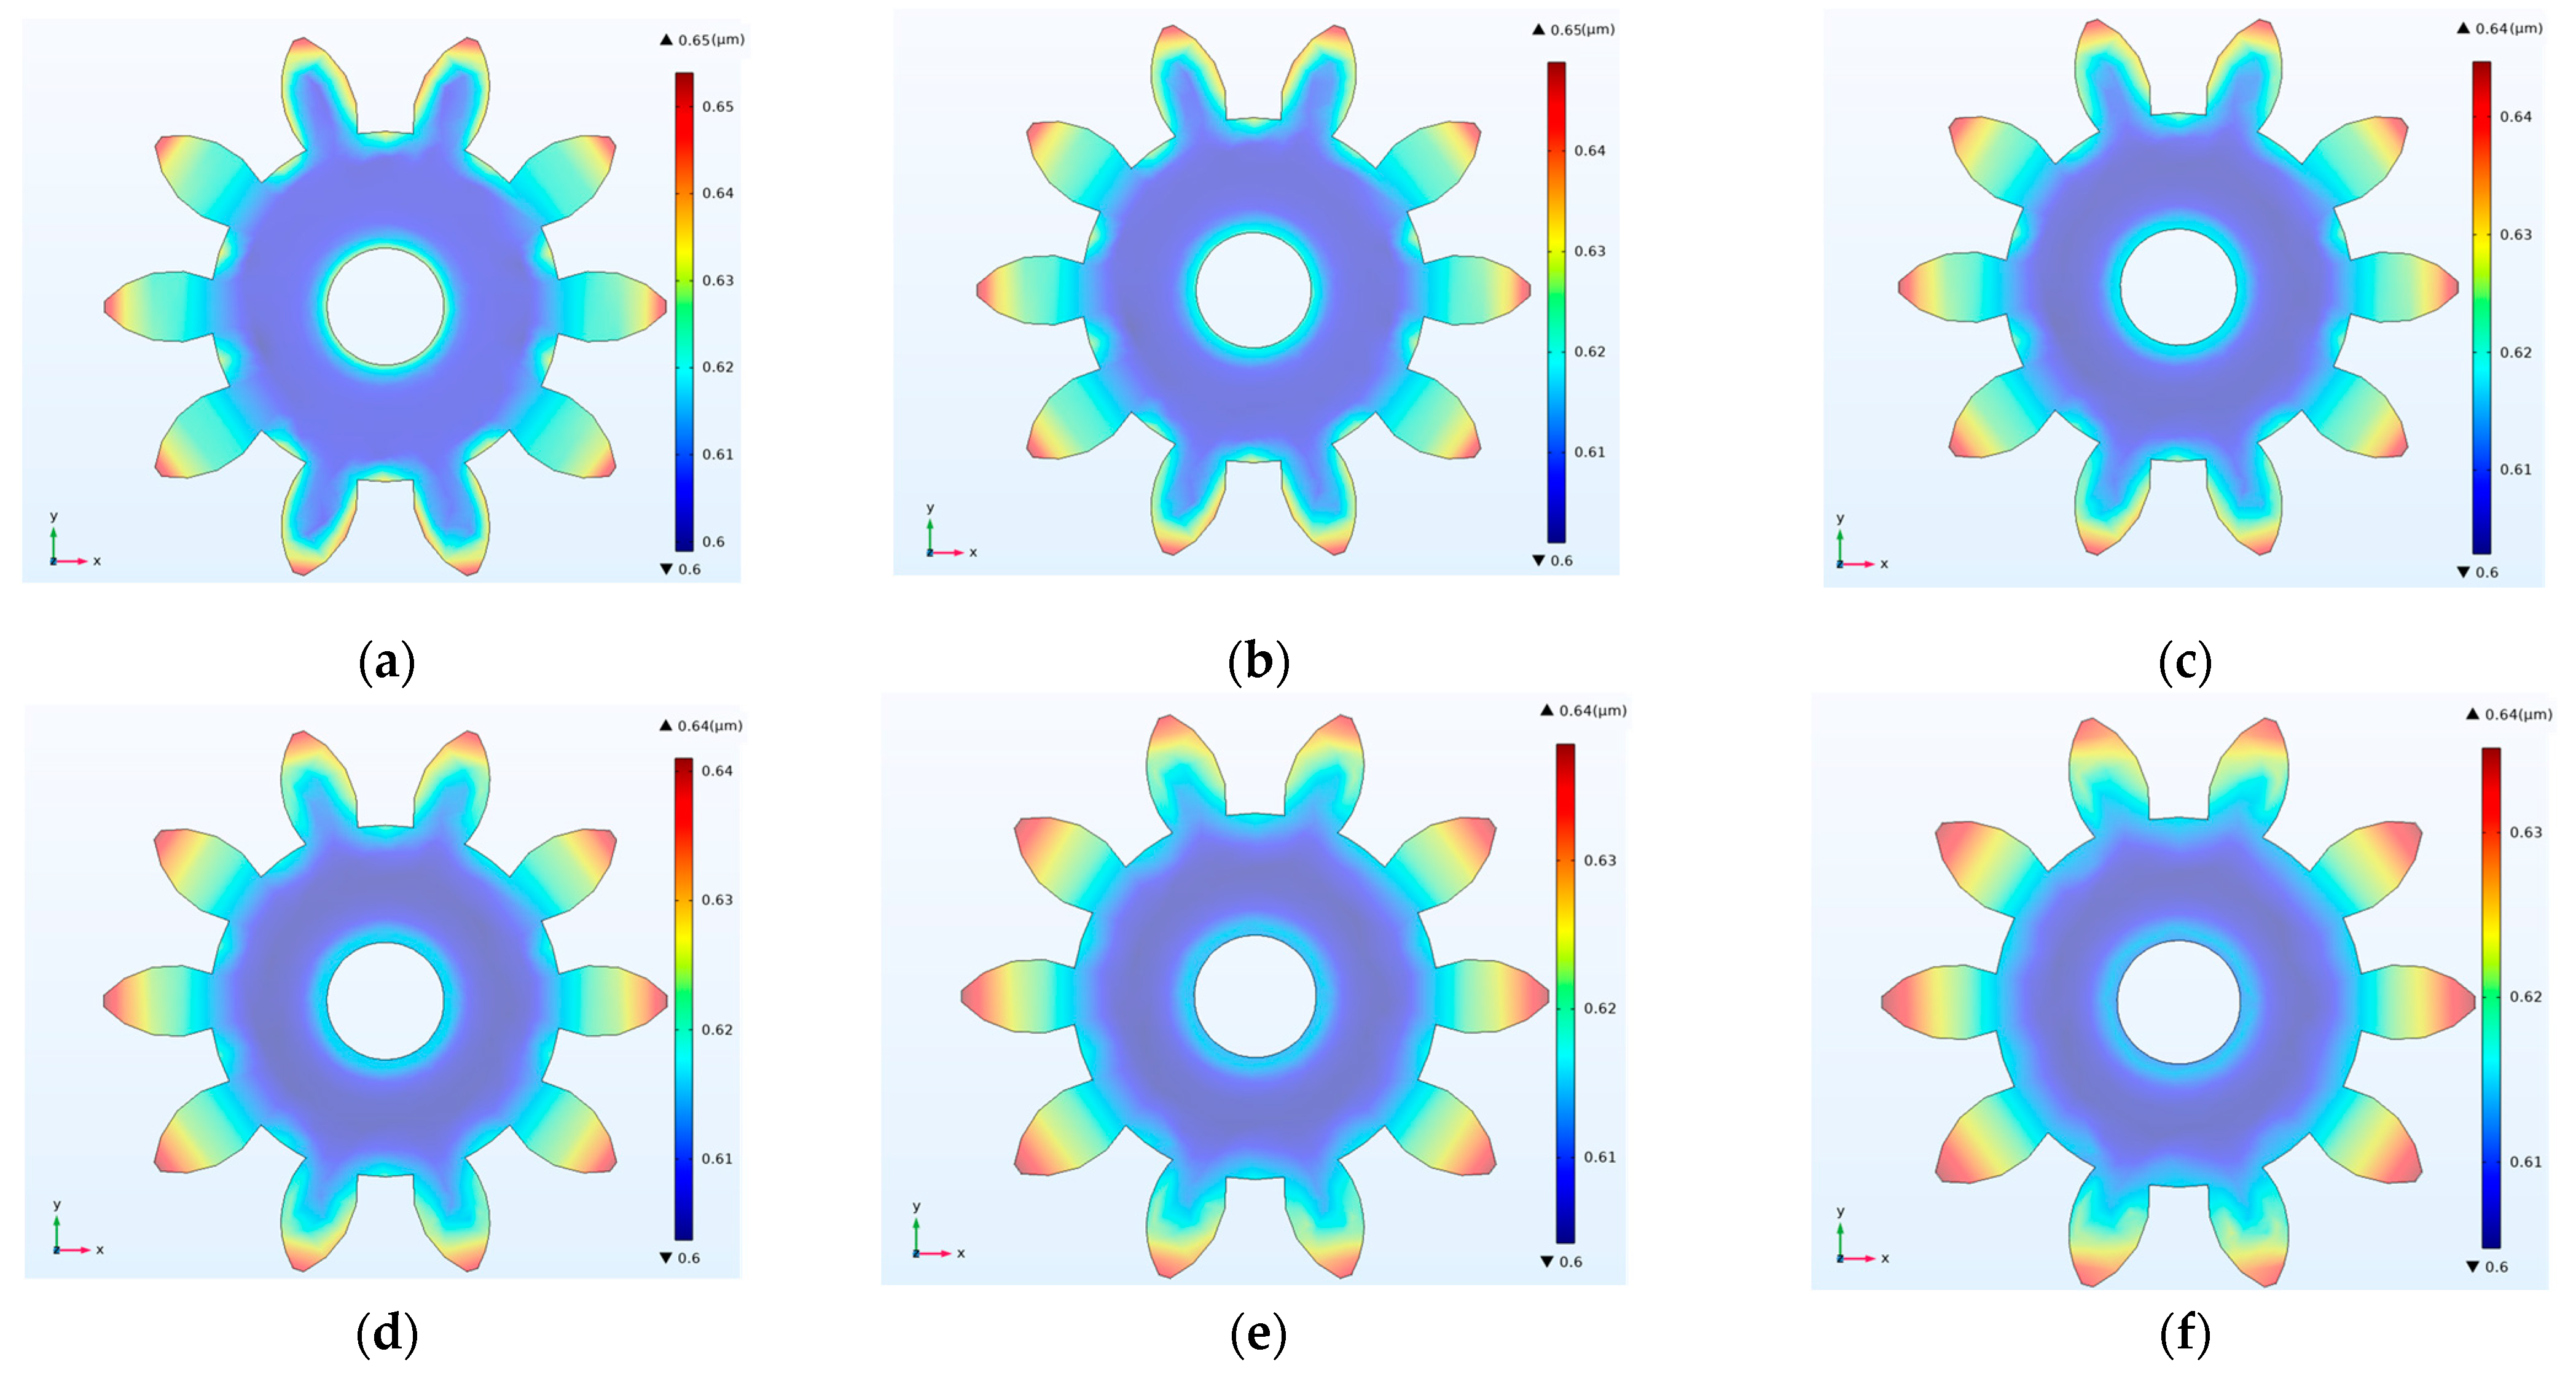
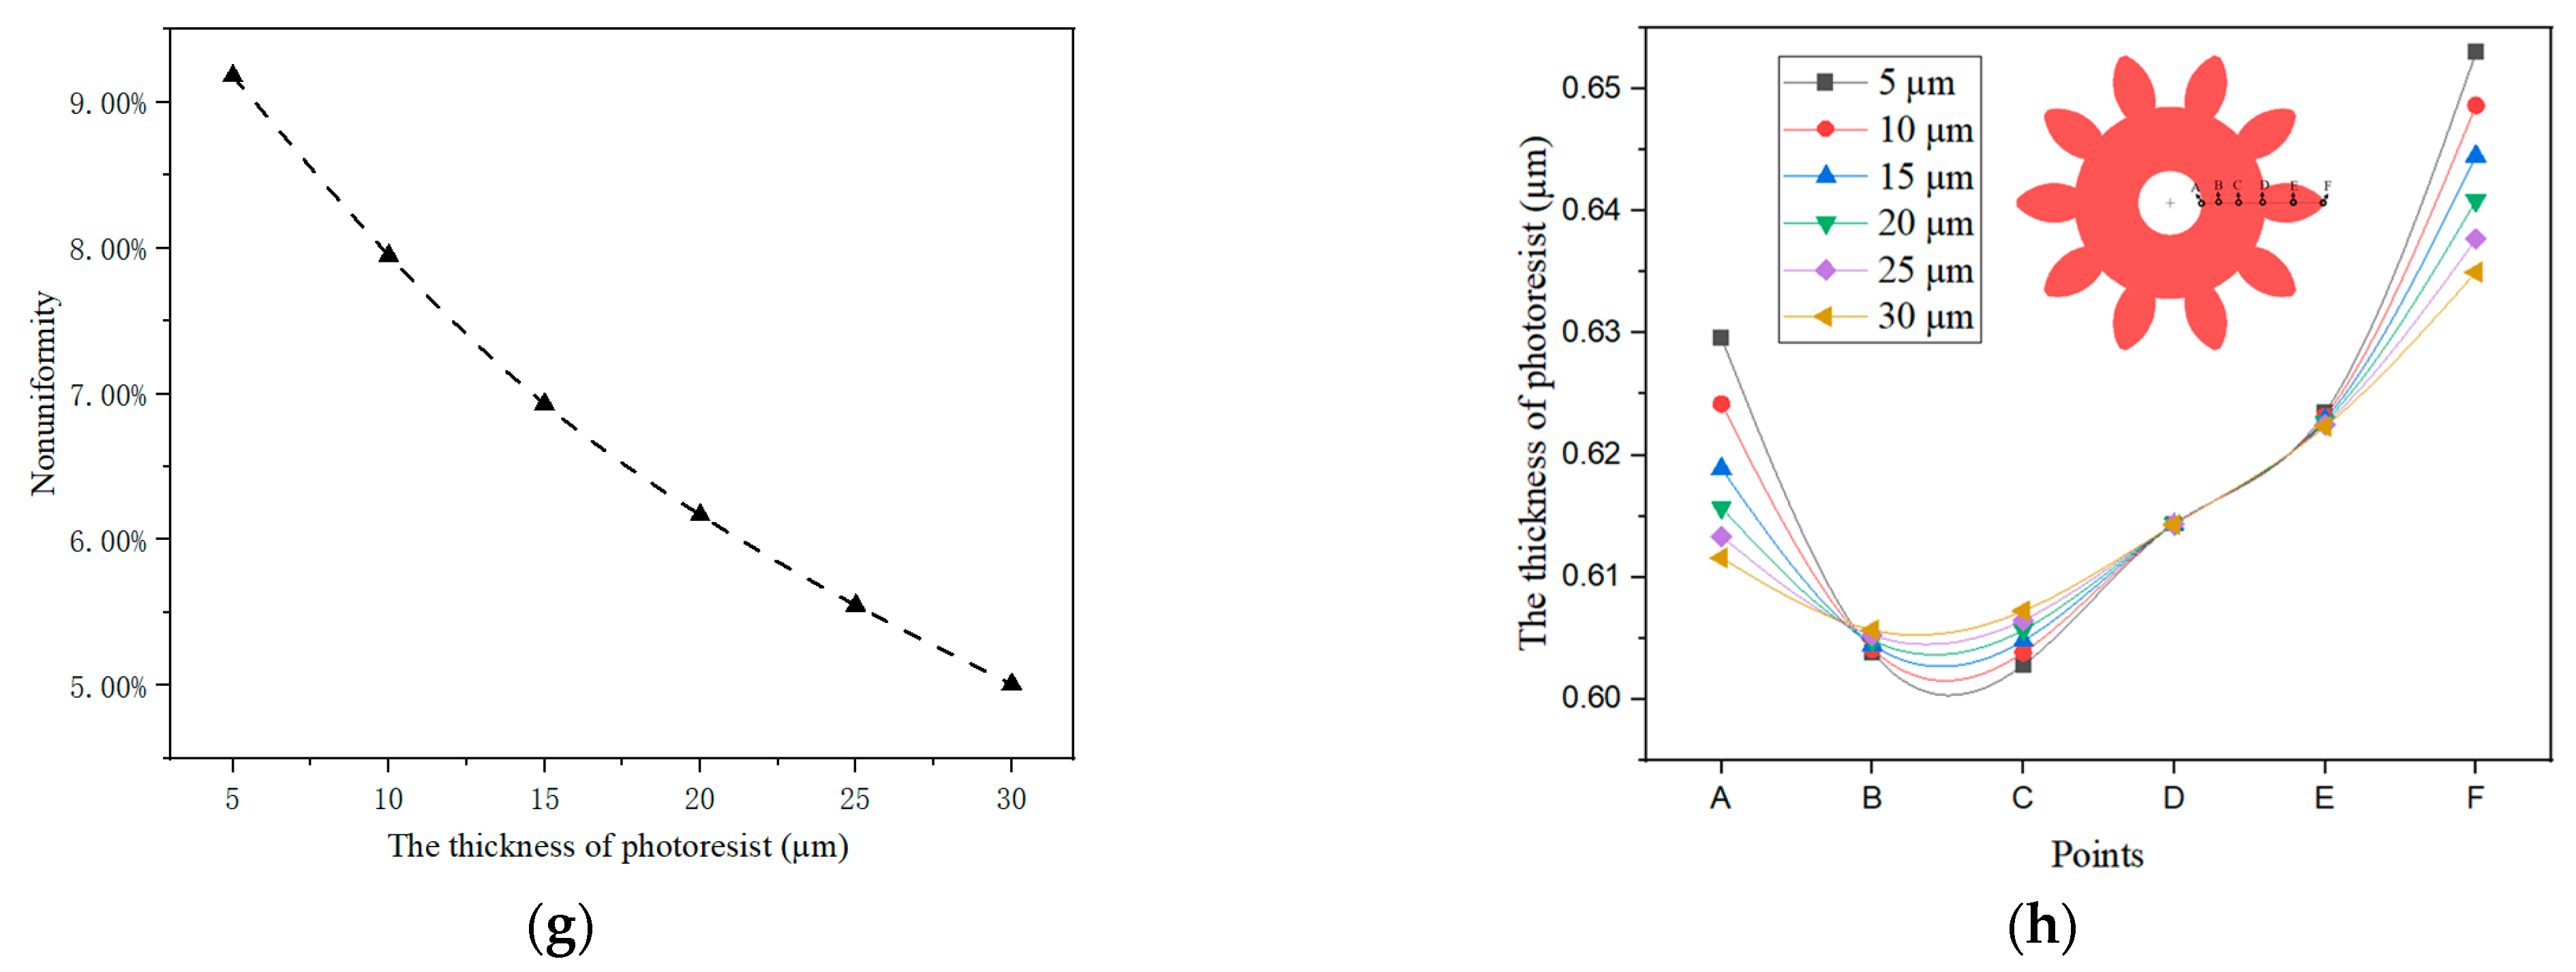
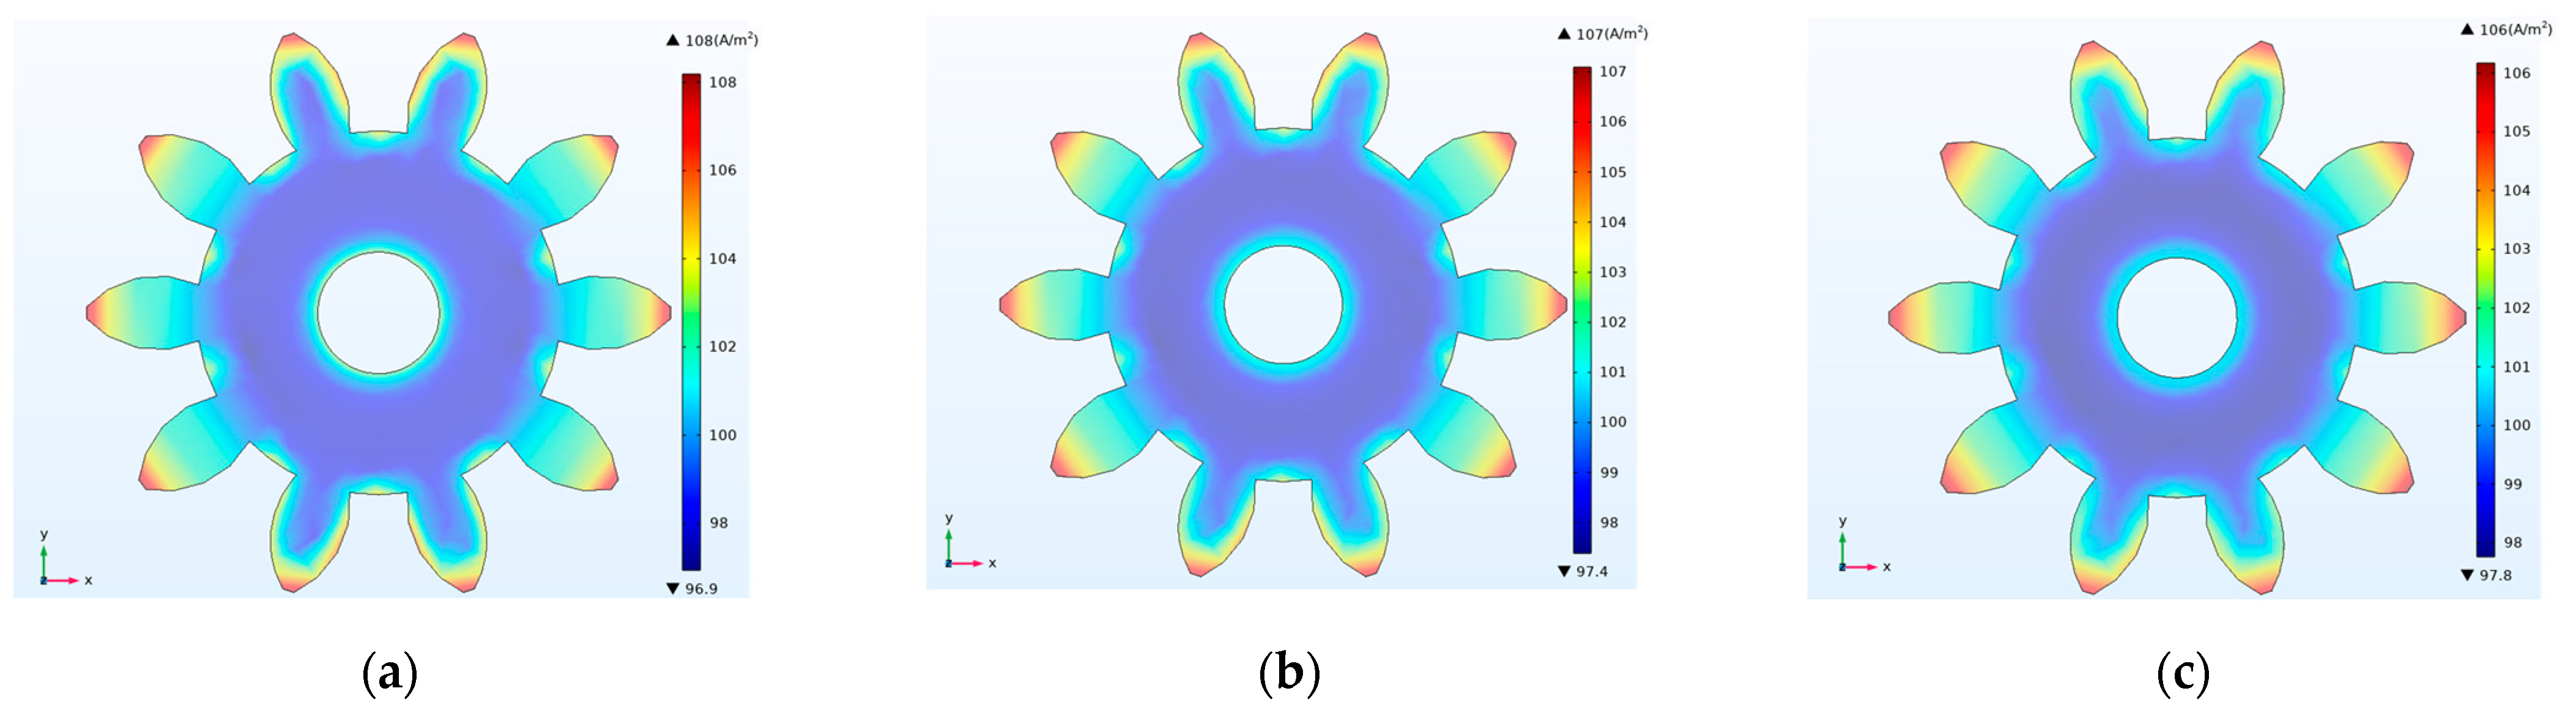
3.1. Simulation
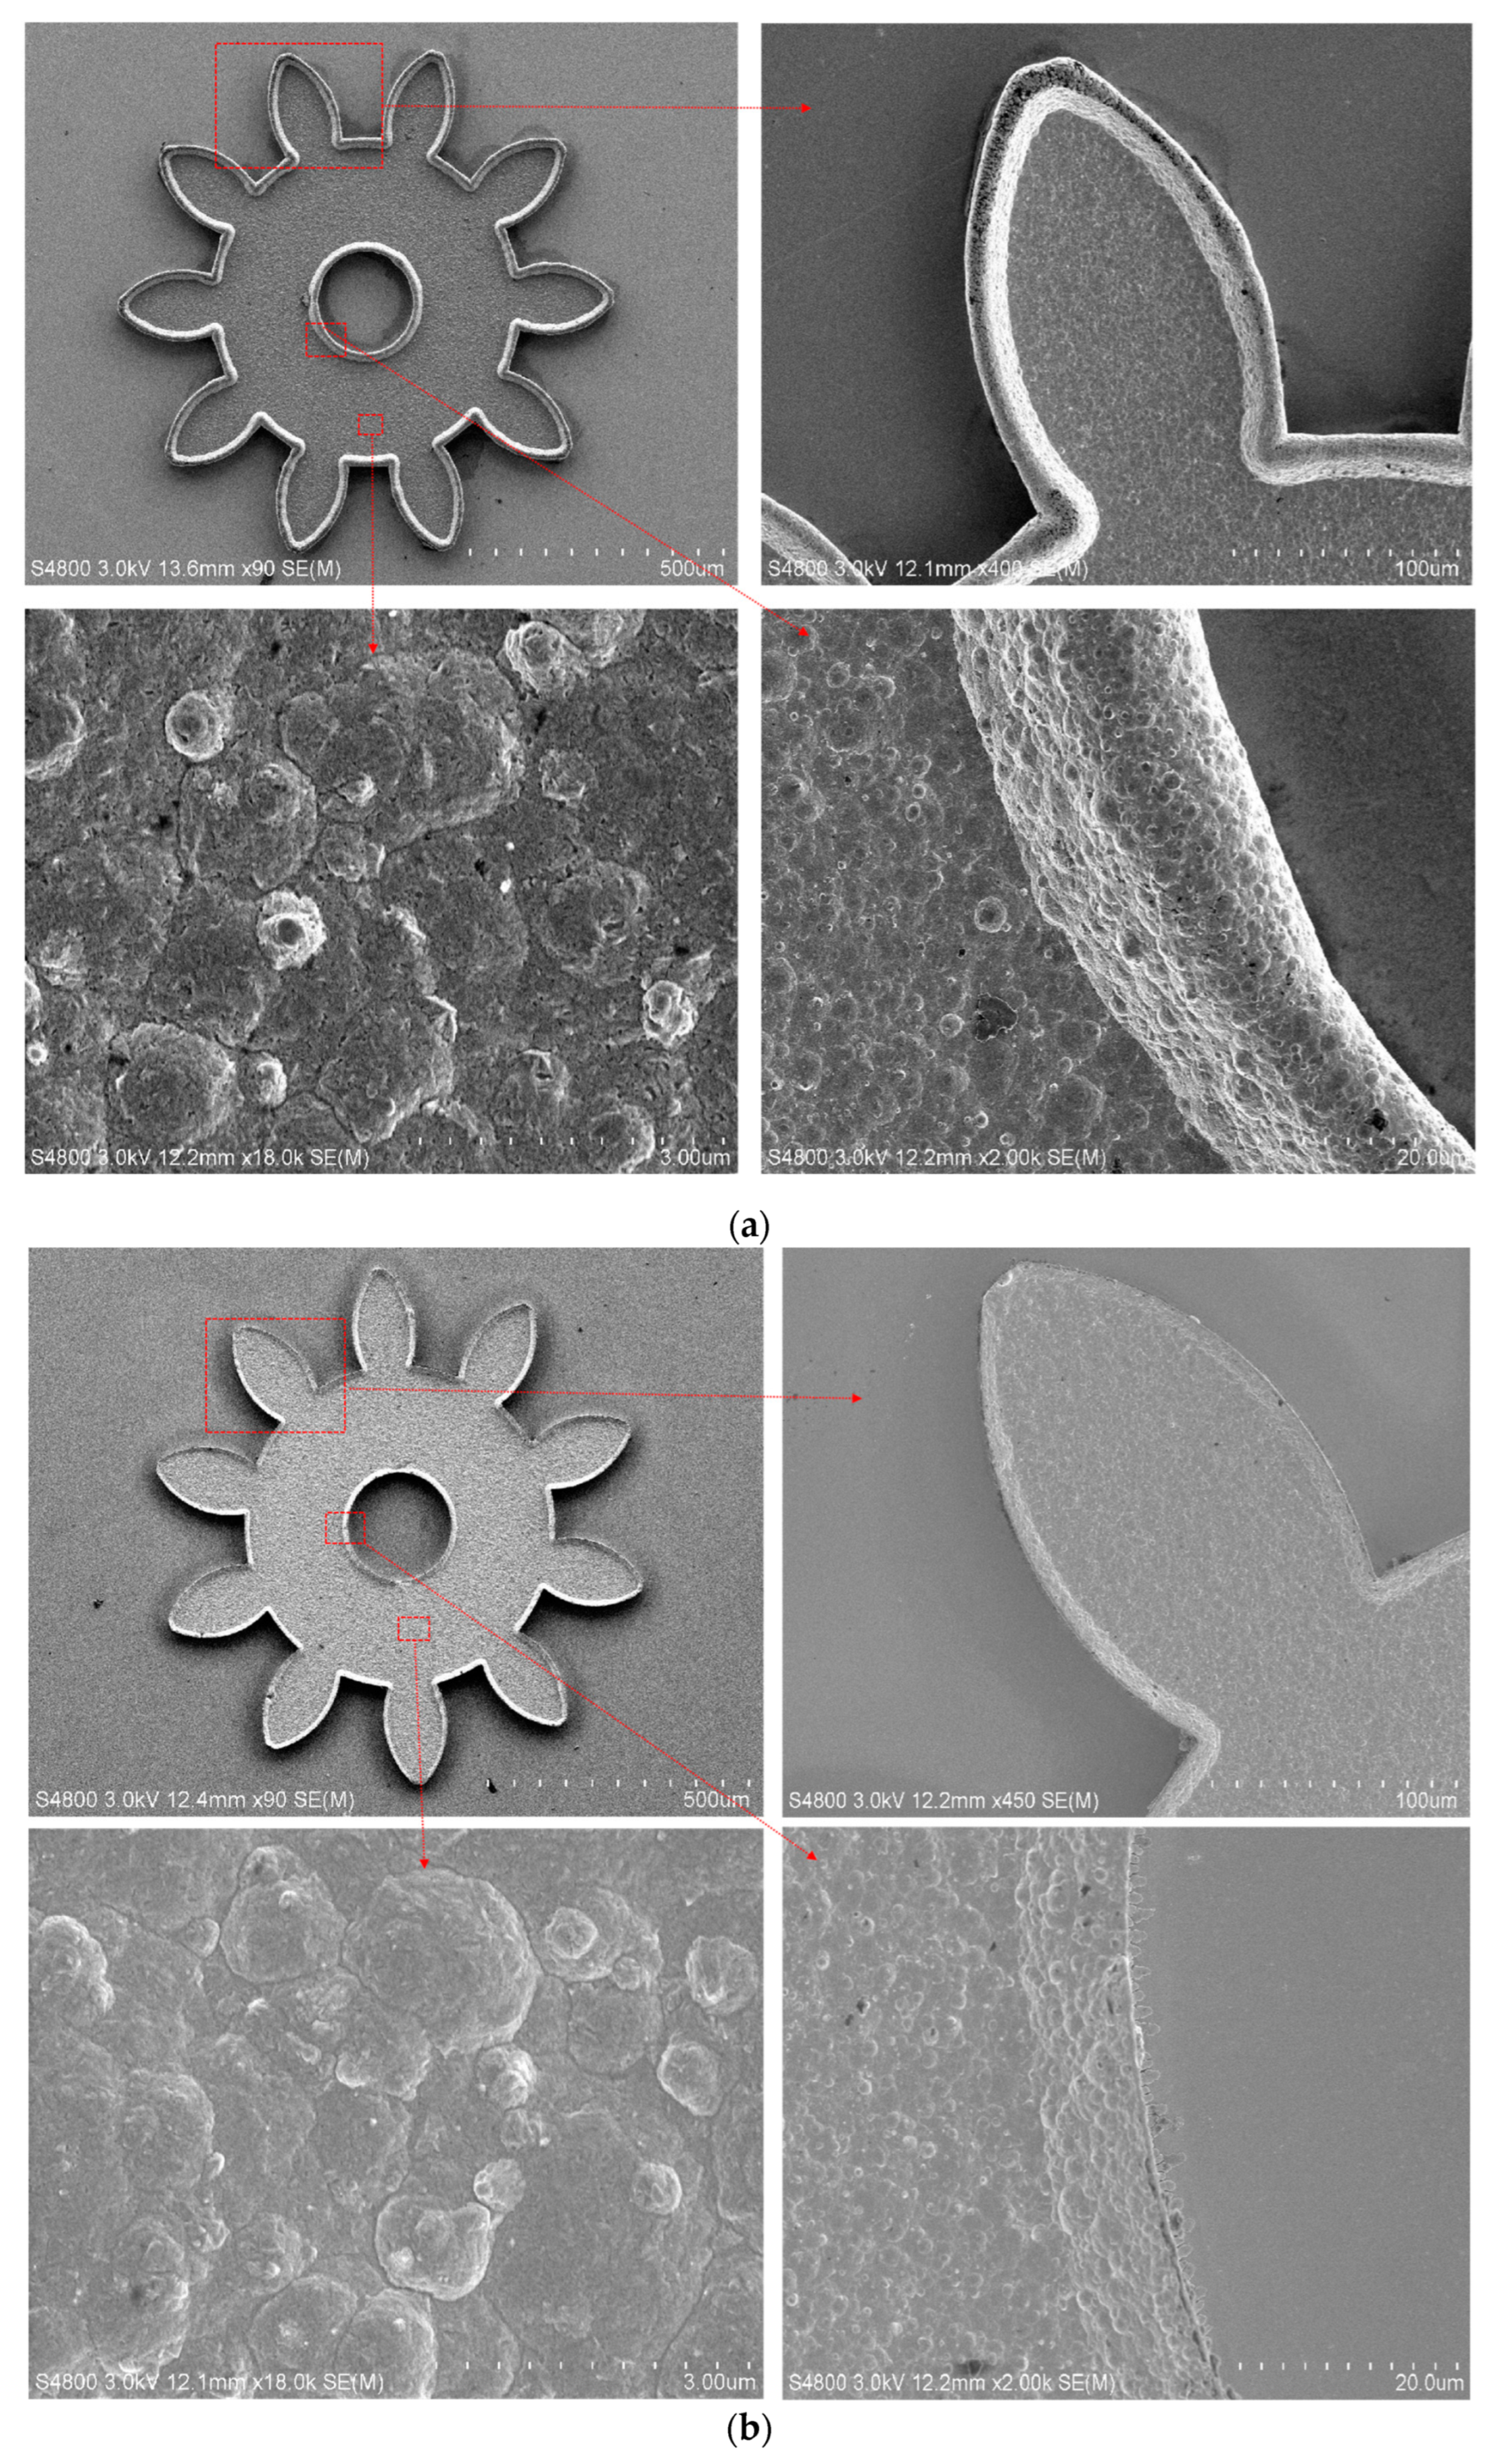
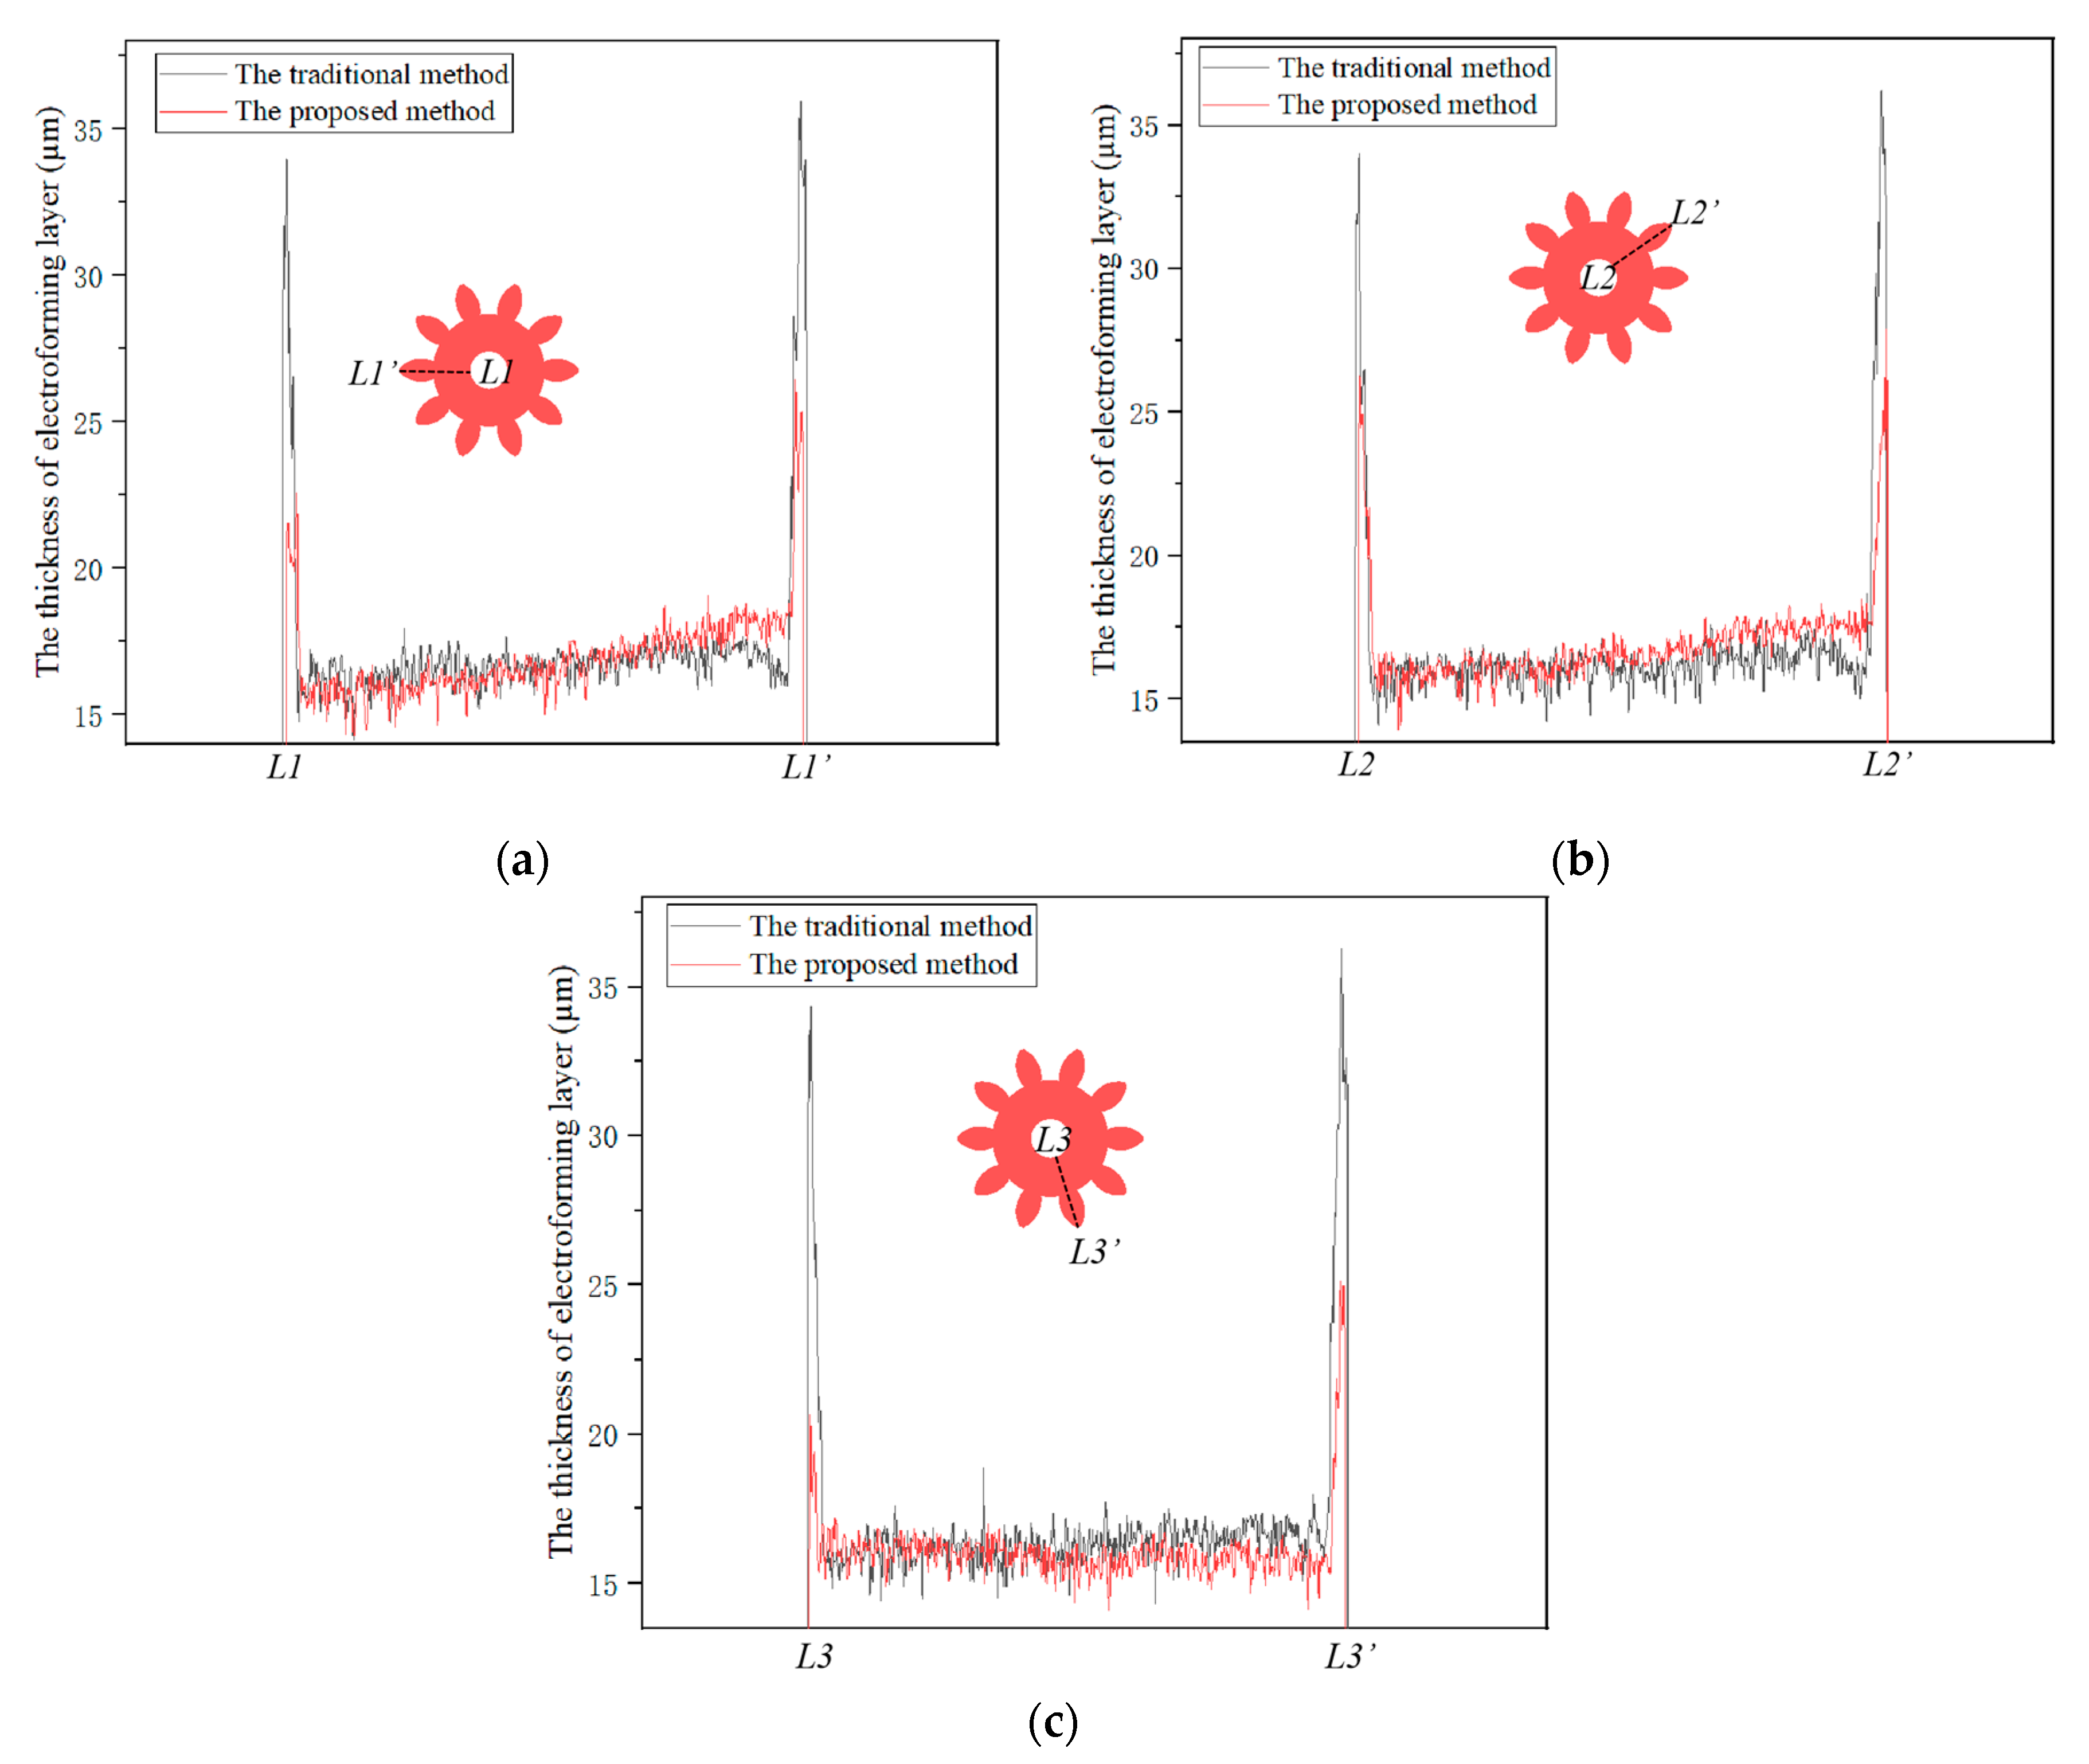
3.2. Experiment
4. Conclusions
Author Contributions
Funding
Data Availability Statement
Conflicts of Interest
References
- Du, L.; Yang, T.; Zhao, M.; Tao, Y.; Luo, L.; Wang, L.; Liu, C. Study on improving thickness uniformity of microfluidic chip mold in the electroforming process. Micromachines 2016, 7, 7. [Google Scholar] [CrossRef] [PubMed]
- Luo, J.K.; Chu, D.P.; Flewitt, A.J.; Spearing, S.M.; Fleck, N.A.; Milne, W.I. Uniformity control of Ni thin film microstructures deposited by through-mask plating. J. Electrochem. Soc. 2005, 152, 36–41. [Google Scholar] [CrossRef] [Green Version]
- Teh, W.H.; Luo, J.K.; Graham, M.R.; Pavlov, A.; Smith, C.G. Near-zero curvature fabrication of miniaturized micromechanical Ni switches using electron beam cross-linked PMMA. J. Micromech. Microeng. 2003, 13, 591. [Google Scholar] [CrossRef]
- Matsunaga, T.; Kondoh, K.; Kumagae, M.; Kawara, H.; Yasuda, M.; Murata, K. Fabrication of a New Electrostatic Linear Actuator. In Proceedings of the International Microprocesses Nanotechnology Conference, Tokyo, Japan, 11–13 July 2000. [Google Scholar]
- Zhao, M.; Du, L.; Xu, Z.; Zhang, X.; Cao, Q.; Ji, X.; Wei, Z.; Liu, J. Improving the thickness uniformity of micro electroforming layer by megasonic agitation and the application. Mater. Chem. Phys. 2020, 239, 122331. [Google Scholar] [CrossRef]
- Yang, H.; Kang, S.W. Improvement of thickness uniformity in nickel electroforming for the LIGA process. Int. J. Mach. Tools Manuf. 2000, 40, 1065–1072. [Google Scholar] [CrossRef]
- Volgin, V.M.; Lyubimov, V.V.; Gnidina, I.V.; Kabanova, T.B.; Davydov, A.D. Effect of Anode Shape on Uniformity of Electrodeposition onto Resistive Substrates. Electrochim. Acta 2017, 230, 382–390. [Google Scholar] [CrossRef]
- Li, J.-d.; Zhang, P.; Wu, Y.-h.; Liu, Y.-s.; Xuan, M. Uniformity study of nickel thin-film microstructure deposited by electroplating. Microsyst. Technol. 2009, 15, 505–510. [Google Scholar] [CrossRef]
- Pei, H.Z.; Zhang, J.; Zhang, G.L.; Huang, P. Research to the Uniformity of Ni-Co Alloy Electroforming. Adv. Mater. Res. 2012, 479, 497–503. [Google Scholar] [CrossRef]
- Wong, K.; Chan, K.C.; Yue, T.M. A study of surface finishing in pulse current electroforming of nickel by utilizing different shaped waveforms. Surf. Coat. Technol. 1999, 115, 132–139. [Google Scholar] [CrossRef]
- John, S.; Ananth, V.; Vasudevan, T. Improving the deposit distribution during electroforming of complicated shapes. Bull. Electrochem. 1999, 15, 202–204. [Google Scholar]
- Park, C.-W.; Park, K.-Y. An effect of dummy cathode on thickness uniformity in electroforming process. Results Phys. 2014, 4, 107–112. [Google Scholar] [CrossRef] [Green Version]
- Hachman, J.T. Improvement of current distribution uniformity on substrates for microelectromechanical systems. J. Micro/Nanolithogr. MEMS MOEMS 2004, 3, 146–151. [Google Scholar] [CrossRef]
- Li, A.; Zhu, Z.; Liu, Y.; Hu, J. Ultrasound-assisted electrodeposition of Fe-Ni film for OLED mask. Mater. Res. Bull. 2020, 127, 110845. [Google Scholar] [CrossRef]
- Ming, P.M.; Zhu, D.; Hu, Y.Y.; Zeng, Y.B. Experimental research on microelectroforming with ultrasonic agitation. Proc. Key Eng. Mater. 2008, 375, 253–257. [Google Scholar] [CrossRef]
- Zhao, M.; Du, L.; Wei, Z.; Du, C.; Liu, X.; Ji, X. Fabrication of metal microfluidic chip mold with coplanar auxiliary cathode in the electroforming process. J. Micromech. Microeng. 2019, 29, 025002. [Google Scholar] [CrossRef]
- Yeh, Y.-M.; Tu, G.-C.; Fu, M.-N. Simulation Analysis and Experimental Verification of UV-LIGA Process for High-Aspect-Ratio Ni–Fe Micro-Mold Insert. Jpn. J. Appl. Phys. 2003, 42, 6683–6690. [Google Scholar] [CrossRef]
- Chaubey, S.K.; Jain, N.K. State-of-art review of past research on manufacturing of meso and micro cylindrical gears. Precis. Eng. 2018, 51, 702–728. [Google Scholar] [CrossRef]
- McGeough, J.A.; Leu, M.C.; Rajurkar, K.P.; De Silva, A.K.M.; Liu, Q. Electroforming Process and Application to Micro/Macro Manufacturing. CIRP Ann. 2001, 50, 499–514. [Google Scholar] [CrossRef]
- Müller, T.; Piotter, V.; Plewa, K.; Guttmann, M.; Ritzhaupt-Kleissl, H.-J.; Hausselt, J. Ceramic micro parts produced by micro injection molding: Latest developments. Microsyst. Technol. 2009, 16, 1419–1423. [Google Scholar] [CrossRef]
- Zhang, L.Y.; Wang, C.L.; Liu, Z.M.; Lu, M.; Meng, L.X.; Zhang, Y.G.; Zhang, H.P. Study on UV-LIGA Technology Fabrication of Micro Gear Transmission Device. Appl. Mech. Mater. 2011, 86, 273–277. [Google Scholar] [CrossRef]
- Chinn, D.; Ostendorp, P.; Haugh, M.; Kershmann, R.; Kurfess, T.; Claudet, A.; Tucker, T. Three dimensional imaging of LIGA-made microcomponents. J. Manuf. Sci. Eng. 2004, 126, 813–821. [Google Scholar] [CrossRef]
- Shin, Y.M.; Gamzina, D.; Barnett, L.R.; Yaghmaie, F.; Baig, A.; Luhmann, N.C. UV Lithography and Molding Fabrication of Ultrathick Micrometallic Structures Using a KMPR Photoresist. J. Microelectromech. Syst. 2010, 19, 683–689. [Google Scholar] [CrossRef]
- Chen, X.; Wang, Z.; Xu, J.; Wang, Y.; Li, J.; Liu, H. Sustainable production of micro gears combining micro reciprocated wire electrical discharge machining and precision forging. J. Clean. Prod. 2018, 188, 1–11. [Google Scholar] [CrossRef]


| (S/m) | (A/m2) | (V) | (kg/mol) | (kg/m3) | |||||
|---|---|---|---|---|---|---|---|---|---|
| 0.95 | 100 | 1.5 | 0.5 | 318.15 | −0.257 | 0.0586 | 8900 | 1 | 2 |
| TP (µm) | 5 | 10 | 15 | 20 | 25 | 30 |
|---|---|---|---|---|---|---|
| (µm) | 0.6539 | 0.6488 | 0.6447 | 0.6410 | 0.6378 | 0.6351 |
| (µm) | 0.5989 | 0.6010 | 0.6029 | 0.6038 | 0.6043 | 0.6048 |
| 9.18% | 7.95% | 6.93% | 6.17% | 5.55% | 5.01% |
| Line | L1-L1′ | L2-L2′ | L3-L3′ | |||
|---|---|---|---|---|---|---|
| Method | Traditional | Proposed | Traditional | Proposed | Traditional | Proposed |
| (µm) | 35.94 | 26.46 | 36.24 | 26.23 | 36.30 | 25.13 |
| (µm) | 14.16 | 14.30 | 14.08 | 13.93 | 14.35 | 14.07 |
| 153.83% | 85.00% | 157.48% | 88.30% | 153.02% | 78.60% | |
Disclaimer/Publisher’s Note: The statements, opinions and data contained in all publications are solely those of the individual author(s) and contributor(s) and not of MDPI and/or the editor(s). MDPI and/or the editor(s) disclaim responsibility for any injury to people or property resulting from any ideas, methods, instructions or products referred to in the content. |
© 2023 by the authors. Licensee MDPI, Basel, Switzerland. This article is an open access article distributed under the terms and conditions of the Creative Commons Attribution (CC BY) license (https://creativecommons.org/licenses/by/4.0/).
Share and Cite
Wang, H.; Xie, J.; Fan, T.; Sun, D.; Li, C. Improving the Thickness Uniformity of Micro Gear by Multi-Step, Self-Aligned Lithography and Electroforming. Micromachines 2023, 14, 775. https://doi.org/10.3390/mi14040775
Wang H, Xie J, Fan T, Sun D, Li C. Improving the Thickness Uniformity of Micro Gear by Multi-Step, Self-Aligned Lithography and Electroforming. Micromachines. 2023; 14(4):775. https://doi.org/10.3390/mi14040775
Chicago/Turabian StyleWang, Huan, Jing Xie, Tao Fan, Dapeng Sun, and Chaobo Li. 2023. "Improving the Thickness Uniformity of Micro Gear by Multi-Step, Self-Aligned Lithography and Electroforming" Micromachines 14, no. 4: 775. https://doi.org/10.3390/mi14040775