
Analytical Gas Sensing in the Terahertz Spectral Range

Abstract
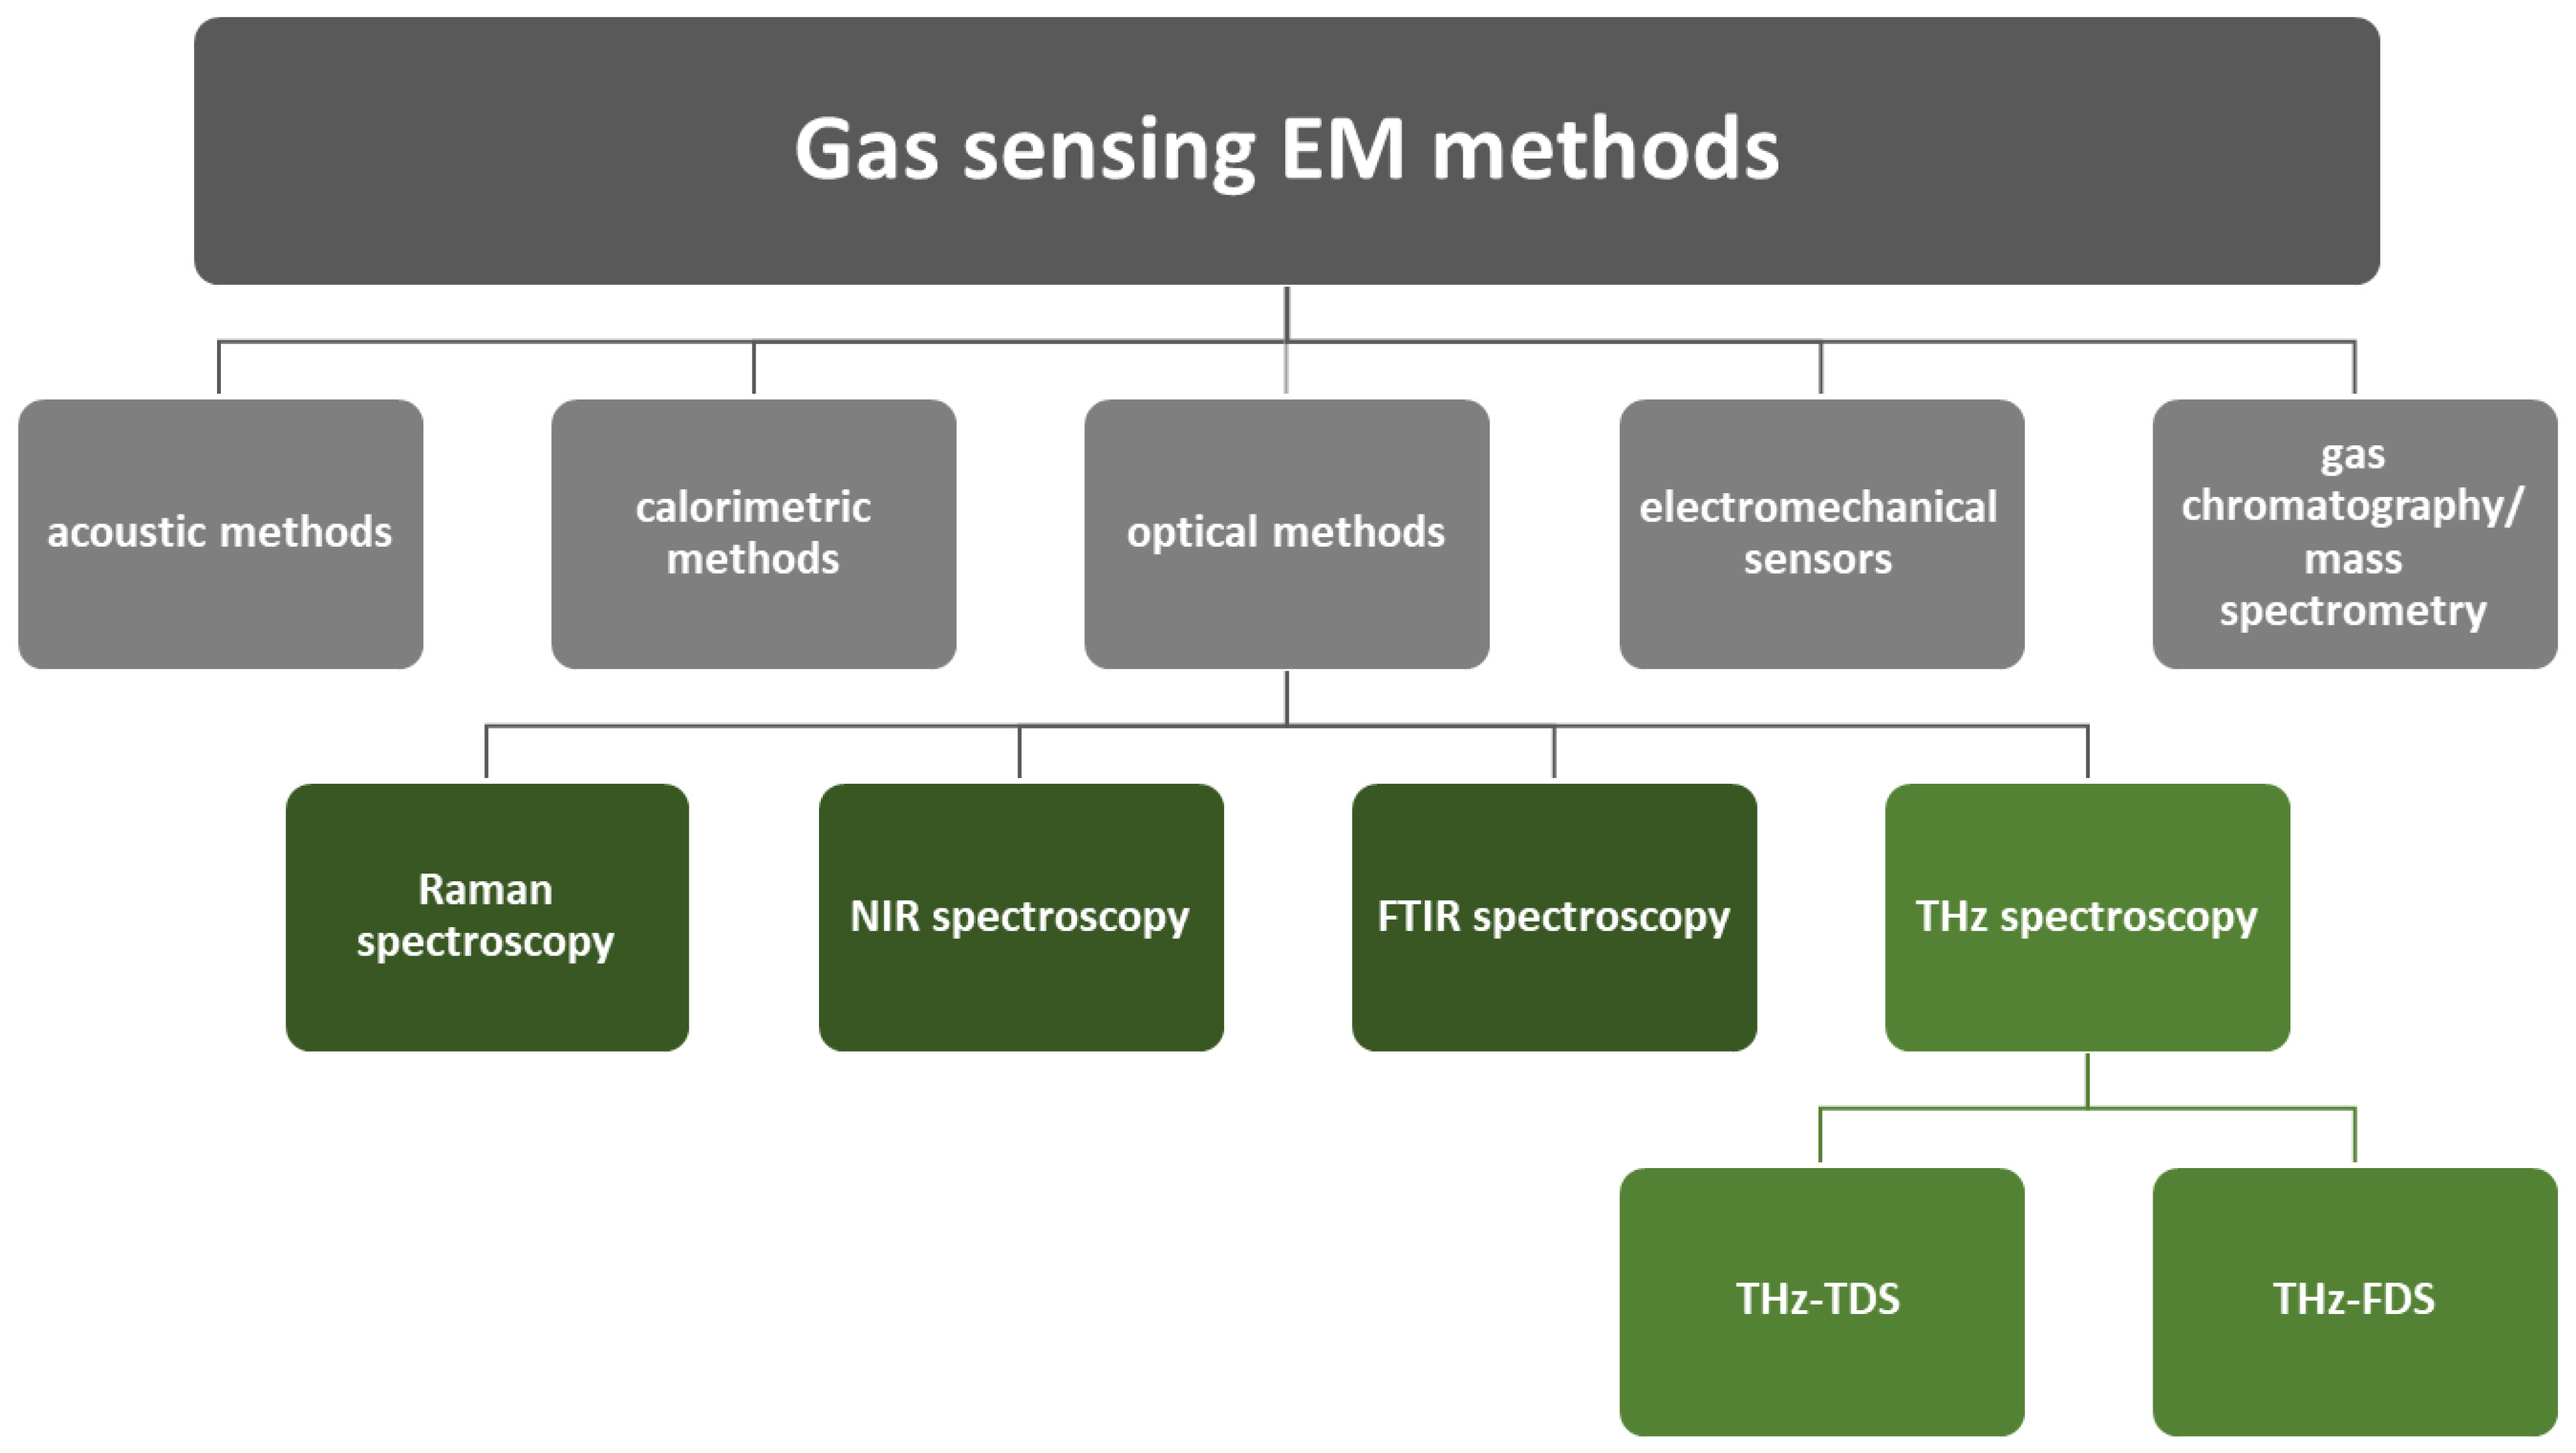
:1. Introduction
2. Terahertz Analytical Methods
2.1. THz-TDS
2.1.1. Photoconductive Antennas
2.1.2. Electro-Optic Crystals
2.2. THz-FDS
2.3. Gas Cells and Gas Preconcentrator
3. THz Detection of Air Pollutants
3.1. Interaction of THz Radiation with Gas Matter
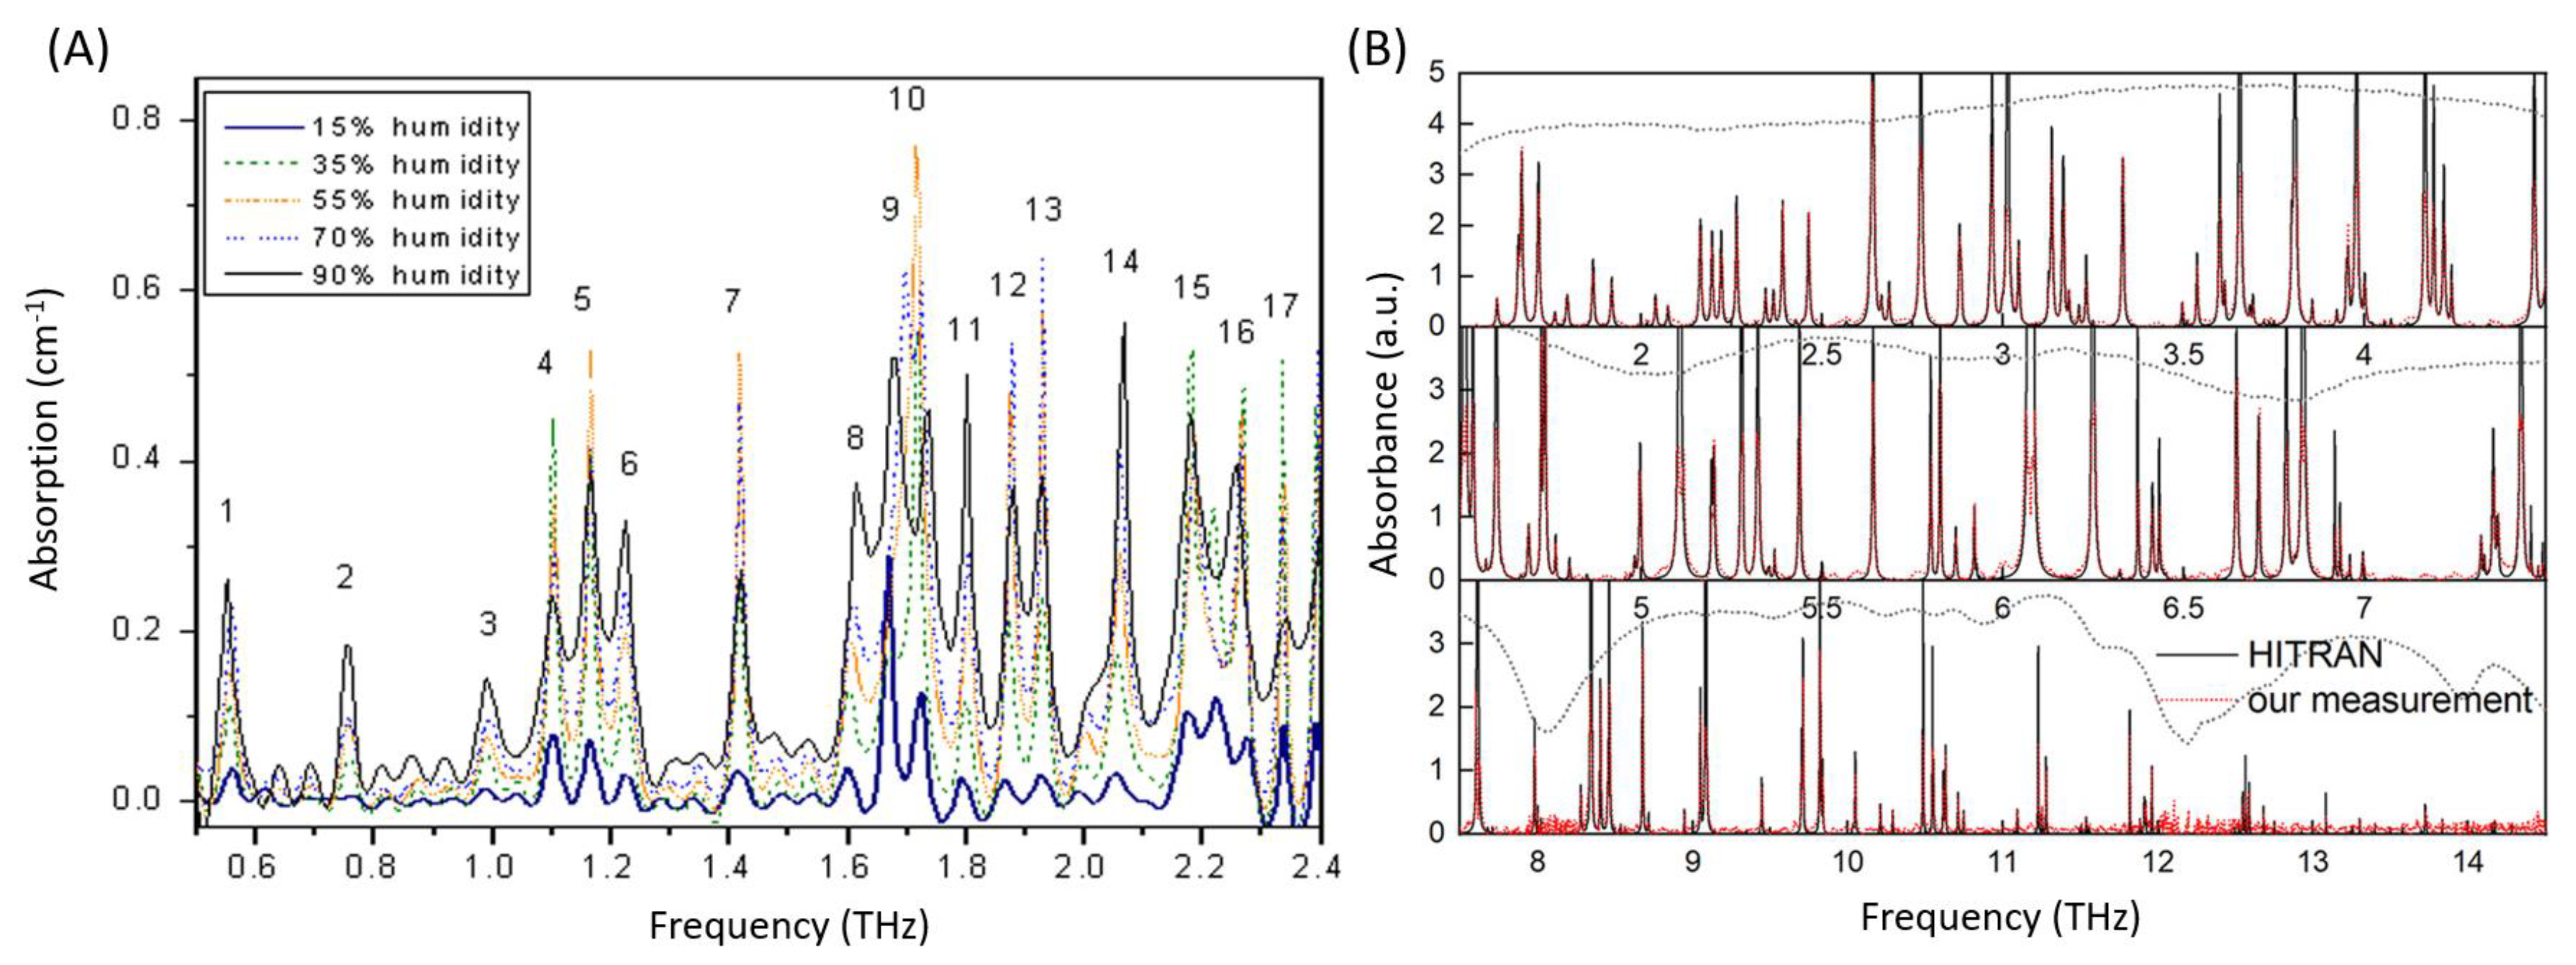
3.2. THz Radiation Interaction with Atmosphere

3.3. THz Detection of Gases and Various Air Pollutants
3.3.1. Alcohols, Aldehydes and Ketones
3.3.2. Ammonia
3.3.3. Aromatic Hydrocarbons
3.3.4. Carbon Oxides
3.3.5. Chlorides
3.3.6. Monoatomic Gases
3.3.7. Cyanides and Nitriles
3.3.8. Nitrogen Oxides
3.3.9. Ozone
3.3.10. Particulate Matter
3.3.11. Sulphides
3.3.12. Sulphur Oxides
3.3.13. Volatile Organic Compounds

| References | Gas Sample | THz System | Frequency Range (THz) | Study |
|---|---|---|---|---|
| [102] | OCS | THz-TDS | 0.1–1.5 | Determining the rotational constant, centrifugal distortion and relaxation times |
| [104] | SO2, H2S | THz-TDS | 0.2–2.6 | Spectral peak analysis |
| [134] | O3 | FTIR | 0.67–0.77 | Determining ozone concentration |
| [114] | C10H8, C10H7NO2 | THz-TDS | 0.1–2.2 | Measuring absorption spectra for PAHs and NPAHs |
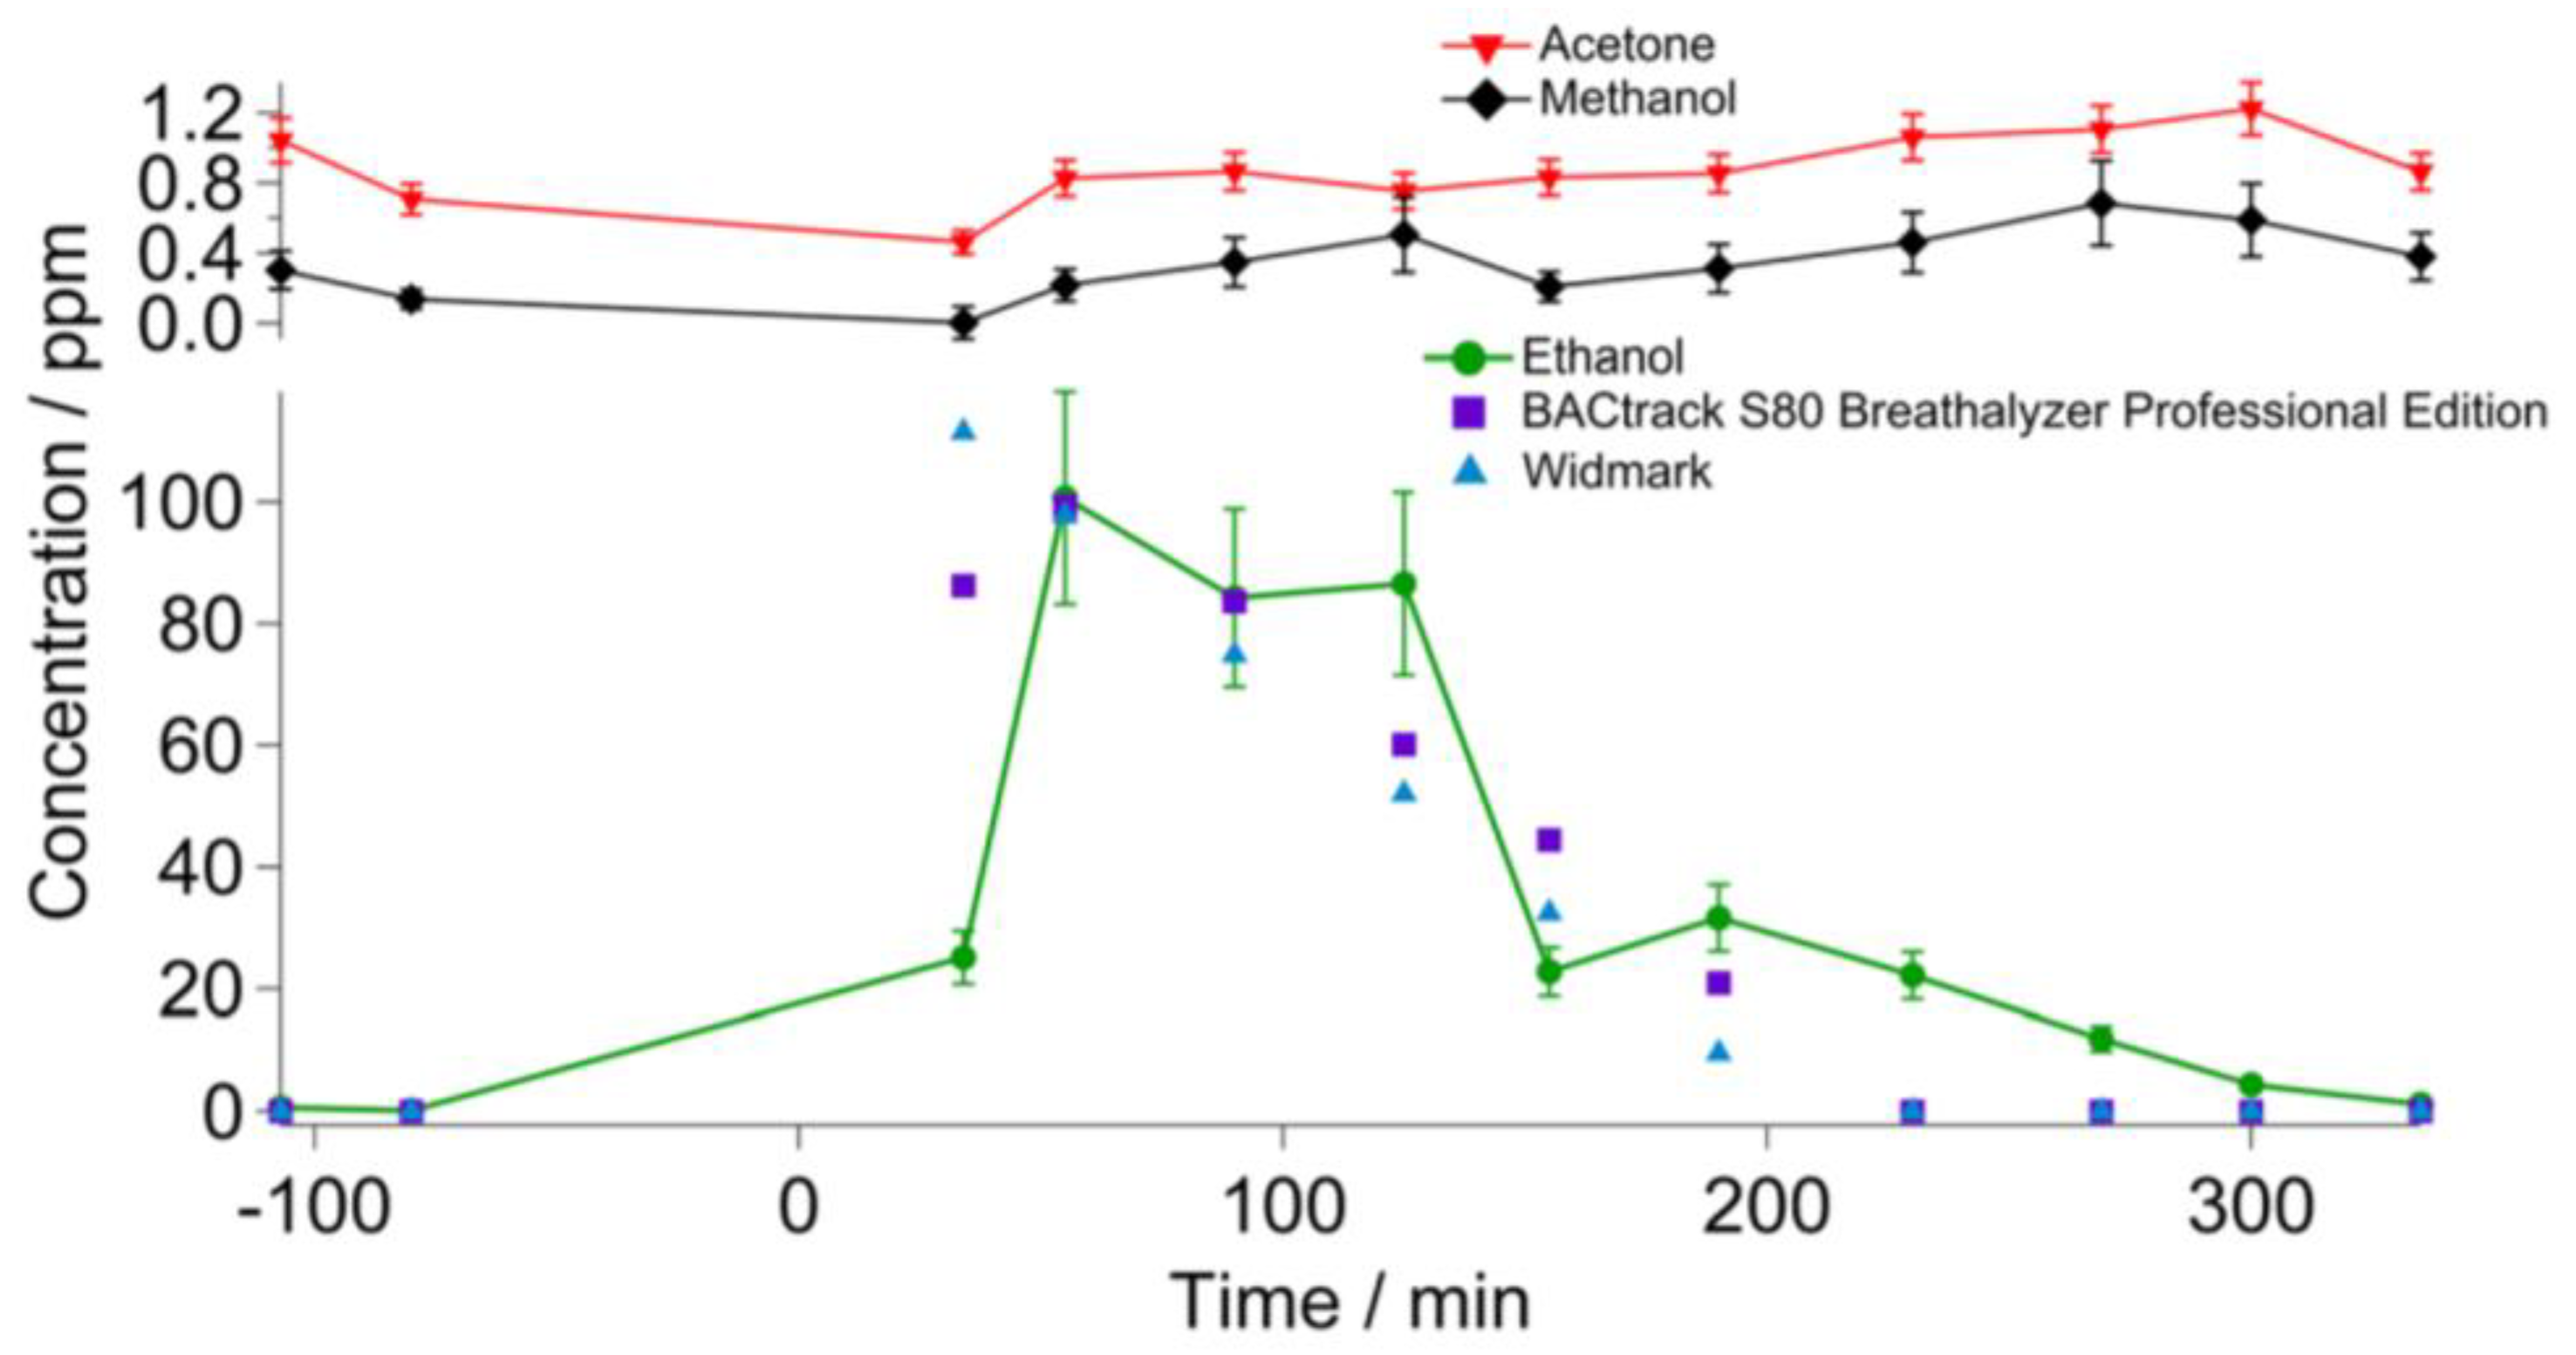
| [47] | CH3OH, C2H5OH, (CH3)2CO | CW-THz | 0.21–0.27 | Detection of gases within the exhaled breath of a person who consumed alcohol |
| [109] | C3H8O | THz-TDS | 0.2–3.5 | Detection of gas concentration in the range of 50–500 ppm |
| [111] | NH3 | THz-TDS | 0.08–2.5 | Studying the absorption and dispersion of gas |
| [122] | CH3Cl | THz-TDS | 0.1–1.8 | Detecting gas species in the low parts-per-million range in near real time |
| [9] | NH3, SO2 | CW-THz | 1.1–1.3 | Detection limit improvement |
| [58] | Cigarette smoke, HCN, CO, H2O, H2CO | CW-THz | 0.6–2.3 | Measurement of multiple species in one sample |
| [58] | H2S | CW-THz | 1.016–1.028 | Spectrum measuring, sulphur isotope evaluation |
| [37] | HCN | CW-THz | 1.2399 | Low-concentration detection of toxic gases |
| [39] | CH3CN | ASOPS-THz-TDS | 0.2–1 | Static and dynamic study of gas concentrations in a smoky environment |
| [127] | CH3CN | THz-TDS | 0.2–3.0 | One-path remote gas detection, quantification and recognition |
| [11] | CO | THz-TDS | 0.2–2.5 | Spectral analysis |
| [87] | CO | THz-TDS | 0–3.3 | Direct measuring of commensurate echoes from gas molecules |
| [136] | PM2.5 | THz-TDS | 0–10 | Studying the concentration of PM2.5 in air |
| [137] | PM2.5 | FTIR | 2–8 | Studying the composition and concentration of PM2.5 in two different geographical areas |
| [144] | SO isotopes | CW-THz | 0.3–3.3 (tunable) | Studying the absorption spectra of gas isotopes |
| [141] | OCS | CW-THz | 0.1–2.0 | Transition characterisation, self-broadening coefficient determination, analysing dependency on pressure |
| [99] | H2O (vapour) | CW-THz with disc microresonator | 0.4–0.65 | Detection of water vapour at a concentration of 4 parts per million in the atmosphere |
| [133] | NO | Evenson-type tunable FIR spectrometer | 0.99–4.75 | Determining transitions around 2 THz for better prediction of higher rotational states |
| [22] | VOCs | THz-FDS | 0.238–0.252 | Studying the absorption spectra of VOCs as medical biomarkers with several MVA techniques for substance detection and identification purposes |
| [86] | VOCs | CW-THz | 0.245 and 0.5 | Spectrum analysis |
| [88] | He, Kr, Ar | THz-TDS | 0.3–4.5 | Determining pressure-dependent refractive indices |
| [7] | VOCs | CW-THz | 0.494–0.500 | Studying the gas sensitivity for the THz system |
| [41] | VOCs: methanol, ethanol, isopropanol, 1-butanol and 2-butanol | THz-FDS | 0.06–1.2 | Determining molar absorption coefficient of VOCs, optical behaviour of VOC/air mixtures |
| [8] | N2O | THz-TDS | 0.2–0.5 | Remote spectral sensing at 1.3 and 3.6 m |
| [131] | N2O | THz-TDS | 0.2–1.2 | Absorbance and absorption coefficient measurements using long propagation path |
| [126] | HCN, CH3CN | CW-THz | 0.2–0.5 | Detection of gases from heated nylon fabric |
| [119] | HCl, CO, HCN | CW-THz | 0.50–0.95 | Detection of gases from heated PVC and moulded charcoal |
| [120] | H2O, CO | THz-TDS | 0–2.2 | THz signal changes with path length in ambient air due to water vapour |
| [101] | NH3, H2O | THz-TDS | 0.4–2 | Gas detection |
| [61] | CO | THz-TDS | 0.2–3 | Studying the transmission properties of gases contaminated by aerosols and water vapour |
| [90,152,153] | (CH3)2CO, CH3OH, C2H5OH, NH3, H2S, NO | THz-FDS | 0.118–0.178 | Detection of gases as disease biomarkers within exhaled breath, tissue and body fluids |
| [51] | PM2.5 | FTIR | 2.5–7.5 | Studying the elemental composition and quantitation of PM2.5 |
| [107,147] | VOCs | THz-TDS | 0.1–1.6 | Monitoring the adsorption process of VOCs |
| [80] | VOCs | tailor-made THz system | 238–252 GHz | Qualitative and quantitative analysis of absorption spectra of gas mixtures measured at different pressures, using independent component analysis (ICA) to predict their concentrations |
| [150] | VOCs | THz-TDS with ceramic architecture | 0.2–1.8 | Detection of VOC mixture with ppm-order concentrations |
| [148] | VOCs | THz-TDS | 0.1–0.45 | Discriminating between different concentrations of VOC |
4. Future of THz Technology in the Field of Environmental and Biomedical Applications
5. Conclusions
- the frequency range that is species dependent and must ensure enough space for gases with sparser spectra;
- the spectral resolution that ensures distinguishing adjacent peaks that lie close together (higher resolution may be needed for detailed gas analysis);
- The 3HS parameters to detect lower concentrations of gases in the sample, distinguish between different gases and identify a particular gas;
- a pressure that should be low enough that individual narrow spectral lines of species in the mixture do not disappear in the Doppler broadening (it demands a vacuum system to evacuate the spectrometer cell to the desired pressure and to pull the gas sample into the preconcentrator tube);
- an absorption cell which should be long enough to achieve appropriate sensitivity even for small amounts of a sample; and
- a gas preconcentrator to improve the sensitivity, especially for small gas volumes.
Author Contributions
Funding
Institutional Review Board Statement
Informed Consent Statement
Data Availability Statement
Conflicts of Interest
References
- Slanina, J. Air Pollution: The Emission–Effect Relation. Rev. Environ. Sci. Biotechnol. 2007, 6, 353–374. [Google Scholar] [CrossRef]
- Wagner, T.; Beirle, S.; Deutschmann, T.; Eigemeier, E.; Frankenberg, C.; Grzegorski, M.; Liu, C.; Marbach, T.; Platt, U.; de Vries, M.P. Monitoring of Atmospheric Trace Gases, Clouds, Aerosols and Surface Properties from UV/Vis/NIR Satellite Instruments. J. Opt. Pure Appl. Opt. 2008, 10, 104019. [Google Scholar] [CrossRef]
- Siegel, P.H. THz for Space: The Golden Age. In Proceedings of the 2010 IEEE MTT-S International Microwave Symposium, Anaheim, CA, USA, 23–28 May 2010; pp. 816–819. [Google Scholar]
- Liu, X.; Cheng, S.; Liu, H.; Hu, S.; Zhang, D.; Ning, H. A Survey on Gas Sensing Technology. Sensors 2012, 12, 9635–9665. [Google Scholar] [CrossRef] [PubMed]
- Nabiev, S.S.; Nadezhdinskii, A.I.; Stavrovskii, D.B.; Vaks, V.L.; Domracheva, E.G.; Pripolzin, S.I.; Sobakinskaya, E.A.; Chernyaeva, M.B. Analysis of the Products of the Natural Decay of High Explosives by Subterahertz and Infrared Fourier Spectroscopy. Russ. J. Phys. Chem. A 2011, 85, 1404–1410. [Google Scholar] [CrossRef]
- Lefferts, M.J.; Castell, M.R. Vapour Sensing of Explosive Materials. Anal. Methods 2015, 7, 9005–9017. [Google Scholar] [CrossRef]
- Schmalz, K.; Rothbart, N.; Neumaier, P.F.X.; Borngräber, J.; Hübers, H.W.; Kissinger, D. Gas Spectroscopy System for Breath Analysis at Mm-Wave/THz Using SiGe BiCMOS Circuits. IEEE Trans. Microw. Theory Tech. 2017, 65, 1807–1818. [Google Scholar] [CrossRef]
- Shimizu, N.; Song, H.-J.; Kado, Y.; Furuta, T.; Wakatsuki, A.; Muramoto, Y. Gas Detection Using Terahertz Waves. NTT Tech. Rev. 2009, 7, 1–6. [Google Scholar]
- Hepp, C.; Lüttjohann, S.; Roggenbuck, A.; Deninger, A.; Nellen, S.; Göbel, T.; Jörger, M.; Harig, R. A Cw-Terahertz Gas Analysis System with ppm Detection Limits. In Proceedings of the 2016 41st International Conference on Infrared, Millimeter, and Terahertz waves (IRMMW-THz), Copenhagen, Denmark, 25–30 September 2016; pp. 1–2. [Google Scholar]
- Shigemori, T. PT1 Gas Sensors—Status and Future Trends for Safety Applications. In Proceedings of the 14th International Meeting on Chemical Sensors (IMCS), Nuremberg, Germany, 20–23 May 2012; pp. 49–51. [Google Scholar] [CrossRef]
- Hu, Y.; Wang, X.; Guo, L.; Zhang, C. Terahertz time-domain spectroscopic study of carbon monoxide. Guang Pu Xue Yu Guang Pu Fen Xi Guang Pu 2006, 26, 1008–1011. [Google Scholar]
- van Vuuren, P.; Lewis, I.R.; Slater, J.B.; Tedesco, J.M.; Fairchild, R.C.; Human, P. Gas-Phase Raman Spectroscopy—A New Tool in the Process Analysis Toolbox. AIP Conf. Proc. 2010, 1267, 162–163. [Google Scholar] [CrossRef]
- Petrov, D.V.; Matrosov, I.I. Spectral Range for Analysis of Natural Gas by Raman Spectroscopy. In Proceedings of the 22nd International Symposium on Atmospheric and Ocean Optics: Atmospheric Physics, Tomsk, Russia, 30 June–3 July 2016; International Society for Optics and Photonics: Bellingham, WA, USA, 2016; Volume 10035, p. 1003523. [Google Scholar]
- Qi, R.; Yin, X.; Yang, L.; Du, Z.; Liu, J.; Xu, K. Application of NIR spectroscopy to multiple gas components identification. Guang Pu Xue Yu Guang Pu Fen Xi Guang Pu 2008, 28, 2855–2858. [Google Scholar]
- Bacsik, Z.; Mink, J.; Keresztury, G. FTIR Spectroscopy of the Atmosphere. I. Principles and Methods. Appl. Spectrosc. Rev. 2004, 39, 295–363. [Google Scholar] [CrossRef]
- Abina, A.; Puc, U.; Jeglič, A.; Zidanšek, A. Structural Characterization of Thermal Building Insulation Materials Using Terahertz Spectroscopy and Terahertz Pulsed Imaging. NDT E Int. 2016, 77, 11–18. [Google Scholar] [CrossRef]
- Sesek, A.; Svigelj, A.; Trontelj, J. A Compact THz Imaging System. In Image Sensors and Imaging Systems 2015; Widenhorn, R., Dupret, A., Eds.; Spie-Int Soc Optical Engineering: Bellingham, WA, USA, 2015; Volume 9403, p. 940303. ISBN 978-1-62841-493-6. [Google Scholar]
- Ueno, Y.; Ajito, K. Analytical Terahertz Spectroscopy. Anal. Sci. 2008, 24, 185–192. [Google Scholar] [CrossRef] [PubMed]
- Qiao, L.; Wang, Y.; Zhao, Z.; Chen, Z. Identification and Quantitative Analysis of Chemical Compounds Based on Multiscale Linear Fitting of Terahertz Spectra. Opt. Eng. 2014, 53, 074102. [Google Scholar] [CrossRef]
- Kašalynas, I.; Venckevičius, R.; Minkevičius, L.; Sešek, A.; Wahaia, F.; Tamošiūnas, V.; Voisiat, B.; Seliuta, D.; Valušis, G.; Švigelj, A.; et al. Spectroscopic Terahertz Imaging at Room Temperature Employing Microbolometer Terahertz Sensors and Its Application to the Study of Carcinoma Tissues. Sensors 2016, 16, 432. [Google Scholar] [CrossRef] [PubMed]
- Abina, A.; Korošec, T.; Puc, U.; Jazbinšek, M.; Zidanšek, A. Urinary Metabolic Biomarker Profiling for Cancer Diagnosis by Terahertz Spectroscopy: Review and Perspective. Photonics 2023, 10, 1051. [Google Scholar] [CrossRef]
- Neumaier, P.F.-X.; Schmalz, K.; Borngräber, J.; Wylde, R.; Hübers, H.-W. Terahertz Gas-Phase Spectroscopy: Chemometrics for Security and Medical Applications. Analyst 2014, 140, 213–222. [Google Scholar] [CrossRef] [PubMed]
- Shen, Y.-C. Terahertz Pulsed Spectroscopy and Imaging for Pharmaceutical Applications: A Review. Int. J. Pharm. 2011, 417, 48–60. [Google Scholar] [CrossRef] [PubMed]
- Corsi, C.; Sizov, F. (Eds.) THz and Security Applications: Detectors, Sources and Associated Electronics for THz Applications; NATO Science for Peace and Security Series B: Physics and Biophysics; Springer: Dordrecht, The Netherlands, 2014; ISBN 978-94-017-8827-4. [Google Scholar]
- Solyankin, P.M.; Nikolaeva, I.A.; Angeluts, A.A.; Shipilo, D.E.; Minaev, N.V.; Panov, N.A.; Balakin, A.V.; Zhu, Y.; Kosareva, O.G.; Shkurinov, A.P. THz Generation from Laser-Induced Breakdown in Pressurized Molecular Gases: On the Way to Terahertz Remote Sensing of the Atmospheres of Mars and Venus. New J. Phys. 2020, 22, 013039. [Google Scholar] [CrossRef]
- Mumtaz, M.; Mahmood, A.; Khan, S.D.; Zia, M.A.; Ahmed, M.; Ahmad, I. Investigation of Dielectric Properties of Polymers and Their Discrimination Using Terahertz Time-Domain Spectroscopy with Principal Component Analysis. Appl. Spectrosc. 2017, 71, 456–462. [Google Scholar] [CrossRef]
- Abina, A.; Korošec, T.; Puc, U.; Zidanšek, A. Review of Bioplastics Characterisation by Terahertz Techniques in the View of Ensuring a Circular Economy. Photonics 2023, 10, 883. [Google Scholar] [CrossRef]
- Wietzke, S.; Jansen, C.; Reuter, M.; Jung, T.; Kraft, D.; Chatterjee, S.; Fischer, B.M.; Koch, M. Terahertz Spectroscopy on Polymers: A Review of Morphological Studies. J. Mol. Struct. 2011, 1006, 41–51. [Google Scholar] [CrossRef]
- Abina, A.; Puc, U.; Zidanšek, A. Challenges and Opportunities of Terahertz Technology in Construction and Demolition Waste Management. J. Environ. Manag. 2022, 315, 115118. [Google Scholar] [CrossRef] [PubMed]
- Wang, Q.; Wang, Q.; Yang, Z.; Wu, X.; Peng, Y. Quantitative Analysis of Industrial Solid Waste Based on Terahertz Spectroscopy. Photonics 2022, 9, 184. [Google Scholar] [CrossRef]
- Nagatsuma, T. Terahertz Communications Technologies Based on Photonic and Electronic Approaches. In Proceedings of the European Wireless 2012, Poznan, Poland, 18–20 April 2012; pp. 1–4. [Google Scholar]
- Zhang, L.; Pang, X.; Pitchappa, P. Editorial for the Special Issue on Broadband Terahertz Devices and Communication Technologies. Micromachines 2023, 14, 1044. [Google Scholar] [CrossRef] [PubMed]
- Qin, J.; Ying, Y.; Xie, L. The Detection of Agricultural Products and Food Using Terahertz Spectroscopy: A Review. Appl. Spectrosc. Rev. 2013, 48, 439–457. [Google Scholar] [CrossRef]
- Abina, A.; Puc, U.; Jeglič, A.; Zidanšek, A. Applications of Terahertz Spectroscopy in the Field of Construction and Building Materials. Appl. Spectrosc. Rev. 2015, 50, 279–303. [Google Scholar] [CrossRef]
- Cosentino, A. Terahertz and Cultural Heritage Science: Examination of Art and Archaeology. Technologies 2016, 4, 6. [Google Scholar] [CrossRef]
- Slocum, D.M.; Goyette, T.M.; Giles, R.H.; Nixon, W.E. Experimental Determination of Terahertz Atmospheric Absorption Parameters. In Terahertz Physics, Devices, and Systems IX: Advanced Applications in Industry and Defense; International Society for Optics and Photonics: Bellingham, WA, USA, 2015; Volume 9483, p. 94830O. [Google Scholar]
- Qin, J.; Zhu, B.; Du, Y.; Han, Z. Terahertz Detection of Toxic Gas Using a Photonic Crystal Fiber. Opt. Fiber Technol. 2019, 52, 101990. [Google Scholar] [CrossRef]
- Yang, L.; Guo, T.; Zhang, X.; Cao, S.; Ding, X. Toxic Chemical Compound Detection by Terahertz Spectroscopy: A Review. Rev. Anal. Chem. 2018, 37, 20170021. [Google Scholar] [CrossRef]
- Hsieh, Y.-D.; Nakamura, S.; Abdelsalam, D.G.; Minamikawa, T.; Mizutani, Y.; Yamamoto, H.; Iwata, T.; Hindle, F.; Yasui, T. Dynamic Terahertz Spectroscopy of Gas Molecules Mixed with Unwanted Aerosol under Atmospheric Pressure Using Fibre-Based Asynchronous-Optical-Sampling Terahertz Time-Domain Spectroscopy. Sci. Rep. 2016, 6, 28114. [Google Scholar] [CrossRef] [PubMed]
- Vaks, V.; Domracheva, E.; Sobakinskaya, E.; Chernyaeva, M. Sub-THz Spectroscopy for Security Related Gas Detection. In Terahertz and Mid Infrared Radiation: Detection of Explosives and CBRN (Using Terahertz); Pereira, M.F., Shulika, O., Eds.; Springer: Dordrecht, The Netherlands, 2014; pp. 189–196. [Google Scholar]
- D’Arco, A.; Rocco, D.; Piamonte Magboo, F.; Moffa, C.; Della Ventura, G.; Marcelli, A.; Palumbo, L.; Mattiello, L.; Lupi, S.; Petrarca, M. Terahertz Continuous Wave Spectroscopy: A Portable Advanced Method for Atmospheric Gas Sensing. Opt. Express 2022, 30, 19005. [Google Scholar] [CrossRef] [PubMed]
- Cai, H.; Wang, D.; Shen, J. Study of Atmospheric Pollution Using Terahertz Wave. In Infrared, Millimeter Wave, and Terahertz Technologies; SPIE: Bellingham, WA, USA, 2010; Volume 7854. [Google Scholar] [CrossRef]
- Cuisset, A.; Hindle, F.; Mouret, G.; Bocquet, R.; Bruckhuisen, J.; Decker, J.; Pienkina, A.; Bray, C.; Fertein, É.; Boudon, V. Terahertz Rotational Spectroscopy of Greenhouse Gases Using Long Interaction Path-Lengths. Appl. Sci. 2021, 11, 1229. [Google Scholar] [CrossRef]
- Jacobsen, R.H.; Mittleman, D.M.; Nuss, M.C. Chemical Recognition of Gases and Gas Mixtures with Terahertz Waves. Opt. Lett. 1996, 21, 2011–2013. [Google Scholar] [CrossRef]
- Vaks, V.; Anfertev, V.; Chernyaeva, M.; Domracheva, E.; Yablokov, A.; Maslennikova, A.; Zhelesnyak, A.; Baranov, A.; Schevchenko, Y.; Pereira, M.F. Sensing Nitriles with THz Spectroscopy of Urine Vapours from Cancers Patients Subject to Chemotherapy. Sci. Rep. 2022, 12, 18117. [Google Scholar] [CrossRef]
- Vaks, V.; Chemyaeva, M.; Anfertev, V.; Domracheva, E.; Garanina, O.; Pripolzin, S.; Yablokov, A. The Application of High Resolution Terahertz Gas Spectroscopy for Medical Diagnostics Based on the Analysis of Exhaled Breath and Biological Liquid Vapor. In ITM Web of Conferences; EDP Sciences: Les Ulis, France, 2019; Volume 30, p. 13008. [Google Scholar] [CrossRef]
- Fosnight, A.M.; Moran, B.L.; Medvedev, I.R. Chemical Analysis of Exhaled Human Breath Using a Terahertz Spectroscopic Approach. Appl. Phys. Lett. 2013, 103, 133703. [Google Scholar] [CrossRef]
- Hindle, F.; Kuuliala, L.; Mouelhi, M.; Cuisset, A.; Bray, C.; Vanwolleghem, M.; Devlieghere, F.; Mouret, G.; Bocquet, R. Monitoring of Food Spoilage by High Resolution THz Analysis. Analyst 2018, 143, 5536–5544. [Google Scholar] [CrossRef]
- Hindle, F.; Kuuliala, L.; Mouelhi, M.; Cuisset, A.; Bray, C.; Vanwolleghem, M.; Devlieghere, F.; Mouret, G.; Bocquet, R. Spoilage of Salmon Fillets as Observed by THz Waves. In Proceedings of the 2019 44th International Conference on Infrared, Millimeter, and Terahertz Waves (IRMMW-THz), Paris, France, 1–6 September 2019; IEEE: Paris, France, 2019; p. 1. [Google Scholar]
- Bassi, J.; Stringer, M.; Miles, B.; Zhang, Y. Terahertz Time-Domain Spectroscopy of High-Pressure Flames. Front. Energy Power Eng. China 2009, 3, 123–133. [Google Scholar] [CrossRef]
- Zhan, H.; Li, Q.; Zhao, K.; Zhang, L.; Zhang, Z.; Zhang, C.; Xiao, L. Evaluating PM2.5 at a Construction Site Using Terahertz Radiation. IEEE Trans. Terahertz Sci. Technol. 2015, 5, 1028–1034. [Google Scholar] [CrossRef]
- Smith, R.M.; Arnold, M.A. Selectivity of Terahertz Gas-Phase Spectroscopy. Anal. Chem. 2015, 87, 10679–10683. [Google Scholar] [CrossRef]
- Lin, H.; Withayachumnankul, W.; Fischer, B.M.; Mickan, S.P.; Abbott, D. Gas Recognition with Terahertz Time-Domain Spectroscopy and Reference-Free Spectrum: A Preliminary Study. In Proceedings of the 2008 33rd International Conference on Infrared, Millimeter and Terahertz Waves, Pasadena, CA, USA, 15–19 September 2008; pp. 1–2. [Google Scholar]
- Tonouchi, M. Cutting-Edge Terahertz Technology. Nat. Photonics 2007, 1, 97. [Google Scholar] [CrossRef]
- Araki, M.; Tabata, Y.; Shimizu, N.; Matsuyama, K. Terahertz Spectroscopy of CO and NO: The First Step toward Temperature and Concentration Detection for Combustion Gases in Fire Environments. J. Mol. Spectrosc. 2019, 361, 34–39. [Google Scholar] [CrossRef]
- Zhang, D.; Qu, J.; Ouyang, Y.; Li, S.; Song, Y. Transmission Characteristics of Terahertz Imaging Detection in Smoke Environments. Fire Technol. 2022, 58, 1917–1936. [Google Scholar] [CrossRef]
- Chattopadhyay, G.; Reck, T.; Tang, A.; Jung-Kubiak, C.; Lee, C.; Siles, J.; Schlecht, E.; Kim, Y.M.; Chang, M.-C.F.; Mehdi, I. Compact Terahertz Instruments for Planetary Missions; IEEE: New York, NY, USA, 2015; ISBN 978-88-907018-5-6. [Google Scholar]
- Hindle, F.; Cuisset, A.; Bocquet, R.; Mouret, G. Continuous-Wave Terahertz by Photomixing: Applications to Gas Phase Pollutant Detection and Quantification. Comptes Rendus Phys. 2008, 9, 262–275. [Google Scholar] [CrossRef]
- Puc, U.; Bach, T.; Günter, P.; Zgonik, M.; Jazbinsek, M. Ultra-Broadband and High-Dynamic-Range THz Time-Domain Spectroscopy System Based on Organic Crystal Emitter and Detector in Transmission and Reflection Geometry. Adv. Photonics Res. 2021, 2, 2000098. [Google Scholar] [CrossRef]
- Puc, U.; Bach, T.; Michel, V.; Zgonik, M.; Medrano, C.; Jazbinsek, M. DSTMS-Based Ultrabroadband Terahertz Time-Domain Spectroscopy. In Proceedings of the 2019 Conference on Lasers and Electro-Optics Europe & European Quantum Electronics Conference (CLEO/Europe-EQEC), Munich, Germany, 23–27 June 2019; p. 1. [Google Scholar]
- Uno, T.; Tabata, H. In Situ Measurement of Combustion Gas Using Terahertz Time Domain Spectroscopy Setup for Gas Phase Spectroscopy and Measurement of Solid Sample. Jpn. J. Appl. Phys. 2010, 49, 04DL17. [Google Scholar] [CrossRef]
- Yang, Y.; Mandehgar, M.; Grischkowsky, D.R. Understanding THz Pulse Propagation in the Atmosphere. IEEE Trans. Terahertz Sci. Technol. 2012, 2, 406–415. [Google Scholar] [CrossRef]
- Zhang, X.-C.; Xu, J. Generation and Detection of THz Waves. In Introduction to THz Wave Photonics; Springer: Boston, MA, USA, 2010; pp. 27–48. ISBN 978-1-4419-0977-0. [Google Scholar]
- Dhillon, S.S.; Vitiello, M.S.; Linfield, E.H.; Davies, A.G.; Hoffmann, M.C.; Booske, J.; Paoloni, C.; Gensch, M.; Weightman, P.; Williams, G.P.; et al. The 2017 Terahertz Science and Technology Roadmap. J. Phys. Appl. Phys. 2017, 50, 043001. [Google Scholar] [CrossRef]
- Jepsen, P.U.; Cooke, D.G.; Koch, M. Terahertz Spectroscopy and Imaging—Modern Techniques and Applications. Laser Photonics Rev. 2010, 5, 124–166. [Google Scholar] [CrossRef]
- Tomasino, A.; Parisi, A.; Stivala, S.; Livreri, P.; Cino, A.C.; Busacca, A.C.; Peccianti, M.; Morandotti, R. Wideband THz Time Domain Spectroscopy Based on Optical Rectification and Electro-Optic Sampling. Sci. Rep. 2013, 3, 3116. [Google Scholar] [CrossRef]
- Lu, X.; Zhang, X.-C. Investigation of Ultra-Broadband Terahertz Time-Domain Spectroscopy with Terahertz Wave Gas Photonics. Front. Optoelectron. 2014, 7, 121–155. [Google Scholar] [CrossRef]
- Somma, C.; Folpini, G.; Gupta, J.; Reimann, K.; Woerner, M.; Elsaesser, T. Ultra-Broadband Terahertz Pulses Generated in the Organic Crystal DSTMS. Opt. Lett. 2015, 40, 3404–3407. [Google Scholar] [CrossRef] [PubMed]
- Lee, S.-H.; Jazbinsek, M.; Hauri, C.P.; Kwon, O.-P. Recent Progress in Acentric Core Structures for Highly Efficient Nonlinear Optical Crystals and Their Supramolecular Interactions and Terahertz Applications. CrystEngComm 2016, 18, 7180–7203. [Google Scholar] [CrossRef]
- Hagelschuer, T.; Wienold, M.; Richter, H.; Schrottke, L.; Grahn, H.T.; Hübers, H.-W. Real-Time Gas Sensing Based on Optical Feedback in a Terahertz Quantum-Cascade Laser. Opt. Express 2017, 25, 30203–30213. [Google Scholar] [CrossRef]
- Lee, Y.-S. Continuous-Wave Terahertz Sources and Detectors. In Principles of Terahertz Science and Technology; Springer: Boston, MA, USA, 2009; pp. 1–41. ISBN 978-0-387-09539-4. [Google Scholar]
- Tan, P.; Huang, J.; Liu, K.; Xiong, Y.; Fan, M. Terahertz Radiation Sources Based on Free Electron Lasers and Their Applications. Sci. China Inf. Sci. 2012, 55, 1–15. [Google Scholar] [CrossRef]
- Xiang, Y.; Zhu, J.; Wu, L.; You, Q.; Ruan, B.; Dai, X. Highly Sensitive Terahertz Gas Sensor Based on Surface Plasmon Resonance With Graphene. IEEE Photonics J. 2018, 10, 1–7. [Google Scholar] [CrossRef]
- Chen, T.; Han, Z.; Liu, J.; Hong, Z. Terahertz Gas Sensing Based on a Simple One-Dimensional Photonic Crystal Cavity with High-Quality Factors. Appl. Opt. 2014, 53, 3454–3458. [Google Scholar] [CrossRef]
- Hindle, F.; Bocquet, R.; Pienkina, A.; Cuisset, A.; Mouret, G. Terahertz Gas Phase Spectroscopy Using a High-Finesse Fabry–Pérot Cavity. Optica 2019, 6, 1449–1454. [Google Scholar] [CrossRef]
- Elmaleh, C.; Simon, F.; Decker, J.; Dumont, J.; Cazier, F.; Fourmentin, M.; Bocquet, R.; Cuisset, A.; Mouret, G.; Hindle, F. THz Cavity Ring-down Quantitative Gas Phase Spectroscopy. Talanta 2023, 253, 124097. [Google Scholar] [CrossRef]
- Kumar, P.; Sharma, A.K.; Prajapati, Y.K. Graphene-Based Plasmonic Sensor at THz Frequency with Photonic Spin Hall Effect Assisted by Magneto-Optic Phenomenon. Plasmonics 2022, 17, 957–963. [Google Scholar] [CrossRef]
- You, B.; Lu, J.-Y. Optical Gas Sensors Using Terahertz Waves in the Layered Media. In Gas Sensors; Bahadar Khan, S., Asiri, A.M., Akhtar, K., Eds.; IntechOpen: London, UK, 2020; ISBN 978-1-78985-159-5. [Google Scholar]
- Serita, K.; Murakami, H.; Kawayama, I.; Tonouchi, M. A Terahertz-Microfluidic Chip with a Few Arrays of Asymmetric Meta-Atoms for the Ultra-Trace Sensing of Solutions. Photonics 2019, 6, 12. [Google Scholar] [CrossRef]
- Li, Z.; Rothbart, N.; Deng, X.; Geng, H.; Zheng, X.; Neumaier, P.; Hübers, H.-W. Qualitative and Quantitative Analysis of Terahertz Gas-Phase Spectroscopy Using Independent Component Analysis. Chemom. Intell. Lab. Syst. 2020, 206, 104129. [Google Scholar] [CrossRef]
- Farhad, A.; Pyun, J.-Y. Terahertz Meets AI: The State of the Art. Sensors 2023, 23, 5034. [Google Scholar] [CrossRef]
- Wang, W.; Zhu, N.; Wang, Z.; Zhao, C.; Song, Z.; Chen, X.; Chao, X. Efficient Terahertz Absorption Gas Sensor with Gaussian Process Regression in Time- and Frequency-Domain. Sens. Actuators B Chem. 2022, 369, 132349. [Google Scholar] [CrossRef]
- Mittleman, D.M.; Jacobsen, R.H.; Neelamani, R.; Baraniuk, R.G.; Nuss, M.C. Gas Sensing Using Terahertz Time-Domain Spectroscopy. Appl. Phys. B-Lasers Opt. 1998, 67, 379–390. [Google Scholar] [CrossRef]
- Neese, C.F.; Medvedev, I.R.; Plummer, G.M.; Frank, A.J.; Ball, C.D.; Lucia, F.C.D. Compact Submillimeter/Terahertz Gas Sensor With Efficient Gas Collection, Preconcentration, and Ppt Sensitivity. IEEE Sens. J. 2012, 12, 2565–2574. [Google Scholar] [CrossRef]
- Zhang, W.; Nickel, D.; Mittleman, D. High-Pressure Cell for Terahertz Time-Domain Spectroscopy. Opt. Express 2017, 25, 2983–2993. [Google Scholar] [CrossRef]
- Neumaier, P.; Schmalz, K.; Borngräber, J.; Kissinger, D.; Hübers, H.W. Terahertz Gas-Sensors: Gas-Phase Spectroscopy and Multivariate Analysis for Medical and Security Applications. In Proceedings of the 2015 IEEE SENSORS, Busan, Republic of Korea, 1–4 November 2015; pp. 1–4. [Google Scholar]
- Kilcullen, P.; Hartley, I.D.; Jensen, E.T.; Reid, M. Terahertz Time Domain Gas-Phase Spectroscopy of Carbon Monoxide. J. Infrared Millim. Terahertz Waves 2015, 36, 380–389. [Google Scholar] [CrossRef]
- Sang, B.H.; Jeon, T.-I. Pressure-Dependent Refractive Indices of Gases by THz Time-Domain Spectroscopy. Opt. Express 2016, 24, 29040–29047. [Google Scholar] [CrossRef]
- Foltynowicz, R.J.; Wanke, M.C.; Mangan, M.A. Atmospheric Propagation of THz Radiation; Sandia National Laboratories: Albuquerque, NM, USA, 2005; pp. 1–20.
- Vaks, V.; Domracheva, E.; Chernyaeva, M. THz Analyzers for Breath Research. In Proceedings of the 2016 21st International Conference on Microwave, Radar and Wireless Communications (MIKON), Krakow, Poland, 9–11 May 2016; pp. 1–4. [Google Scholar]
- Zhang, J.; Grischkowsky, D. Terahertz Time-Domain Spectroscopy Study of Silica Aerogels and Adsorbed Molecular Vapors. J. Phys. Chem. B 2004, 108, 18590–18600. [Google Scholar] [CrossRef]
- Theuer, M.; Harsha, S.S.; Molter, D.; Torosyan, G.; Beigang, R. Terahertz Time-Domain Spectroscopy of Gases, Liquids, and Solids. Chemphyschem 2011, 12, 2695–2705. [Google Scholar] [CrossRef] [PubMed]
- Waters, J. Submillimeter-Wavelength Heterodyne Spectroscopy and Remote-Sensing of the Upper-Atmosphere. Proc. IEEE 1992, 80, 1679–1701. [Google Scholar] [CrossRef]
- Voitsekhovskaya, O.K.; Egorov, O.V. The Absorption of Sulfur Dioxide in the Terahertz Range at Temperatures of 300–1200 K. Mosc. Univ. Phys. Bull. 2013, 68, 132–138. [Google Scholar] [CrossRef]
- Yao, J.; Wang, R.; Cui, H.; Wang, J. Atmospheric Propagation of Terahertz Radiation. In Remote Sensing—Advanced Techniques and Platforms; Escalante, B., Ed.; InTech: Houston, TX, USA, 2012; ISBN 978-953-51-0652-4. [Google Scholar]
- Yang, Y.; Shutler, A.; Grischkowsky, D. Measurement of the Transmission of the Atmosphere from 0.2 to 2 THz. Opt. Express 2011, 19, 8830–8838. [Google Scholar] [CrossRef] [PubMed]
- Slocum, D.M.; Slingerland, E.J.; Giles, R.H.; Goyette, T.M. Atmospheric Absorption of Terahertz Radiation and Water Vapor Continuum Effects. J. Quant. Spectrosc. Radiat. Transf. 2013, 127, 49–63. [Google Scholar] [CrossRef]
- Yang, Y.; Mandehgar, M.; Grischkowsky, D.R. Broadband THz Pulse Transmission through the Atmosphere. IEEE Trans. Terahertz Sci. Technol. 2011, 1, 264–273. [Google Scholar] [CrossRef]
- Vogt, D.W.; Jones, A.H.; Leonhardt, R. Terahertz Gas-Phase Spectroscopy Using a Sub-Wavelength Thick Ultrahigh-Q Microresonator. Sensors 2020, 20, 3005. [Google Scholar] [CrossRef]
- Xin, X.; Altan, H.; Saint, A.; Matten, D.; Alfano, R.R. Terahertz Absorption Spectrum of Para and Ortho Water Vapors at Different Humidities at Room Temperature. J. Appl. Phys. 2006, 100, 094905. [Google Scholar] [CrossRef]
- Sun, H.; Yang, Z.; Kinev, N.V.; Kiselev, O.S.; Lv, Y.; Huang, Y.; Hao, L.; Zhou, X.; Ji, M.; Tu, X.; et al. Terahertz Spectroscopy of Dilute Gases Using Bi2Sr2CaCu2O8+δ Intrinsic Josephson-Junction Stacks. Phys. Rev. Appl. 2017, 8, 054005. [Google Scholar] [CrossRef]
- Bigourd, D.; Mouret, G.; Cuisset, A.; Hindle, F.; Fertein, E.; Bocquet, R. Rotational Spectroscopy and Dynamics of Carbonyl Sulphide Studied by Terahertz Free Induction Decays Signals. Opt. Commun. 2008, 281, 3111–3119. [Google Scholar] [CrossRef]
- Melinger, J.S.; Harsha, S.S.; Laman, N.; Grischkowsky, D. Temperature Dependent Characterization of Terahertz Vibrations of Explosives and Related Threat Materials. Opt. Express 2010, 18, 27238–27250. [Google Scholar] [CrossRef]
- Cai, H.; Wang, D.; Shen, J. Study on Terahertz Spectra of SO2 and H2S. Sci. China Phys. Mech. Astron. 2013, 56, 685–690. [Google Scholar] [CrossRef]
- Pacheco-Torgal, F.; Jalali, S. Nanotechnology: Advantages and Drawbacks in the Field of Construction and Building Materials. Constr. Build. Mater. 2011, 25, 582–590. [Google Scholar] [CrossRef]
- Varol, Y.; Öner, C.; Öztop, H.F.; Altun, Ş. Comparison of Methanol, Ethanol, or n-Butanol Blending with Unleaded Gasoline on Exhaust Emissions of an SI Engine. Energy Sources Part Recovery Util. Environ. Eff. 2014, 36, 938–948. [Google Scholar] [CrossRef]
- Zhu, J.; Zhan, H.L.; Miao, X.Y.; Song, Y.; Zhao, K. Adsorption Dynamics and Rate Assessment of Volatile Organic Compounds in Active Carbon. Phys. Chem. Chem. Phys. PCCP 2016, 18, 27175–27178. [Google Scholar] [CrossRef]
- Graber, B.; Kim, C.; Wu, D.H. High SNR Single Measurements of Trace Gas Phase Spectra at THz Frequencies. Appl. Phys. Lett. 2017, 111, 221107. [Google Scholar] [CrossRef]
- Lin, S.; Liu, W.; Hou, X.; Peng, Z.; Chen, Z.; Hu, F. Specific Detection of N-Propanol Gas via Terahertz Metasurface Sensor Modified by Molecularly Imprinted Polymer. Spectrochim. Acta. A Mol. Biomol. Spectrosc. 2023, 292, 122413. [Google Scholar] [CrossRef]
- Altemose, B.; Gong, J.; Zhu, T.; Hu, M.; Zhang, L.; Cheng, H.; Zhang, L.; Tong, J.; Kipen, H.M.; Strickland, P.O.; et al. Aldehydes in Relation to Air Pollution Sources: A Case Study around the Beijing Olympics. Atmos. Environ. 2015, 109, 61–69. [Google Scholar] [CrossRef]
- Harde, H.; Zhao, J.; Wolff, M.; Cheville, R.A.; Grischkowsky, D. THz Time-Domain Spectroscopy on Ammonia. J. Phys. Chem. A 2001, 105, 6038–6047. [Google Scholar] [CrossRef]
- Tang, N.; Hattori, T.; Taga, R.; Igarashi, K.; Yang, X.; Tamura, K.; Kakimoto, H.; Mishukov, V.F.; Toriba, A.; Kizu, R.; et al. Polycyclic Aromatic Hydrocarbons and Nitropolycyclic Aromatic Hydrocarbons in Urban Air Particulates and Their Relationship to Emission Sources in the Pan–Japan Sea Countries. Atmos. Environ. 2005, 39, 5817–5826. [Google Scholar] [CrossRef]
- Gupta, S.; Pathak, B.; Fulekar, M.H. Molecular Approaches for Biodegradation of Polycyclic Aromatic Hydrocarbon Compounds: A Review. Rev. Environ. Sci. Biotechnol. 2015, 14, 241–269. [Google Scholar] [CrossRef]
- Du, Y.; Fang, H.; Zhang, Q.; Hong, Z. Terahertz Spectroscopic Characterization of Naphthalene and 1-Nitronaphthalene. In Proceedings of the 2015 40th International Conference on Infrared, Millimeter, and Terahertz waves (IRMMW-THz), Hong Kong, China, 23–28 August 2015; pp. 1–2. [Google Scholar]
- Cataldo, F.; Angelini, G.; Aníbal García-Hernández, D.; Manchado, A. Far Infrared (Terahertz) Spectroscopy of a Series of Polycyclic Aromatic Hydrocarbons and Application to Structure Interpretation of Asphaltenes and Related Compounds. Spectrochim. Acta. A Mol. Biomol. Spectrosc. 2013, 111, 68–79. [Google Scholar] [CrossRef] [PubMed]
- Han, J.; Xu, H.; Zhu, Z.; Yu, X.; Li, W. Terahertz Spectroscopy of Naphthalene, α-Naphthol, β-Naphthol, Biphenyl and Anthracene. Chem. Phys. Lett. 2004, 392, 348–351. [Google Scholar] [CrossRef]
- Luengas, A.; Barona, A.; Hort, C.; Gallastegui, G.; Platel, V.; Elias, A. A Review of Indoor Air Treatment Technologies. Rev. Environ. Sci. Biotechnol. 2015, 14, 499–522. [Google Scholar] [CrossRef]
- Allodi, M.A.; Ioppolo, S.; Kelley, M.J.; McGuire, B.A.; Blake, G.A. The Structure and Dynamics of Carbon Dioxide and Water Containing Ices Investigated via THz and Mid-IR Spectroscopy. Phys. Chem. Chem. Phys. 2014, 16, 3442–3455. [Google Scholar] [CrossRef]
- Shimizu, N.; Matsuyama, K.; Hosako, I. Absorption Spectra of Hydrogen Chloride and Carbon Monoxide in Smoke. In Proceedings of the 2012 37th International Conference on Infrared, Millimeter, and Terahertz Waves, Wollongong, NSW, Australia, 23–28 September 2012; pp. 1–2. [Google Scholar]
- Su, Y.; Zheng, X.; Deng, X. Terahertz Spectrum Analysis Based on Empirical Mode Decomposition. J. Infrared Millim. Terahertz Waves 2017, 38, 972–979. [Google Scholar] [CrossRef]
- Nolt, I.G.; Radostitz, J.V.; DiLonardo, G.; Evenson, K.M.; Jennings, D.A.; Leopold, K.R.; Vanek, M.D.; Zink, L.R.; Hinz, A.; Chance, K.V. Accurate Rotational Constants of CO, HCl, and HF: Spectral Standards for the 0.3- to 6-THz (10- to 200-cm−1) Region. J. Mol. Spectrosc. 1987, 125, 274–287. [Google Scholar] [CrossRef]
- Harmon, S.A.; Cheville, R.A. Part-per-Million Gas Detection from Long-Baseline THz Spectroscopy. Appl. Phys. Lett. 2004, 85, 2128–2130. [Google Scholar] [CrossRef]
- Harde, H.; Katzenellenbogen, N.; Grischkowsky, D. Terahertz Coherent Transients from Methyl Chloride Vapor. JOSA B 1994, 11, 1018–1030. [Google Scholar] [CrossRef]
- Bereiter, B.; Kawamura, K.; Severinghaus, J.P. New Methods for Measuring Atmospheric Heavy Noble Gas Isotope and Elemental Ratios in Ice Core Samples. Rapid Commun. Mass Spectrom. RCM 2018, 32, 801–814. [Google Scholar] [CrossRef]
- Jaszczak, E.; Polkowska, Ż.; Narkowicz, S.; Namieśnik, J. Cyanides in the Environment—Analysis—Problems and Challenges. Environ. Sci. Pollut. Res. Int. 2017, 24, 15929–15948. [Google Scholar] [CrossRef] [PubMed]
- Shimizu, N.; Kikuchi, K.; Ikari, T.; Matsuyama, K.; Wakatsuki, A.; Kohjiro, S.; Fukasawa, R. Absorption Spectra of Smoke Emitted from Heated Nylon Fabric Measured with a Continuous-Wave Sub-Terahertz Spectrometer. Appl. Phys. Express 2011, 4, 032401. [Google Scholar] [CrossRef]
- Sitnikov, D.S.; Romashevskiy, S.A.; Pronkin, A.A.; Ilina, I.V. Open-Path Gas Detection Using Terahertz Time-Domain Spectroscopy. J. Phys. Conf. Ser. 2019, 1147, 012061. [Google Scholar] [CrossRef]
- Badr, O.; Probert, S.D. Environmental Impacts of Atmospheric Nitrous Oxide. Appl. Energy 1993, 44, 197–231. [Google Scholar] [CrossRef]
- Hill, M.K. Understanding Environmental Pollution; Cambridge University Press: Cambridge, UK, 2010; ISBN 978-1-139-48640-8. [Google Scholar]
- Drouin, B.J.; Maiwald, F.W. Extended THz Measurements of Nitrous Oxide, N2O. J. Mol. Spectrosc. 2006, 236, 260–262. [Google Scholar] [CrossRef]
- Kim, G.-R.; Lee, H.-B.; Jeon, T.-I. Terahertz Time-Domain Spectroscopy of Low-Concentration N2O Using Long-Range Multipass Gas Cell. IEEE Trans. Terahertz Sci. Technol. 2020, 10, 524–530. [Google Scholar] [CrossRef]
- Morino, I.; Yamada, K.M.T.; Maki, A.G. Terahertz Measurements of Rotational Transitions in Vibrationally Excited States of N2O. J. Mol. Spectrosc. 1999, 196, 131–138. [Google Scholar] [CrossRef]
- Müller, H.S.P.; Kobayashi, K.; Takahashi, K.; Tomaru, K.; Matsushima, F. Terahertz Spectroscopy of N18O and Isotopic Invariant Fit of Several Nitric Oxide Isotopologs. J. Mol. Spectrosc. 2015, 310, 92–98. [Google Scholar] [CrossRef]
- Drouin, B.J.; Crawford, T.J.; Yu, S. Validation of Ozone Intensities at 10 µm with THz Spectrometry. J. Quant. Spectrosc. Radiat. Transf. 2017, 203, 282–292. [Google Scholar] [CrossRef]
- Xu, J.; Schreier, F.; Loyola, D.; Schüssler, O.; Doicu, A.; Trautmann, T. Monitoring Ozone in Different Spectral Regimes from Space and Balloon (Sentinel-4/-5P, TELIS). In Proceedings of the 2016 IEEE International Geoscience and Remote Sensing Symposium (IGARSS), Beijing, China, 10–15 July 2016; pp. 360–363. [Google Scholar]
- Li, Q.; Zhao, K.; Zhang, L.; Liang, C.; Zhang, Z.; Zhang, C.; Han, D. Probing PM2.5 with Terahertz Wave. Sci. China Phys. Mech. Astron. 2014, 57, 2354–2356. [Google Scholar] [CrossRef]
- Li, N.; Zhan, H.; Zhao, K.; Zhang, Z.; Li, C.; Zhang, C. Characterizing PM2.5 in Beijing and Shanxi Province Using Terahertz Radiation. Front. Optoelectron. 2016, 9, 544–548. [Google Scholar] [CrossRef]
- Frank, N.H. Retained Nitrate, Hydrated Sulfates, and Carbonaceous Mass in Federal Reference Method Fine Particulate Matter for Six Eastern U.S. Cities. J. Air Waste Manag. Assoc. 2006, 56, 500–511. [Google Scholar] [CrossRef] [PubMed]
- Rabbani, K.A.; Charles, W.; Cord-Ruwisch, R.; Ho, G. Recovery of Sulphur from Contaminated Air in Wastewater Treatment Plants by Biofiltration: A Critical Review. Rev. Environ. Sci. Biotechnol. 2015, 14, 523–534. [Google Scholar] [CrossRef]
- Krayzelova, L.; Bartacek, J.; Díaz, I.; Jeison, D.; Volcke, E.I.P.; Jenicek, P. Microaeration for Hydrogen Sulfide Removal during Anaerobic Treatment: A Review. Rev. Environ. Sci. Biotechnol. 2015, 14, 703–725. [Google Scholar] [CrossRef]
- Matton, S.; Rohart, F.; Bocquet, R.; Mouret, G.; Bigourd, D.; Cuisset, A.; Hindle, F. Terahertz Spectroscopy Applied to the Measurement of Strengths and Self-Broadening Coefficients for High-J Lines of OCS. J. Mol. Spectrosc. 2006, 239, 182–189. [Google Scholar] [CrossRef]
- Cazzoli, G.; Cludi, L.; Cotti, G.; Esposti, C.D.; Dore, L. Far Infrared Spectrum of SO in the 3Σ and 1Δ Electronic States. J. Mol. Spectrosc. 1994, 167, 468–471. [Google Scholar] [CrossRef]
- Martin-Drumel, M.A.; Pirali, O.; Eliet, S.; Cuisset, A. High Resolution Far Infrared Laboratory Spectroscopy of Transient Species: Application to the SO Radical (X3Σ). EAS Publ. Ser. 2012, 58, 279–282. [Google Scholar] [CrossRef]
- Martin-Drumel, M.A.; Hindle, F.; Mouret, G.; Cuisset, A.; Cernicharo, J. A Complete Spectroscopic Characterization of SO and Its Isotopologues up to the Terahertz Domain. Astrophys. J. 2015, 799, 115. [Google Scholar] [CrossRef]
- von Kienle, H.; Kunze, N.; Mertens, D.H. The Use of Activated Carbon in the Removal of VOC’s. Stud. Environ. Sci. 1994, 61, 321–329. [Google Scholar] [CrossRef]
- Mohamed, F.; Kim, J.; Huang, R.; Nu, H.T.; Lorenzo, V. Efficient Control of Odors and VOC Emissions via Activated Carbon Technology. Water Environ. Res. 2014, 68, 594–605. [Google Scholar] [CrossRef]
- Zhu, J.; Zhan, H.; Miao, X.; Zhao, K.; Zhou, Q. Terahertz Double-Exponential Model for Adsorption of Volatile Organic Compounds in Active Carbon. J. Phys. Appl. Phys. 2017, 50, 235103. [Google Scholar] [CrossRef]
- You, B.; Ho, C.-H.; Zheng, W.-J.; Lu, J.-Y. Terahertz Volatile Gas Sensing by Using Polymer Microporous Membranes. Opt. Express 2015, 23, 2048–2057. [Google Scholar] [CrossRef] [PubMed]
- Phillips, M.; Herrera, J.; Krishnan, S.; Zain, M.; Greenberg, J.; Cataneo, R.N. Variation in Volatile Organic Compounds in the Breath of Normal Humans. J. Chromatogr. B Biomed. Sci. Appl. 1999, 729, 75–88. [Google Scholar] [CrossRef] [PubMed]
- Komatsu, K.; Iwamoto, T.; Ito, H.; Saitoh, H. THz Gas Sensing Using Terahertz Time-Domain Spectroscopy with Ceramic Architecture. ACS Omega 2022, 7, 30768–30772. [Google Scholar] [CrossRef]
- Vaks, V.; Anfertev, V.; Chernyaeva, M.; Domracheva, E.; Shcherbatyuk, T.G.; Zhukova, E.S. Analysis of Rodent’s Urine Vapors with Using THz High Resolution Spectrometer for Revealing the Markers of Dysbacteriosis. Int. Conf. Adv. Laser Technol. ALT 2022, 217. [Google Scholar] [CrossRef]
- Vaks, V.; Aizenshtadt, A.; Anfertev, V.; Chernyaeva, M.; Domracheva, E.; Gavrilova, K.; Larin, R.; Pripolzin, S.; Shakhova, M. Analysis of the Thermal Decomposition Products of Pathological and Healthy Tissues in Paranasal Sinuses: A High-Resolution Terahertz Gas Spectroscopy Study. Appl. Sci. 2021, 11, 7562. [Google Scholar] [CrossRef]
- Vaks, V.L.; Domracheva, E.G.; Chernyaeva, M.B.; Anfertev, V.A.; Maslennikova, A.V.; Zheleznyak, A.V.; Knyazeva, T.D.; Rodionov, M.A.; Maiorov, A.I. Application of a High-Resolution Terahertz Gas Spectroscopy Method to Compositional Analysis of Thermal Decomposition Products of Human Fluids (Urine). J. Opt. Technol. 2022, 89, 243–249. [Google Scholar] [CrossRef]
- Yasui, T.; Kawamoto, K.; Hsieh, Y.-D.; Sakaguchi, Y.; Jewariya, M.; Inaba, H.; Minoshima, K.; Hindle, F.; Araki, T. Enhancement of Spectral Resolution and Accuracy in Asynchronous-Optical-Sampling Terahertz Time-Domain Spectroscopy for Low-Pressure Gas-Phase Analysis. Opt. Express 2012, 20, 15071–15078. [Google Scholar] [CrossRef]
- Kim, G.-J.; Jeon, S.-G.; Kim, J.-I.; Jin, Y.-S. High Speed Scanning of Terahertz Pulse by a Rotary Optical Delay Line. Rev. Sci. Instrum. 2008, 79, 106102. [Google Scholar] [CrossRef]
- Burford, N.M.; El-Shenawee, M.O. Review of Terahertz Photoconductive Antenna Technology. Opt. Eng. 2017, 56, 010901. [Google Scholar] [CrossRef]
- Passarelli, A.; Rice, T.E.; Chowdhury, M.A.Z.; Powers, M.N.; Mansha, M.W.; Wilke, I.; Hella, M.M.; Oehlschlaeger, M.A. Terahertz-Wave Absorption Gas Sensing for Dimethyl Sulfoxide. Appl. Sci. 2022, 12, 5729. [Google Scholar] [CrossRef]


| THz-TDS | THz-FDS | |
|---|---|---|
| THz source | ultrafast femtosecond laser in combination with non-linear crystals or photoconductive antennas (optical rectification or difference frequency generation), free electron lasers (FELs), quantum cascade lasers (QCLs) | continuous-wave (CW) or tunable THz source (QCLs, backward wave oscillators), photomixing using two laser beams and Schottky diodes, FELs, femtosecond laser |
| THz detector | electro-optic crystals, photoconductive antennas, bolometers | bolometer, quantum cascade detectors (QCDs), Golay cell, Schottky diodes |
| Emitted THz radiation | broadband ultrashort THz pulses | frequency-modulated narrowband or continuous-wave THz radiation |
| Measured data | amplitude and phase as a time-domain analysis of THz waveform | amplitude and phase as a function of the modulation frequency |
| Spectral resolution | high spectral resolution within wide frequency range | high spectral resolution within the limited frequency range |
| Spectral information | broadband spectral information | spectral information at specific frequencies |
| System complexity | complex, more sensitive to environmental parameters | simplified, portable, compact |
| Trace gas analysis | high sensitivity lower selectivity | lower sensitivity higher selectivity (target-specific gas absorption lines at precise frequencies) |
| Target Gas | LOD (as Analyte Concentration) | Pressure (kPa) | Temperature (K) | Cell Length (cm) | Reference |
|---|---|---|---|---|---|
| n-propanol | 50 to 500 ppm | NA | NA | NA | [109] |
| ethanol | 75 ppb (predictions) | 101.3 | 300 | 200 | [47] |
| methanol | 45 ppb (predictions) | 101.3 | 300 | 200 | [47] |
| acetone | 18 ppb (predictions) | 101.3 | 300 | 200 | [47] |
| ammonia | 20 ppm | 0.10 | NA | 500 | [9] |
| acetonitrile | 200 ppm | 101.3 | NA | 20 and 50 | [39] |
| hydrogen cyanide | 2 ppm | 101.3 | NA | NA | [37] |
| sulphur dioxide | 100 ppm | 0.10 | NA | 500 | [9] |
| carbon monoxide | 40 ppm | 13.3–133 | 300 | 13.6 cm | [87] |
| acetonitrile | 10 ppm | 101.3 | 300 | NA | [108] |
| water vapour | 4 ppm | 101.3 | 300 | NA | [99] |
| dimethyl sulphoxide | 50–100 ppm | 0.053 | 297 | 21.6 cm | [157] |
| nitrous oxide | 1% (10,000 ppm) | 101.3 | 295 | 1861 | [131] |
| VOC | 1 ppm | NA | 300 | NA | [150] |
Disclaimer/Publisher’s Note: The statements, opinions and data contained in all publications are solely those of the individual author(s) and contributor(s) and not of MDPI and/or the editor(s). MDPI and/or the editor(s) disclaim responsibility for any injury to people or property resulting from any ideas, methods, instructions or products referred to in the content. |
© 2023 by the authors. Licensee MDPI, Basel, Switzerland. This article is an open access article distributed under the terms and conditions of the Creative Commons Attribution (CC BY) license (https://creativecommons.org/licenses/by/4.0/).
Share and Cite
Abina, A.; Puc, U.; Jazbinšek, M.; Zidanšek, A. Analytical Gas Sensing in the Terahertz Spectral Range. Micromachines 2023, 14, 1987. https://doi.org/10.3390/mi14111987
Abina A, Puc U, Jazbinšek M, Zidanšek A. Analytical Gas Sensing in the Terahertz Spectral Range. Micromachines. 2023; 14(11):1987. https://doi.org/10.3390/mi14111987
Chicago/Turabian StyleAbina, Andreja, Uroš Puc, Mojca Jazbinšek, and Aleksander Zidanšek. 2023. "Analytical Gas Sensing in the Terahertz Spectral Range" Micromachines 14, no. 11: 1987. https://doi.org/10.3390/mi14111987