
Trapping of a Single Microparticle Using AC Dielectrophoresis Forces in a Microfluidic Chip
 , ,
, , 
Abstract
:1. Introduction
2. Materials and Methods
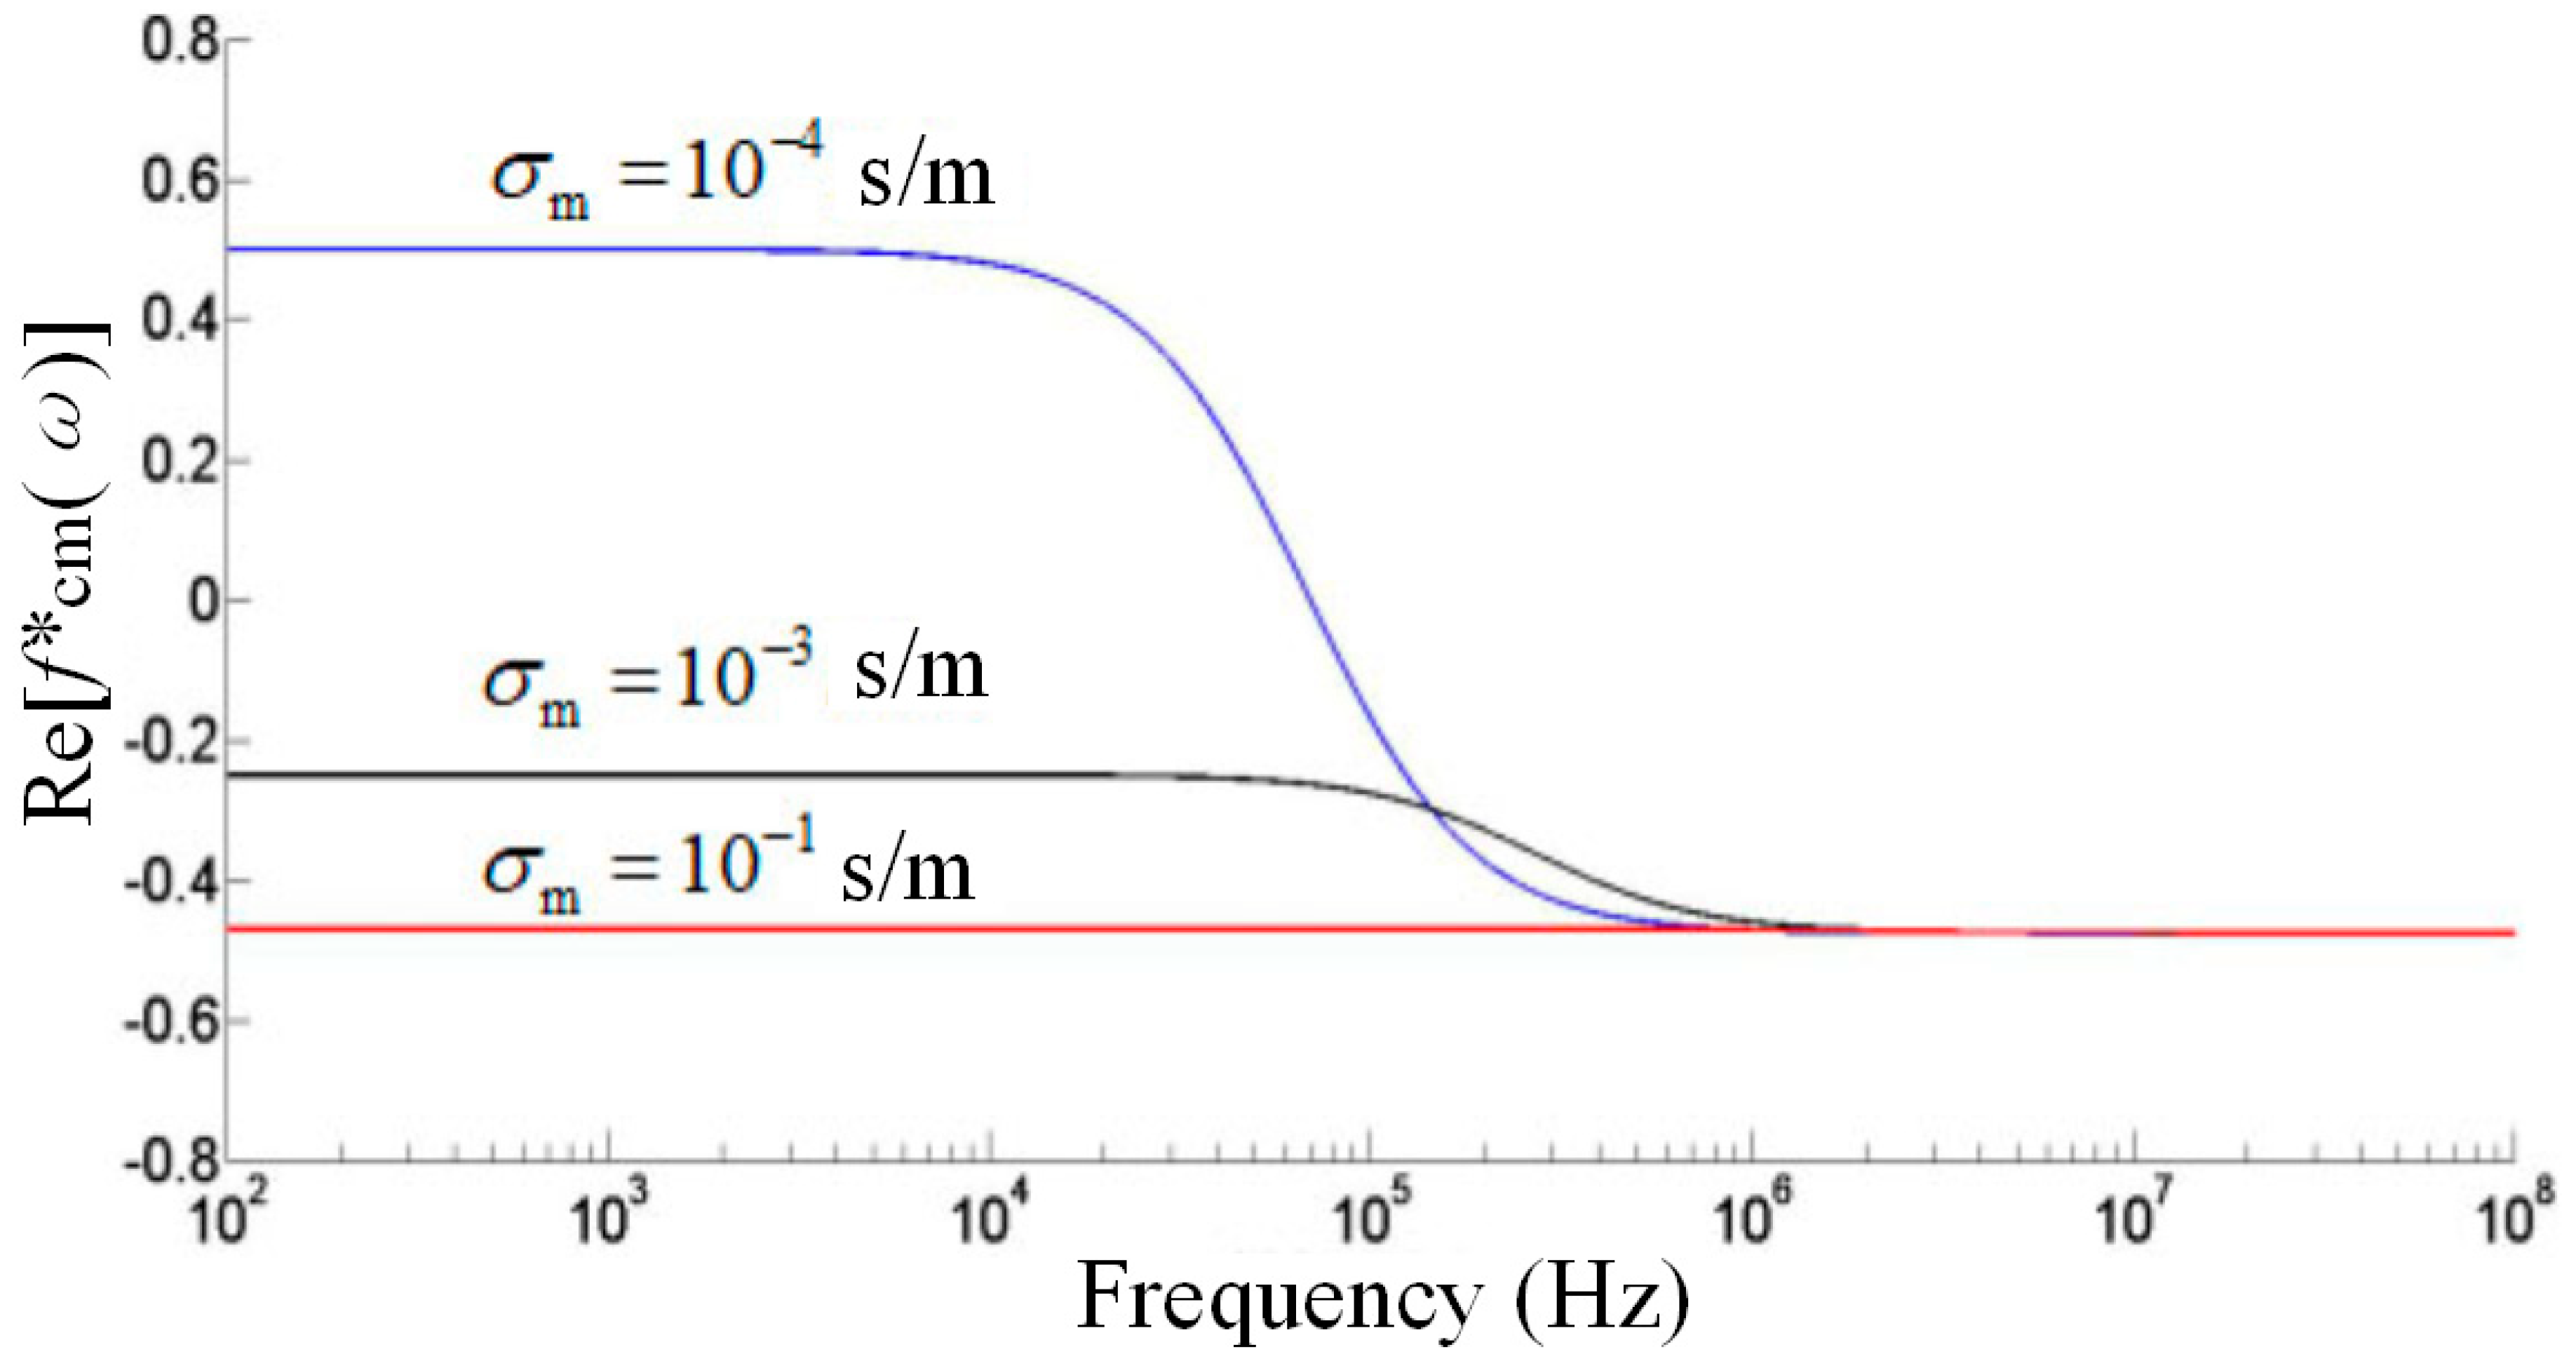
2.1. Theory
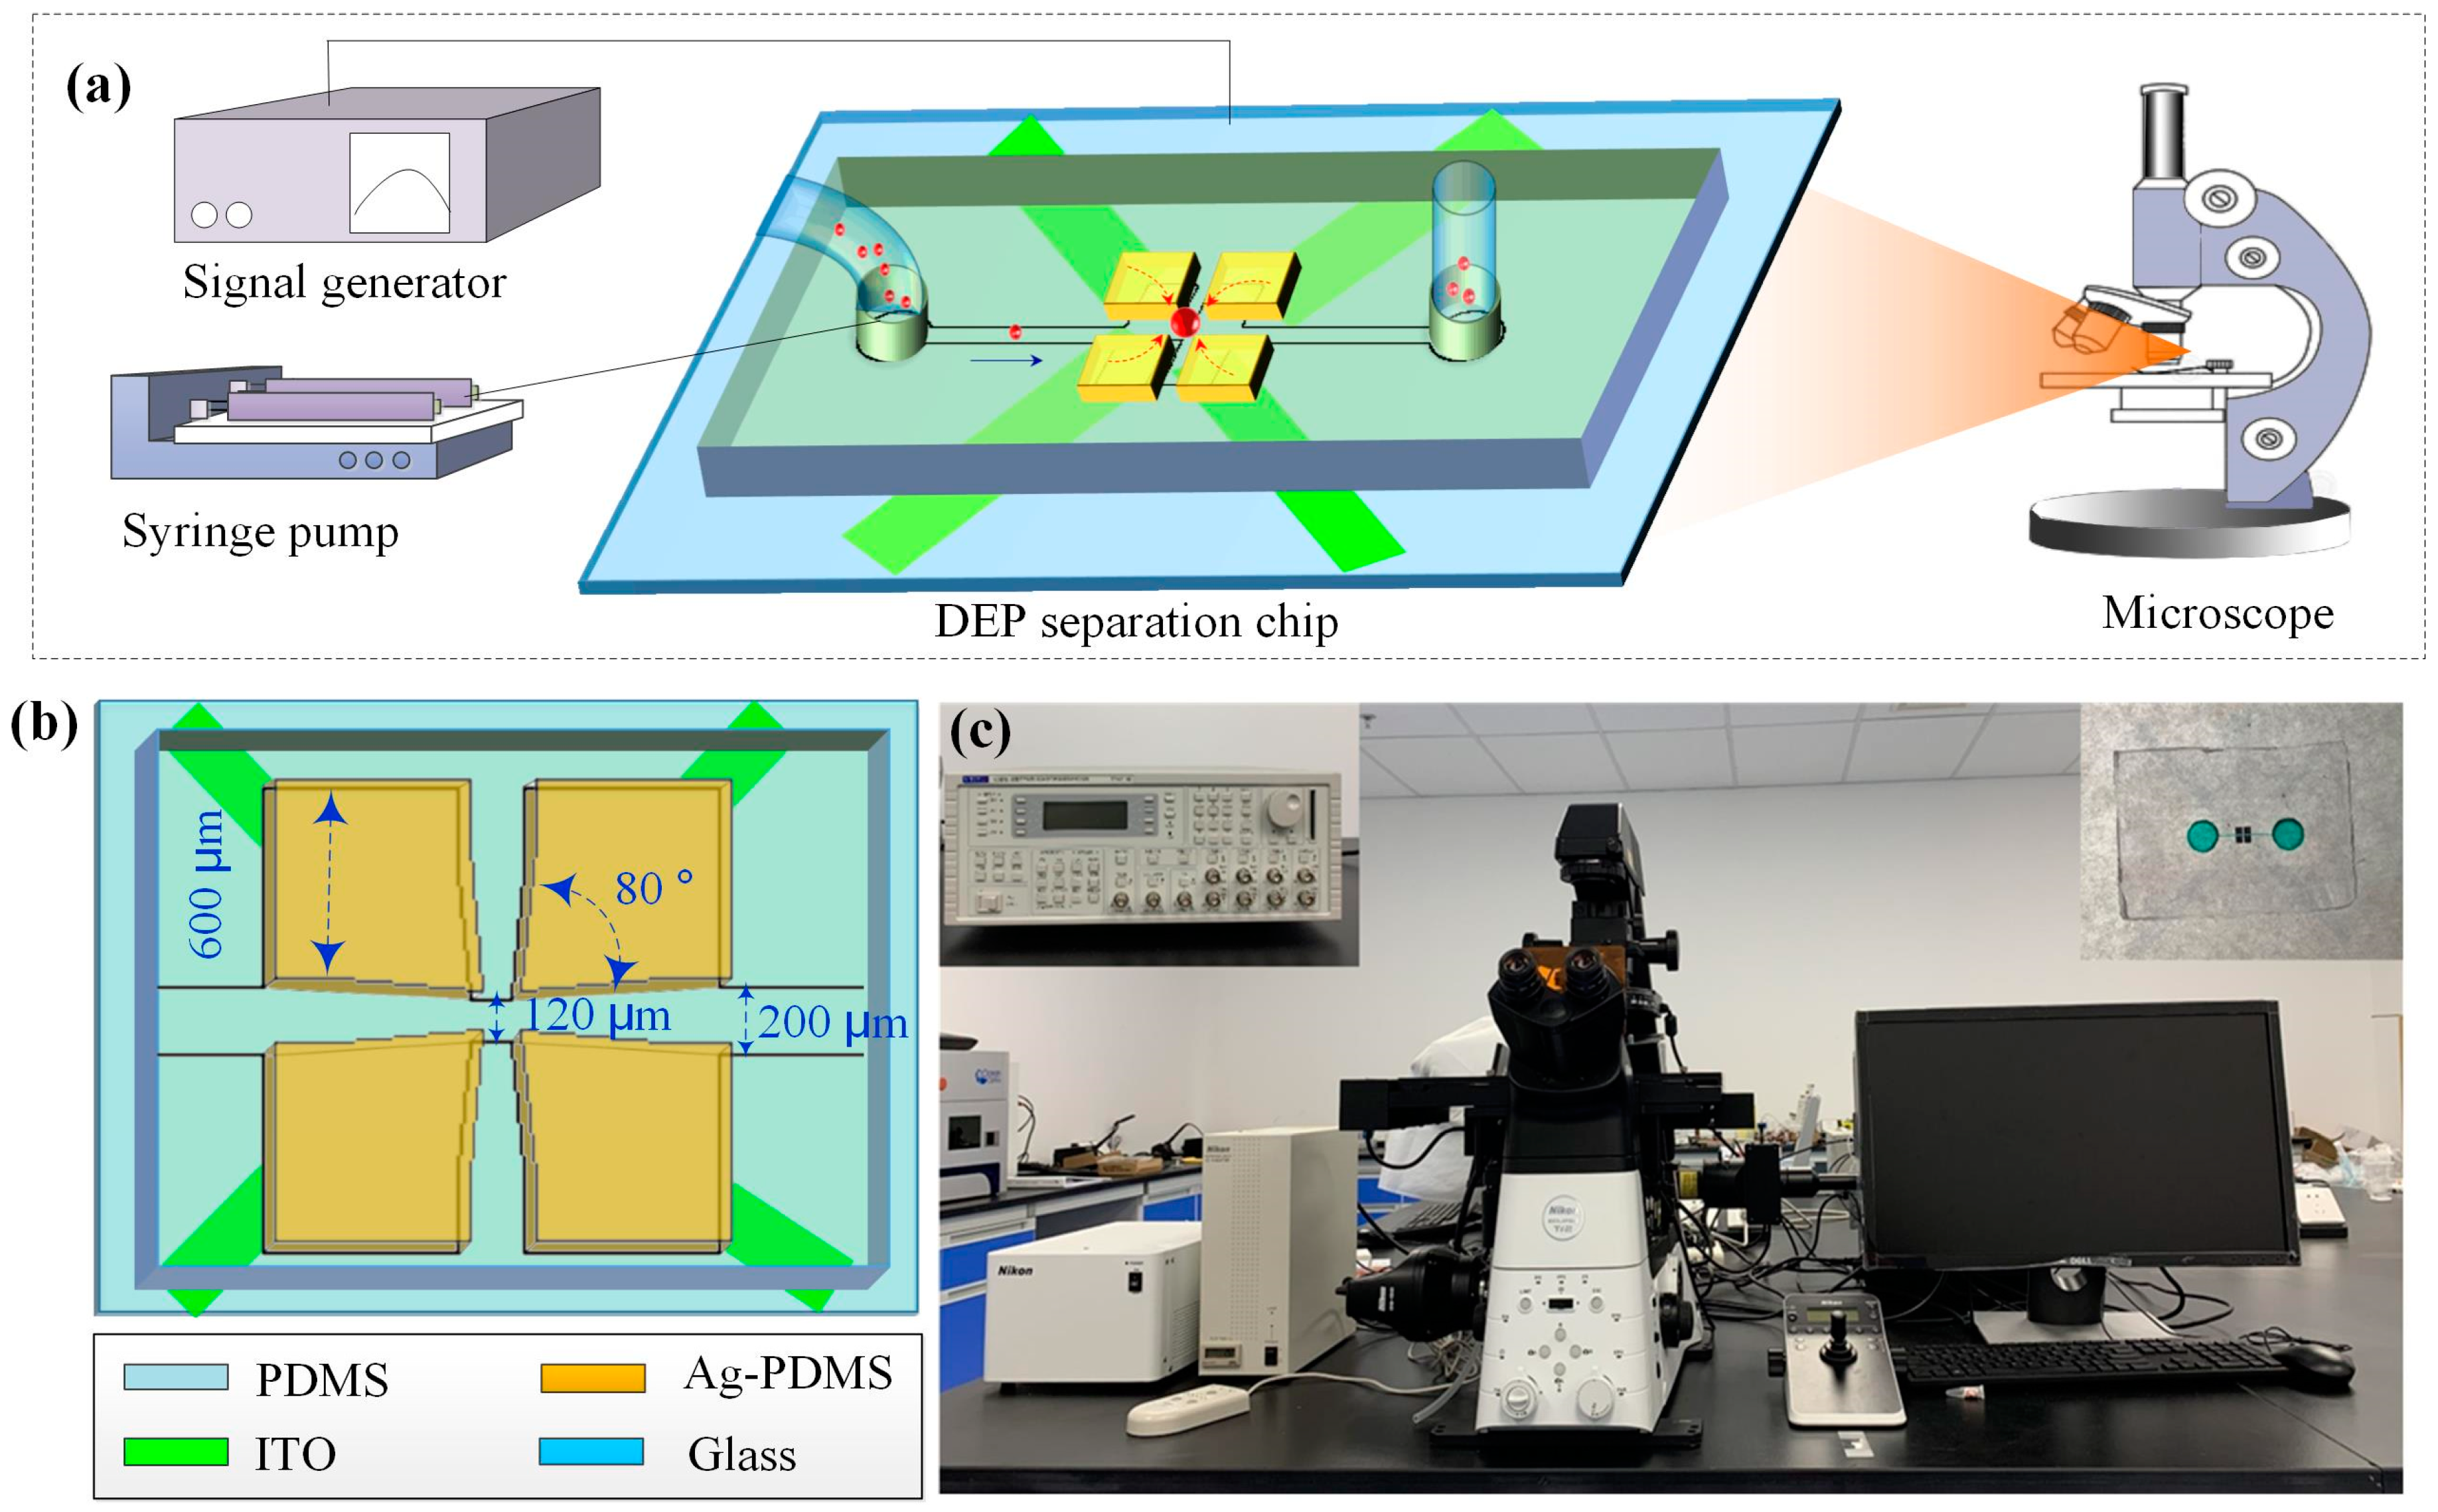
2.2. System Design
2.3. Sample Preparation
2.3.1. The Preparation of Phosphate Buffered Saline (PBS) Solution
2.3.2. The Preparation of Polystyrene Particles
2.4. Experimental Steps
3. Results and Discussion
3.1. Electrode Structure Optimization and Numerical Simulation
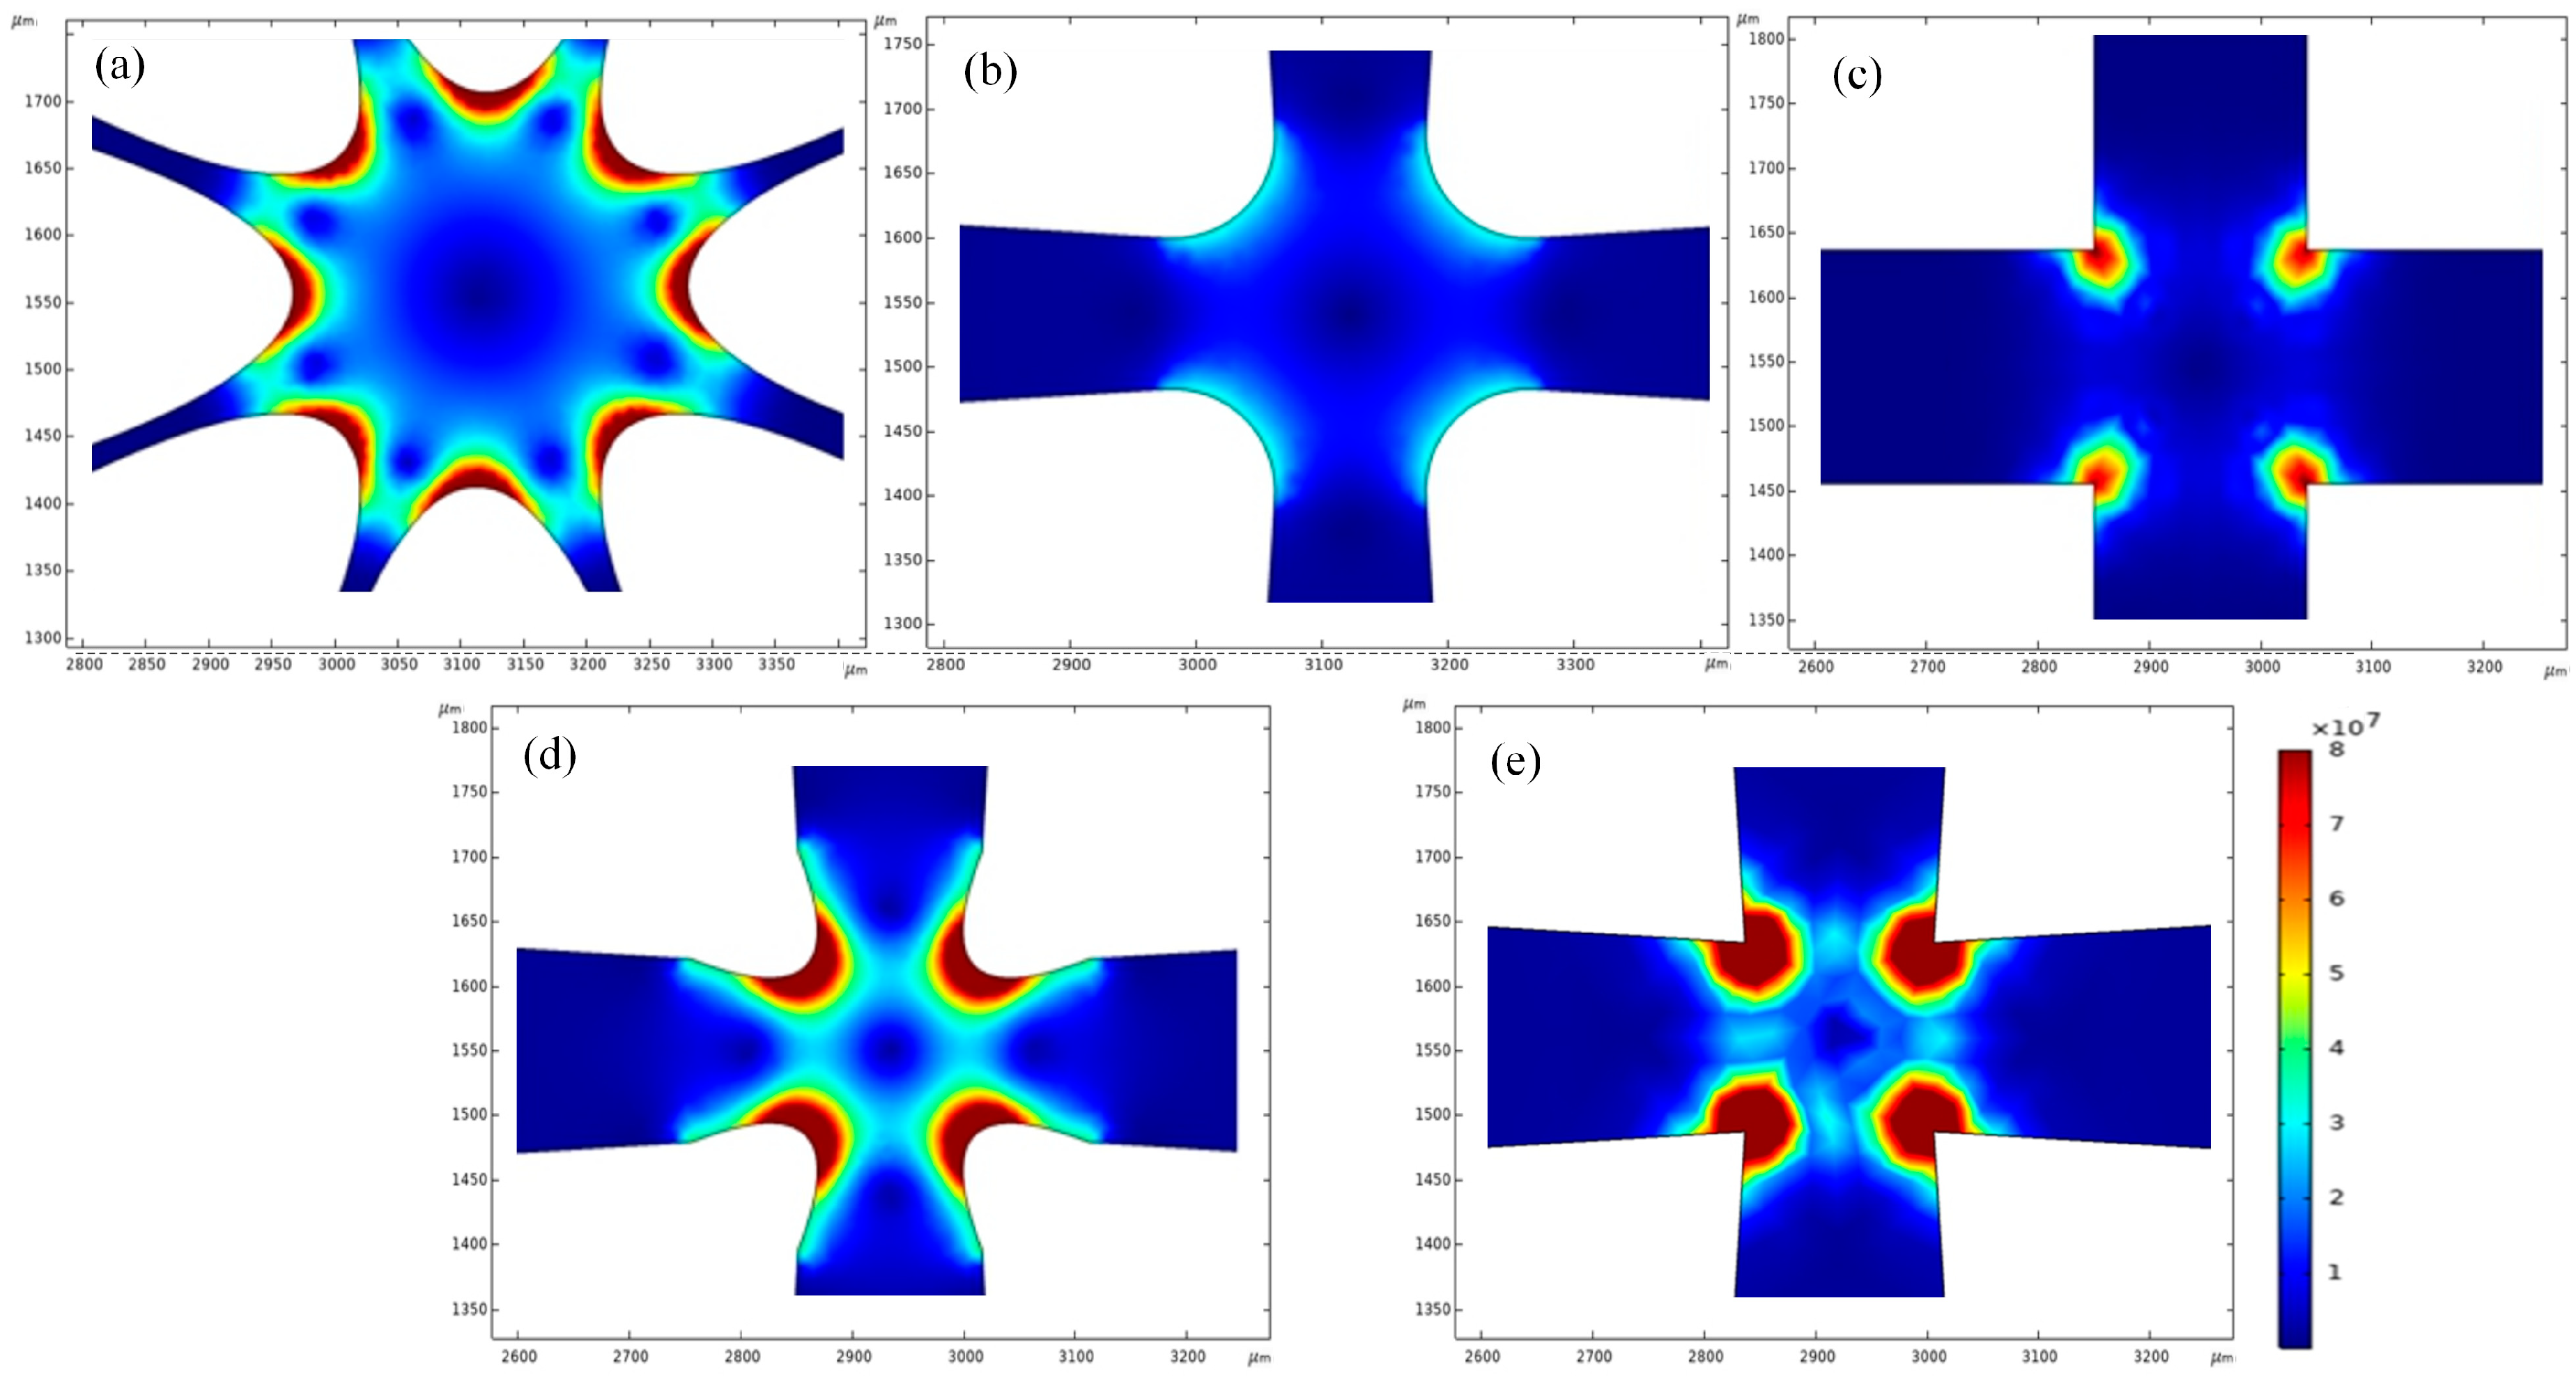
3.1.1. The Influence of Electrode Shape
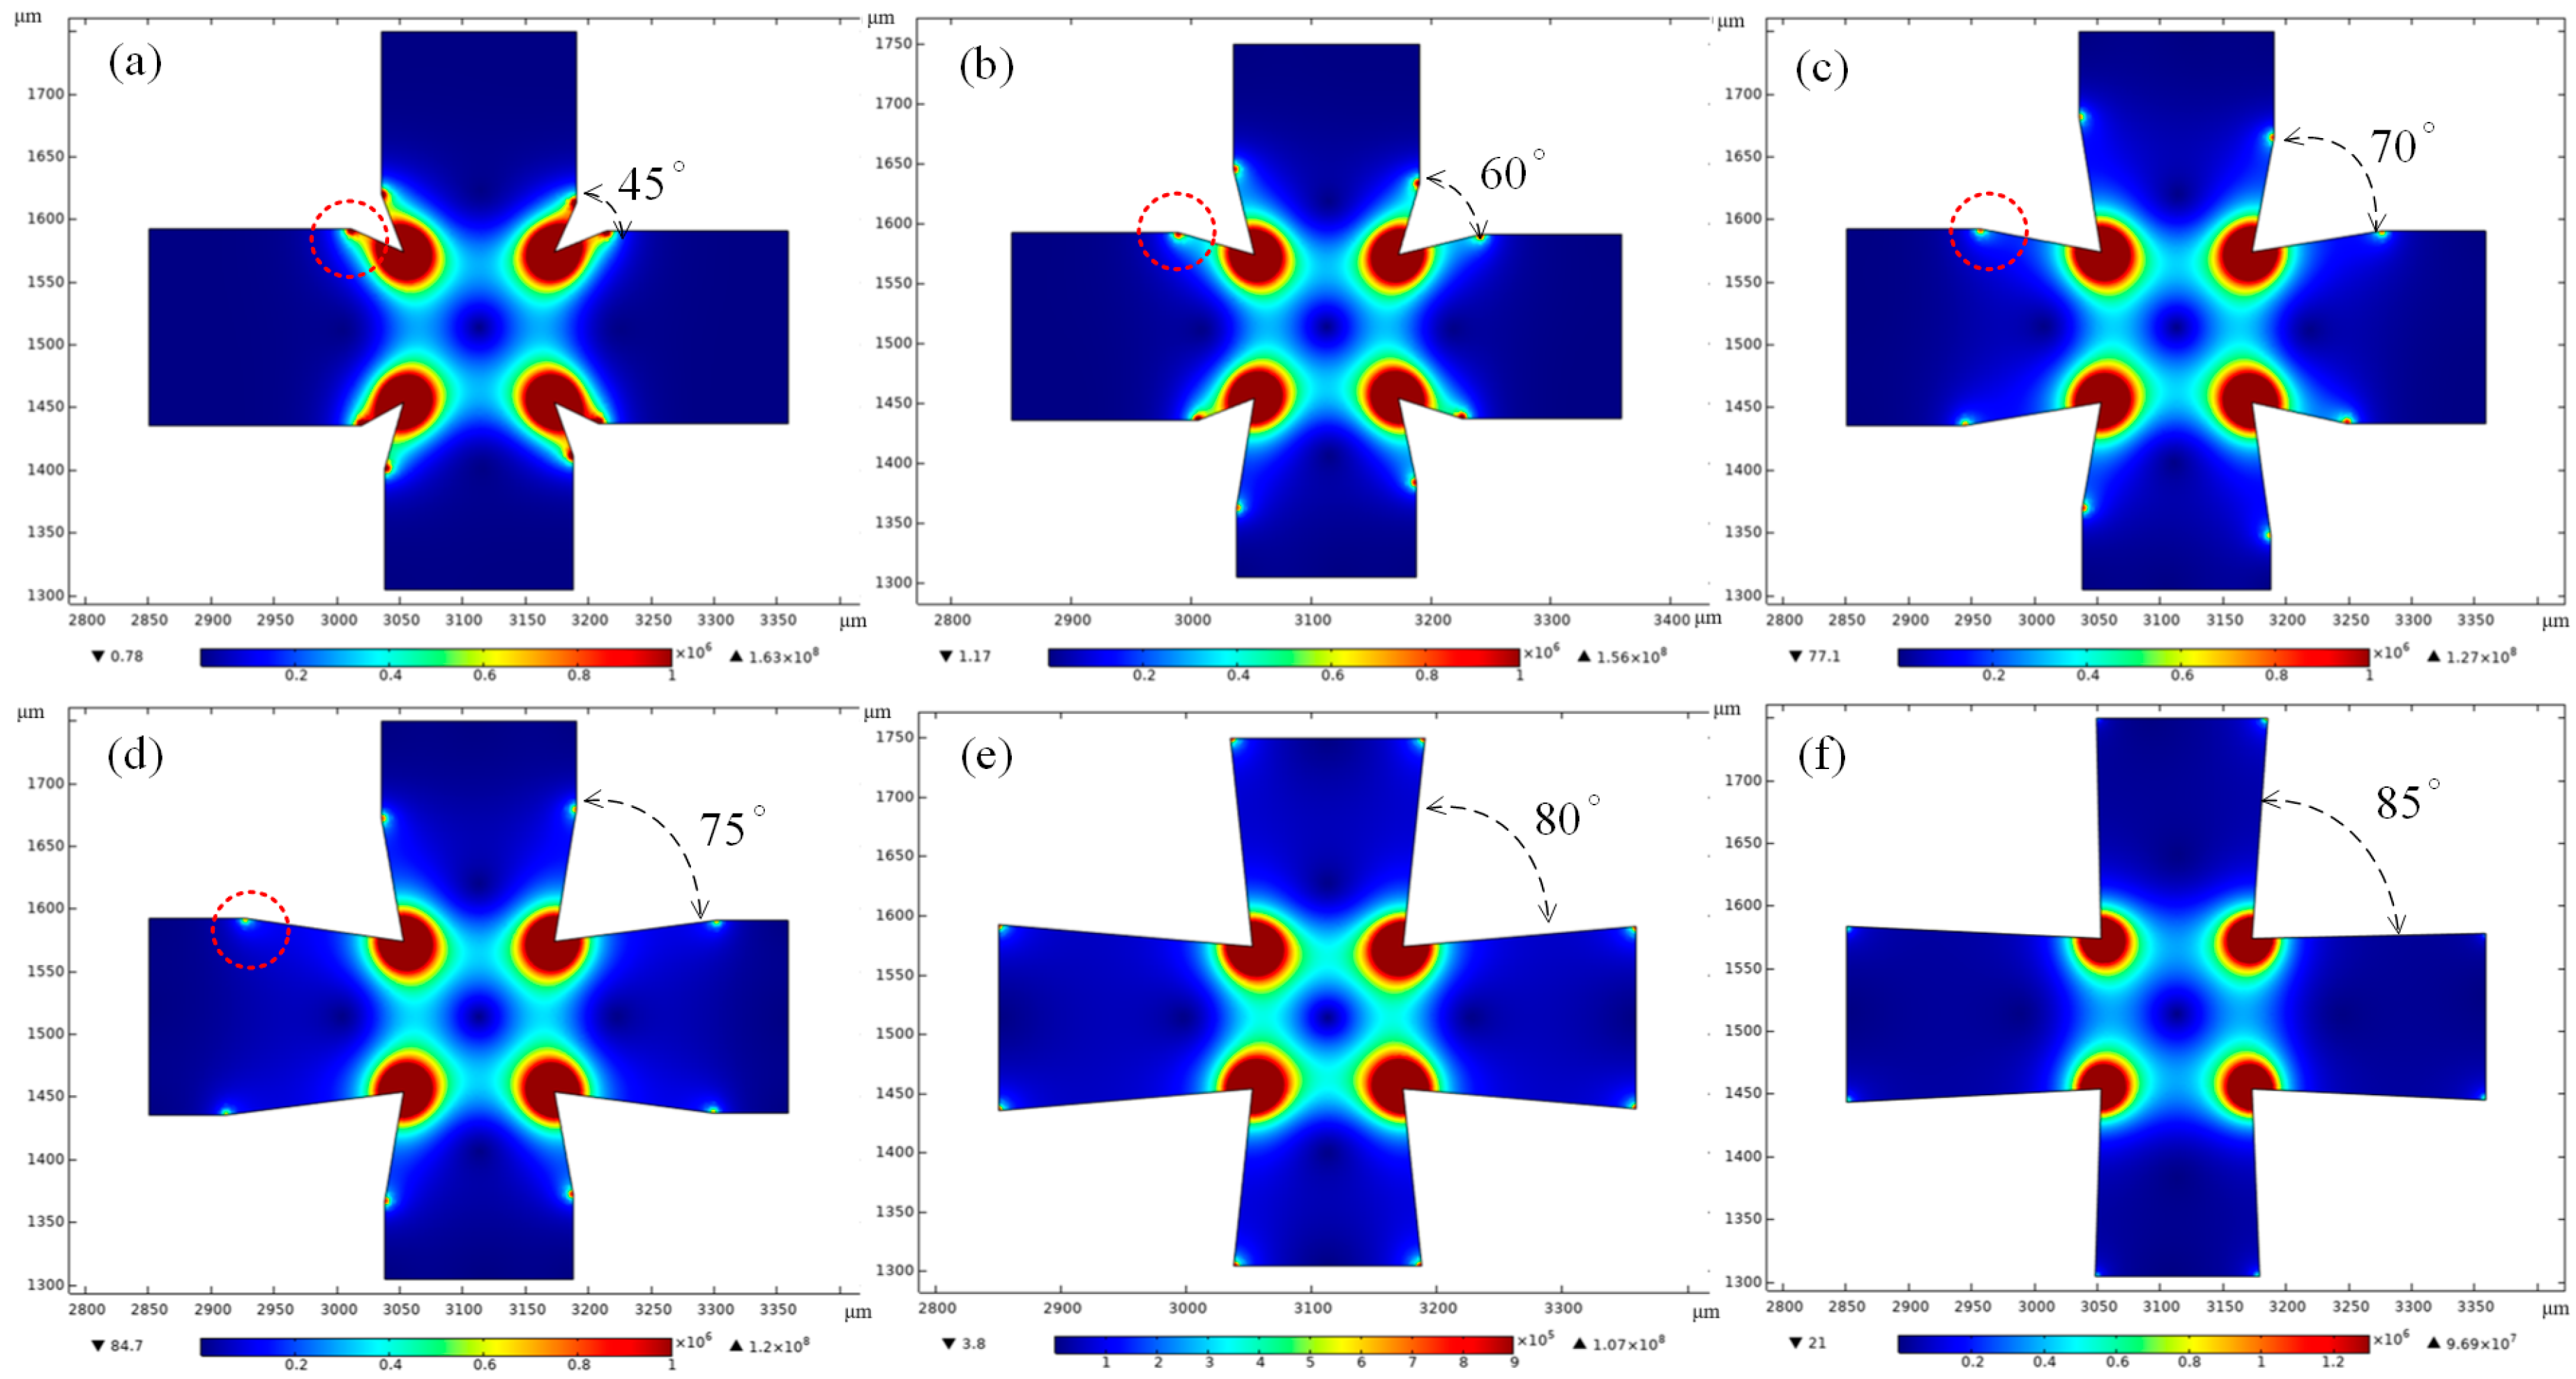
3.1.2. The Influence of Electrode Angle
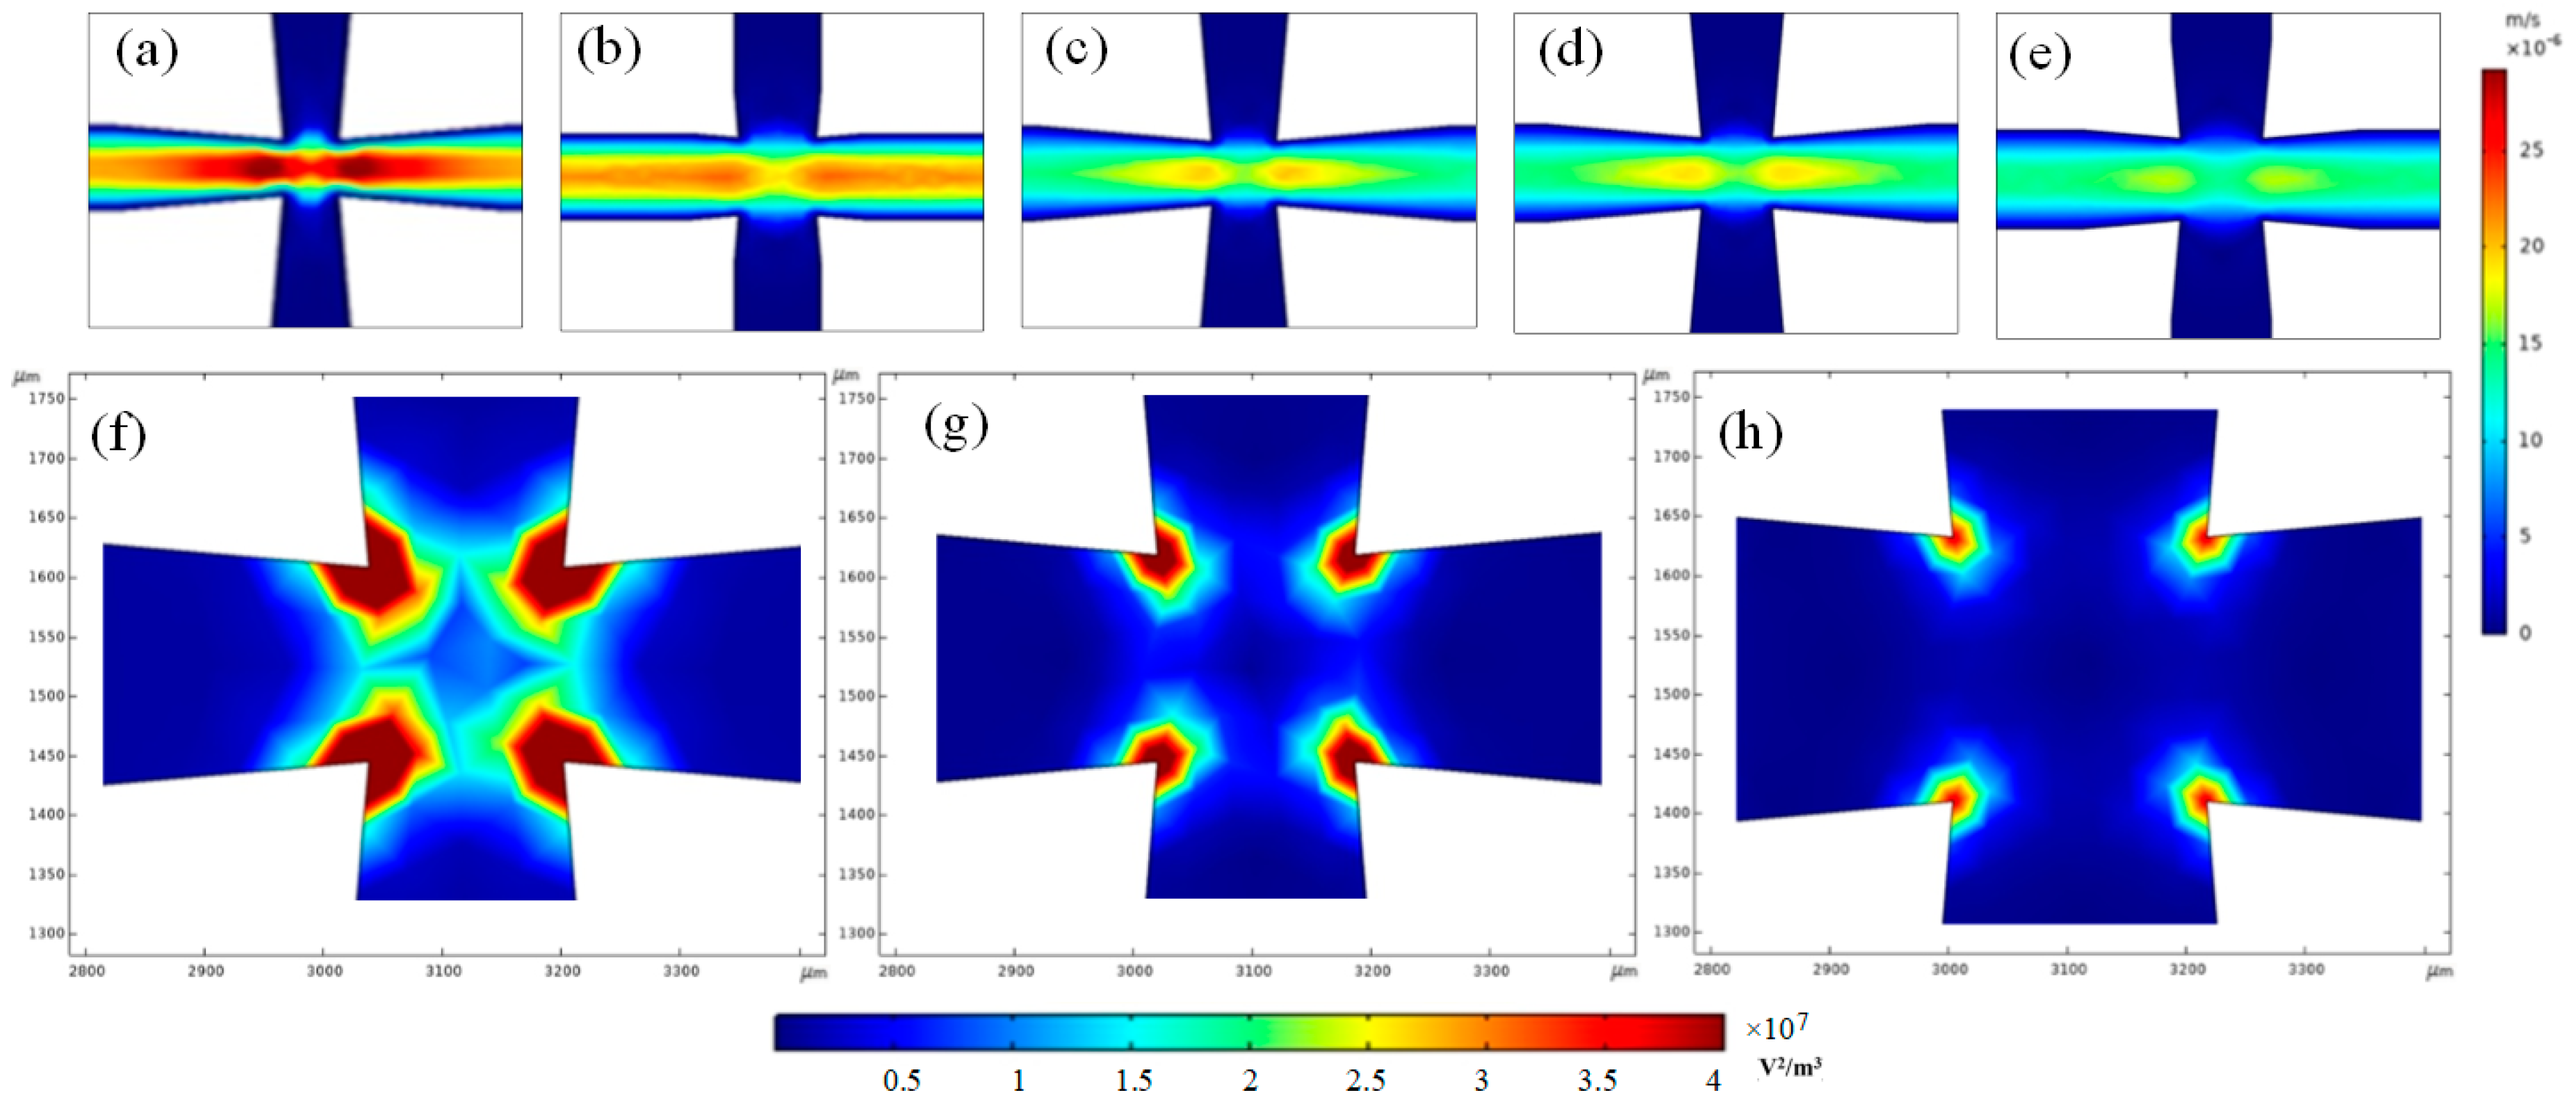
3.1.3. The Influence of Channel Width
3.2. The Electric Field Simulation under the Optimized Structure
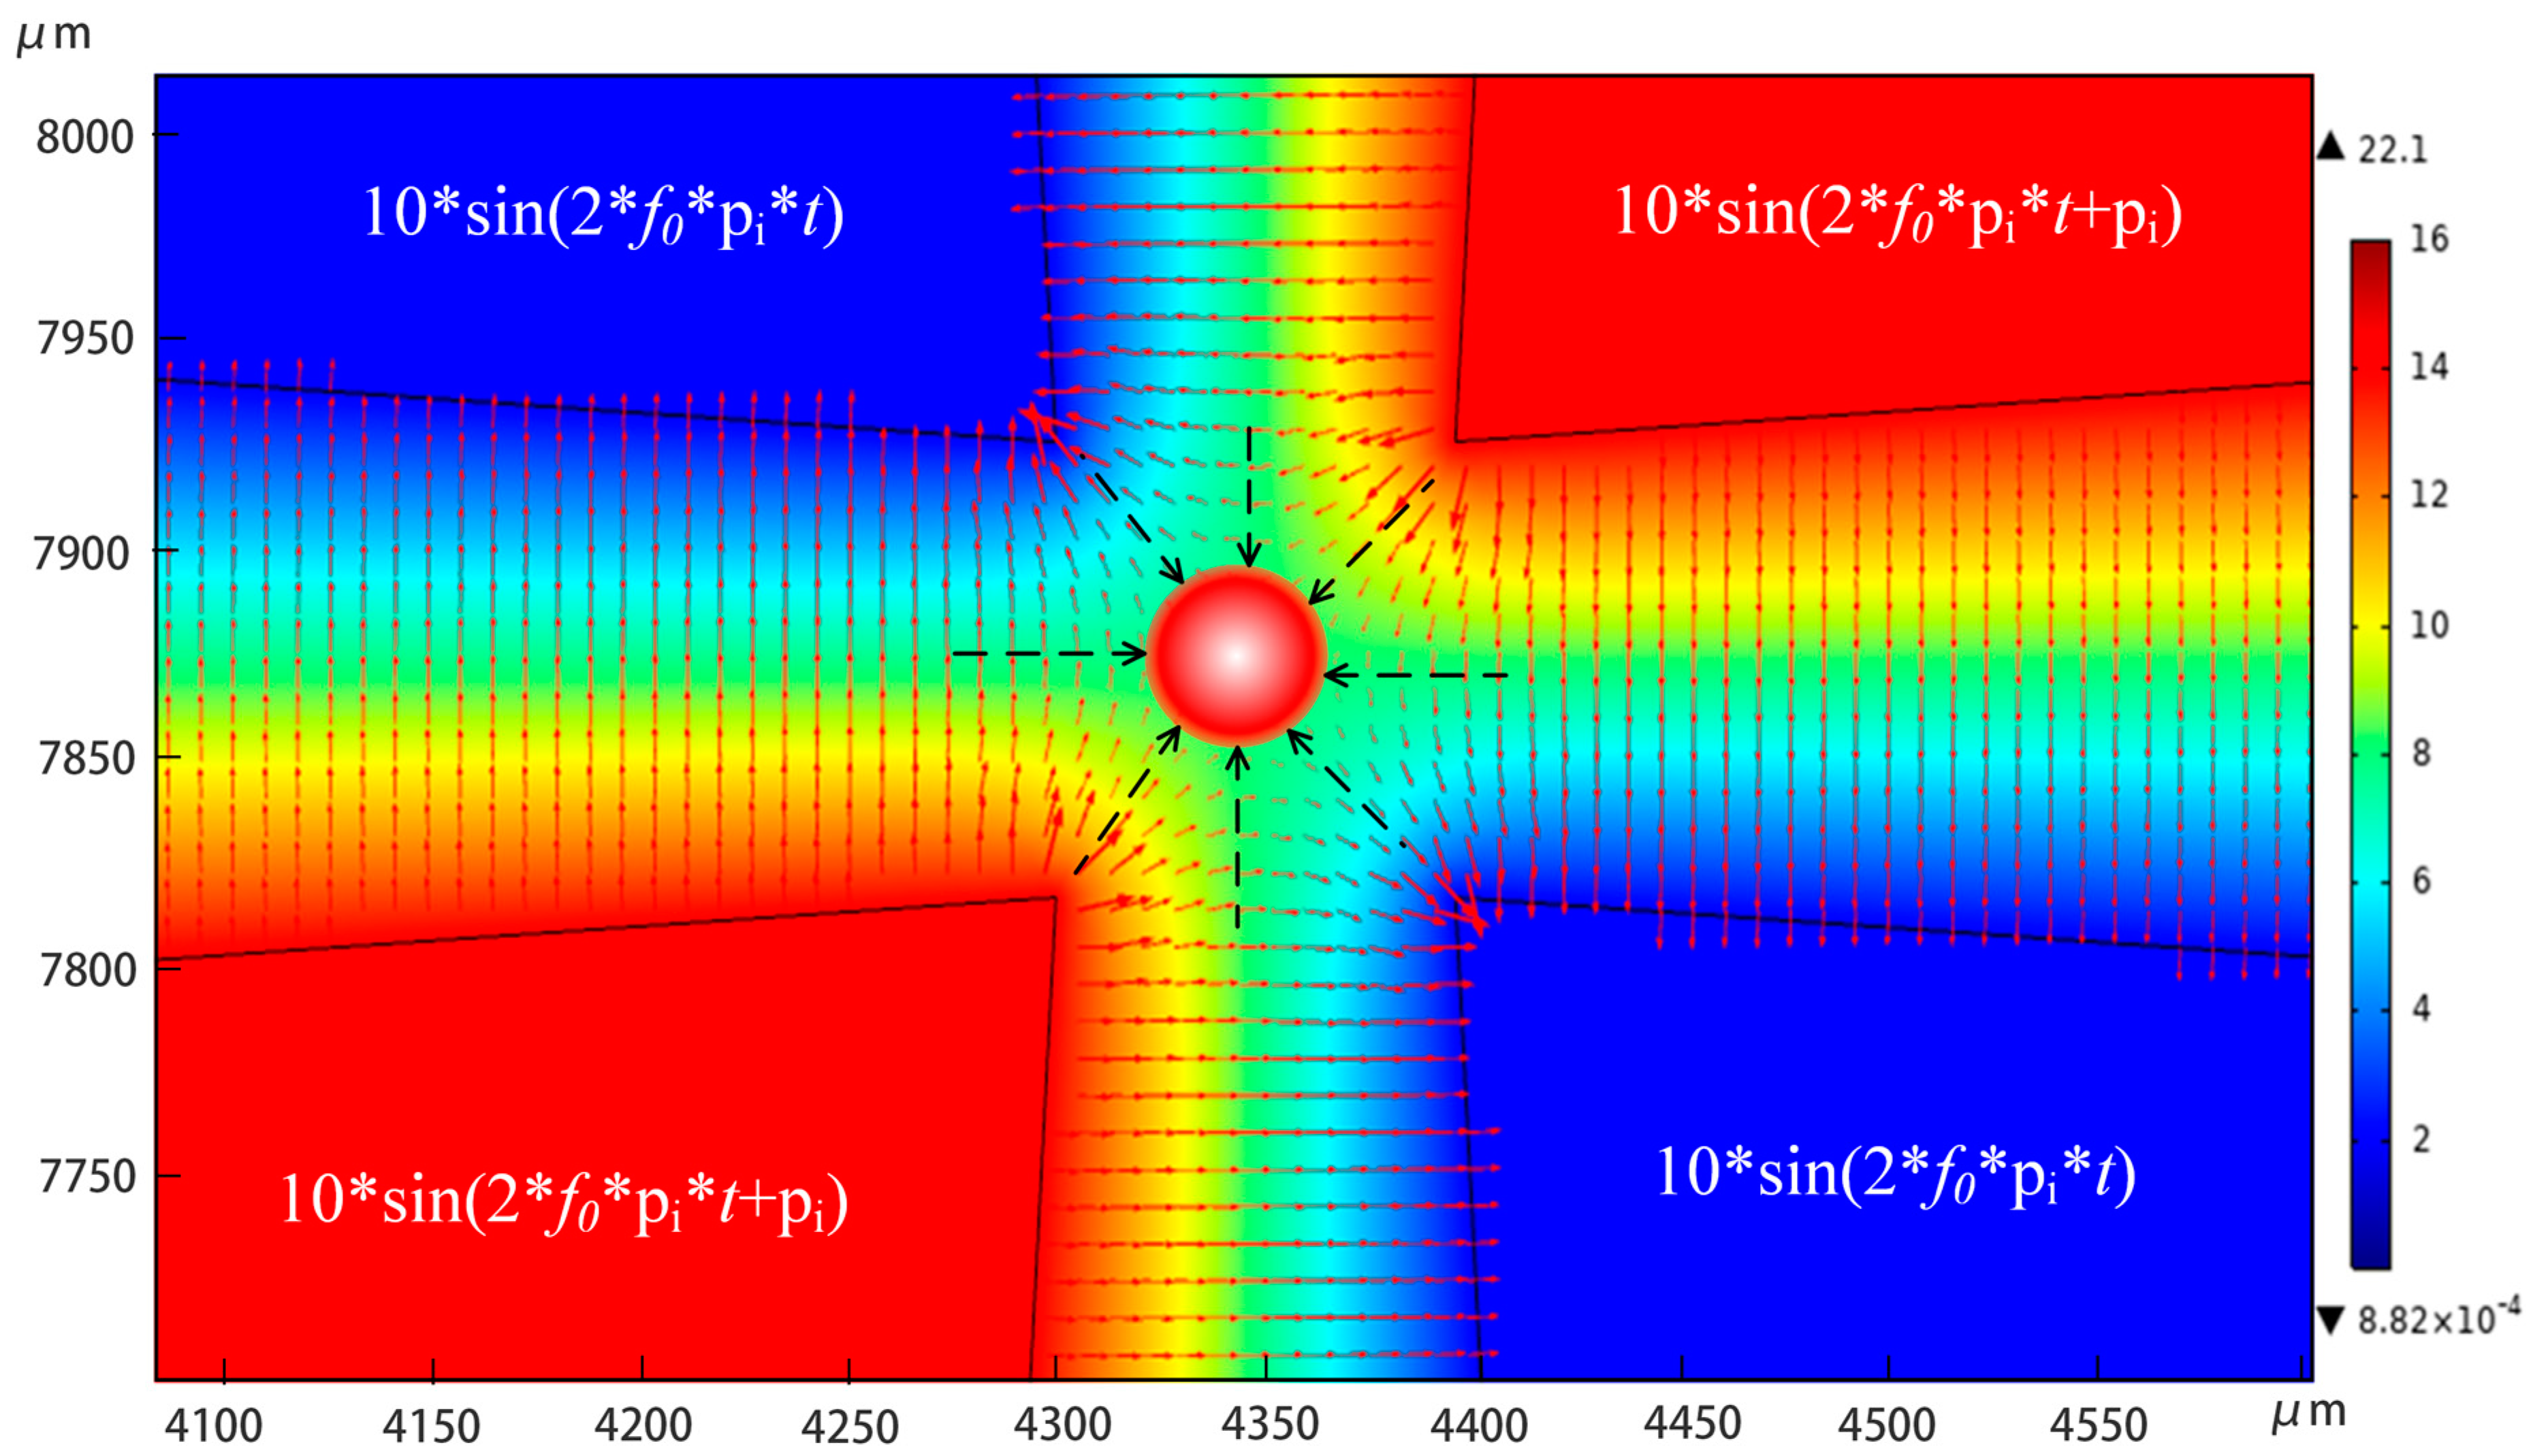
3.2.1. Trapping
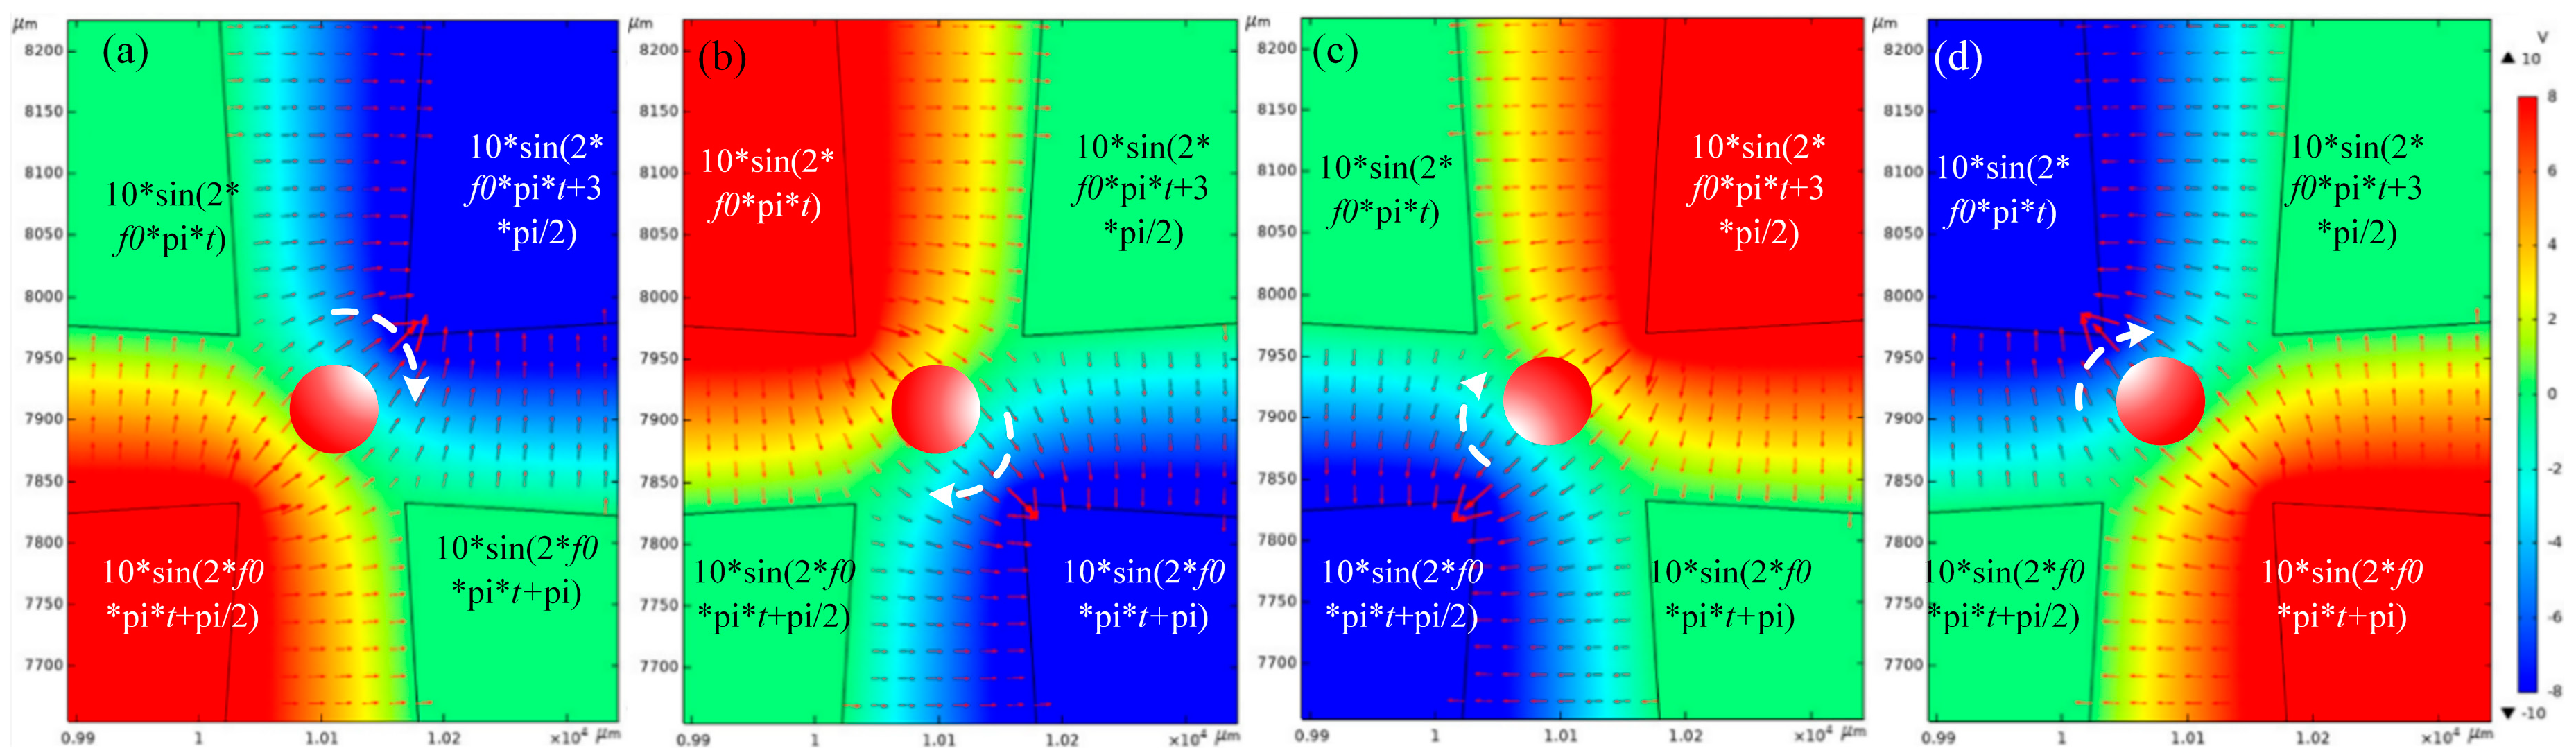
3.2.2. Rotate
3.3. The Trapping of Polystyrene Particles
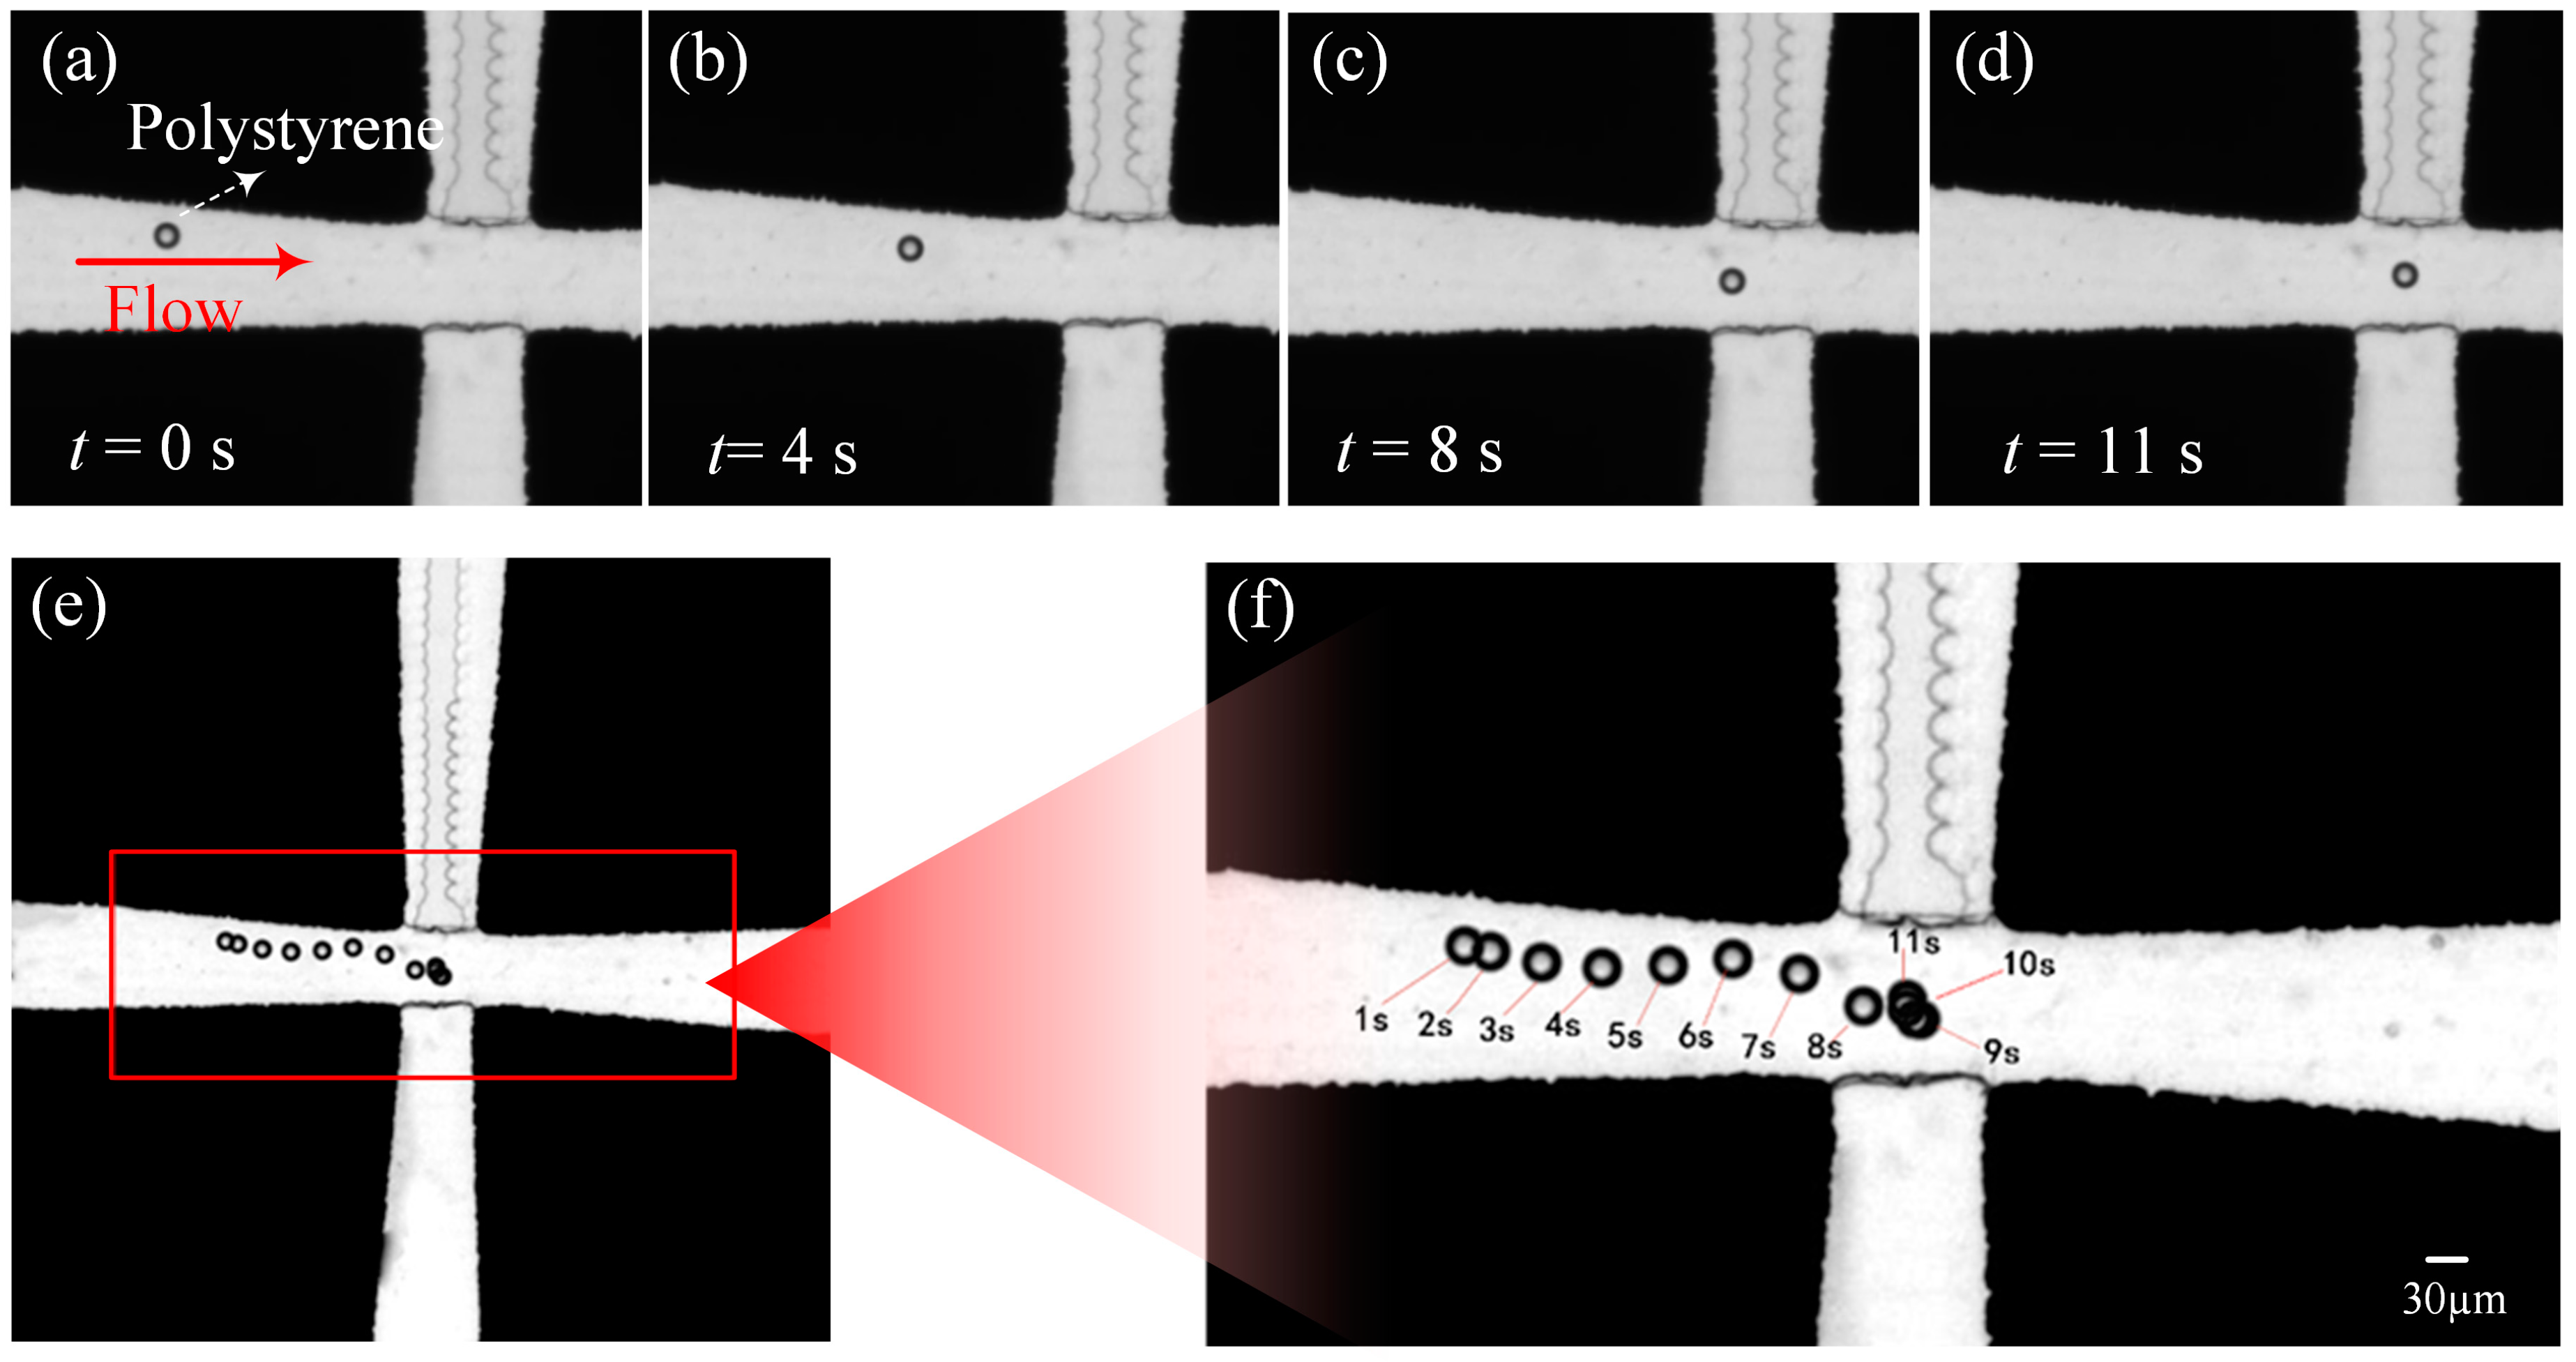
3.3.1. The Trapping of Polystyrene Particles with a Diameter of 30 μm
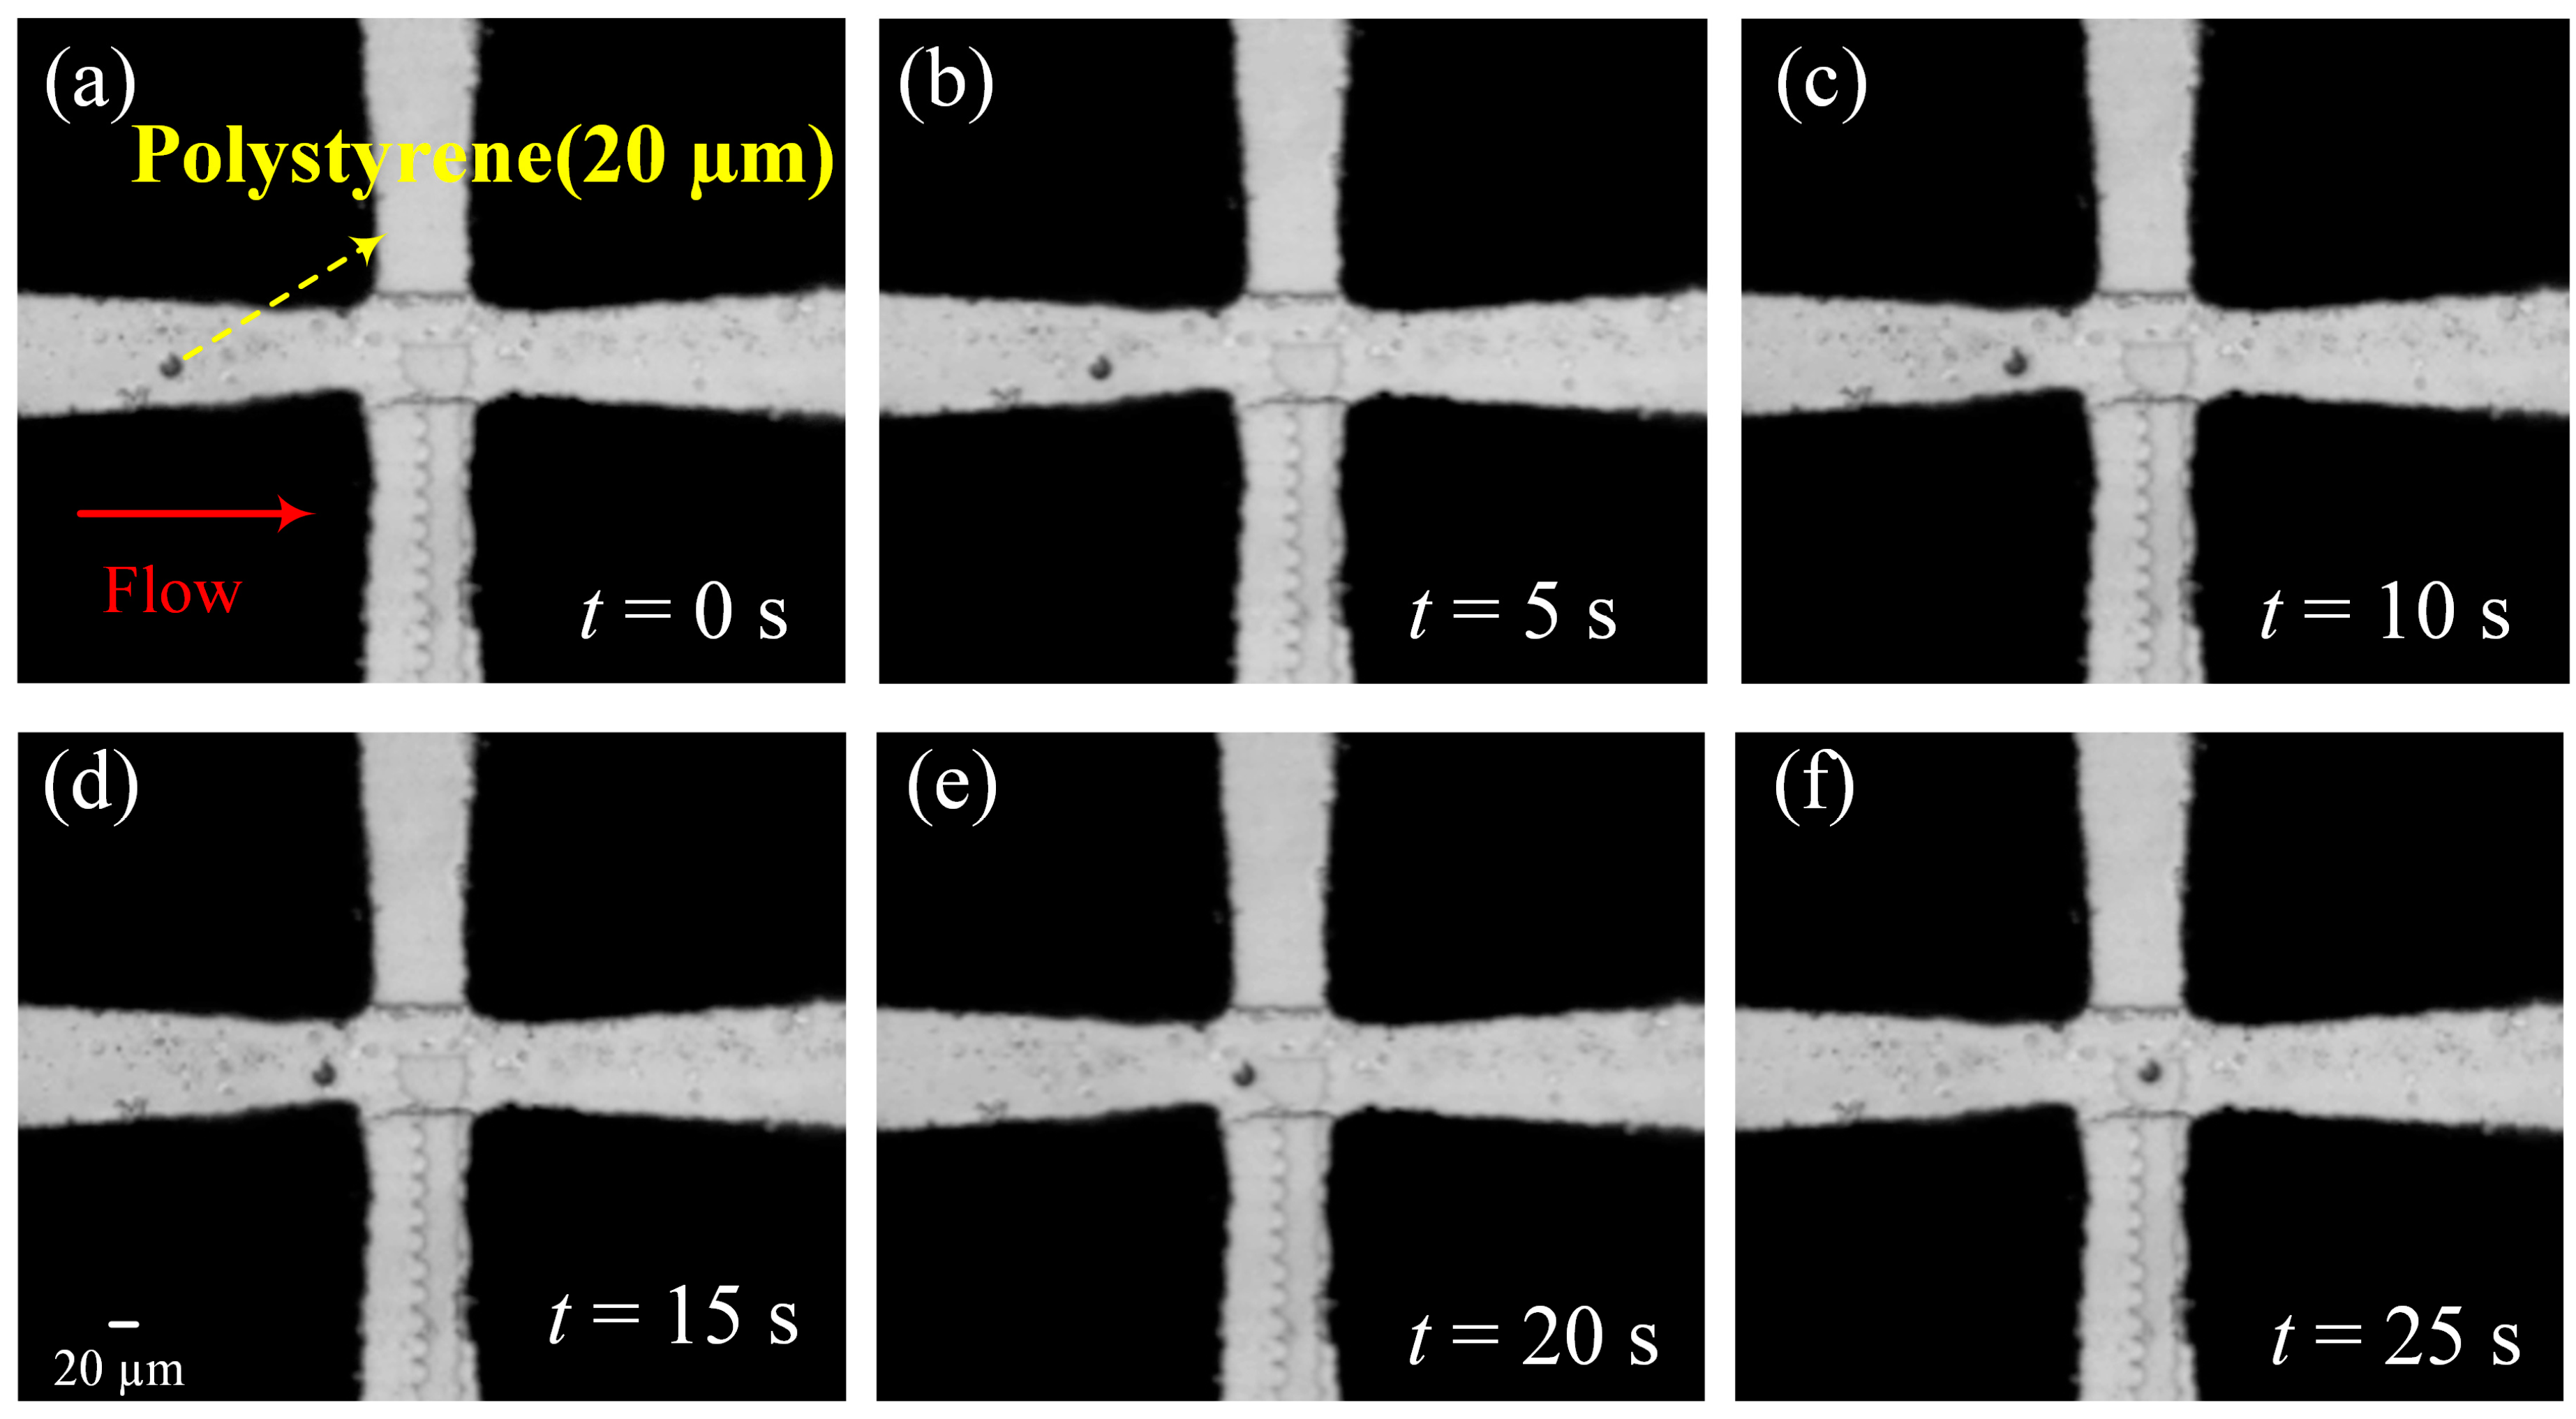
3.3.2. The Trapping of Polystyrene Particles with a Diameter of 20 μm
4. Conclusions
Supplementary Materials
Author Contributions
Funding
Data Availability Statement
Conflicts of Interest
References
- Guo, F.; Mao, Z.; Chen, Y.; Xie, Z.; Lata, J.P.; Li, P.; Ren, L.; Liu, J.; Yang, J.; Suresh, M.D.S.; et al. Three-dimensional manipulation of single cells using surface acoustic waves. Proc. Natl. Acad. Sci. USA 2016, 113, 1522–1527. [Google Scholar] [CrossRef] [PubMed] [Green Version]
- Zhou, Y.; Basu, S.; Wohlfahrt, K.J.; Lee, S.F.; Klenerman, D.; Laue, E.D.; Seshia, A.A. A microfluidic platform for trapping, releasing and super-resolution imaging of single cells. Sens. Actuators B Chem. 2016, 232, 680–691. [Google Scholar] [CrossRef] [PubMed]
- Evers, T.M.J.; Hochane, M.; Tans, S.J.; Heeren, R.M.A.; Semrau, S.; Nemes, P.; Mashaghi, A. Deciphering Metabolic Heterogeneity by Single-Cell Analysis. Anal. Chem. 2019, 91, 13314–13323. [Google Scholar] [CrossRef] [PubMed]
- Clister, T.; Mehta, S.; Zhang, J. Single-cell Analysis of G-protein Signal Transduction. J. Chem. Phys. 2015, 290, 6681–6688. [Google Scholar] [CrossRef] [PubMed] [Green Version]
- Zrazhevskiy, P.; Akilesh, S.; Tai, W.; Queitsch, K.; True, L.D.; Fromm, J.; Wu, D.; Nelson, P.; Stamatoyannopoulos, J.A.; Gao, X. Cross-Platform DNA Encoding for Single-Cell Imaging of Gene Expression. Angew. Chem. Int. Ed. 2016, 55, 8975–8978. [Google Scholar] [CrossRef] [PubMed] [Green Version]
- Deng, Y.; Guo, Y.; Xu, B. Recent Development of Microflfluidic Technology for Cell Trapping in Single Cell Analysis: A Review. Processies 2020, 8, 1253. [Google Scholar] [CrossRef]
- Honegger, T.; Peyrade, D. Moving pulsed dielectrophoresis. Lab Chip 2013, 13, 1538–1545. [Google Scholar] [CrossRef]
- Lawrenz, A.; Nason, F.; Cooper-White, J.J. Geometrical effects in microflfluidic-based microarrays for rapid, effificient single-cell capture of mammalian stem cells and plant cells. Biomicrofluidics 2012, 6, 024112. [Google Scholar] [CrossRef] [Green Version]
- Ying, Y.L.; Hu, Y.X.; Gao, R. Asymmetric Nanopore Electrode-Based Amplification for Electron Transfer Imaging in Live Cells. J. Am. Chem. Soc. 2018, 140, 5385–5392. [Google Scholar] [CrossRef]
- Lapointe, C.P.; Grosely, R.; Johnson, A.G. Dynamic competition between SARS-CoV-2 NSP1 and mRNA on the human ribosome inhibits translation initiation. Proc. Natl. Acad. Sci. USA 2021, 118, e2017715118. [Google Scholar] [CrossRef]
- Sarioglu, F.; Aceto, N.; Kojic, N.; Donaldson, M.; Zeinali, M.; Hamza, B.; Engstrom, A.; Zhu, H.; Sundaresan, T.; Miyamoto, D.; et al. A microfluidic device for label-free, physical capture of circulating tumor cell clusters. Nat. Methods 2015, 12, 685. [Google Scholar] [CrossRef]
- Kohler, D.; Schindler, G.; Hahn, L.; Milvich, J.; Hofmann, A.; Länge, K.; Freude, W.; Koos, C. Biophotonic sensors with integrated Si3N4-organic hybrid (SiNOH) lasers for point-of-care diagnostics. Light Sci. Appl. 2021, 10, 64. [Google Scholar] [CrossRef] [PubMed]
- Gantz, M.; Aleku, G.A.; Hollfelder, F. Ultrahigh-throughput screening in microfluidic droplets: A faster route to new enzymes. Trends Biochem. Sci. 2022, 47, 451–452. [Google Scholar] [CrossRef] [PubMed]
- Kim, K.H.; Bahl, G.; Lee, W.; Liu, J.; Tomes, M.; Fan, X. Cavity optomechanics on a microfluidic resonator with water and viscous liquids. Light Sci. Appl. 2013, 2, e110. [Google Scholar]
- Bianco, V.; Mandracchia, B.; Marchesano, V.; Pagliarulo, V.; Olivieri, F.; Coppola, S.; Paturzo, M.; Ferraro, P. Endowing a plain fluidic chip with micro-optics: A holographic microscope slide. Light Sci. Appl. 2017, 6, e17055. [Google Scholar] [CrossRef]
- Wang, X.; Zandi, M.; Ho, C.C.; Kaval, N.; Papautsky, I. Single stream inertial focusing in a straight microchannel. Lab Chip 2015, 15, 1812–1821. [Google Scholar] [CrossRef] [Green Version]
- Fan, L.-L.; Han, Y.; He, X.-K.; Zhao, L. High-throughput, single-stream microparticle focusing using a microchannel with asymmetric sharp corners. Microfluid. Nanofluid. 2014, 17, 639–646. [Google Scholar] [CrossRef]
- Walsh, M.; Hsiao, A.; Lee, H.S. Capture and Enumeration of mRNA Transcripts from Single Cells Using a Microfluidic Device. Lab Chip 2015, 15, 2968–2980. [Google Scholar] [CrossRef]
- Luan, Q.; Macaraniag, C.; Zhou, J.; Papautsky, I. Microfluidic systems for hydrodynamic trapping of cells and clusters. Biomicrofluidics 2020, 14, 031502. [Google Scholar] [CrossRef]
- Li, X.; Lee, A.P. High-throughput microfluidic single-cell trapping arrays for biomolecular and imaging analysis. Methods Cell Biol. 2018, 148, 35–50. [Google Scholar]
- Tanyeri, M.; Johnson-Chavarria, E.M.; Schroeder, C.M. Hydrodynamic trap for single particles and cells. Appl. Phys. Lett. 2010, 96, 224101. [Google Scholar] [CrossRef] [PubMed] [Green Version]
- Shenoy, A.; Rao, C.V.; Schroeder, C.M. Stokes trap for multiplexed particle manipulation and assembly using fluidics. Proc. Natl. Acad. Sci. USA 2016, 113, 3976–3981. [Google Scholar] [CrossRef] [PubMed]
- Gieseler, J.; Gomez-Solano, J.R.; Magazzu, A. Optical tweezers—From calibration to applications: A tutorial. Adv. Opt. Photonics 2021, 13, 74–241. [Google Scholar] [CrossRef]
- Anderegg, L.; Cheuk, L.W.; Bao, Y.C. An optical tweezer array of ultracold molecules. Science 2019, 365, 1156. [Google Scholar] [CrossRef] [PubMed] [Green Version]
- Hejazian, M.; Li, W.H.; Nguyen, N.T. Lab on a chip for continuous-flow magnetic cell separation. Lab Chip 2021, 15, 959–970. [Google Scholar] [CrossRef] [PubMed] [Green Version]
- Yin, D.; Shi, A.D.; Zhou, B.Q. Efficient Capture and Separation of Cancer Cells Using Hyaluronic Acid-Modified Magnetic Beads in a Microfluidic Chip. Langmuir 2022, 38, 11080–11086. [Google Scholar] [CrossRef]
- Ahmed, D.; Ozcelik, A.; Bojanala, N. Rotational manipulation of single cells and organisms using acoustic waves. Nat. Commun. 2016, 7, 11085. [Google Scholar] [CrossRef]
- Lubli, N.F.; Gerlt, M.S.; Wüthrich, A.; Lewis, R.T.; Shamsudhin, N.; Kutay, U.; Ahmed, D.; Dual, J.; Nelson, B.J. Embedded Microbubbles for Acoustic Manipulation of Single Cells and Microfluidic Applications. Anal. Chem. 2021, 93, 9760–9770. [Google Scholar] [CrossRef]
- Läubli, N.F.; Gerlt, M.S.; Wüthrich, A.; Lewis, R.T.M.; Shamsudhin, N.; Kutay, U.; Ahmed, D.; Dual, J.; Nelson, B.J. Continuous micro-vortex-based nanoparticle manipulation via focused surface acoustic waves. Lab Chip 2016, 17, 9760–9770. [Google Scholar]
- Xia, Y.; Li, J.; Huang, L.X.; Hua, B.; Guo, S.-S. In Situ Microreaction Platform Based on Acoustic Droplet Manipulation for Ultra-High-Precision Multiplex Bioassay. Anal. Chem. 2022, 94, 6347–6354. [Google Scholar] [CrossRef]
- Barani, A.; Paktinat, H.; Janmaleki, M.; Mohammadi, A.; Mosaddegh, P.; Fadaei-Tehrani, A.; Sanati-Nezhad, A. Microfluidic integrated acoustic waving for manipulation of cells and molecules. Biosens. Bioelectron. 2016, 16, 30487. [Google Scholar] [CrossRef] [PubMed]
- Al-Ali, A.; Waheeda, W.; Abu-Nada, E. A review of active and passive hybrid systems based on Dielectrophoresis for the manipulation of microparticles. J. Chromatogr. A 2022, 1676, 463268. [Google Scholar] [CrossRef] [PubMed]
- Li, M.; Li, W.H.; Zhang, J. A review of microfabrication techniques and dielectrophoretic microdevices for particle manipulation and separation. J. Phys. D-Appl. Phys. 2014, 47, 063001. [Google Scholar] [CrossRef]
- Voldman, J.; Gray, M.L.; Toner, M.; Schmidt, M.A. A Microfabrication-Based Dynamic Array Cytometer. Anal. Chem. 2002, 74, 3984–3990. [Google Scholar] [CrossRef] [PubMed]
- Voldman, J.; Toner, M.; Gray, M.L.; Schmidta, M.A. Design and analysis of extruded quadrupolar dielectrophoretic traps. J. Electrost. 2003, 57, 69–90. [Google Scholar] [CrossRef]
- Rosenthal, A.; Voldman, J. Dielectrophoretic Traps for Single-Particle Patterning. Biophys. J. 2005, 88, 2193–2205. [Google Scholar] [CrossRef] [Green Version]
- Guo, X.; Zhu, R. Controllably moving individual living cell in an array by modulating signal phase difference based on dielectrophoresis. Biosens. Bioelectron. 2015, 68, 529–535. [Google Scholar] [CrossRef]
- Tirapu-Azpiroz, J.; Temiz, Y.; Delamarche, E. Arraying single microbeads in microchannels using dielectrophoresis-assisted mechanical traps. Appl. Phys. Lett. 2015, 107, 204102. [Google Scholar] [CrossRef]
- Kim, S.H.; Fujii, T. Efficient analysis of a small number of cancer cells at the single-cell level using electroactive double-well array. Lab Chip 2016, 16, 2440–2449. [Google Scholar] [CrossRef] [Green Version]
- Boymelgreen, A.M.; Balli, T.; Miloh, T. Active colloids as mobile microelectrodes for unifified label-free selective cargo transport. Nat. Commun. 2018, 9, 760. [Google Scholar] [CrossRef] [Green Version]
- Goel, M.; Verma, A.; Gupta, S. Electric-field driven assembly of live bacterial cell microarrays for rapid phenotypic assessment and cell viability testing. Biosens. Bioelectron. 2018, 111, 159–165. [Google Scholar] [CrossRef] [PubMed]
- Chen, X.; Liang, Z.; Li, D. Microfluidic dielectrophoresis device for trapping, counting and detecting Shewanella oneidensis at the cell level. Biosens. Bioelectron. 2018, 99, 416–423. [Google Scholar] [CrossRef] [PubMed]
- Xie, S.; Wang, X.; Jiao, N. Programmable micrometer-sized motor array based on live cells. Lab Chip 2017, 17, 2046–2053. [Google Scholar] [CrossRef] [PubMed]
- Prateek Benhal, J. Geoffrey Chase, Paul Gaynor. AC electric field induced dipole-based on-chip 3D cell rotation. Lab Chip 2014, 14, 2717–2727. [Google Scholar] [CrossRef]
- Habaza, M.; Kirschbaum, M.; Guernth-Marschner, C.; Dardikman, G.; Barnea, I.; Korenstein, R.; Duschl, C.; Shaked, N.T. Rapid 3D Refractive-Index Imaging of Live Cells in Suspension without Labeling Using Dielectrophoretic Cell Rotation. Adv. Sci. 2017, 4, 1600205. [Google Scholar] [CrossRef]
- Chen, N.-C.; Chen, C.-H.; Chen, M.-K.; Jang, L.S.; Wang, M.H. Single-cell trapping and impedance measurement utilizing dielectrophoresis in a parallel-plate microfluidic device. Sens. Actuators B 2014, 190, 570–577. [Google Scholar] [CrossRef]
- Zaman, M.A.; Wu, M.; Padhy, P.; Jensen, M.A.; Hesselink, L.; Davis, R.W. Modeling Brownian Microparticle Trajectories in Lab-on-a-Chip Devices with Time Varying Dielectrophoretic or Optical Forces. Micromachines 2021, 12, 1265. [Google Scholar] [CrossRef]
- Zaman, M.A.; Padhy, P.; Ren, W.; Wu, M.; Hesselink, L. Microparticle transport along a planar electrode array using moving dielectrophoresis. J. Appl. Phys. 2021, 130, 034902. [Google Scholar] [CrossRef]
- Wang, Y.; Wang, J.; Wu, X.; Jiang, Z.; Wang, W. Dielectrophoretic separation of microalgae cells in ballast water in a microfluidic chip. Electrophoresis 2019, 40, 969–978. [Google Scholar] [CrossRef]
- Niu, X.Z.; Peng, S.L.; Liu, L.Y.; Wen, W.J.; Sheng, P. Characterizing and patterning of PDMS-based conducting composites. Adv. Mater. 2007, 19, 2682–2686. [Google Scholar]


Disclaimer/Publisher’s Note: The statements, opinions and data contained in all publications are solely those of the individual author(s) and contributor(s) and not of MDPI and/or the editor(s). MDPI and/or the editor(s) disclaim responsibility for any injury to people or property resulting from any ideas, methods, instructions or products referred to in the content. |
© 2023 by the authors. Licensee MDPI, Basel, Switzerland. This article is an open access article distributed under the terms and conditions of the Creative Commons Attribution (CC BY) license (https://creativecommons.org/licenses/by/4.0/).
Share and Cite
Wang, Y.; Tong, N.; Li, F.; Zhao, K.; Wang, D.; Niu, Y.; Xu, F.; Cheng, J.; Wang, J. Trapping of a Single Microparticle Using AC Dielectrophoresis Forces in a Microfluidic Chip. Micromachines 2023, 14, 159. https://doi.org/10.3390/mi14010159
Wang Y, Tong N, Li F, Zhao K, Wang D, Niu Y, Xu F, Cheng J, Wang J. Trapping of a Single Microparticle Using AC Dielectrophoresis Forces in a Microfluidic Chip. Micromachines. 2023; 14(1):159. https://doi.org/10.3390/mi14010159
Chicago/Turabian StyleWang, Yanjuan, Ning Tong, Fengqi Li, Kai Zhao, Deguang Wang, Yijie Niu, Fengqiang Xu, Jiale Cheng, and Junsheng Wang. 2023. "Trapping of a Single Microparticle Using AC Dielectrophoresis Forces in a Microfluidic Chip" Micromachines 14, no. 1: 159. https://doi.org/10.3390/mi14010159