
Analysis of a Vegetable Oil Performance in a Milling Process by MQL Lubrication

 , , , , , , and
Abstract
:1. Introduction
2. Materials and Methods
2.1. Materials and Experimental Design
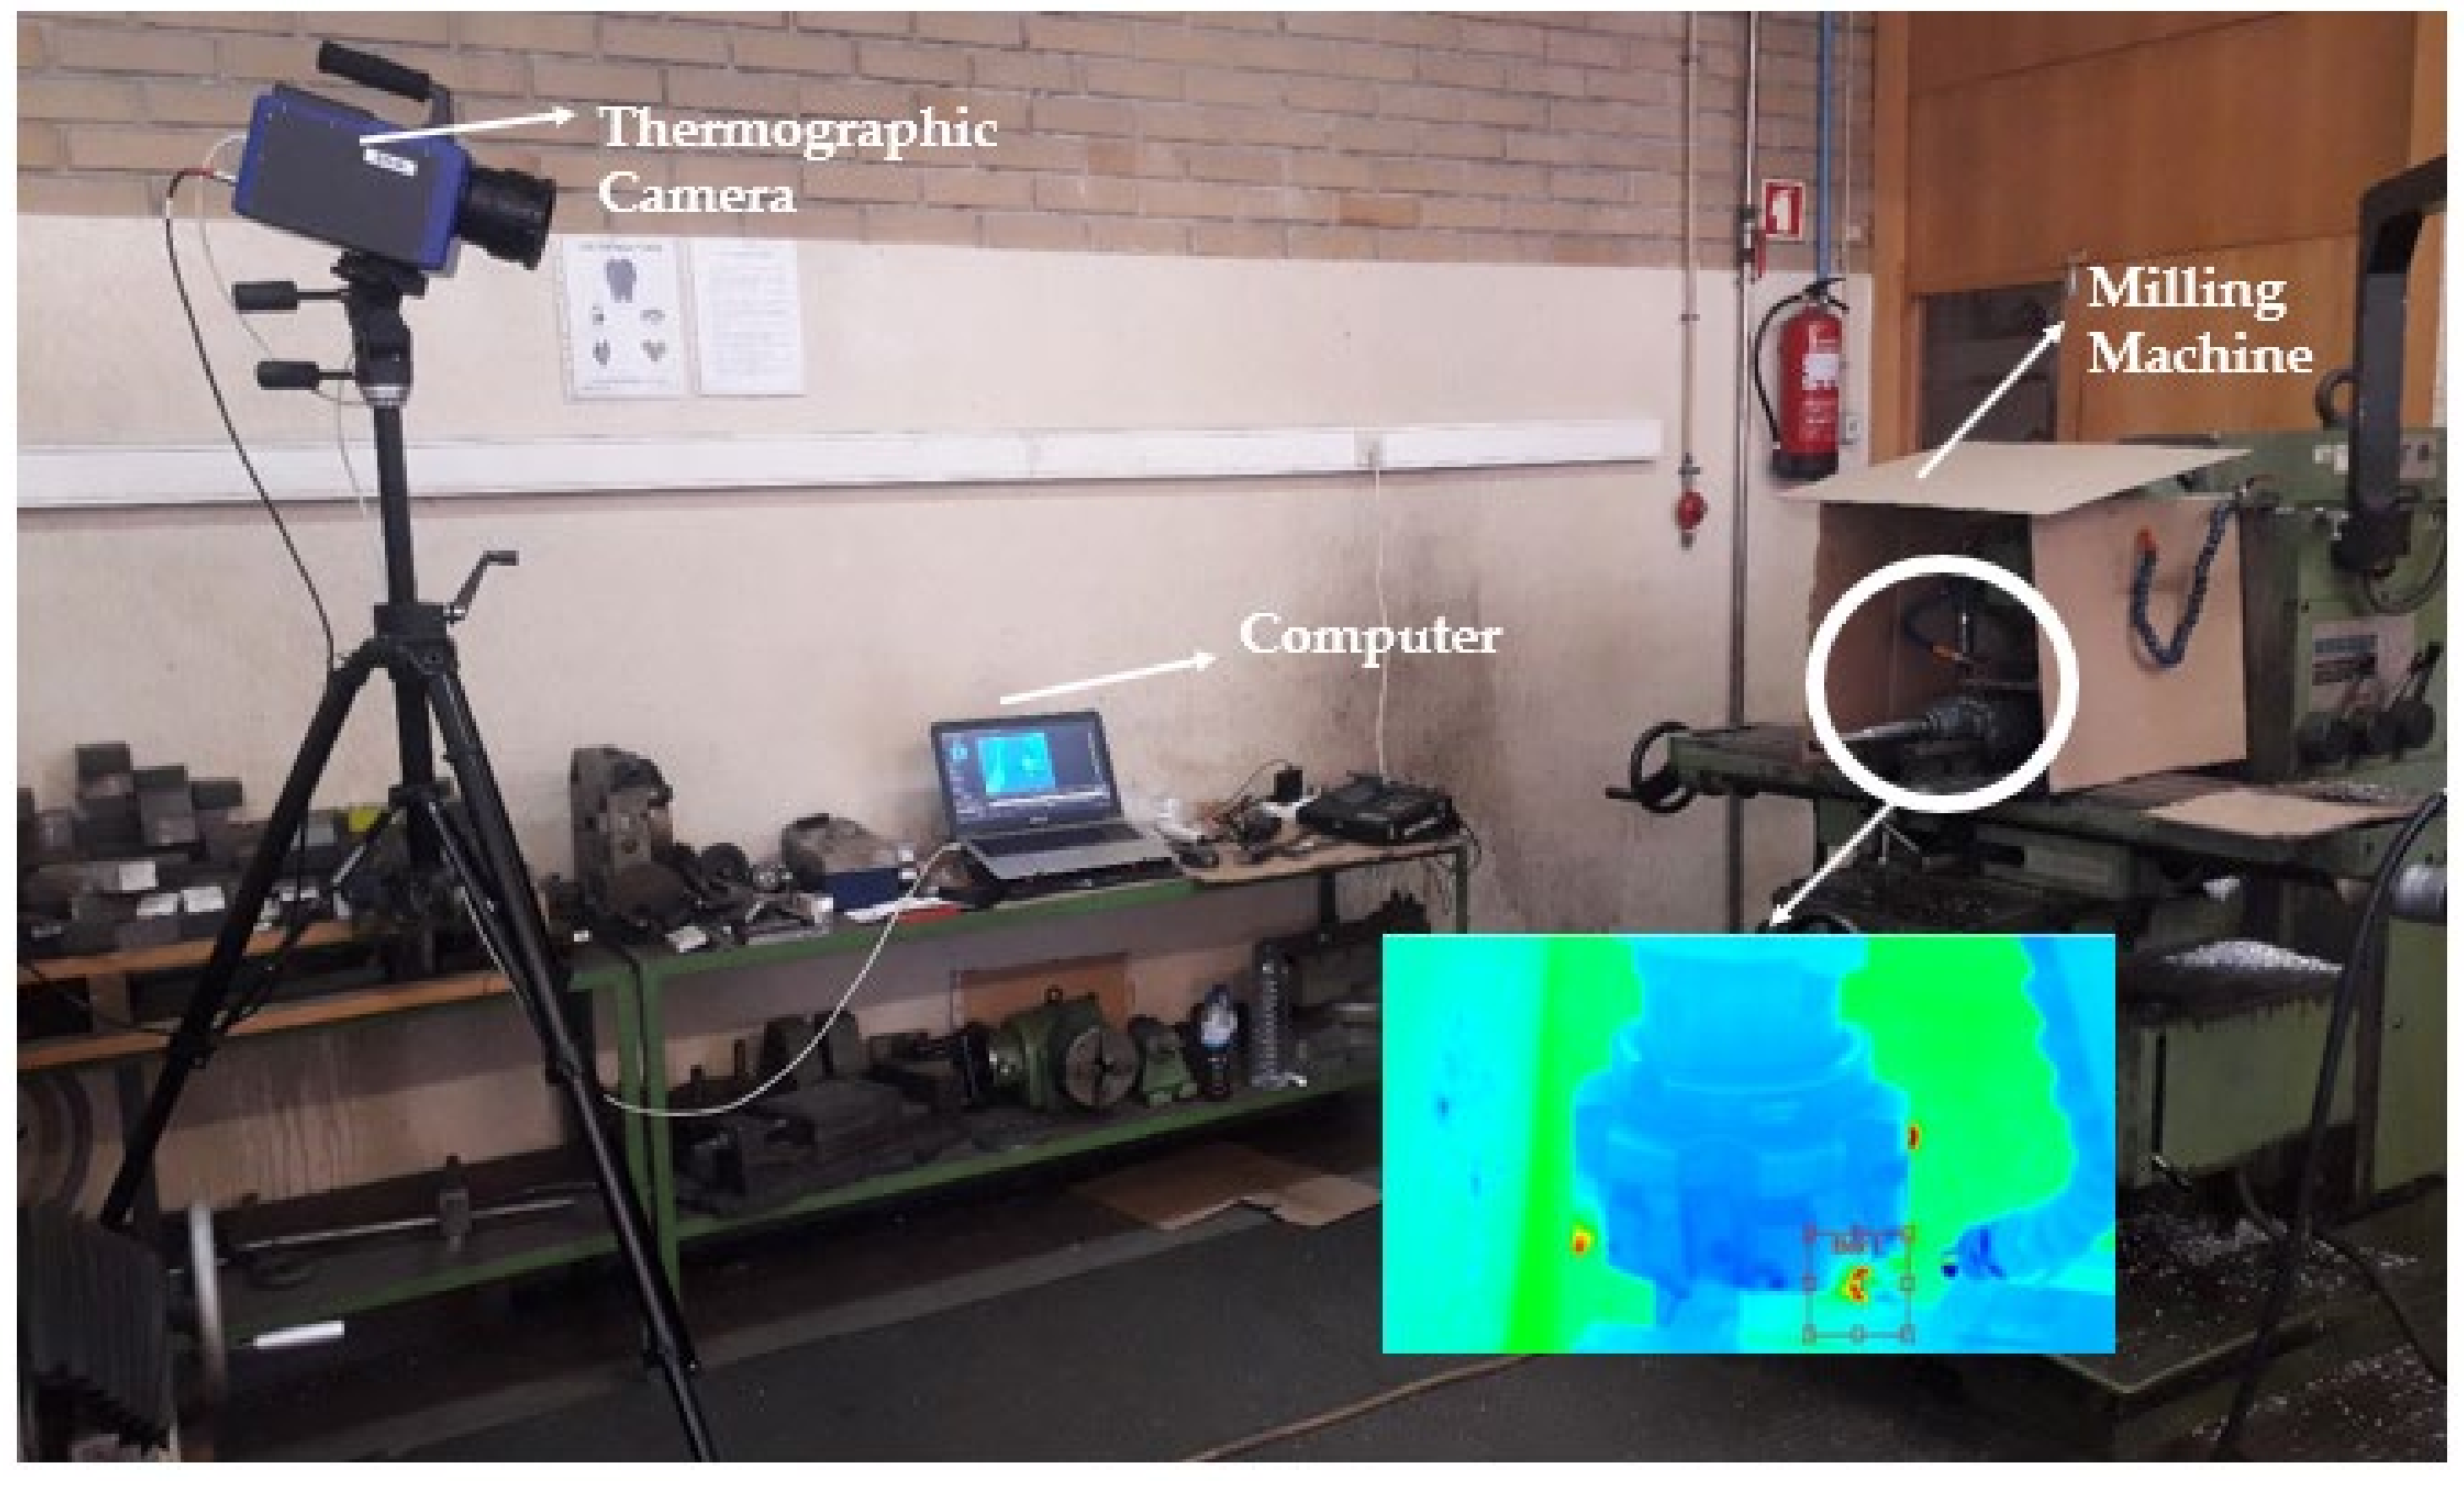
2.2. Machining Experimental Tests
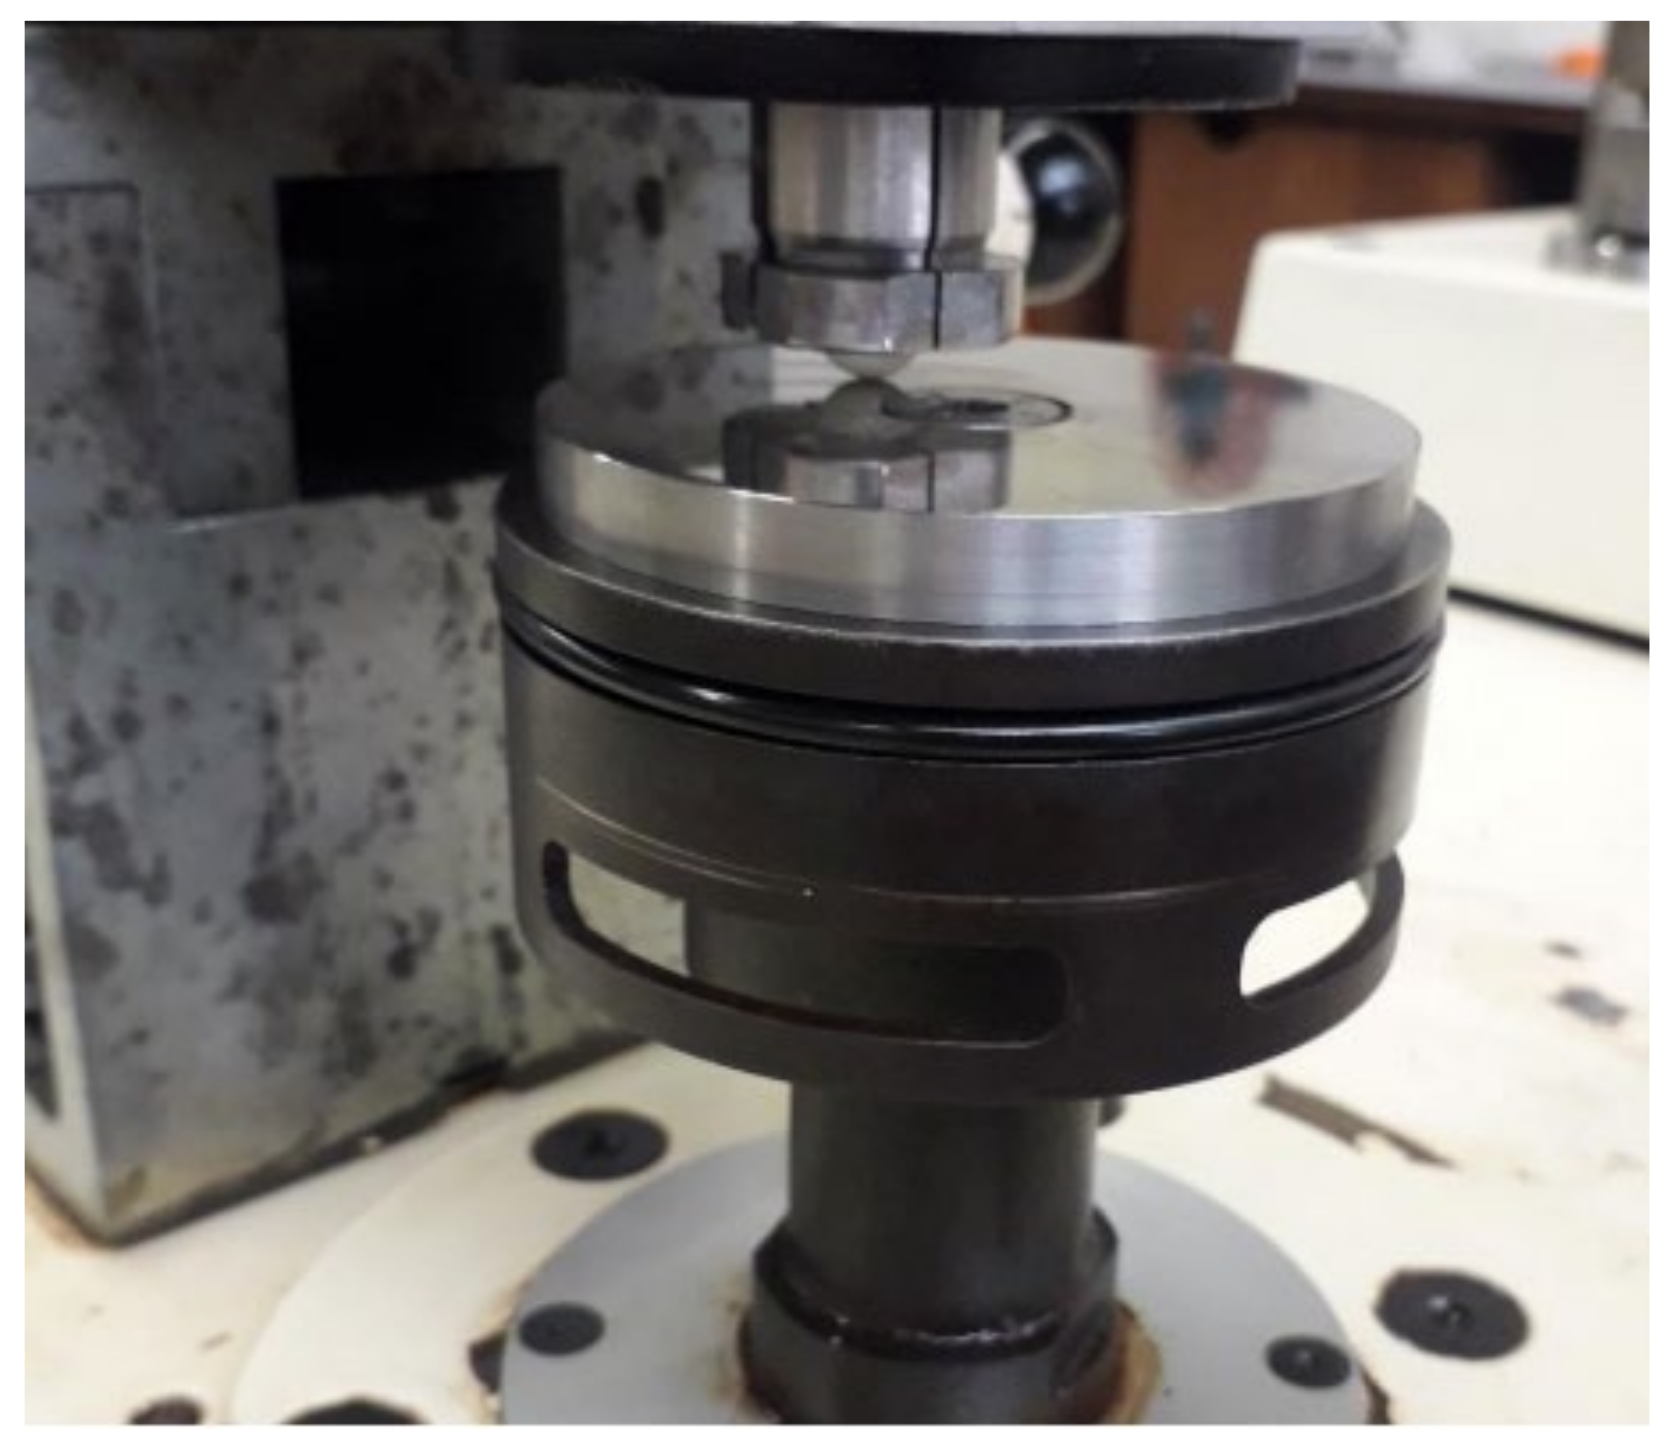
2.3. Tribological Tests
3. Results and Discussion
3.1. Machining Performance
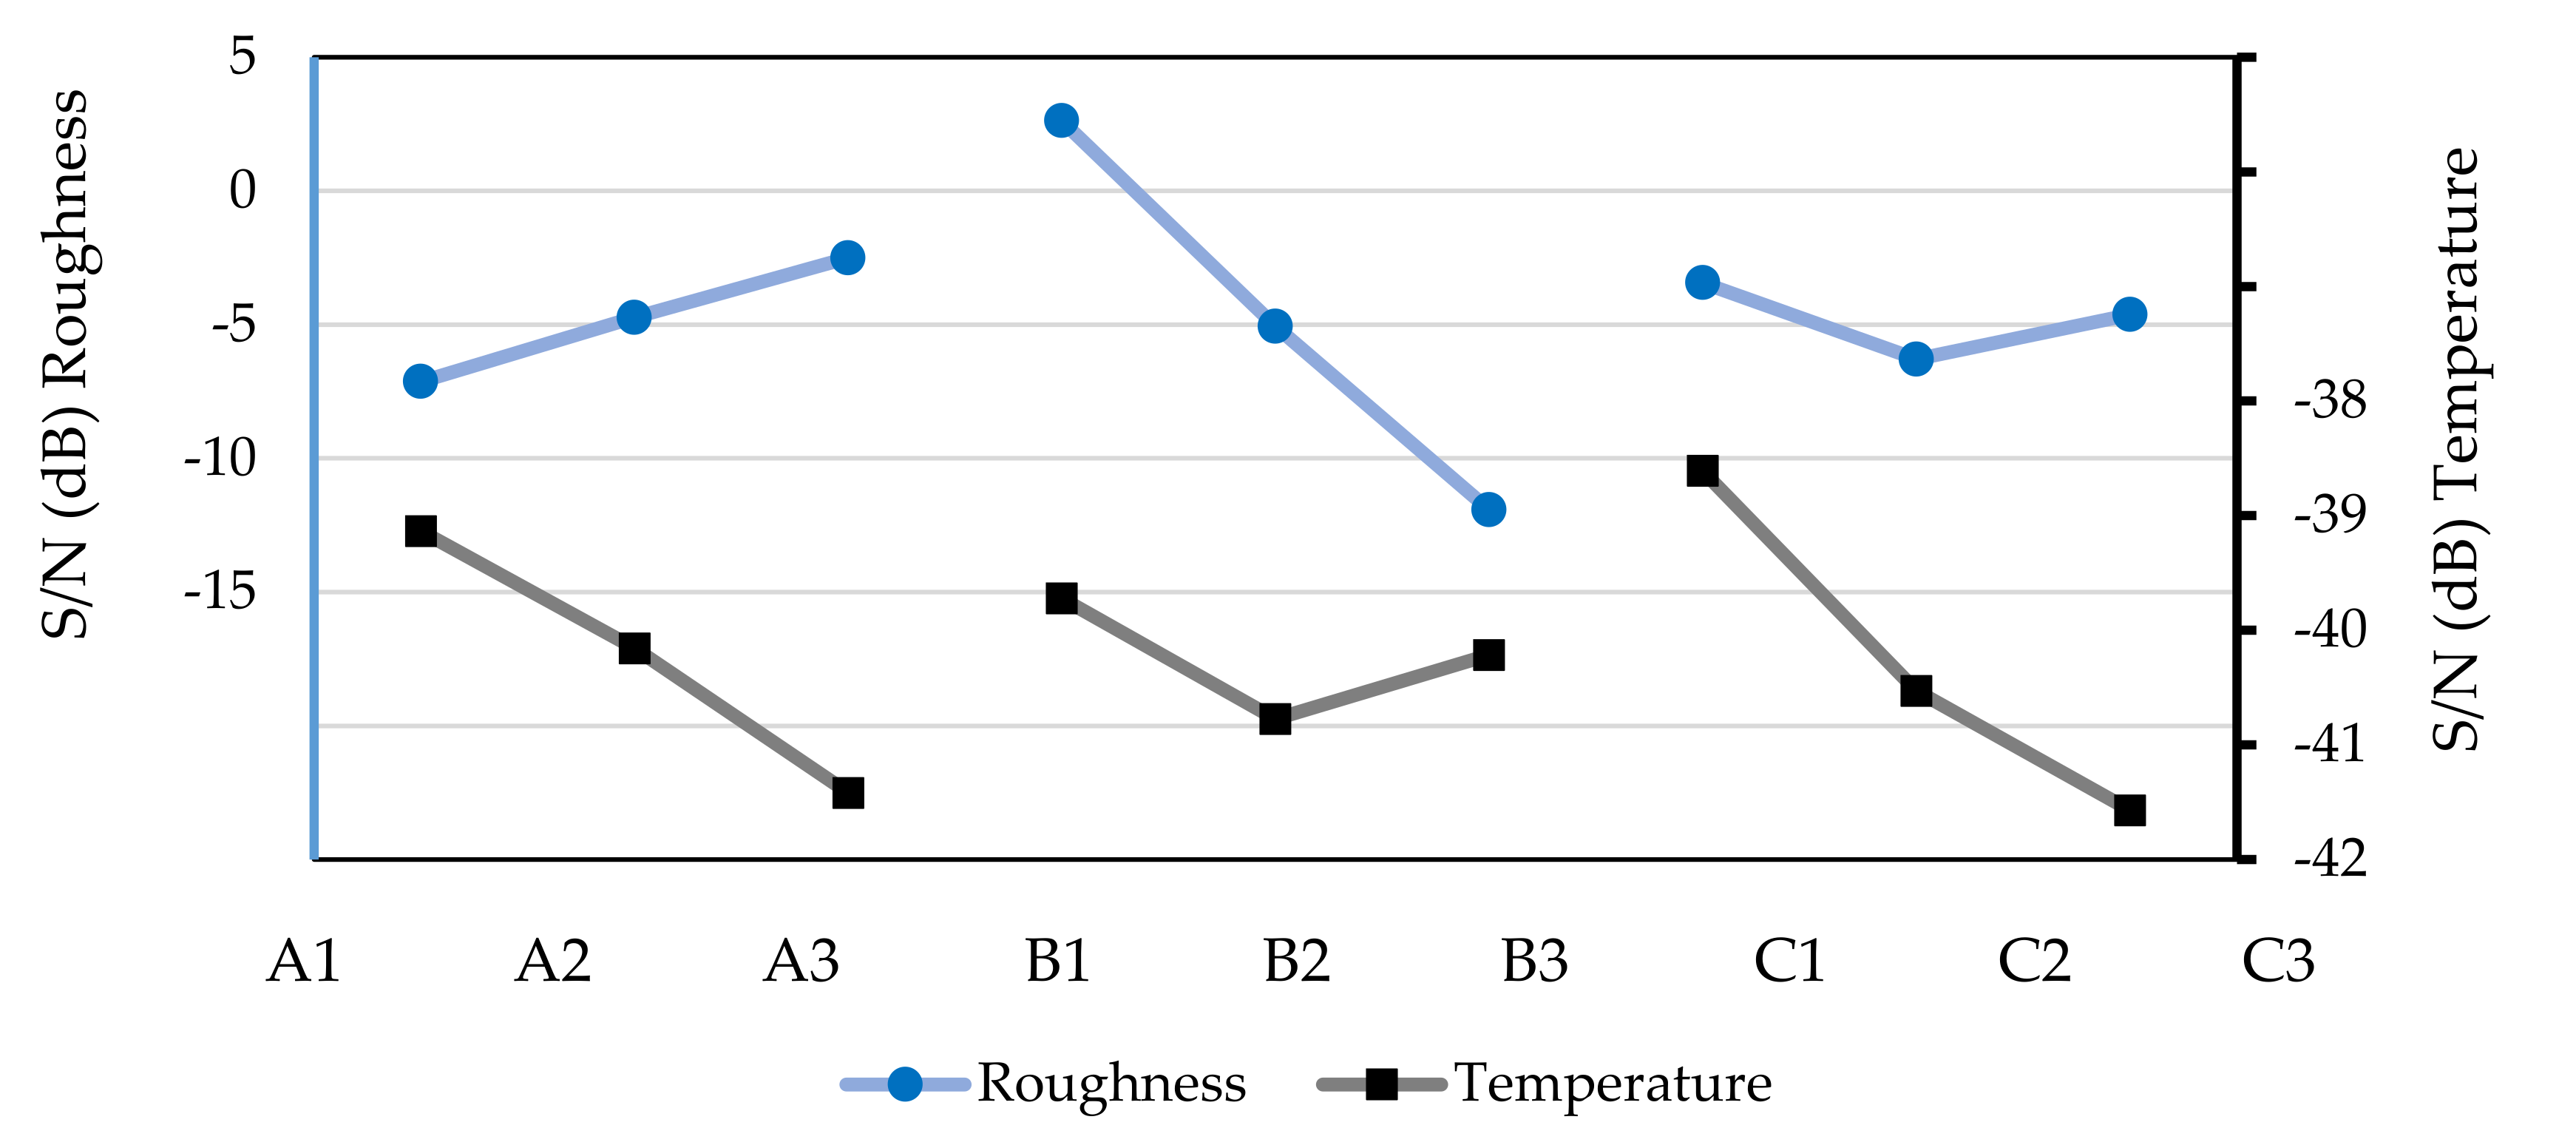
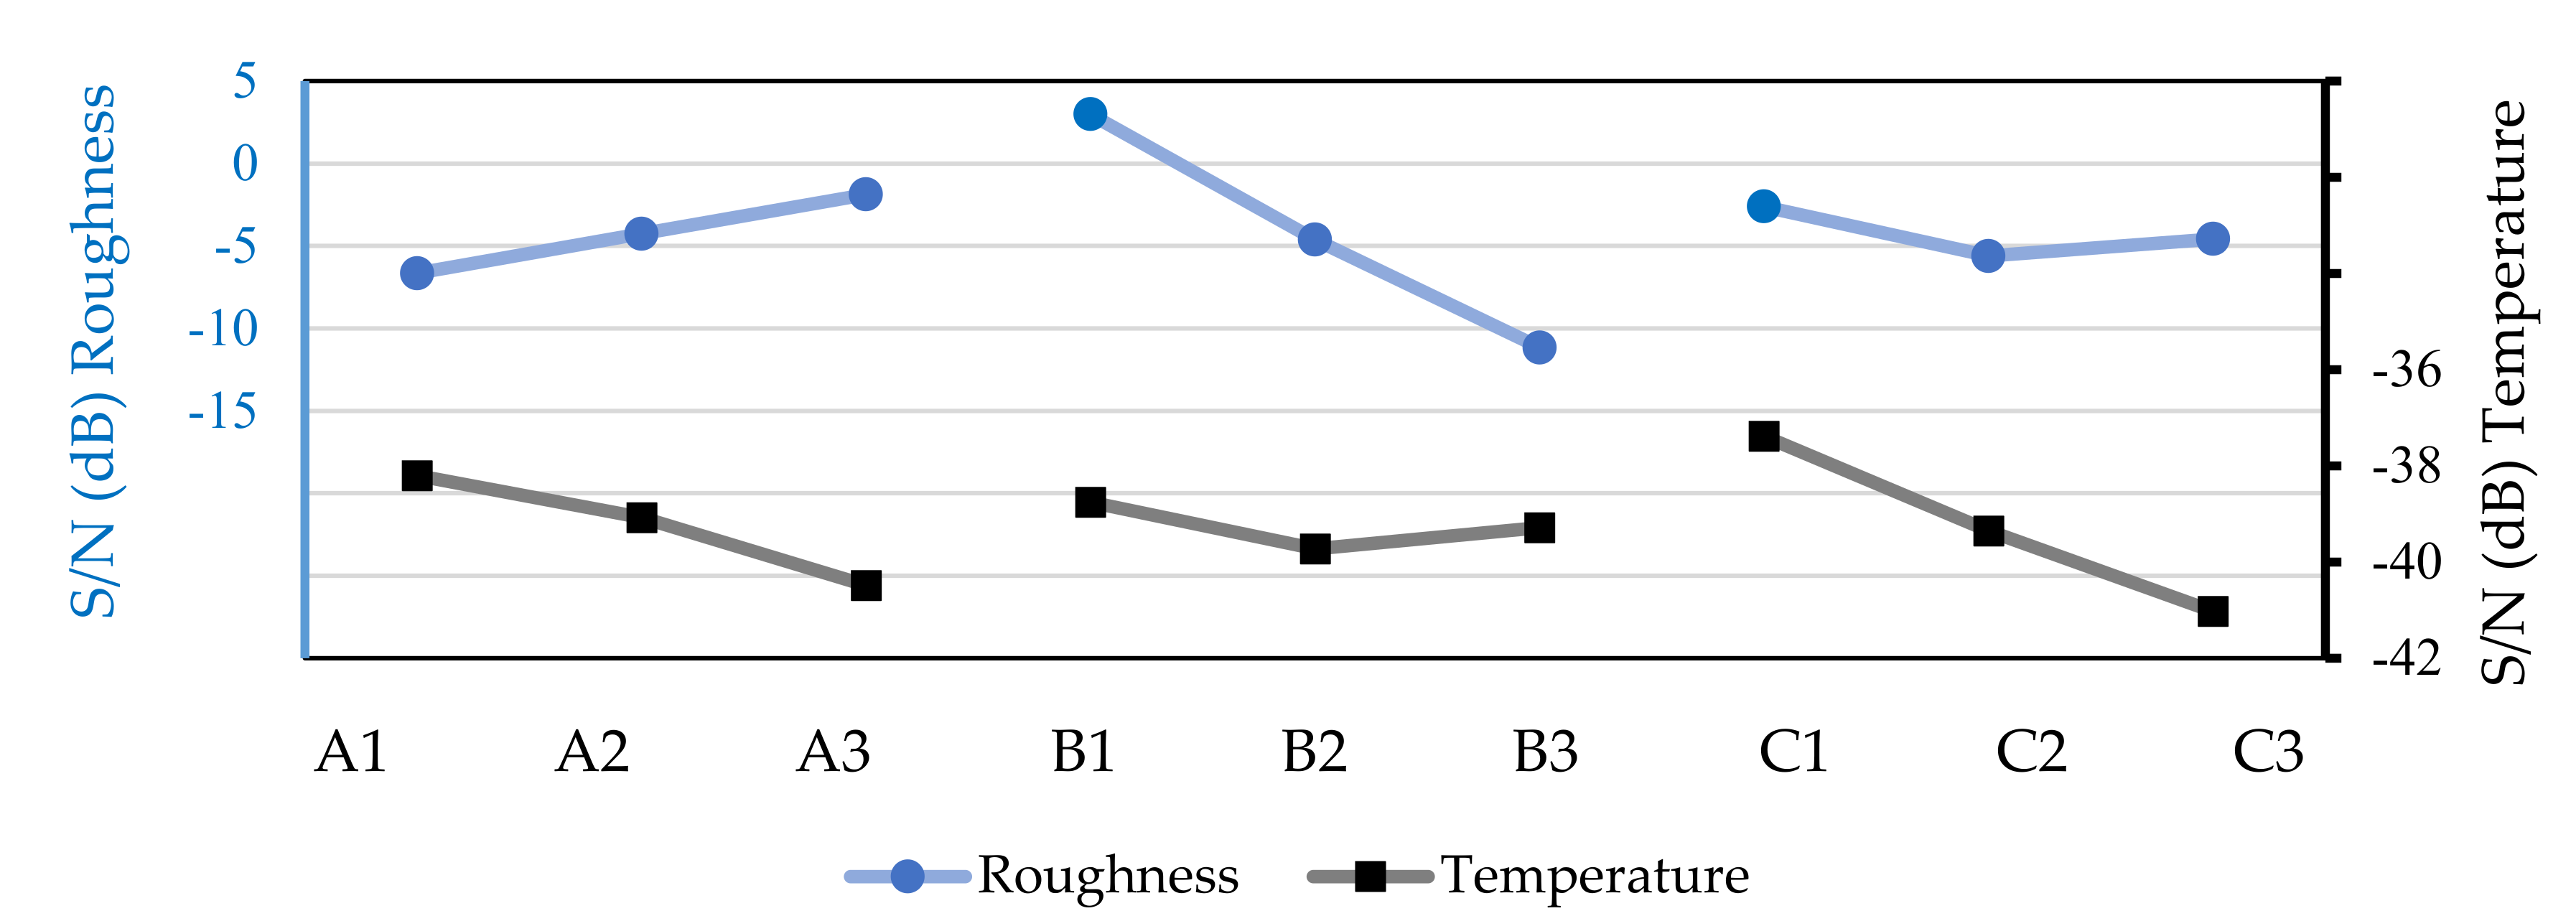
3.1.1. Optimal Combination of Parameters
3.1.2. ANOVA Analysis
3.1.3. Comparison of Lubricating Fluids
3.2. Tribological Tests
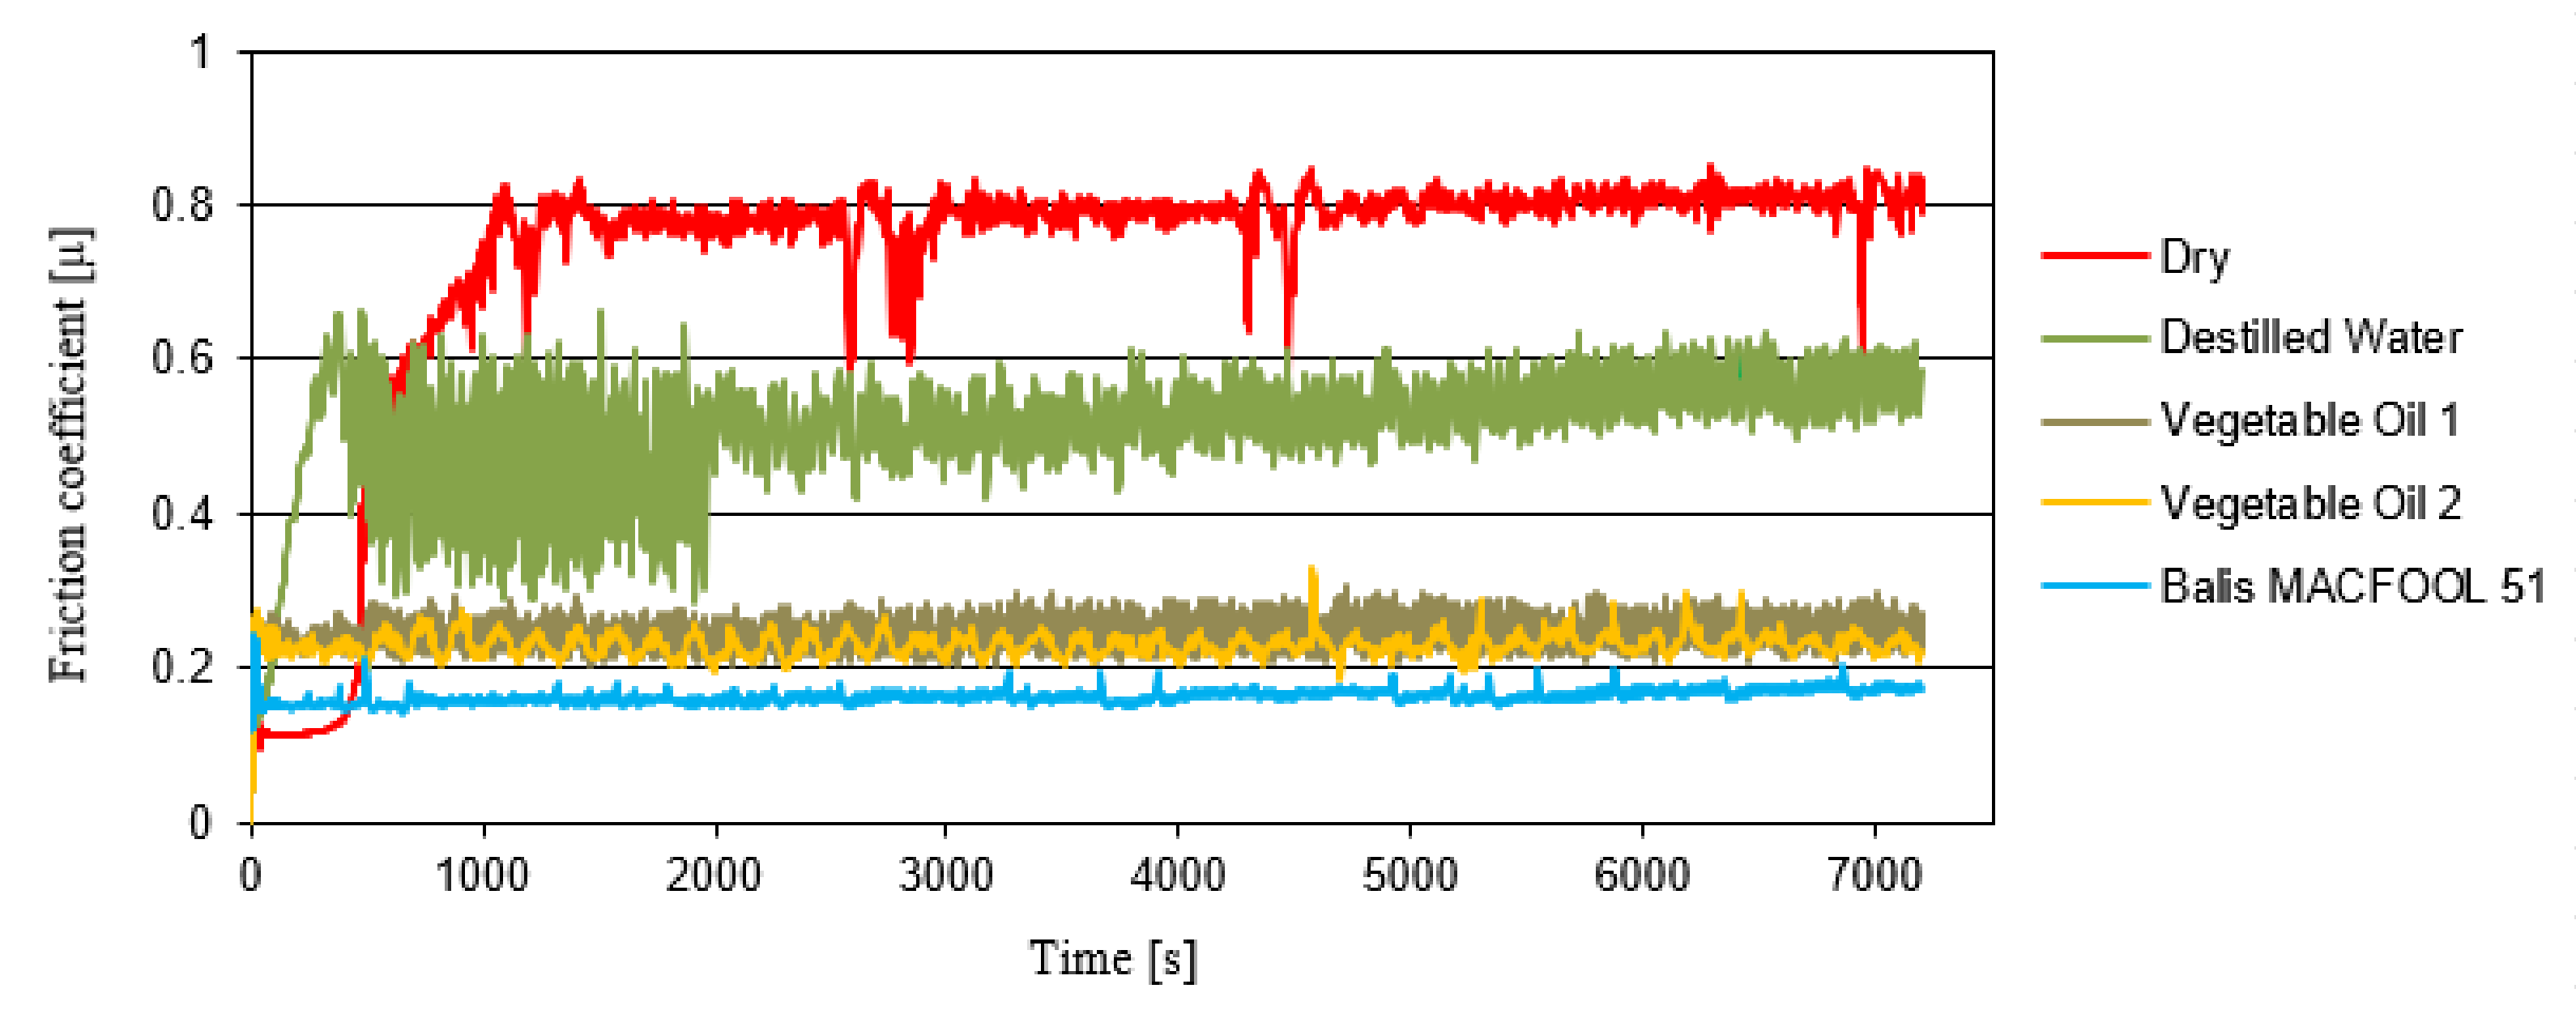
3.2.1. Friction Coefficient
3.2.2. Wear Analysis
4. Conclusions
Author Contributions
Funding
Acknowledgments
Conflicts of Interest
References
- Yusoff, A.R. Identifying bifurcation behaviour during machining process for an irregular milling tool geometry. Measurement 2016, 93, 57–66. [Google Scholar] [CrossRef]
- Lopes, R.; Rodrigues, R.O.; Pinho, D.; Garcia, V.; Schutte, H.; Lima, R.; Gassmann, S. Low cost microfluidic device for partial cell separation: Micromilling approach. In Proceedings of the IEEE International Conference on Industrial Technology ICIT, Sevilla, Spain, 17–19 March; 2015; pp. 3347–3350. [Google Scholar] [CrossRef]
- Singhal, J.; Pinho, D.; Lopes, R.; Sousa, P.C.; Garcia, V.; Schutte, H.; Lima, R.; Gassmann, S. Blood Flow Visualization and Measurements in Microfluidic Devices Fabricated by a Micromilling Technique. Micro Nanosyst. 2016, 7, 148–153. [Google Scholar] [CrossRef]
- Faustino, V.; Catarino, S.O.; Lima, R.; Minas, G. Biomedical microfluidic devices by using low-cost fabrication techniques: A review. J. Biomech. 2016, 49, 2280–2292. [Google Scholar] [CrossRef] [PubMed]
- Catarino, S.O.; Rodrigues, R.O.; Pinho, D.; Miranda, J.M.; Minas, G.; Lima, R. Blood Cells Separation and Sorting Techniques of Passive Microfluidic Devices: From Fabrication to Applications. Micromachines 2019, 10, 593. [Google Scholar] [CrossRef]
- Esfe, M.H.; Bahiraei, M.; Mir, A. Application of conventional and hybrid nanofluids in different machining processes: A critical review. Adv. Colloid Interface Sci. 2020, 282, 102199. [Google Scholar] [CrossRef]
- Dambatta, Y.S.; Sayuti, M.; Sarhan, A.A.D.; Hamdi, M.; Manladan, S.M.; Reddy, M. Tribological performance of SiO2-based nanofluids in minimum quantity lubrication grinding of Si3N4 ceramic. J. Manuf. Processes 2019, 41, 135–147. [Google Scholar] [CrossRef]
- Benedicto, E.; Rubio, E.M.; Carou, D.; Santacruz, C. The role of surfactant structure on the development of a sustainable and effective cutting fluid for machining titanium alloys. Metals 2020, 10, 1388. [Google Scholar] [CrossRef]
- Ribeiro, J.; Lopes, H.; Queijo, L.; Figueiredo, D. Optimization of cutting parameters to minimize the surface roughness in the end milling process using the Taguchi method. Period. Polytech. Mech. Eng. 2017, 61, 30–35. [Google Scholar] [CrossRef]
- Öktem, H.; Erzurumlu, T.; Kurtaran, H. Application of response surface methodology in the optimization of cutting conditions for surface roughness. J. Mater. Process. Technol. 2005, 170, 11–16. [Google Scholar] [CrossRef]
- Grzesik, W. Influence of tool wear on surface roughness in hard turning using differently shaped ceramic tools. Wear 2008, 265, 327–335. [Google Scholar] [CrossRef]
- Mahesh, G.; Muthu, S.; Devadasan, S.R. Prediction of surface roughness of end milling operation using genetic algorithm. Int. J. Adv. Manuf. Technol. 2015, 77, 369–381. [Google Scholar] [CrossRef]
- Tzeng, C.J.; Lin, Y.H.; Yang, Y.K.; Jeng, M.C. Optimization of turning operations with multiple performance characteristics using the Taguchi method and Grey relational analysis. J. Mater. Process. Technol. 2009, 209, 2753–2759. [Google Scholar] [CrossRef]
- Zhang, J.Z.; Chen, J.C.; Kirby, E.D. Surface roughness optimization in an end-milling operation using the Taguchi design method. J. Mater. Process. Technol. 2007, 184, 233–239. [Google Scholar] [CrossRef]
- Ribeiro, J.; Monteiro, J.; Lopes, H.; Vaz, M. Moiré Interferometry Assessment of Residual Stress Variation in Depth on a Shot Peened Surface. Strain 2009, 47, e542–e550. [Google Scholar] [CrossRef]
- Chen, Z.; Moverare, J.; Peng, R.L.; Johansson, S. Surface Integrity and Fatigue Performance of Inconel 718 in Wire Electrical Discharge Machining. Procedia CIRP 2016, 45, 307–310. [Google Scholar] [CrossRef]
- Astakhov, V.; Davim, P. Tools (Geometry and Material) and Tool Wear. In Machining: Fundamentals and Recent Advances; Davim, J.P., Ed.; Springer-Verlag: London, UK, 2008; pp. 29–57. [Google Scholar]
- Yan, P.; Rong, Y.; Wang, G. The effect of cutting fluids applied in metal cutting process. Proc. Inst. Mech. Eng. Part B J. Eng. Manuf. 2015, 230, 19–37. [Google Scholar] [CrossRef]
- Brinksmeier, E.; Meyer, D.; Huesmann-Cordes, A.G.; Herrmann, C. Metalworking fluids—Mechanisms and performance. CIRP Ann. 2015, 64, 605–628. [Google Scholar] [CrossRef]
- Park, R.M. Risk Assessment for Metalworking Fluids and Respiratory Outcomes. Saf. Health Work 2019, 10, 428–436. [Google Scholar] [CrossRef]
- Syahir, A.Z.; Zulkifli, N.W.M.; Masjuki, H.H.; Kalam, M.A.; Alabdulkarem, A.; Gulzar, M.; Khuong, L.S.; Harith, M.H. A review on bio-based lubricants and their applications. J. Clean. Prod. 2017, 168, 997–1016. [Google Scholar] [CrossRef]
- Fox, N.J.; Stachowiak, G.W. Vegetable oil-based lubricants—A review of oxidation. Tribol. Int. 2007, 40, 1035–1046. [Google Scholar] [CrossRef]
- Wu, H.; Zhang, S. Numerical Study on the Fluid Flow and Heat Transfer Characteristics of Al2O3-Water Nanofluids in Microchannels of Different Aspect Ratio. Micromachines 2021, 12, 868. [Google Scholar] [CrossRef]
- Zainon, S.N.M.; Azmi, W.H. Recent Progress on Stability and Thermo-Physical Properties of Mono and Hybrid towards Green Nanofluids. Micromachines 2021, 12, 176. [Google Scholar] [CrossRef]
- Lima, R.; Vega, E.J.; Moita, A.S.; Miranda, J.M.; Pinho, D.; Moreira, A.L.N. Fast, flexible and low-cost multiphase blood analogue for biomedical and energy applications. Exp. Fluids 2020, 61, 231. [Google Scholar] [CrossRef]
- Lima, R.A.M.M.; Vega, E.J.; Cardoso, V.F.; Minas, G.; Montanero, J.M. Magnetic PDMS Microparticles for Biomedical and Energy Applications. In Proceedings of the ECCOMAS Thematic Conference on Computational Vision and Medical Image Processing, Porto, Portugal, 16–18 October 2019; Springer: Berlin/Heidelberg, Germany, 2019; pp. 578–584. [Google Scholar] [CrossRef]
- Maia, I.; Rocha, C.; Pontes, P.; Cardoso, V.; Miranda, J.M.; Moita, A.S.; Minas, G.; Moreira, A.L.N.; Lima, R. Heat Transfer and Fluid Flow Investigations in PDMS Microchannel Heat Sinks Fabricated by Means of a Low-Cost 3D Printer. In Advances in Microfluidic Technologies for Energy and Environmental Applications; Ren, Y., Ed.; IntechOpen: Rijeka, Croatia, 2020. [Google Scholar]
- Nobrega, G.; de Souza, R.R.; Gonçalves, I.M.; Moita, A.S.; Ribeiro, J.E.; Lima, R.A. Recent Developments on the Thermal Properties, Stability and Applications of Nanofluids in Machining, Solar Energy and Biomedicine. Appl. Sci. 2022, 12, 1115. [Google Scholar] [CrossRef]
- Yu, H.; Xu, Y.; Shi, P.; Wang, H.; Zhao, Y.; Xu, B.; Bai, Z. Tribological behaviours of surface-coated serpentine ultrafine powders as lubricant additive. Tribol. Int. 2010, 43, 667–675. [Google Scholar] [CrossRef]
- Kazeem, R.A.; Fadare, D.A.; Ikumapayi, O.M.; Adediran, A.A.; Aliyu, S.J.; Akinlabi, S.A.; Jen, T.-C.; Akinlabi, E.T. Advances in the Application of Vegetable-Oil-Based Cutting Fluids to Sustainable Machining Operations—A Review. Lubricants 2022, 10, 69. [Google Scholar] [CrossRef]
- Jeevan, T.P.; Jayaram, S.R. Tribological Properties and Machining Performance of Vegetable Oil Based Metal Working Fluids—A Review. Mod. Mech. Eng. 2018, 8, 42–65. [Google Scholar] [CrossRef]
- Kreivaitis, R.; Gumbytė, M. Investigation of mixture of vegetable oil and synthetic esters as environmentally friendly base stock for low-temperature lubrication applications. Tribol. Ind. 2018, 40, 401–409. [Google Scholar] [CrossRef]
- Burton, G.; Goo, C.S.; Zhang, Y.; Jun, M.B.G. Use of vegetable oil in water emulsion achieved through ultrasonic atomization as cutting fluids in micro-milling. J. Manuf. Processes 2014, 16, 405–413. [Google Scholar] [CrossRef]
- D’Amato, R.; Wang, C.; Calvo, R.; Valášek, P.; Ruggiero, A. Characterization of vegetable oil as cutting fluid. Procedia Manuf. 2019, 41, 145–152. [Google Scholar] [CrossRef]
- European Commission. Market situation in the olive oil and table olives sectors. Agric. Rural Dev. 2021, 1–27. [Google Scholar]
- Zhang, S.; Li, J.F.; Wang, Y.W. Tool life and cutting forces in end milling Inconel 718 under dry and minimum quantity cooling lubrication cutting conditions. J. Clean. Prod. 2012, 32, 81–87. [Google Scholar] [CrossRef]
- Singh, J.; Gill, S.S.; Dogra, M.; Singh, R. A review on cutting fluids used in machining processes. Eng. Res. Express 2021, 3, 012002. [Google Scholar] [CrossRef]
- Polychniatou, V.; Tzia, C. Study of formulation and stability of co-surfactant free water-in-olive oil nano- and submicron emulsions with food grade non-ionic surfactants. JAOCS J. Am. Oil Chem. Soc. 2014, 91, 79–88. [Google Scholar] [CrossRef]
- Daniyan, I.; Tlhabadira, I.; Adeodu, A.; Phokobye, S.; Mpofu, K. Process design and modelling for milling operation of titanium alloy (Ti6Al4V) Using the Taguchi method. Procedia CIRP 2020, 91, 348–355. [Google Scholar] [CrossRef]
- Tlhabadira, I.; Daniyan, I.A.; Masu, L.; VanStaden, L.R. Process Design and Optimization of Surface Roughness during M200 TS Milling Process using the Taguchi Method. Procedia CIRP 2019, 84, 868–873. [Google Scholar] [CrossRef]
- Bonnet, J.-P.; Devesvre, L.; Artaud, J.; Moulin, P. Dynamic viscosity of olive oil as a function of composition and temperature: A first approach. Eur. J. Lipid Sci. Technol. 2011, 113, 1019–1025. [Google Scholar] [CrossRef]


| Test Designation | Lubrication Condition |
|---|---|
| Dry | Dry |
| BM50 | Balis MAFCOOL 51 with flow rate 50 ± 5 mL/h |
| BM100 | Balis MAFCOOL 51 with flow rate 100 ± 5 mL/h |
| VO50 | Vegetable oil with flow rate 50 ± 5 mL/h |
| VO100 | Vegetable oil with flow rate 100 ± 5 mL/h |
| Test Number | A | B | C |
|---|---|---|---|
| 1 | 1 | 1 | 1 |
| 2 | 1 | 2 | 2 |
| 3 | 1 | 3 | 3 |
| 4 | 2 | 1 | 2 |
| 5 | 2 | 2 | 3 |
| 6 | 2 | 3 | 1 |
| 7 | 3 | 1 | 3 |
| 8 | 3 | 2 | 1 |
| 9 | 3 | 3 | 2 |
| Parameter | Level 1 | Level 2 | Level 3 |
|---|---|---|---|
| Spindle speed [rpm] | 195 | 285 | 500 |
| Feed rate [mm/min] | 20 | 63 | 185 |
| Axial depth [mm] | 0.3 | 0.6 | 1 |
| Test Number | Dry | mL/h | mL/h | mL/h | mL/h | |||||
|---|---|---|---|---|---|---|---|---|---|---|
| T1 [°C] | Ra2 [µm] | T1 [°C] | Ra2 [µm] | T1 [°C] | Ra2 [µm] | T1 [°C] | Ra2 [µm] | T1 [°C] | Ra2 [µm] | |
| 1 | 67.81 | 0.82 | 59.84 | 0.76 | 45.19 | 0.72 | 58.00 | 0.79 | 52.71 | 0.78 |
| 2 | 94.48 | 2.85 | 82.34 | 2.78 | 77.86 | 2.75 | 82.46 | 3.04 | 77.68 | 2.66 |
| 3 | 105.70 | 3.93 | 101.38 | 3.47 | 98.61 | 3.45 | 97.54 | 3.71 | 93.15 | 3.75 |
| 4 | 101.62 | 0.70 | 88.09 | 0.64 | 78.20 | 0.61 | 91.47 | 0.66 | 78.32 | 0.66 |
| 5 | 119.69 | 1.79 | 112.52 | 1.7 | 100.16 | 1.70 | 112.15 | 1.87 | 100.94 | 1.82 |
| 6 | 80.71 | 3.38 | 68.94 | 3.06 | 65.03 | 2.96 | 66.7 | 3.21 | 60.86 | 3.24 |
| 7 | 121.57 | 0.62 | 115.54 | 0.60 | 101.7 | 0.51 | 106.3 | 0.64 | 101.05 | 0.63 |
| 8 | 104.68 | 0.93 | 90.91 | 0.84 | 86.44 | 0.83 | 101.03 | 0.85 | 92.31 | 0.83 |
| 9 | 115.41 | 3.47 | 103.43 | 3.03 | 93.85 | 3.19 | 104.39 | 3.59 | 101.15 | 3.56 |
| Average | 101.29 | 2.05 | 91.44 | 1.87 | 83.00 | 1.86 | 91.11 | 2.04 | 84.24 | 1.99 |
| Test Number | [rpm] | [nm/min] | [mm] |
Average of Ra [] | S/Ns of Ra [dB] | Average Temperature [°C] | S/Ns of Temperature [dB] |
|---|---|---|---|---|---|---|---|
| Dry1 | 195 | 20 | 0.3 | 0.82 | 1.09 | 67.81 | −36.79 |
| Dry2 | 195 | 63 | 0.6 | 2.85 | −9.97 | 94.48 | −39.77 |
| Dry3 | 195 | 185 | 1 | 3.93 | −12.50 | 105.70 | −40.83 |
| Dry4 | 285 | 20 | 0.6 | 0.70 | 2.76 | 101.62 | −40.32 |
| Dry5 | 285 | 63 | 1 | 1.79 | −5.37 | 119.69 | −41.82 |
| Dry6 | 285 | 185 | 0.3 | 3.38 | −11.58 | 80.71 | −38.31 |
| Dry7 | 500 | 20 | 1 | 0.62 | 3.99 | 121.57 | −42.04 |
| Dry8 | 500 | 63 | 0.3 | 0.93 | 0.17 | 104.68 | −40.72 |
| Dry9 | 500 | 185 | 0.6 | 3.47 | −11.66 | 115.41 | −41.48 |
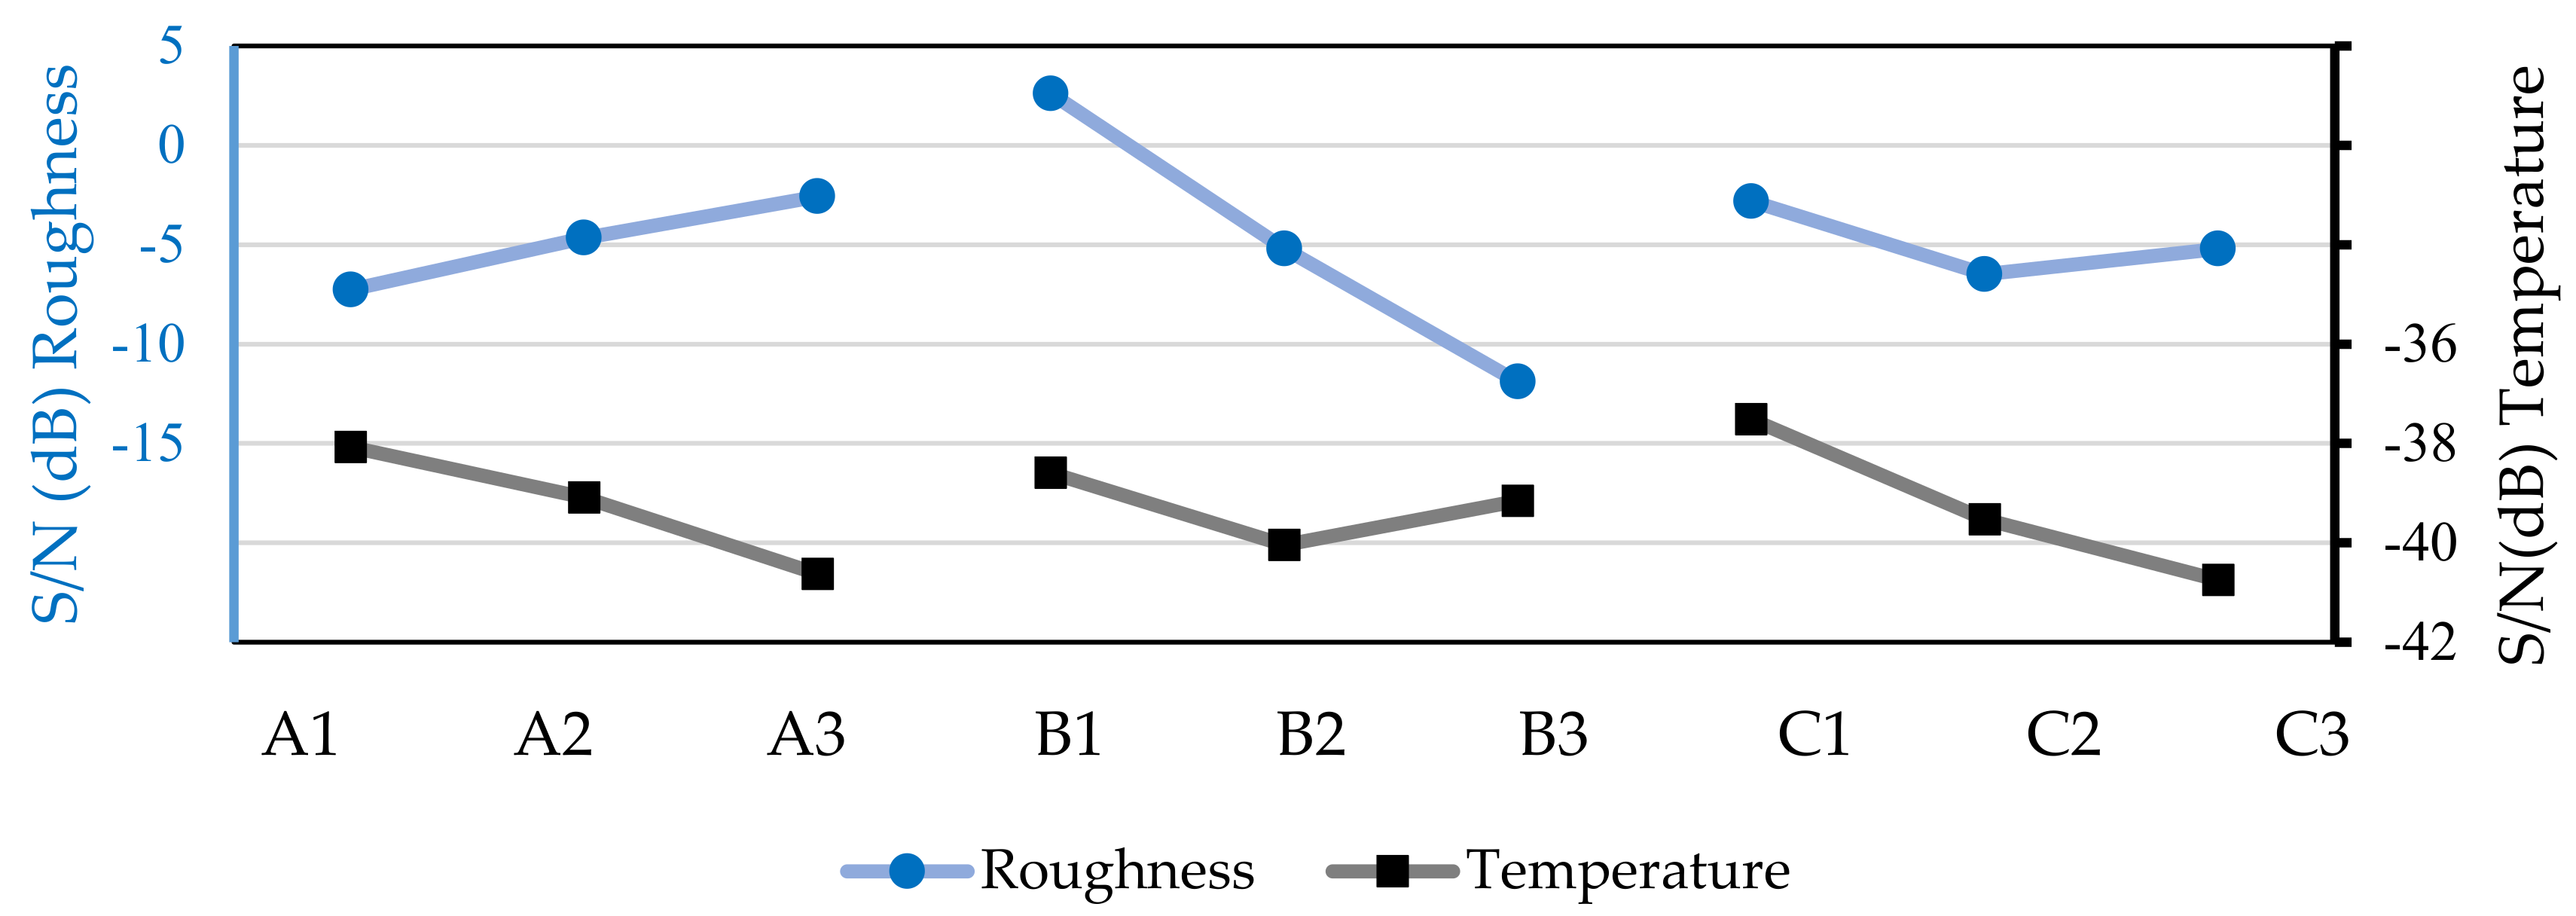
| PARAMETER | S/NS OF RA [DB] | S/NS OF TEMPERATURE [DB] | |
|---|---|---|---|
| A1 | = 195 rpm | −7.12 | −39.13 |
| A2 | = 285 rpm | −4.73 | −40.15 |
| A3 | = 500 rpm | −2.49 | −41.41 |
| B1 | = 20 mm/min | 2.62 | −39.72 |
| B2 | = 63 mm/min | −5.05 | −40.77 |
| B3 | = 185 mm/min | −11.92 | −40.21 |
| C1 | = 0.3 mm | −3.43 | −38.61 |
| C2 | = 0.6 mm | −6.29 | −40.52 |
| C3 | = 1 mm | −4.62 | −41.57 |
| Test Number | [rpm] | [nm/min] | [mm] |
Average of Ra [] |
S/Ns of Ra [dB] |
Average Temperature [°C] |
S/Ns of Temperature [dB] |
|---|---|---|---|---|---|---|---|
| BM50_1 | 195 | 20 | 0.3 | 0.76 | 1.78 | 59.84 | −35.73 |
| BM50_2 | 195 | 63 | 0.6 | 2.78 | −9.50 | 82.34 | −38.49 |
| BM50_3 | 195 | 185 | 1 | 3.47 | −12.24 | 101.38 | −40.37 |
| BM50_4 | 285 | 20 | 0.6 | 0.64 | 3.24 | 88.09 | −39.05 |
| BM50_5 | 285 | 63 | 1 | 1.7 | −5.37 | 112.52 | −41.21 |
| BM50_6 | 285 | 185 | 0.3 | 3.06 | −10.66 | 68.94 | −36.95 |
| BM50_7 | 500 | 20 | 1 | 0.60 | 3.89 | 115.54 | −41.48 |
| BM50_8 | 500 | 63 | 0.3 | 0.84 | 1.02 | 90.91 | −39.46 |
| BM50_9 | 500 | 185 | 0.6 | 3.03 | −10.5 | 103.43 | −40.51 |
| Test Number | [rpm] | [nm/min] | [mm] |
Average of Ra [] | S/Ns of Ra [dB] | Average Temperature [°C] | S/Ns of Temperature [dB] |
|---|---|---|---|---|---|---|---|
| BM100_1 | 195 | 20 | 0.3 | 0.72 | 2.29 | 45.19 | −33.16 |
| BM100_2 | 195 | 63 | 0.6 | 2.75 | −9.53 | 77.86 | −37.98 |
| BM100_3 | 195 | 185 | 1 | 3.45 | −12.25 | 98.61 | −40.17 |
| BM100_4 | 285 | 20 | 0.6 | 0.61 | 3.81 | 78.20 | −38.25 |
| BM100_5 | 285 | 63 | 1 | 1.70 | −5.50 | 100.16 | −40.44 |
| BM100_6 | 285 | 185 | 0.3 | 2.96 | −10.46 | 65.03 | −36.57 |
| BM100_7 | 500 | 20 | 1 | 0.51 | 4.99 | 101.70 | −40.60 |
| BM100_8 | 500 | 63 | 0.3 | 0.83 | 1.23 | 86.44 | −39.12 |
| BM100_9 | 500 | 185 | 0.6 | 3.19 | −10.75 | 93.85 | −39.82 |
| Test Number | [rpm] | [nm/min] | [mm] |
Average of Ra [] | S/Ns of Ra [dB] | Average Temperature [°C] | S/Ns of Temperature [dB] |
|---|---|---|---|---|---|---|---|
| VO50_1 | 195 | 20 | 0.3 | 0.79 | 1.56 | 58.00 | −35.44 |
| VO50_2 | 195 | 63 | 0.6 | 3.04 | −10.47 | 82.46 | −38.58 |
| VO50_3 | 195 | 185 | 1 | 3.71 | −12.88 | 97.54 | −40.18 |
| VO50_4 | 285 | 20 | 0.6 | 0.66 | 2.93 | 91.47 | −39.41 |
| VO50_5 | 285 | 63 | 1 | 1.87 | −6.02 | 112.15 | −41.13 |
| VO50_6 | 285 | 185 | 0.3 | 3.21 | −10.90 | 66.7 | −36.70 |
| VO50_7 | 500 | 20 | 1 | 0.64 | 3.29 | 106.03 | −40.91 |
| VO50_8 | 500 | 63 | 0.3 | 0.85 | 0.89 | 101.03 | −40.39 |
| VO50_9 | 500 | 185 | 0.6 | 3.59 | −11.91 | 104.39 | −40.57 |
| Test Number | [rpm] | [nm/min] | [mm] |
Average of Ra [] | S/Ns of Ra [dB] | Average Temperature [°C] | S/Ns of Temperature [dB] |
|---|---|---|---|---|---|---|---|
| VO100_1 | 195 | 20 | 0.3 | 0.78 | 1.72 | 52.71 | −34.60 |
| VO100_2 | 195 | 63 | 0.6 | 2.66 | −9.64 | 77.68 | −38.03 |
| VO100_3 | 195 | 185 | 1 | 3.75 | −12.66 | 93.15 | −39.83 |
| VO100_4 | 285 | 20 | 0.6 | 0.66 | 3.55 | 78.32 | −38.13 |
| VO100_5 | 285 | 63 | 1 | 1.82 | −6.02 | 100.94 | −40.30 |
| VO100_6 | 285 | 185 | 0.3 | 3.24 | −11.20 | 60.86 | −35.86 |
| VO100_7 | 500 | 20 | 1 | 0.63 | 3.39 | 101.05 | −40.69 |
| VO100_8 | 500 | 63 | 0.3 | 0.83 | 1.18 | 92.31 | −39.61 |
| VO100_9 | 500 | 185 | 0.6 | 3.56 | −11.87 | 101.15 | −40.37 |
| Temperature | ||||||
|---|---|---|---|---|---|---|
| Df6 | Sq7 | Md8 | F Value9 | p Value10 | Contribution [%] | |
| 2 | 7.8523 | 3.9262 | 11.41 | 0.081 | 33.10% | |
| 2 | 1.6615 | 0.8307 | 2.41 | 0.293 | 7.00% | |
| 2 | 13.5176 | 6.7588 | 19.64 | 0.048 | 56.99% | |
| Error | 2 | 0.6883 | 0.3442 | 2.90% | ||
| Total | 8 | 23.7197 | 100.00% | |||
| Surface Roughness | ||||||
| Df6 | Sq7 | Md8 | F Value9 | p Value10 | Contribution [%] | |
| 2 | 32.14 | 16.068 | 2.7 | 0.271 | 8.60% | |
| 2 | 317.53 | 158.765 | 26.64 | 0.036 | 84.92% | |
| 2 | 12.33 | 6.163 | 1.03 | 0.492 | 3.30% | |
| Error | 2 | 11.92 | 5.96 | 3.19% | ||
| Total | 8 | 373.91 | 100.00% | |||
| Temperature | ||||||
|---|---|---|---|---|---|---|
| Df | Sq | Md | F Value | p Value | Contribution [%] | |
| 2 | 8.0047 | 4.0023 | 11.76 | 0.078 | 26.65 | |
| 2 | 1.4011 | 0.7005 | 2.06 | 0.327 | 4.67 | |
| 2 | 19.9465 | 9.9733 | 29.31 | 0.048 | 66.42 | |
| Error | 2 | 0.6805 | 0.3402 | 2.27 | ||
| Total | 8 | 30.0327 | 100.00 | |||
| Surface Roughness | ||||||
| Df | Sq | Md | F Value | p Value | Contribution [%] | |
| 2 | 34.23 | 17.116 | 2.75 | 0.266 | 9.5 | |
| 2 | 299.97 | 149.986 | 24.14 | 0.04 | 83.22 | |
| 2 | 13.83 | 6.916 | 1.11 | 0.473 | 3.84 | |
| Error | 2 | 12.43 | 6.213 | 3.45 | ||
| Total | 8 | 360.46 | 100.00 | |||
| Temperature | ||||||
|---|---|---|---|---|---|---|
| Df | Sq | Md | F Value | p Value | Contribution [%] | |
| 2 | 11.300 | 5.650 | 3.97 | 0.201 | 24.78 | |
| 2 | 5.769 | 2.884 | 2.03 | 0.330 | 12.65 | |
| 2 | 25.693 | 12.846 | 9.02 | 0.100 | 56.33 | |
| Error | 2 | 2.847 | 1.423 | 6.24 | ||
| Total | 8 | 45.608 | 100.00 | |||
| Surface Roughness | ||||||
| Df | Sq | Md | F Value | p Value | Contribution [%] | |
| 2 | 37.32 | 18.662 | 3.13 | 0.242 | 9.39 | |
| 2 | 332.84 | 166.419 | 27.87 | 0.035 | 83.22 | |
| 2 | 13.83 | 6.916 | 1.11 | 0.436 | 3.88 | |
| Error | 2 | 11.94 | 5.971 | 3.00 | ||
| Total | 8 | 397.55 | 100.00 | |||
| Temperature | ||||||
|---|---|---|---|---|---|---|
| Df6 | Sq | Md | F Value | p Value | Contribution [%] | |
| 2 | 9.933 | 4.967 | 3.84 | 0.207 | 31.30 | |
| 2 | 3.197 | 1.598 | 1.23 | 0.448 | 10.07 | |
| 2 | 16.015 | 8.008 | 6.18 | 0.139 | 50.46 | |
| Error | 2 | 2.590 | 1.295 | 8.16 | ||
| Total | 8 | 31.735 | 100.00 | |||
| Surface Roughness | ||||||
| Df | Sq | Md | F Value | p Value | Contribution [%] | |
| 2 | 33.11 | 16.554 | 2.16 | 0.317 | 8.59 | |
| 2 | 316.06 | 158.032 | 20.61 | 0.046 | 80.02 | |
| 2 | 20.82 | 10.411 | 1.36 | 0.424 | 5.40 | |
| Error | 2 | 15.34 | 7.668 | 3.98 | ||
| Total | 8 | 385.33 | 100.00 | |||
| Temperature | ||||||
|---|---|---|---|---|---|---|
| Df6 | Sq | Md | F Value | p Value | Contribution [%] | |
| 2 | 12.369 | 6.1847 | 7.95 | 0.116 | 33.46 | |
| 2 | 3.434 | 1.7169 | 2.11 | 0.322 | 9.29 | |
| 2 | 19.538 | 9.7191 | 11.99 | 0.077 | 52.85 | |
| Error | 2 | 1.630 | 0.8149 | 4.41 | ||
| Total | 8 | 36.971 | 100.00 | |||
| Surface Roughness | ||||||
| Df6 | Sq | Md | F Value | p Value | Contribution [%] | |
| 2 | 29.43 | 14.713 | 1.63 | 0.377 | 7.49 | |
| 2 | 329.27 | 164.637 | 18.49 | 0.051 | 83.75 | |
| 2 | 16.63 | 8.317 | 0.93 | 0.517 | 4.23 | |
| Error | 2 | 17.81 | 8.904 | 4.53 | ||
| Total | 8 | 393.14 | 100.00 | |||
| Test | Specific Wear Rate (K) [mm3/Nm] |
|---|---|
| Dry | 1.98 × 10−05 |
| Distilled water | 1.72 × 10−06 |
| Vegetable oil 1-1st | --- |
| Vegetable oil 1-2nd | --- |
| Vegetable oil 2-1st | --- |
| Vegetable oil 2-2nd | --- |
| Balis MAFCOOL 51 | --- |
Publisher’s Note: MDPI stays neutral with regard to jurisdictional claims in published maps and institutional affiliations. |
© 2022 by the authors. Licensee MDPI, Basel, Switzerland. This article is an open access article distributed under the terms and conditions of the Creative Commons Attribution (CC BY) license (https://creativecommons.org/licenses/by/4.0/).
Share and Cite
Afonso, I.S.; Pereira, J.; Ribeiro, A.E.; Amaral, J.S.; Rodrigues, N.; Gomes, J.R.; Lima, R.; Ribeiro, J. Analysis of a Vegetable Oil Performance in a Milling Process by MQL Lubrication. Micromachines 2022, 13, 1254. https://doi.org/10.3390/mi13081254
Afonso IS, Pereira J, Ribeiro AE, Amaral JS, Rodrigues N, Gomes JR, Lima R, Ribeiro J. Analysis of a Vegetable Oil Performance in a Milling Process by MQL Lubrication. Micromachines. 2022; 13(8):1254. https://doi.org/10.3390/mi13081254
Chicago/Turabian StyleAfonso, Inês S., José Pereira, António E. Ribeiro, Joana S. Amaral, Nuno Rodrigues, José R. Gomes, Rui Lima, and João Ribeiro. 2022. "Analysis of a Vegetable Oil Performance in a Milling Process by MQL Lubrication" Micromachines 13, no. 8: 1254. https://doi.org/10.3390/mi13081254