
Accurate and Automatic Extraction of Cell Self-Rotation Speed in an ODEP Field Using an Area Change Algorithm

 , and
, and 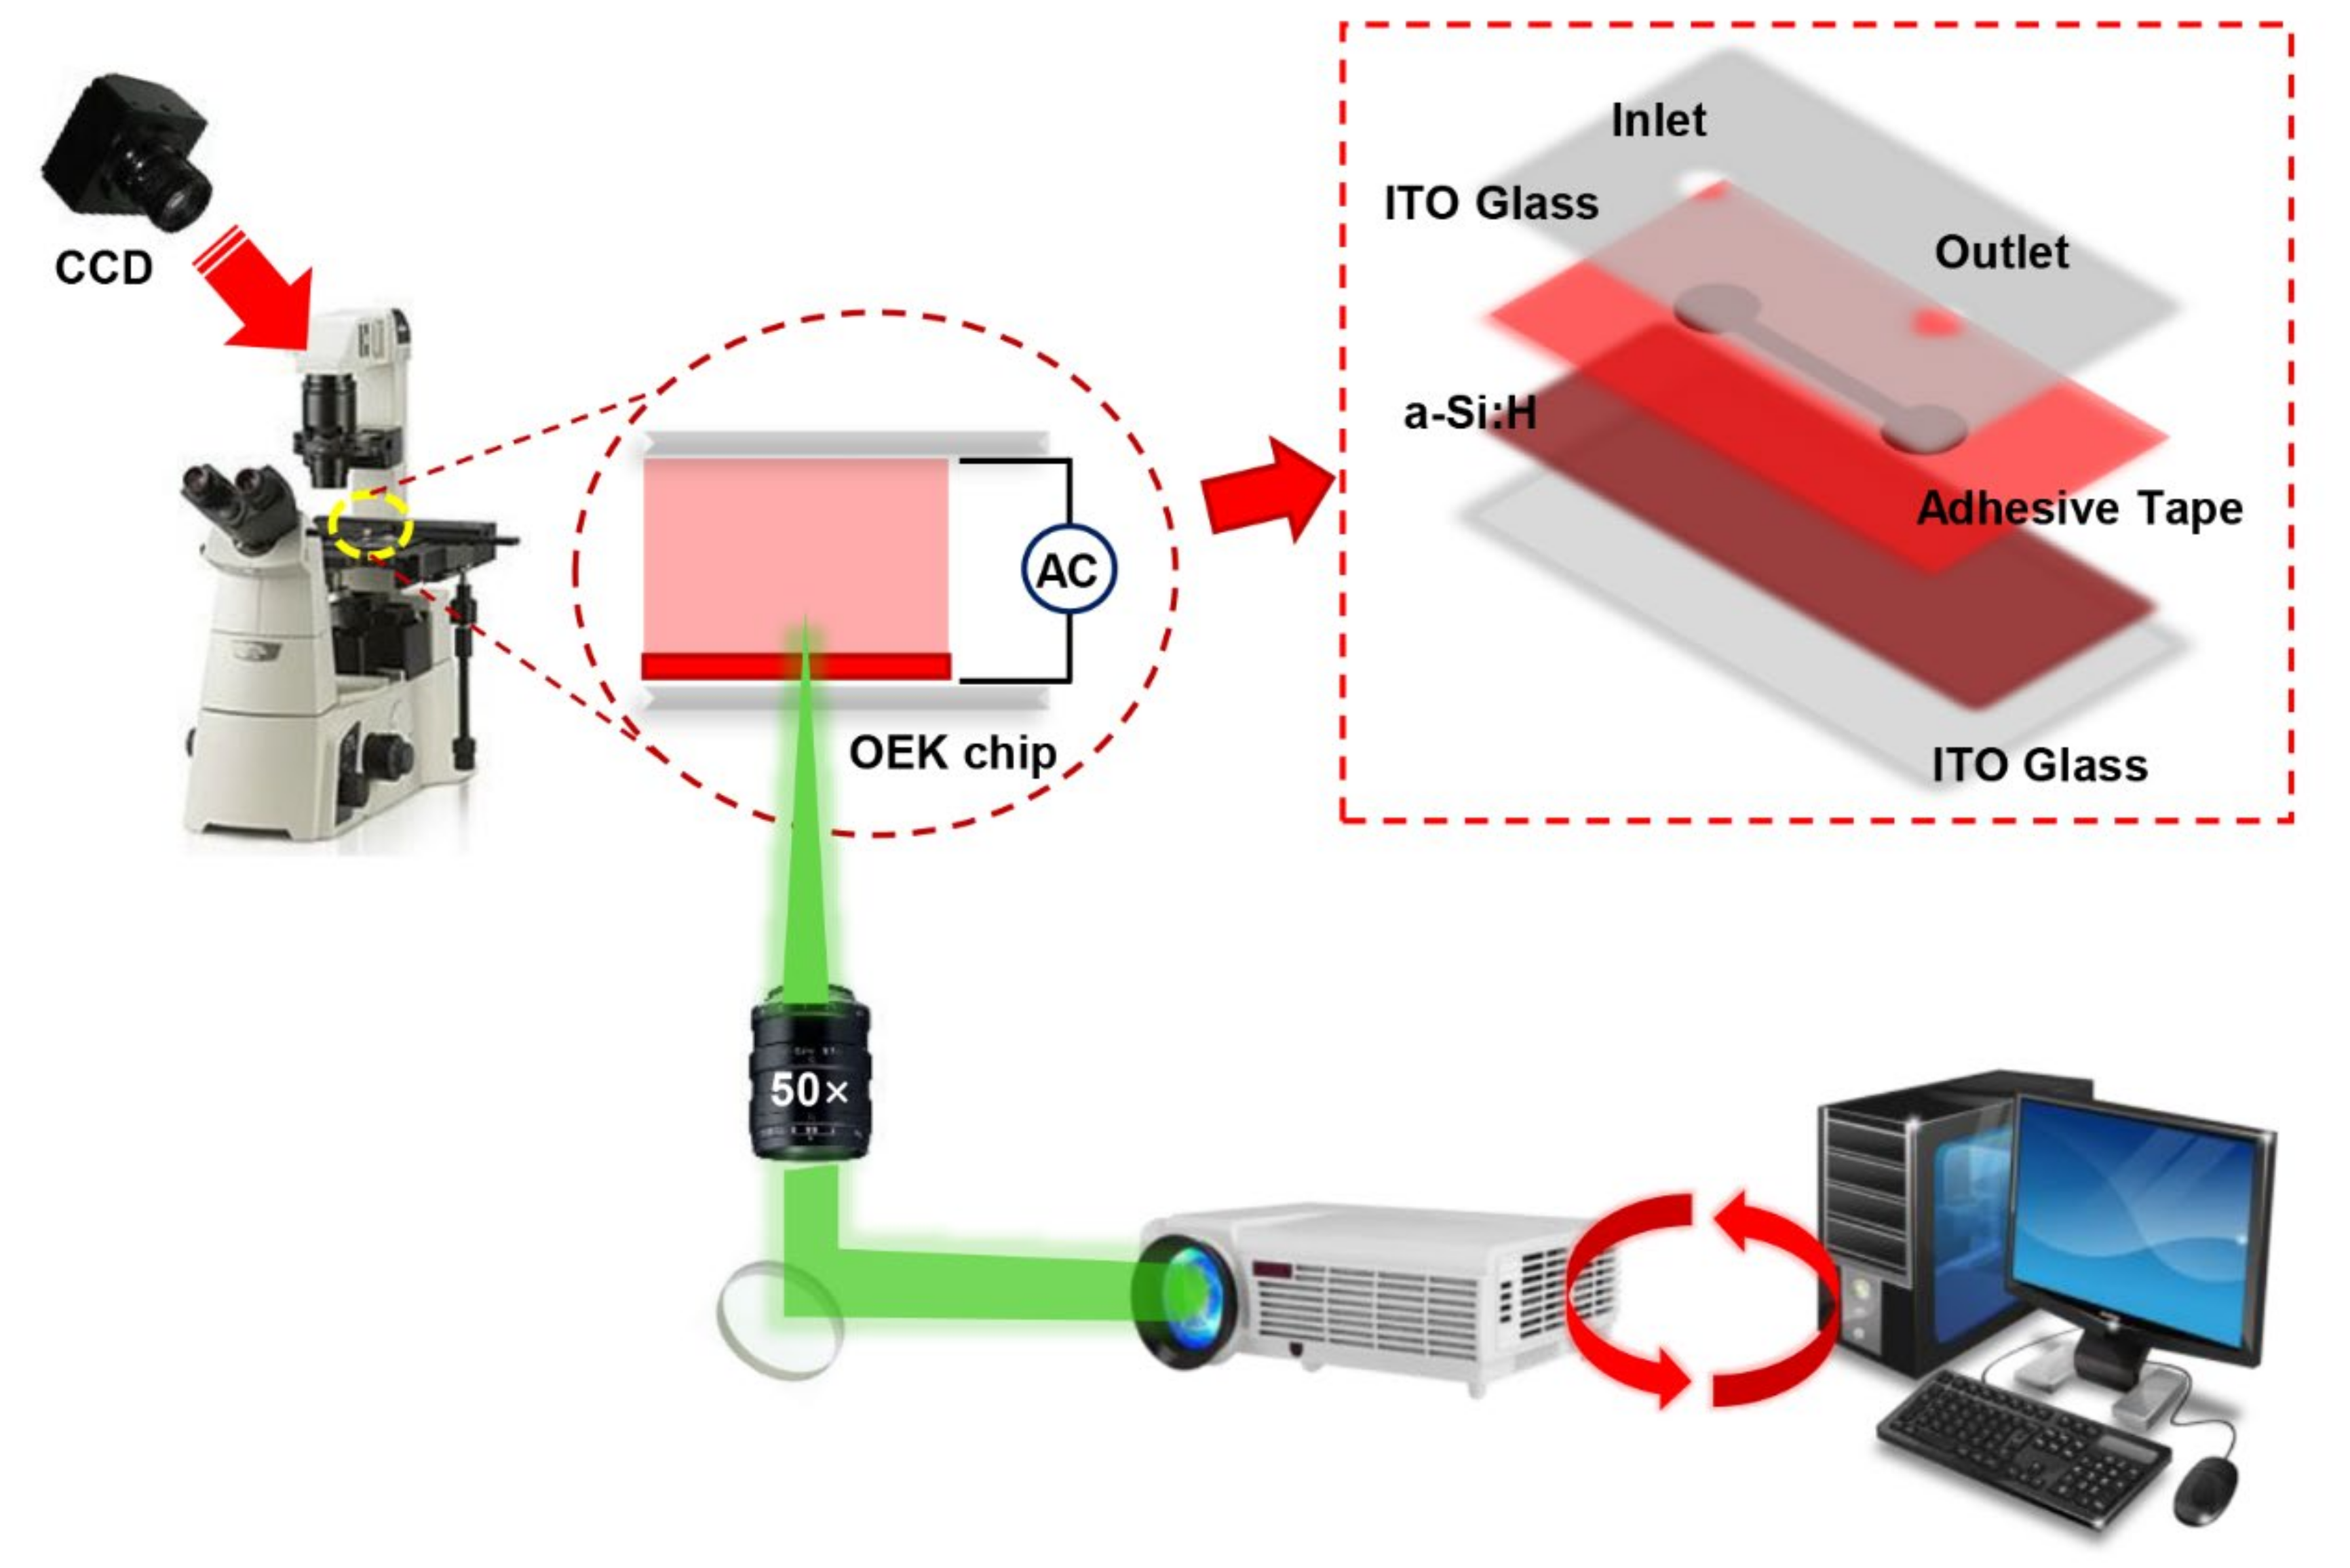
Abstract
:1. Introduction
2. Theory
3. Materials and Methods
3.1. Experimental Setup and Working Principles
3.2. Cell Preparation
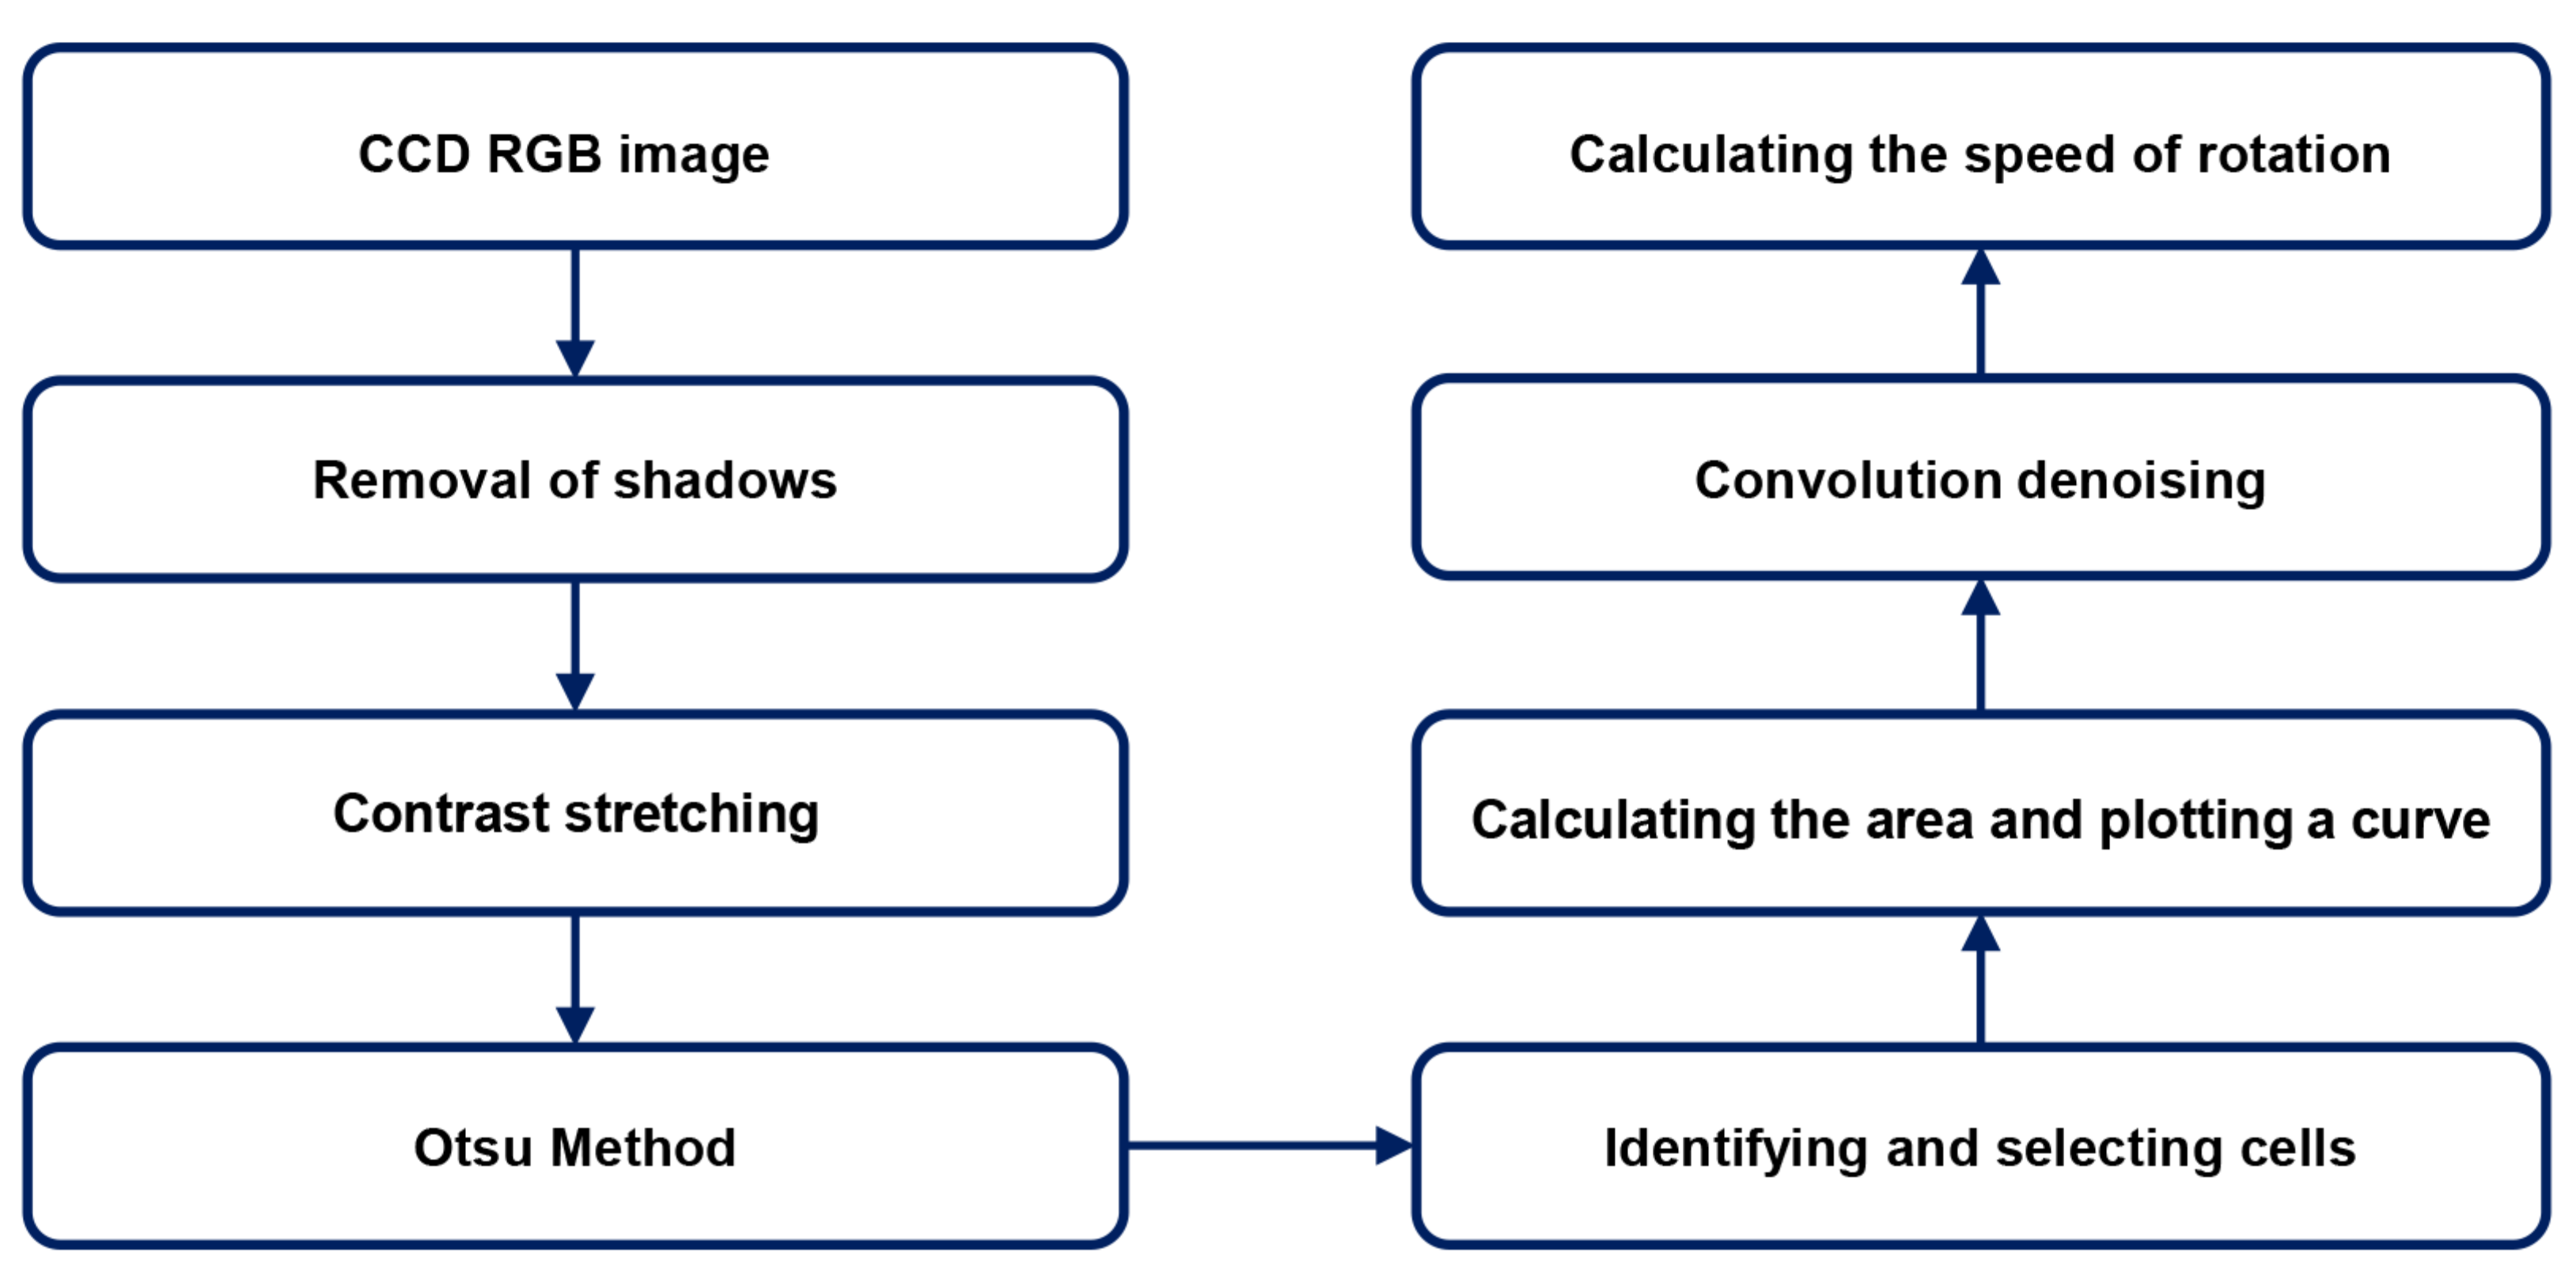
3.3. Self-Rotation Speed Extraction
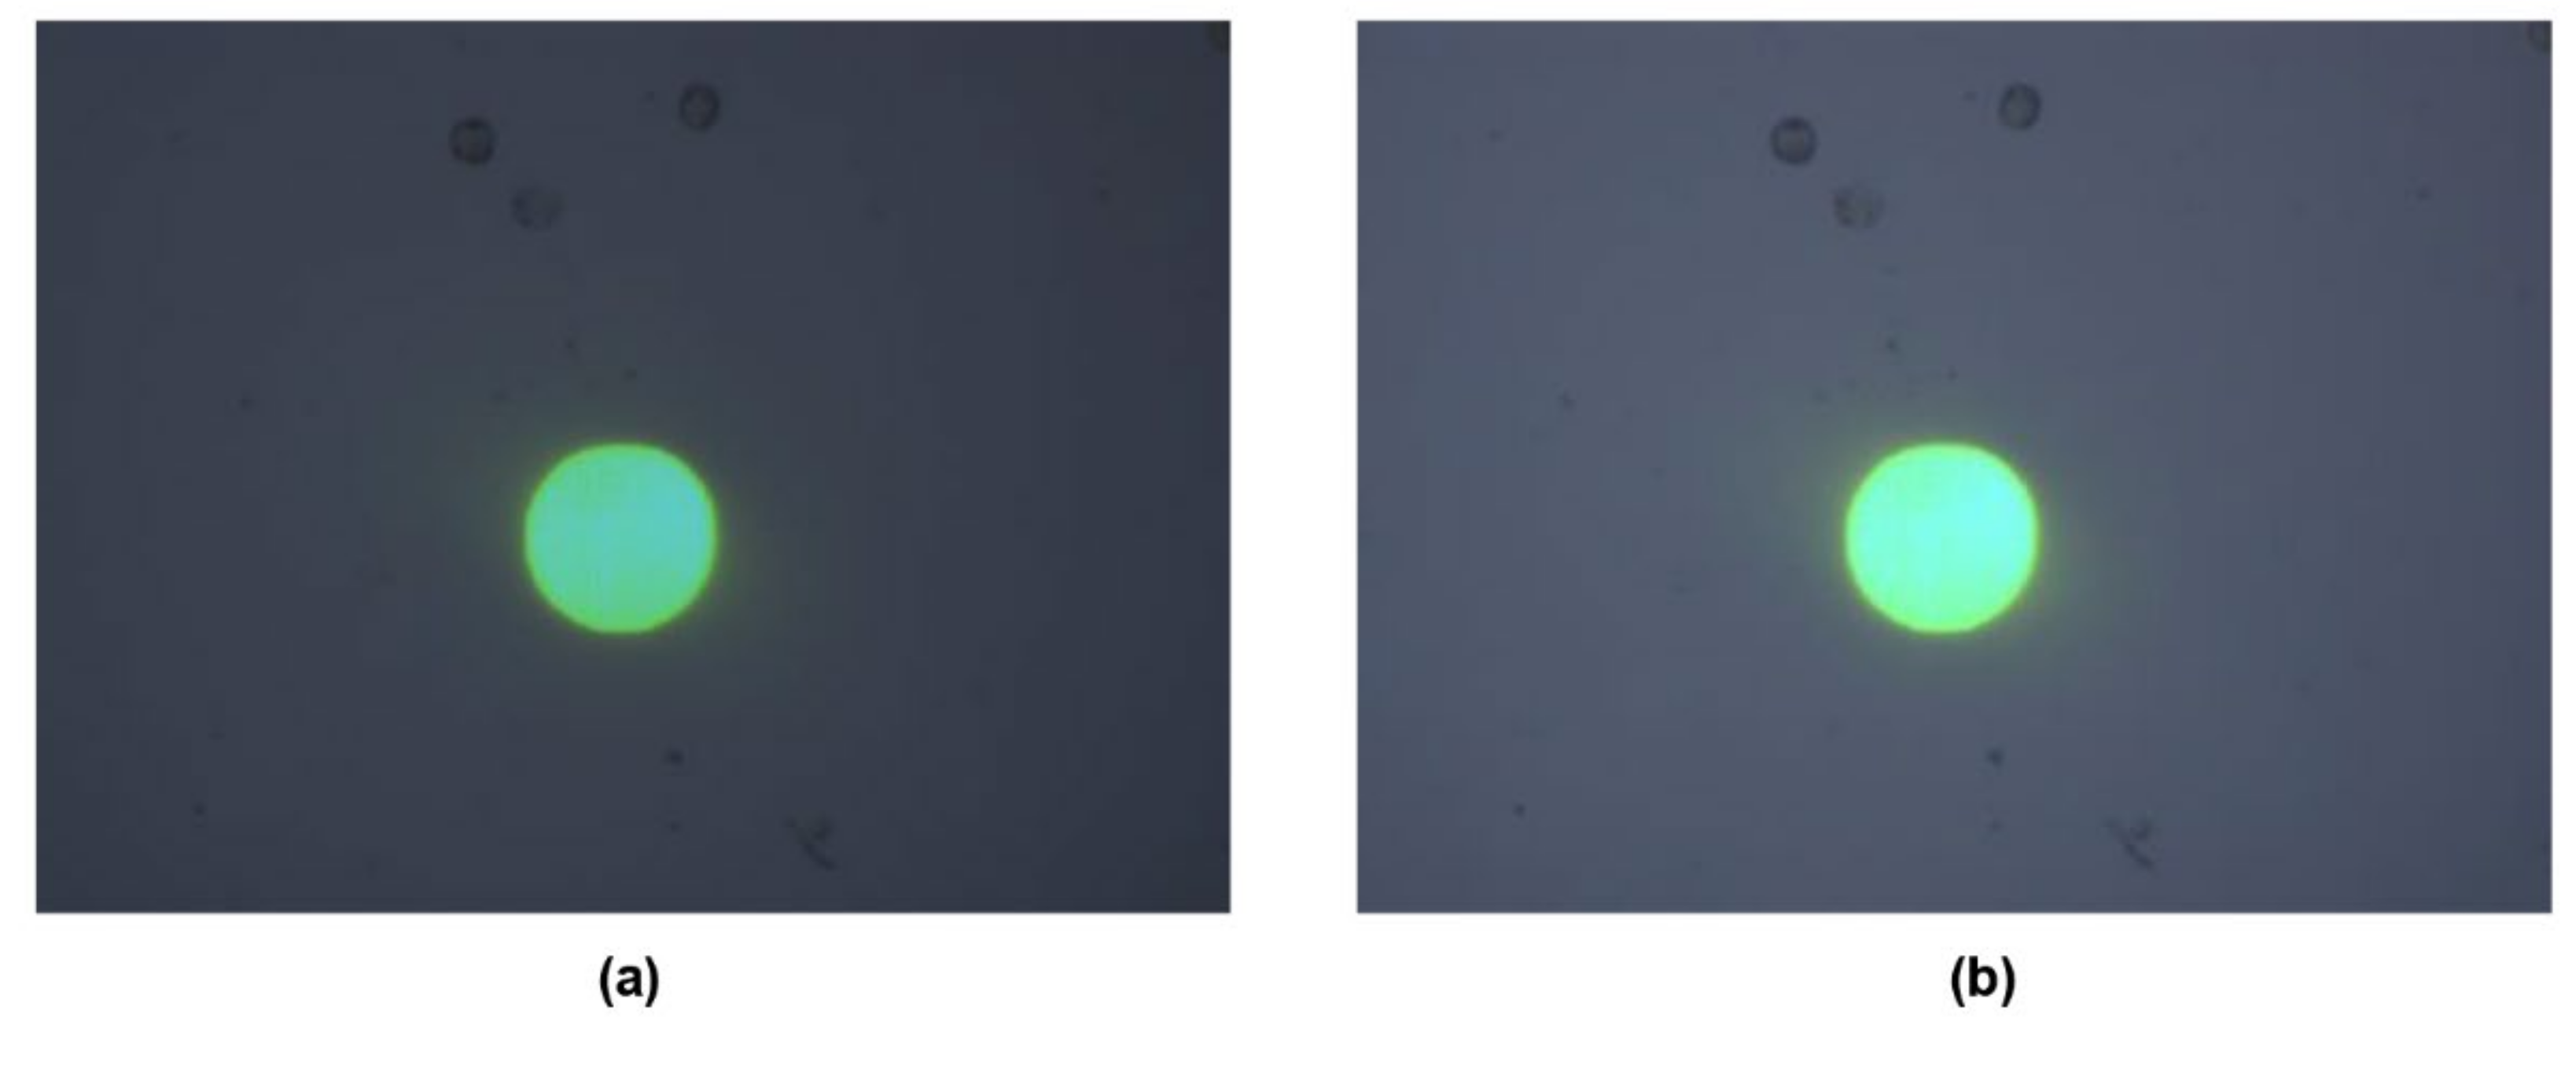
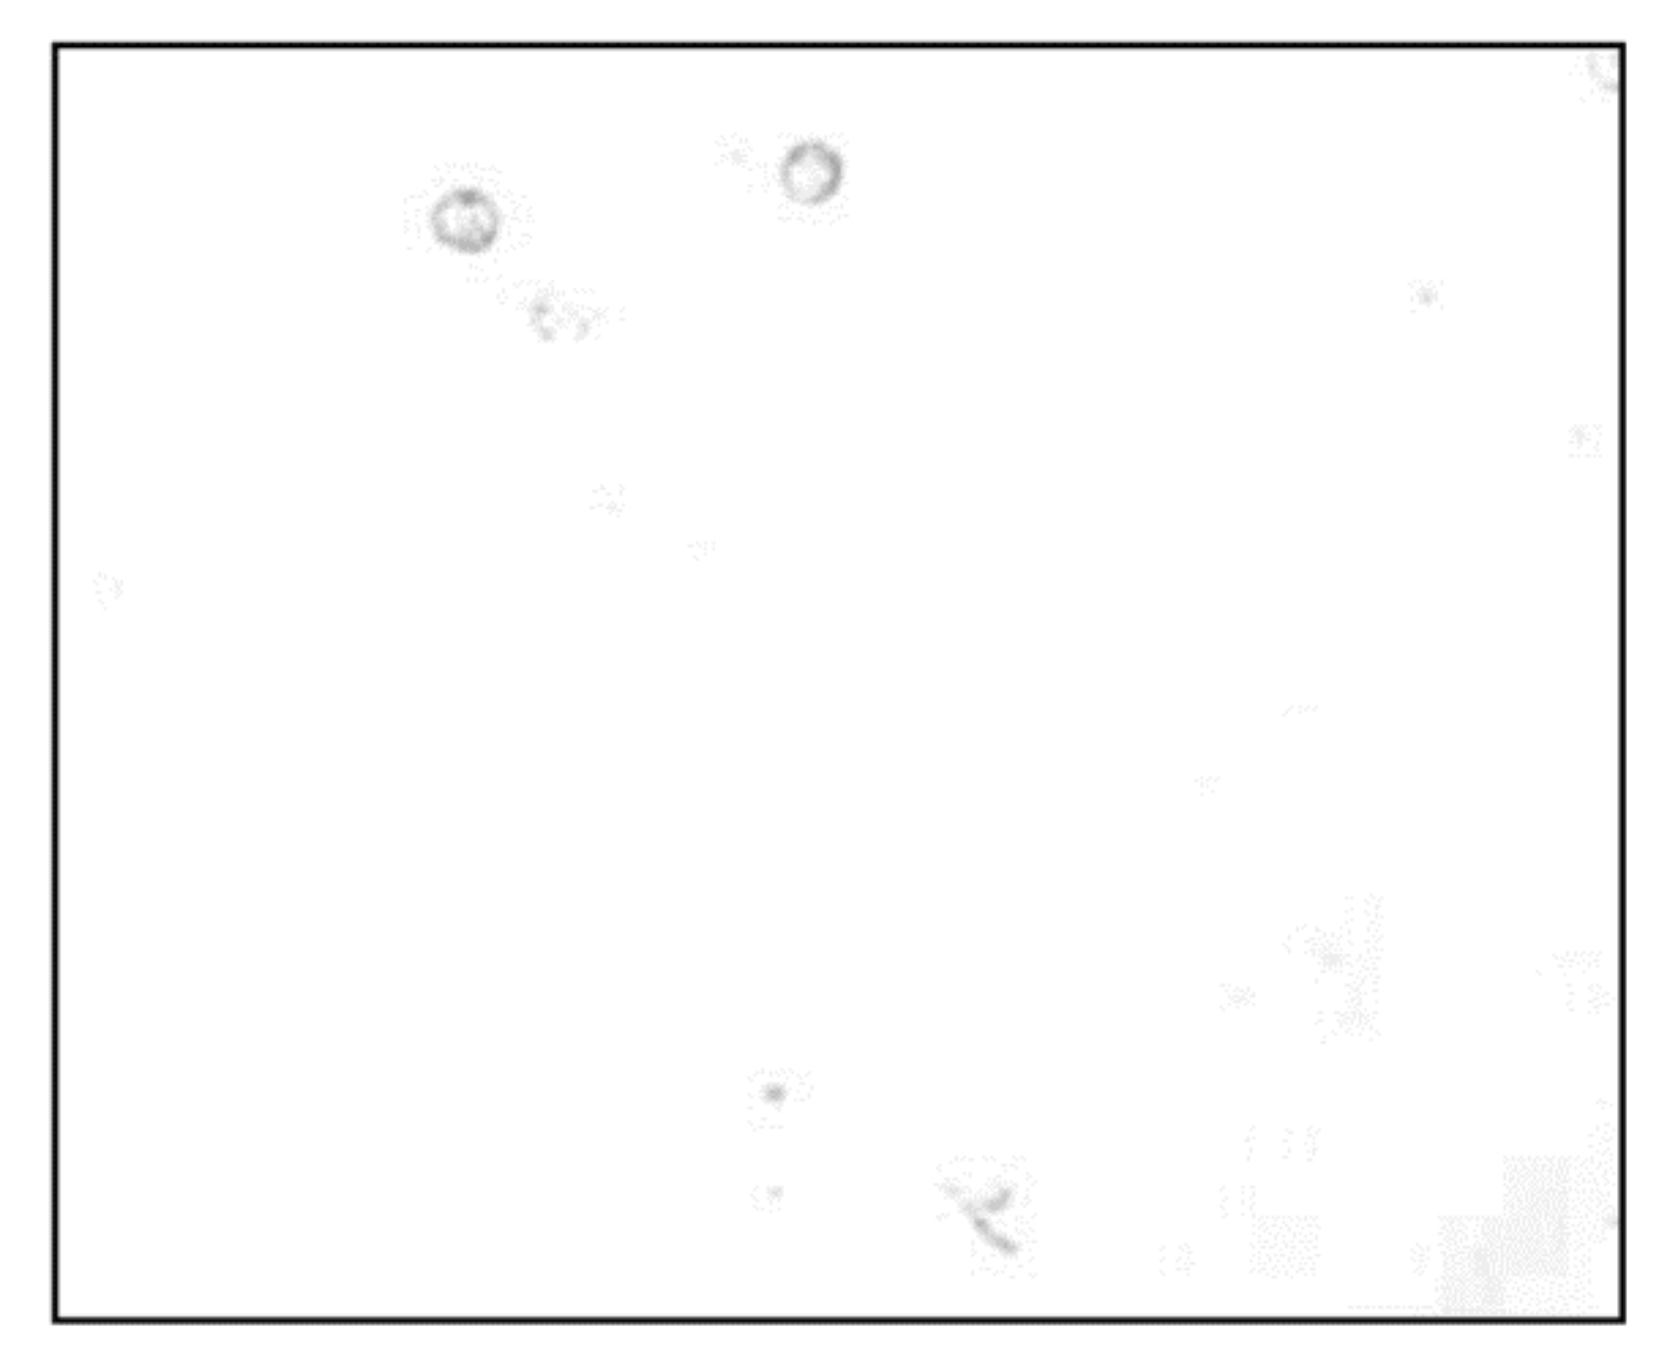
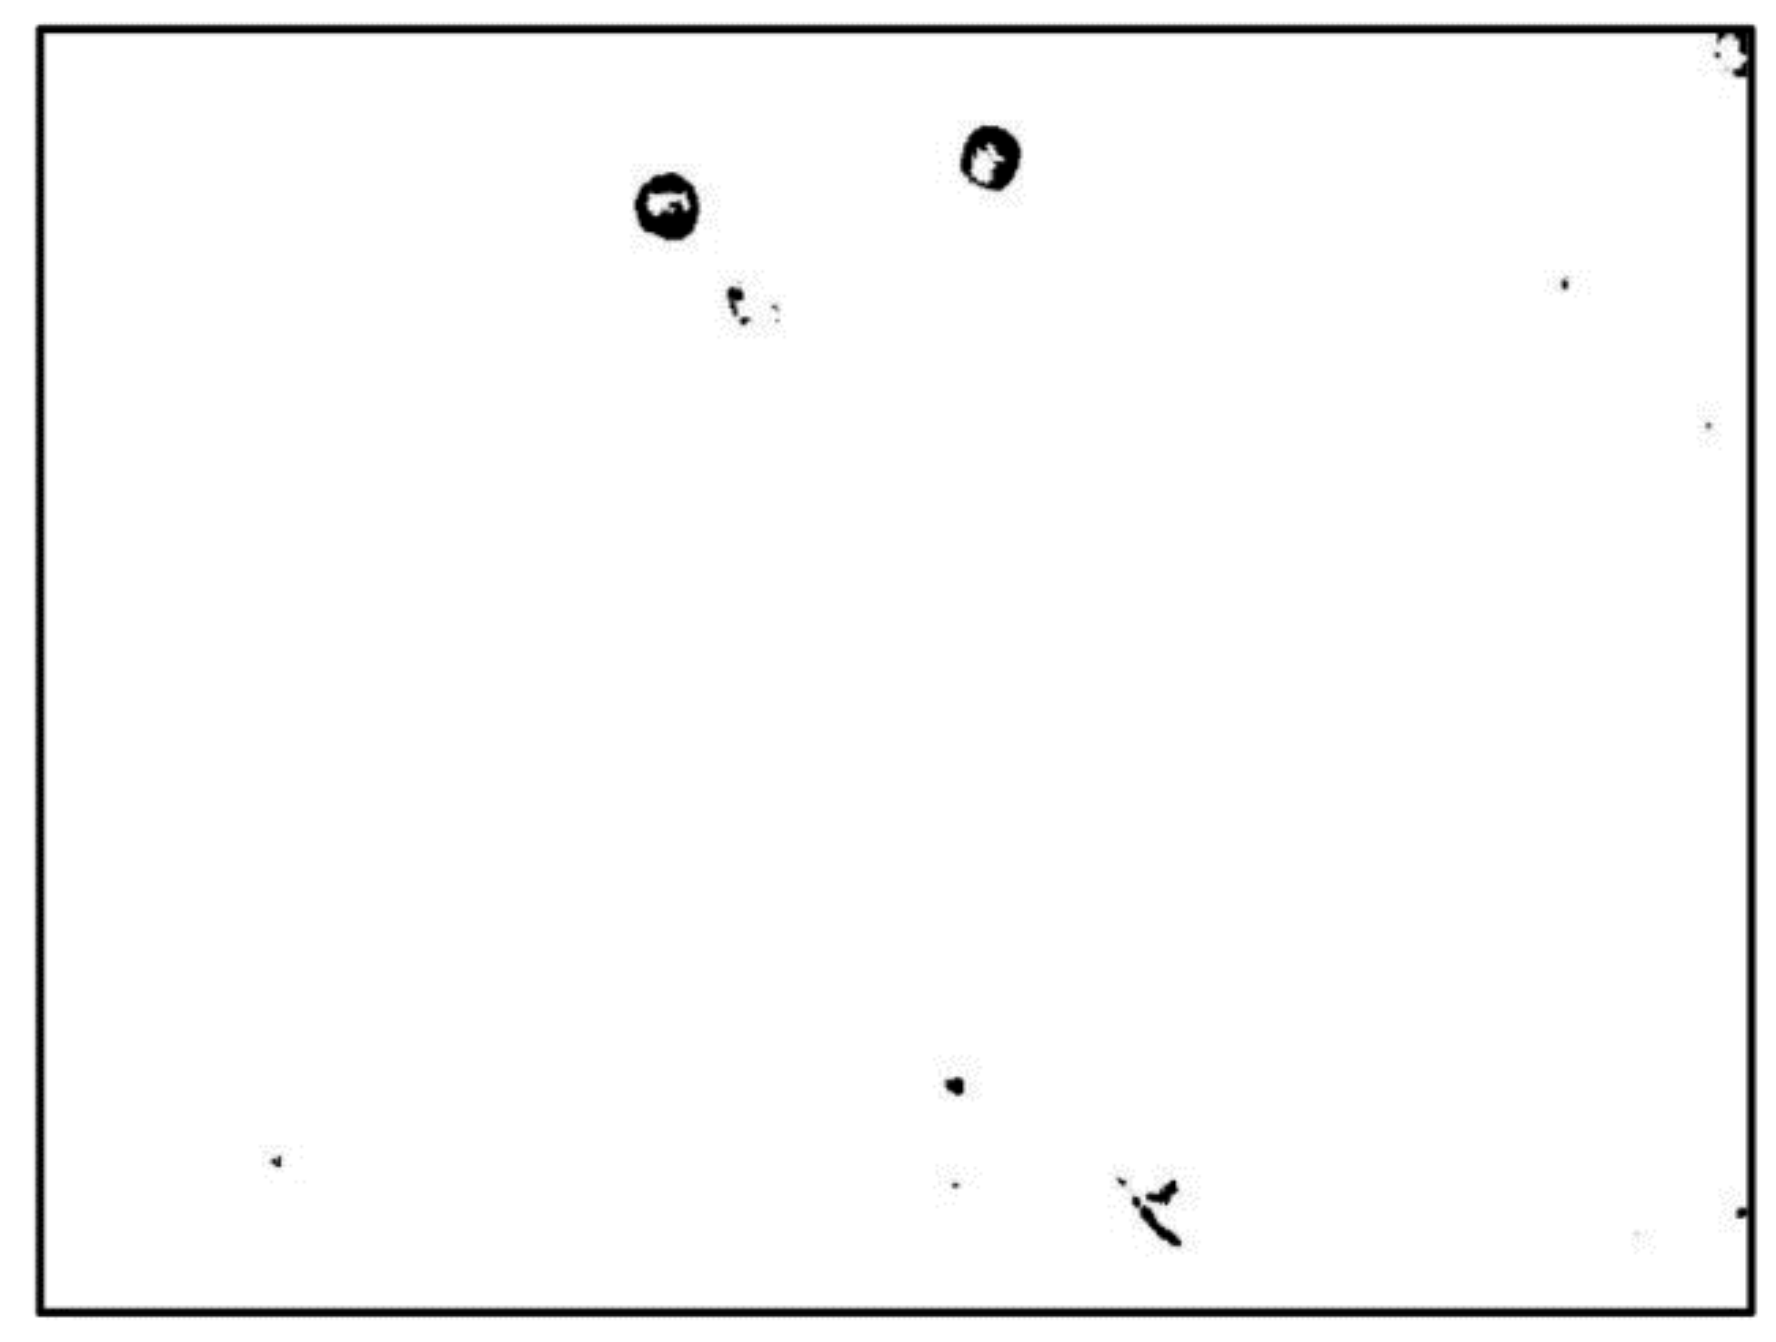
3.3.1. Removing shadows
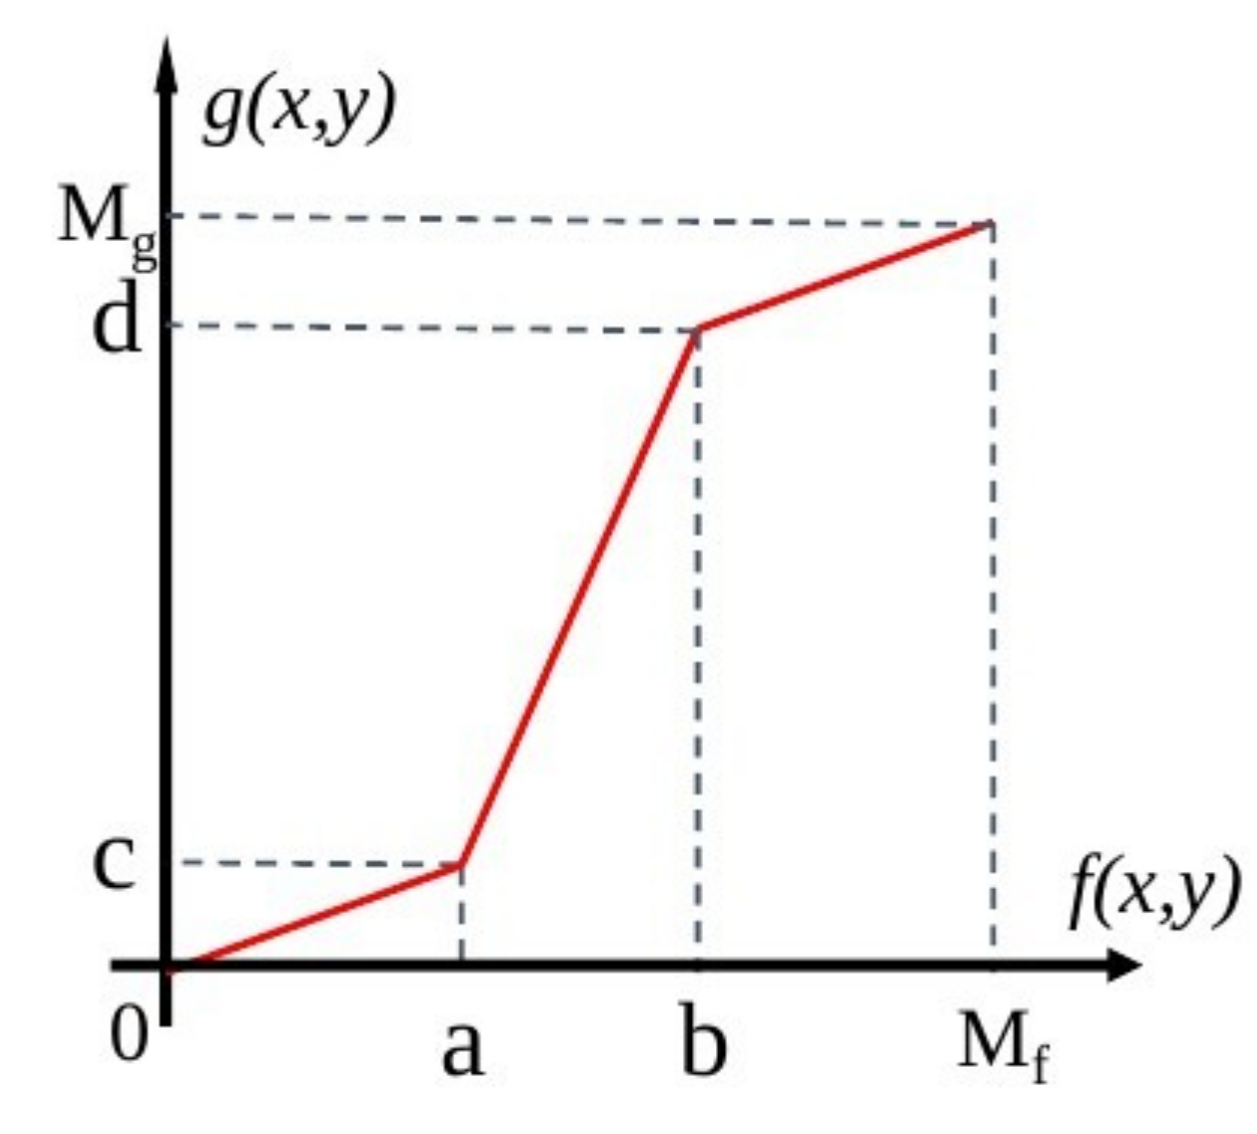
3.3.2. Enhancing contrast
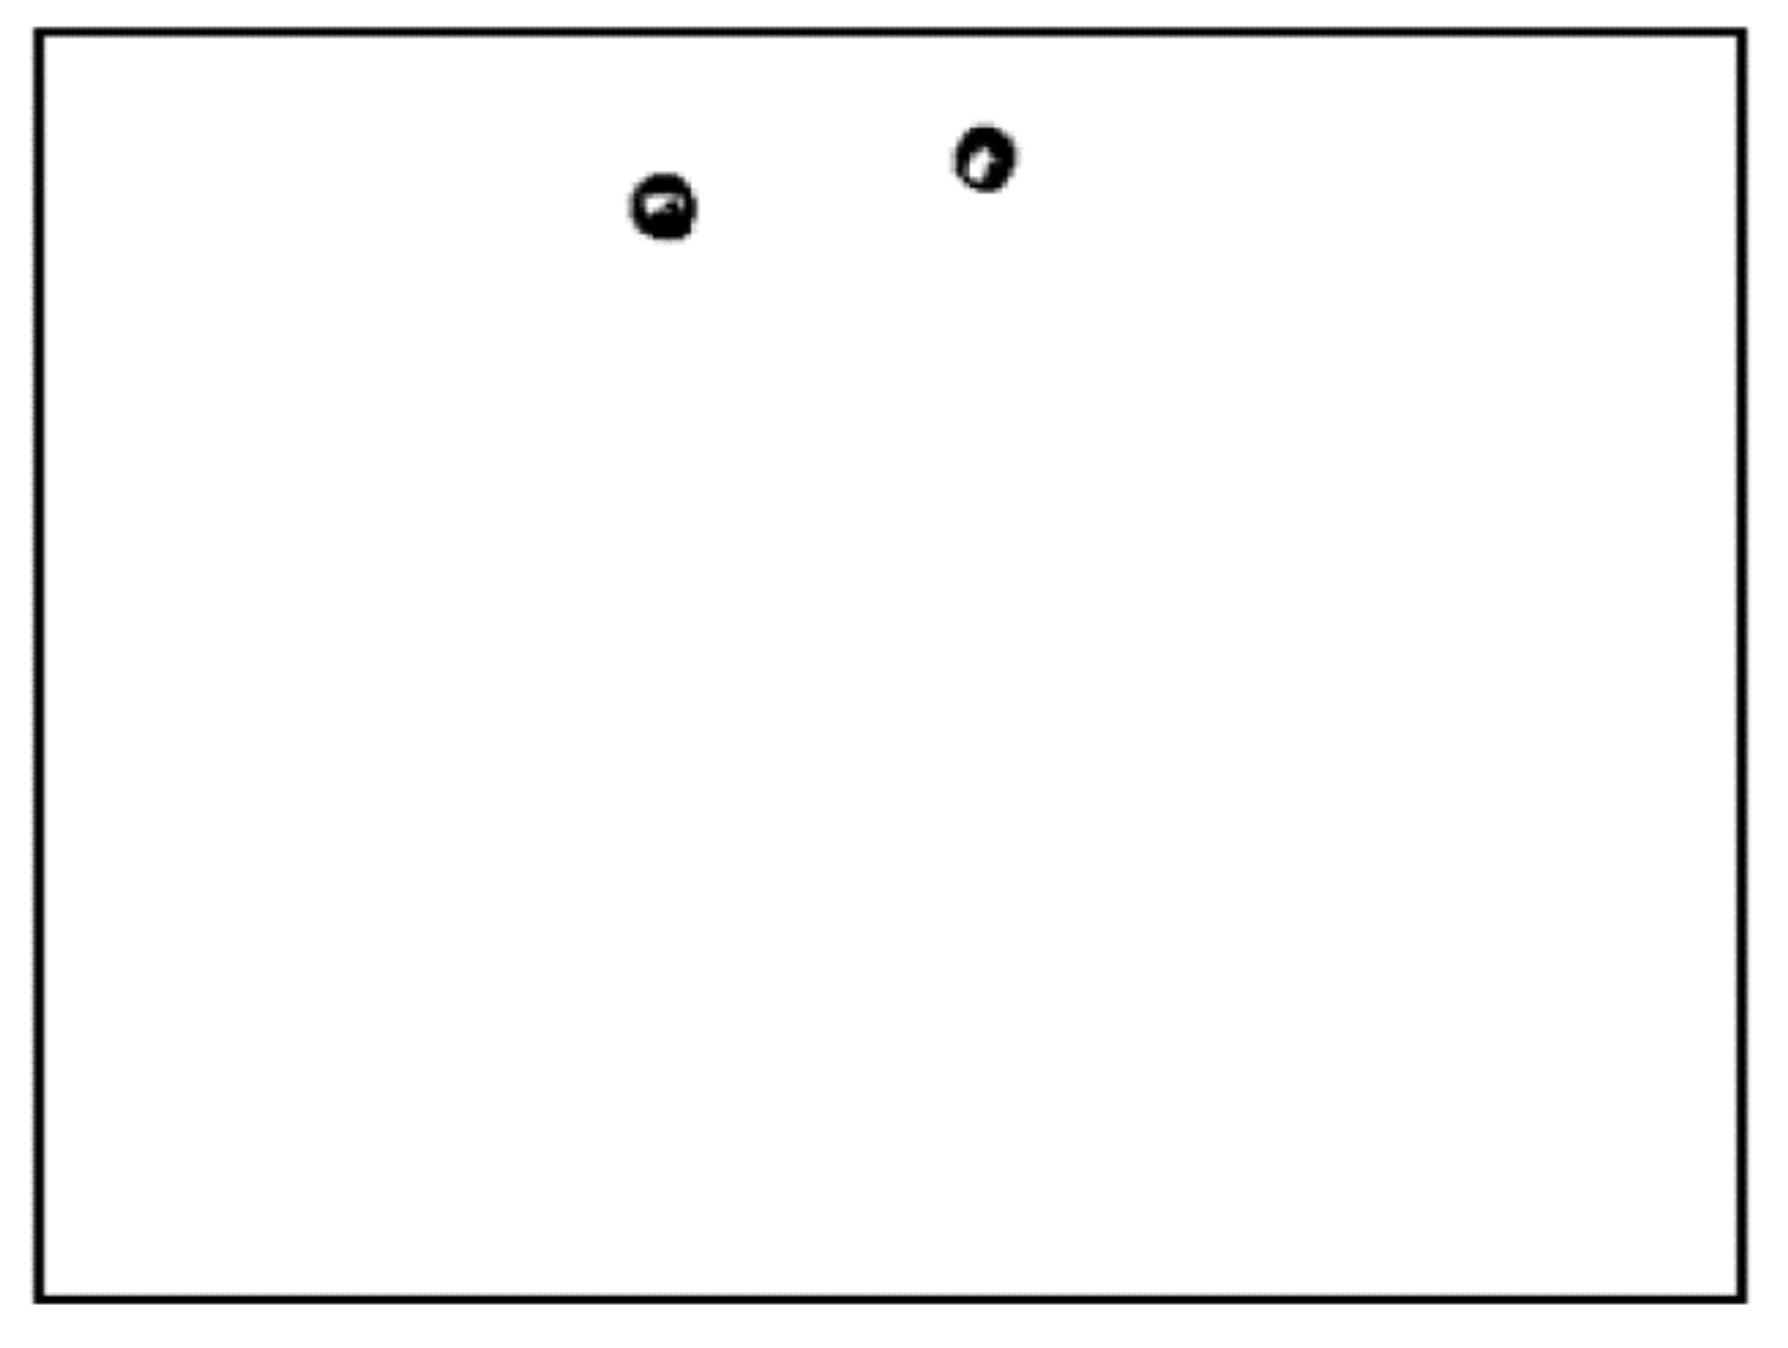
3.3.3. Binarization
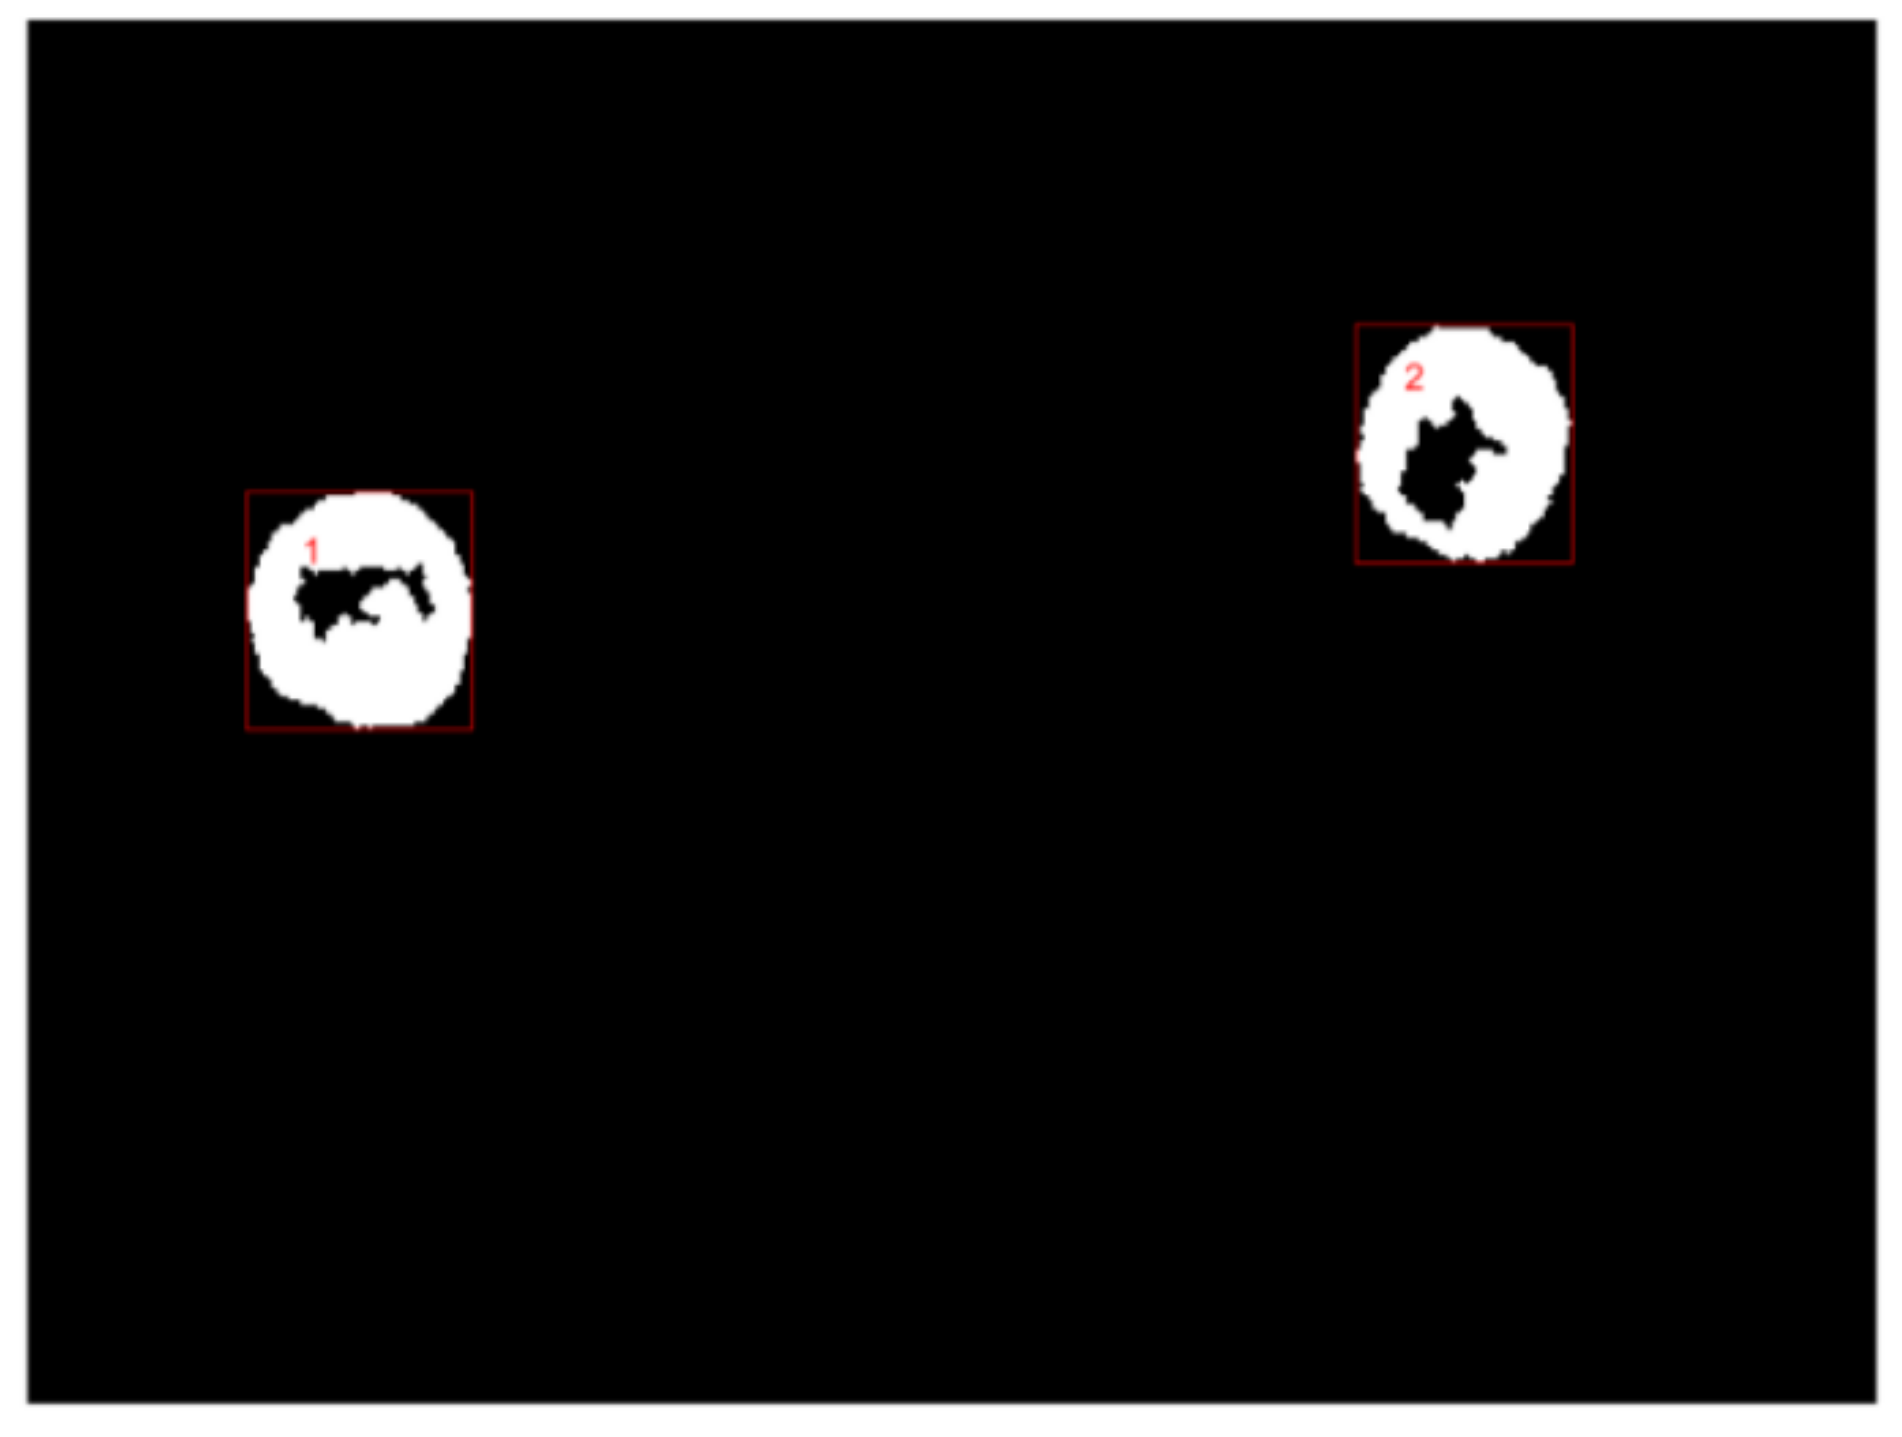
3.3.4. Post-Processing
3.3.5. Extraction of Cell Behavior
4. Results and Discussion
4.1. Self-Rotation Speed of Raji Cells under a Given AC Bias Parameter
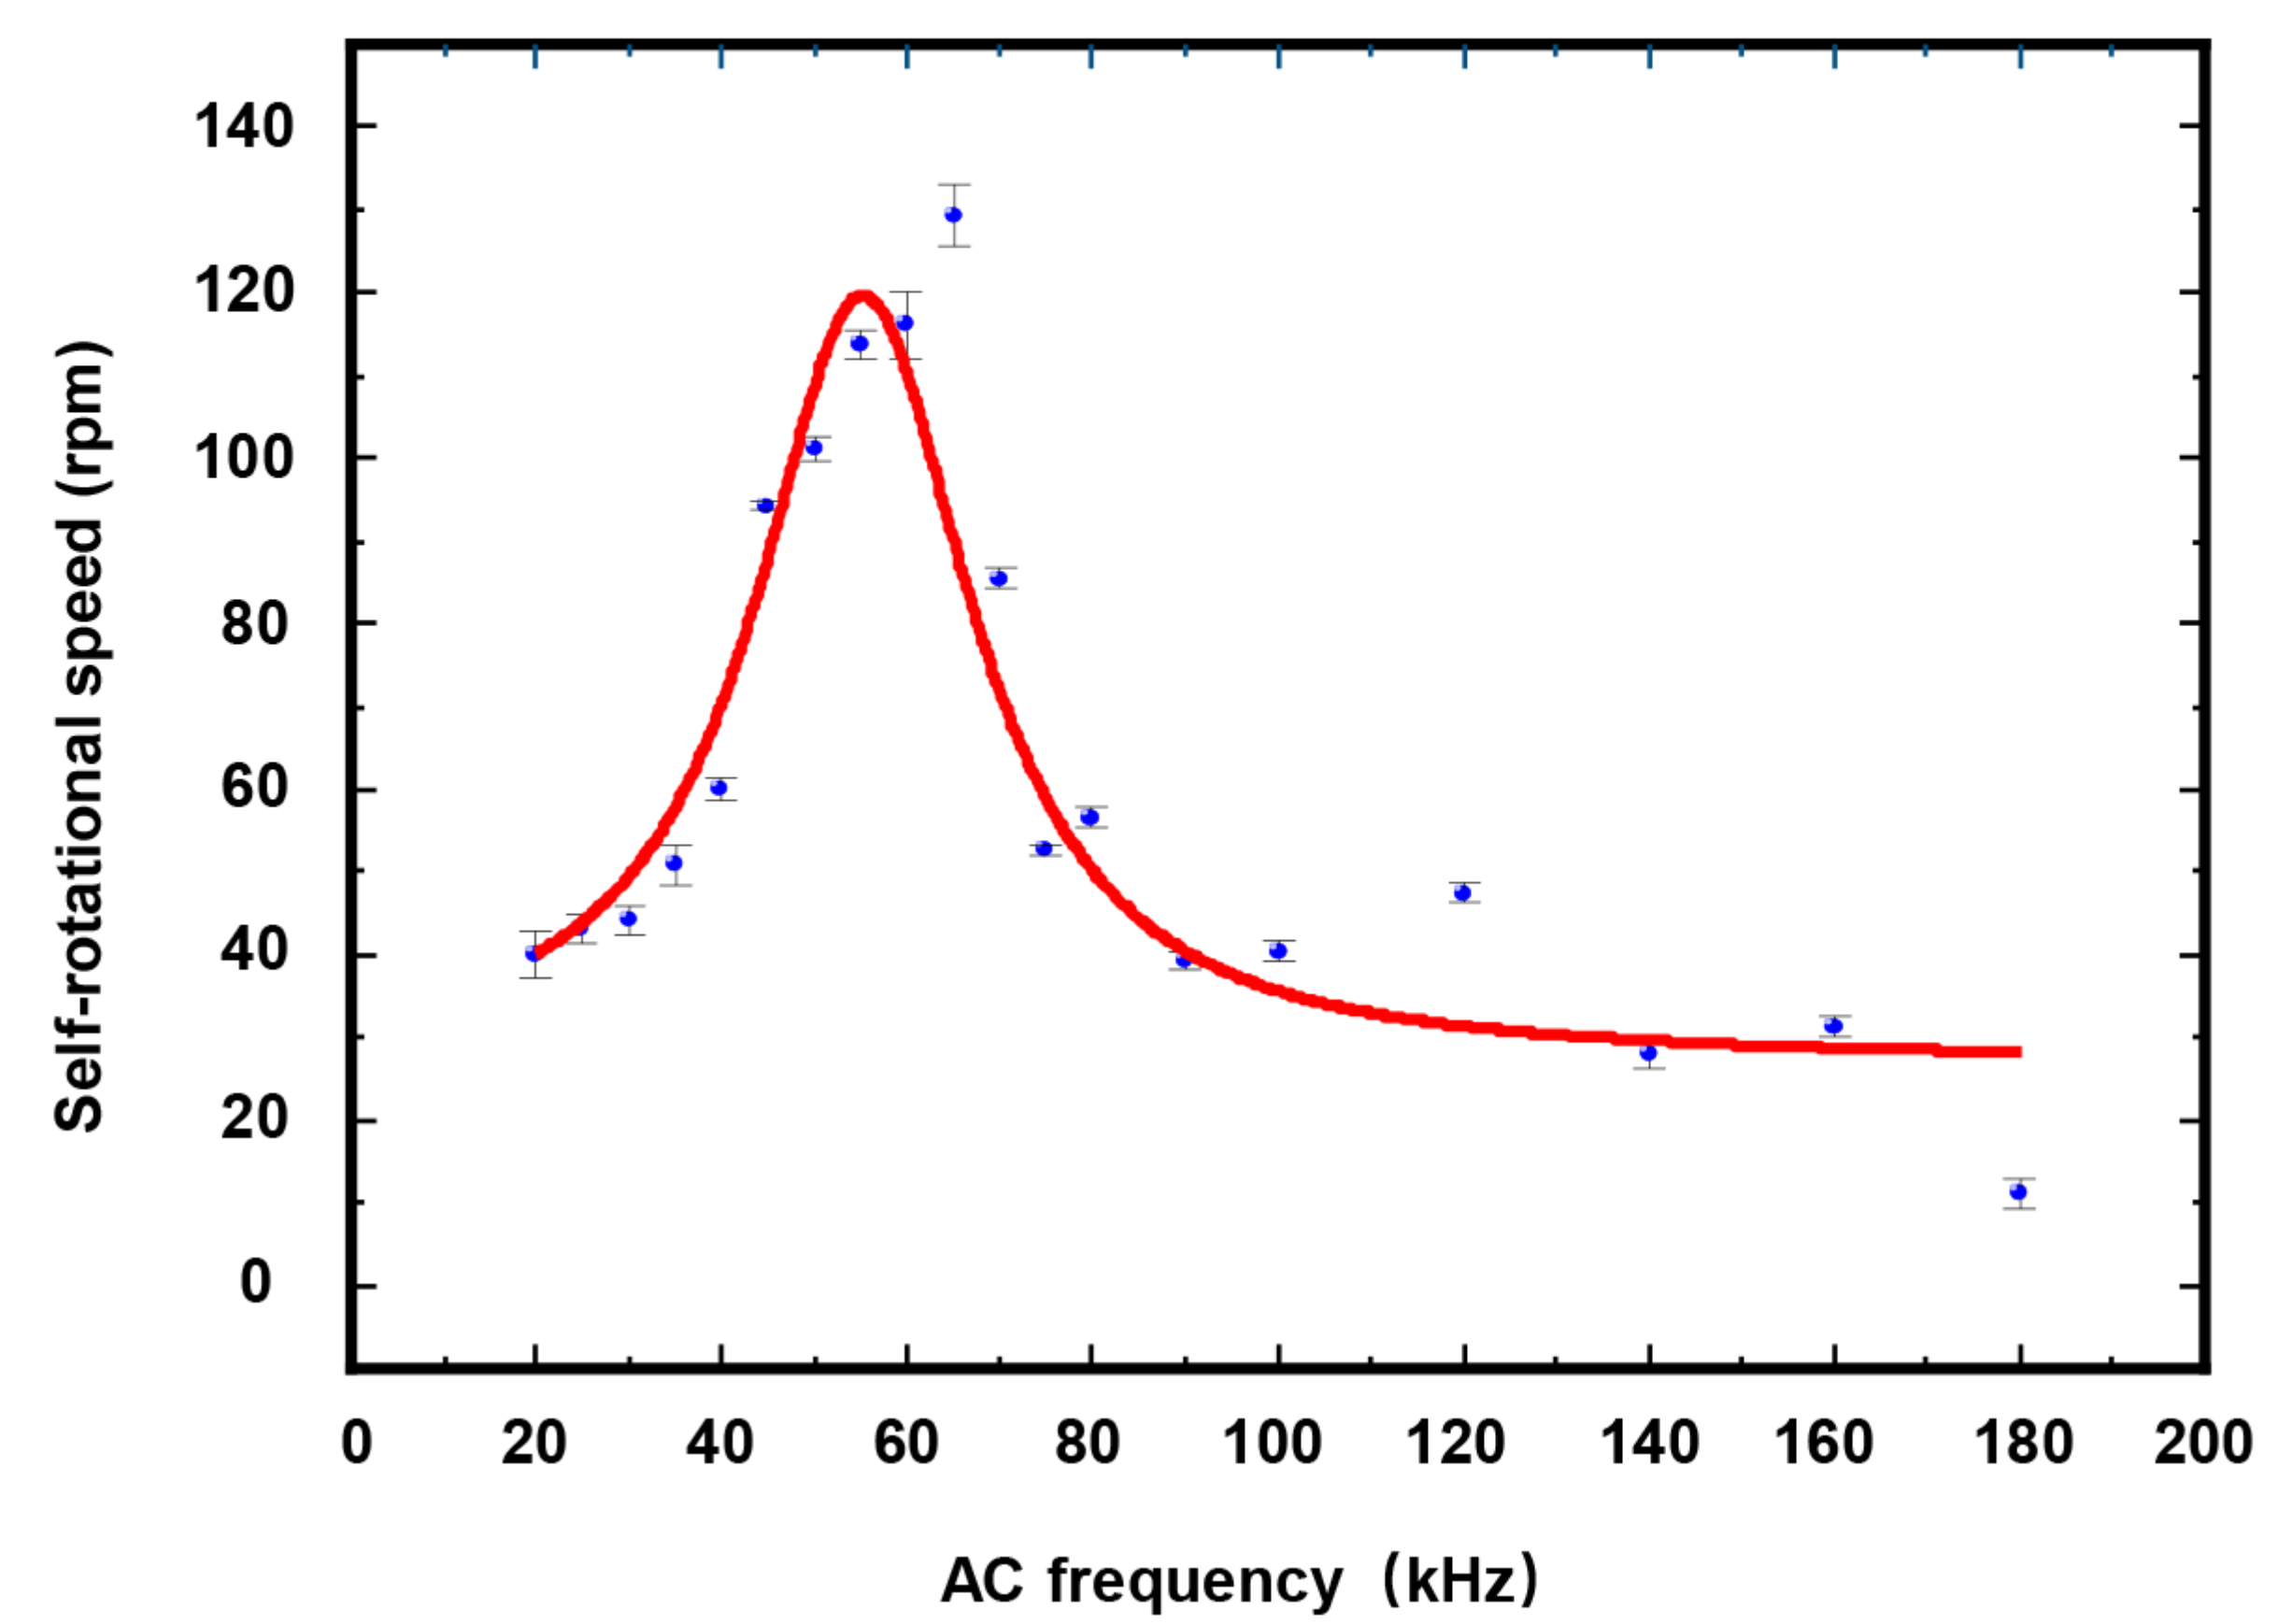
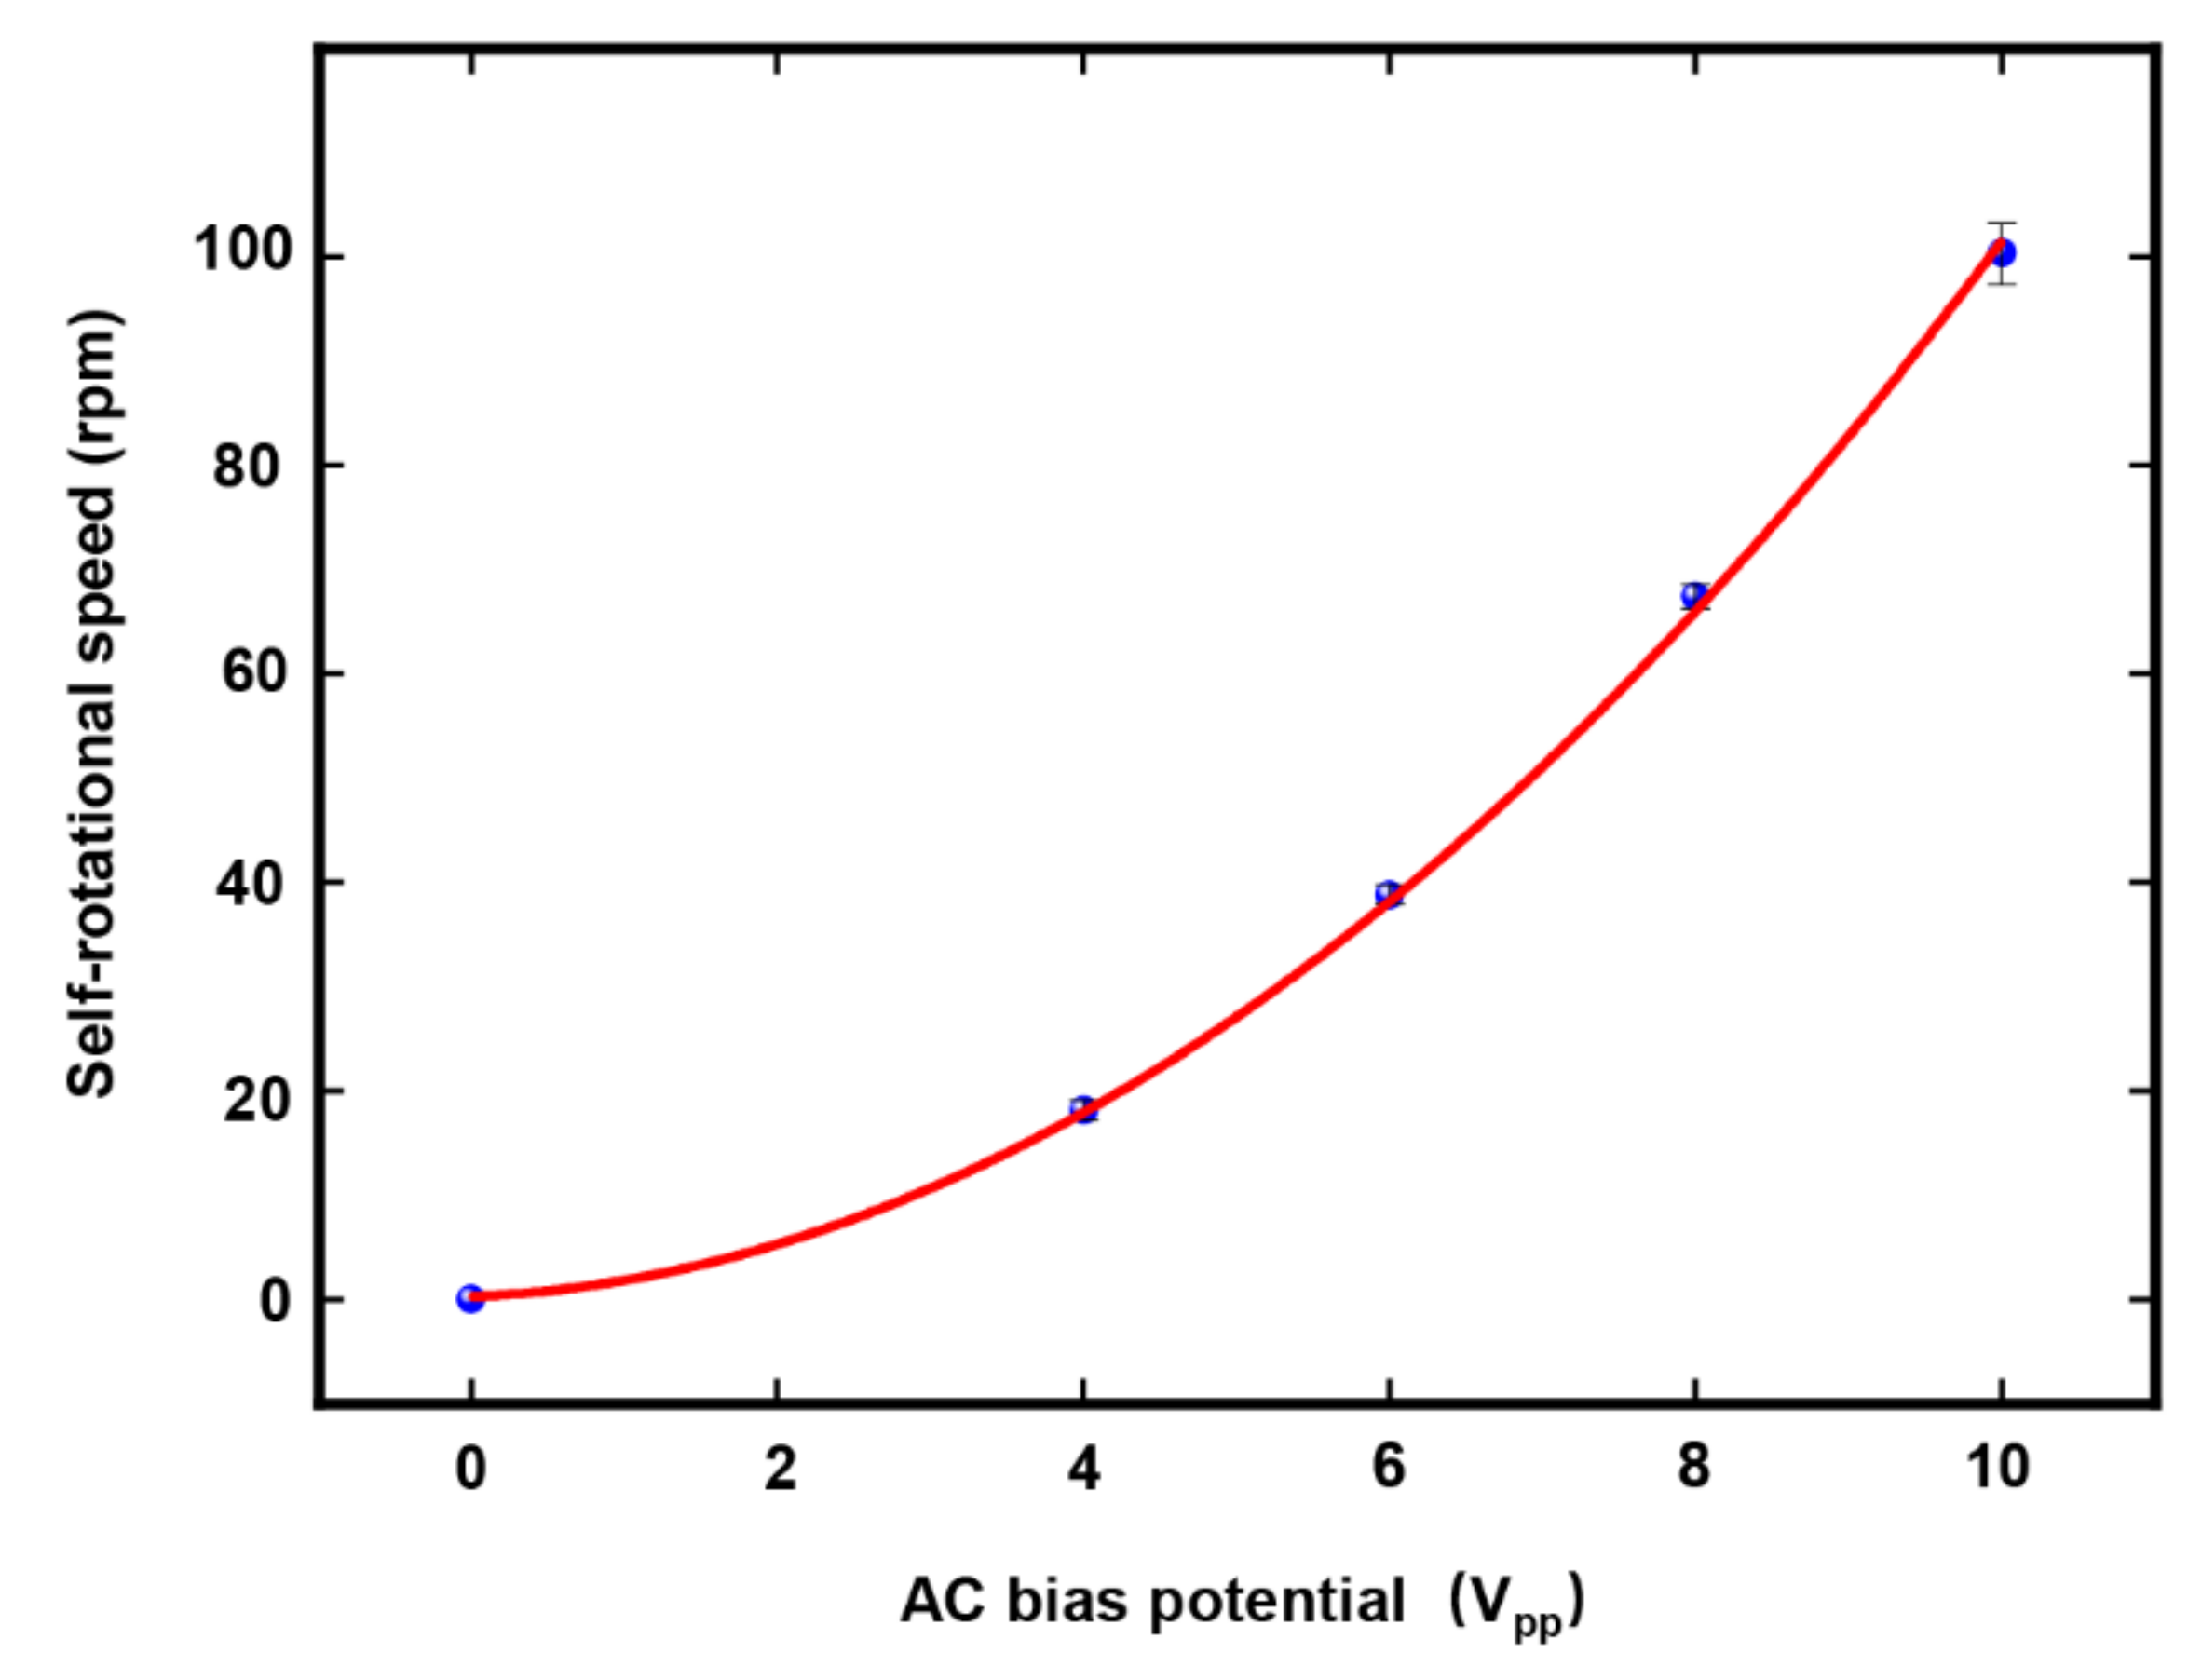
4.2. Self-Rotation Speed of Raji cells under Different AC Bias Parameters
4.3. Discussion
5. Conclusions
Author Contributions
Funding
Acknowledgments
Conflicts of Interest
References
- Kanehisa, M. Toward understanding the origin and evolution of cellular organisms. Protein Sci. 2019, 28, 1947–1951. [Google Scholar] [CrossRef] [PubMed]
- Cohen, M.C.; Cohen, S. Cytokine Function: A Study in Biologic Diversity. Am. J. Clin. Pathol. 1996, 105, 589–598. [Google Scholar] [CrossRef] [PubMed] [Green Version]
- De la Fuente, I.M.; López, J.I. Cell motility and cancer. Cancers 2020, 12, 2177. [Google Scholar] [CrossRef] [PubMed]
- Ilyas, A.; Asghar, W.; Ahmed, S.; Lotan, Y.; Hsieh, J.-T.; Kim, Y.-T.; Iqbal, S.M. Electrophysiological analysis of biopsy samples using elasticity as an inherent cell marker for cancer detection. Anal. Methods 2014, 6, 7166–7174. [Google Scholar] [CrossRef]
- Cadwell, C.R.; Scala, F.; Li, S.; Livrizzi, G.; Shen, S.; Sandberg, R.; Jiang, X.; Tolias, A.S. Multimodal profiling of single-cell morphology, electrophysiology, and gene expression using Patch-seq. Nat. Protoc. 2017, 12, 2531–2553. [Google Scholar] [CrossRef] [PubMed]
- Mitchison, J.M.; Swann, M.M. The mechanical properties of the cell surface. J. Exp. Biol. 1954, 31, 443–460. [Google Scholar] [CrossRef]
- Wu, P.H.; Aroush, D.R.B.; Asnacios, A.; Chen, W.C.; Dokukin, M.E.; Doss, B.L.; Durand, P.; Ekpenyong, A.; Guck, J.; Guz, N.V.; et al. Comparative study of cell mechanics methods. Nat. Methods 2018, 15, 491. [Google Scholar] [CrossRef]
- Basoli, F.; Giannitelli, S.M.; Gori, M.; Mozetic, P.; Bonfanti, A.; Trombetta, M.; Rainer, A. Biomechanical characterization at the cell scale: Present and prospects. Front. Physiol. 2018, 9, 1449. [Google Scholar] [CrossRef]
- Montell, D.J. Morphogenetic cell movements: Diversity from modular mechanical properties. Science 2008, 322, 1502–1505. [Google Scholar] [CrossRef]
- Ford, J. Red blood cell morphology. Int. J. Lab. Hematol. 2013, 35, 351–357. [Google Scholar] [CrossRef]
- Bukoreshtliev, N.V.; Haase, K.; Pelling, A.E. Mechanical cues in cellular signalling and communication. Cell Tissue Res. 2012, 352, 77–94. [Google Scholar] [CrossRef] [PubMed]
- Butcher, D.T.; Alliston, T.; Weaver, V.M. A tense situation: Forcing tumour progression. Nat. Rev. Cancer 2009, 9, 108–122. [Google Scholar] [CrossRef] [PubMed]
- Zhao, X.; Jin, L.; Shi, H.; Tong, W.; Gorin, D.; Kotelevtsev, Y.; Mao, Z. Recent advances of designing dynamic surfaces to regulate cell adhesion. Colloids Interface Sci. Commun. 2020, 35, 100249. [Google Scholar] [CrossRef]
- Katira, P.; Zaman, M.H.; Bonnecaze, R.T. How changes in cell mechanical properties induce cancerous behavior. Phys. Rev. Lett. 2012, 108, 028103. [Google Scholar] [CrossRef] [PubMed] [Green Version]
- Darling, E.M.; Di Carlo, D. High-Throughput assessment of cellular mechanical properties. Annu. Rev. Biomed. Eng. 2015, 17, 35–62. [Google Scholar] [CrossRef] [PubMed]
- Laurell, T.; Petersson, F.; Nilsson, A. Chip integrated strategies for acoustic separation and manipulation of cells and particles. Chem. Soc. Rev. 2007, 36, 492–506. [Google Scholar] [CrossRef] [PubMed]
- Zhang, Y.; Zhao, J.; Yu, H.; Li, P.; Liang, W.; Liu, Z.; Lee, G.-B.; Liu, L.; Li, W.J.; Wang, Z. Detection and isolation of free cancer cells from ascites and peritoneal lavages using optically induced electrokinetics (OEK). Sci. Adv. 2020, 6, eaba9628. [Google Scholar] [CrossRef]
- Ozkan, M.; Wang, M.; Ozkan, C.; Flynn, R.; Esener, S. Optical manipulation of objects and biological cells in microfluidic devices. Biomed. Microdevices 2003, 5, 61–67. [Google Scholar] [CrossRef]
- Stevenson, D.J.; Gunn-Moore, F.; Dholakia, K. Light forces the pace: Optical manipulation for biophotonics. J. Biomed. Opt. 2010, 15, 041503. [Google Scholar] [CrossRef]
- Guo, F.; Mao, Z.; Chen, Y.; Xie, Z.; Lata, J.P.; Li, P.; Ren, L.; Liu, J.; Yang, J.; Dao, M.; et al. Three-dimensional manipulation of single cells using surface acoustic waves. Proc. Natl. Acad. Sci. USA 2016, 113, 1522–1527. [Google Scholar] [CrossRef] [Green Version]
- Ahmed, D.; Ozcelik, A.; Bojanala, N.; Nama, N.; Upadhyay, A.; Chen, Y.; Hanna-Rose, W.; Huang, T.J. Rotational manipulation of single cells and organisms using acoustic waves. Nat. Commun. 2016, 7, 11085. [Google Scholar] [CrossRef] [PubMed]
- Yi, C.; Li, C.-W.; Ji, S.; Yang, M. Microfluidics technology for manipulation and analysis of biological cells. Anal. Chim. Acta 2006, 560, 1–23. [Google Scholar] [CrossRef]
- Takahashi, Y.; Miyata, S. Continuous ES/Feeder cell-sorting device using dielectrophoresis and controlled fluid flow. Micromachines 2020, 11, 734. [Google Scholar] [CrossRef] [PubMed]
- Zhang, Z.; Zheng, T.; Zhu, R. Characterization of single-cell biophysical properties and cell type classification using dielectrophoresis model reduction method. Sens. Actuators B Chem. 2019, 304, 127326. [Google Scholar] [CrossRef]
- Nie, X.; Luo, Y.; Shen, P.; Han, C.; Yu, D.; Xing, X. High-throughput dielectrophoretic cell sorting assisted by cell sliding on scalable electrode tracks made of conducting-PDMS. Sens. Actuators B Chem. 2020, 327, 128873. [Google Scholar] [CrossRef]
- Chiou, P.Y.; Chang, Z.; Wu, M.C. A novel optoelectronic tweezer using light induced dielectrophoresis. In Proceedings of the 2003 IEEE/LEOS International Conference on Optical MEMS, Waikoloa, HI, USA, 18–21 August 2003; pp. 8–9. [Google Scholar]
- Liang, W.; Zhang, K.; Yang, X.; Liu, L.; Yu, H.; Zhang, W. Distinctive translational and self-rotational motion of lymphoma cells in an optically induced non-rotational alternating current electric field. Biomicrofluidics 2015, 9, 014121. [Google Scholar] [CrossRef] [Green Version]
- Liang, W.; Liu, L.; Zhang, H.; Wang, Y.; Li, W.J. Optoelectrokinetics-based microfluidic platform for bioapplications: A review of recent advances. Biomicrofluidics 2019, 13, 051502. [Google Scholar] [CrossRef]
- Liang, W.; Wang, S.; Dong, Z.; Lee, G.-B.; Li, W.J. Optical Spectrum and electric field waveform dependent optically-induced dielectrophoretic (ODEP) micro-manipulation. Micromachines 2012, 3, 492–508. [Google Scholar] [CrossRef] [Green Version]
- Liang, W.; Liu, L.; Wang, J.; Yang, X.; Wang, Y.; Li, W.J.; Yang, W. A Review on Optoelectrokinetics-Based Manipulation and Fabrication of Micro/Nanomaterials. Micromachines 2020, 11, 78. [Google Scholar] [CrossRef] [Green Version]
- Liang, W.; Liu, N.; Dong, Z.; Liu, L.; Mai, J.; Lee, G.-B.; Li, W.J. Simultaneous separation and concentration of micro- and nano-particles by optically induced electrokinetics. Sens. Actuators A Phys. 2013, 193, 103–111. [Google Scholar] [CrossRef]
- Chau, L.-H.; Liang, W.; Cheung, F.W.K.; Liu, W.K.; Li, W.J.; Chen, S.-C.; Lee, G.-B. Self-Rotation of cells in an irrotational AC E-Field in an Opto-Electrokinetics Chip. PLoS ONE 2013, 8, e51577. [Google Scholar] [CrossRef] [PubMed] [Green Version]
- Huang, L.; Liang, F.; Feng, Y. A microfluidic chip for single-cell 3D rotation enabling self-adaptive spatial localization. J. Appl. Phys. 2019, 126, 234702. [Google Scholar] [CrossRef]
- Chau, L.H.; Ouyang, M.; Liang, W.; Lee, G.B.; Li, W.J.; Liu, W.K. Inducing self-rotation of Melan-a cells by ODEP. In Proceedings of the 2012 7th IEEE International Conference on Nano/Micro Engineered and Molecular Systems (NEMS), Kyoto, Japan, 5–8 March 2012; pp. 195–199. [Google Scholar]
- Ouyang, M.; Cheung, W.K.; Liang, W.; Mai, J.D.; Liu, W.K.; Li, W.J. Inducing self-rotation of cells with natural and artificial melanin in a linearly polarized alternating current electric field. Biomicrofluidics 2013, 7, 054112. [Google Scholar] [CrossRef] [PubMed] [Green Version]
- De Gasperis, G.; Wang, X.; Yang, J.; Becker, F.F.; Gascoyne, P.R.C. Automated electrorotation: Dielectric characterization of living cells by real-time motion estimation. Meas. Sci. Technol. 1998, 9, 518–529. [Google Scholar] [CrossRef]
- Liu, N.; Lin, Y.; Peng, Y.; Xin, L.; Yue, T.; Liu, Y.; Ru, C.; Xie, S.; Dong, L.; Pu, H.; et al. Automated Parallel Electrical Characterization of Cells Using Optically-Induced Dielectrophoresis. IEEE Trans. Autom. Sci. Eng. 2020, 17, 1084–1092. [Google Scholar] [CrossRef]
- Yang, X.; Niu, X.; Liu, Z.; Zhao, Y.; Zhang, G.; Liang, W.; Li, W.J. Accurate Extraction of the Self-Rotational Speed for Cells in an Electrokinetics Force Field by an Image Matching Algorithm. Micromachines 2017, 8, 282. [Google Scholar] [CrossRef] [Green Version]
- Liang, W.; Wang, Y.; Zhang, H.; Liu, L. Characterization of the self-rotational motion of stored red blood cells by using optically-induced electrokinetics. Opt. Lett. 2016, 41, 2763. [Google Scholar] [CrossRef]
- Liang, W.; Zhao, Y.; Liu, L.; Wang, Y.; Li, W.J.; Lee, G.-B. Determination of Cell Membrane Capacitance and Conductance via Optically Induced Electrokinetics. Biophys. J. 2017, 113, 1531–1539. [Google Scholar] [CrossRef] [Green Version]
- Liang, W.; Yang, X.; Wang, J.; Wang, Y.; Zhang, H.; Yang, W.; Liu, L. Label-free characterization of different kinds of cells using optoelectrokinetic-based microfluidics. Opt. Lett. 2020, 45, 2454–2457. [Google Scholar] [CrossRef]
- Liang, W.; Zhao, Y.; Liu, L.; Wang, Y.; Dong, Z.; Li, W.J.; Lee, G.B.; Xiao, X.; Zhang, W. Rapid and label-free separation of Burkitt’s lymphoma cells from red blood cells by optically-induced electrokinetics. PLoS ONE 2014, 9, e90827. [Google Scholar] [CrossRef]
- Zhao, Y.; Jia, D.; Sha, X.; Zhang, G.; Li, W.J. Determination of the three-dimensional rate of cancer cell rotation in an optically-induced electrokinetics chip using an optical flow algorithm. Micromachines 2018, 9, 118. [Google Scholar] [CrossRef] [PubMed] [Green Version]
- Jones, T.B. Basic theory of dielectrophoresis and electrorotation. IEEE Comput. Graph. Appl. 2003, 22, 33–42. [Google Scholar] [CrossRef] [PubMed]
- Turcu, I. Electric field induced rotation of spheres. J. Phys. A Math. Gen. 1987, 20, 3301. [Google Scholar] [CrossRef]
- Lopez-Fuentes, L.; Oliver, G.; Massanet, S. Revisiting Image Vignetting Correction by Constrained Minimization of Log-Intensity Entropy. In International Work-Conference on Artificial Neural Networks; Springer: Cham, Switzerland, 2015; pp. 450–463. [Google Scholar] [CrossRef] [Green Version]
- Shi, Y.; Yang, J.; Wu, R. Reducing illumination based on nonlinear gamma correction. In Proceedings of the 2007 IEEE International Conference on Image Processing, San Antonio, TX, USA, 16 September–19 October 2007; Volume 1, pp. I-529–I-532. [Google Scholar]
- Otsu, N. A threshold selection method from gray-level histograms. IEEE Trans. Syst. Man Cybern. 1979, 9, 62–66. [Google Scholar] [CrossRef] [Green Version]
- Xu, X.; Xu, S.; Jin, L.; Song, E. Characteristic analysis of Otsu threshold and its applications. Pattern Recognit. Lett. 2011, 32, 956–961. [Google Scholar] [CrossRef]
- Heijmans, H.J. Connected morphological operators for binary images. Comput. Vis. Image Underst. 1999, 73, 99–120. [Google Scholar] [CrossRef] [Green Version]
- Huang, L.; Wang, W. 3D Electro-Rotation of single cells. Synth. Lect. Biomed. Eng. 2019, 14, 119p. [Google Scholar] [CrossRef]
- Tang, T.; Hosokawa, Y.; Hayakawa, T.; Tanaka, Y.; Li, W.; Li, M.; Yalikun, Y. Rotation of biological cells: Fundamentals and applications. Engineering 2021. [Google Scholar] [CrossRef]
- Läubli, N.; Shamsudhin, N.; Ahmed, D.; Nelson, B.J. Controlled three-dimensional rotation of single cells using acoustic waves. Procedia CIRP 2017, 65, 93–98. [Google Scholar] [CrossRef]
- Tang, Q.; Liang, F.; Huang, L.; Zhao, P.; Wang, W. On-chip simultaneous rotation of large-scale cells by acoustically oscillating bubble array. Biomed. Microdevices 2020, 22, 13. [Google Scholar] [CrossRef]
- Liang, W.; Yang, X.; Wang, J.; Wang, Y.; Yang, W.; Liu, L. Determination of dielectric properties of cells using AC Electrokinetic-based microfluidic platform: A review of recent advances. Micromachines 2020, 11, 513. [Google Scholar] [CrossRef] [PubMed]
- Løvmo, M.K.; Pressl, B.; Thalhammer, G.; Ritsch-Marte, M. Controlled orientation and sustained rotation of biological samples in a sono-optical microfluidic device. Lab Chip 2021, 21, 1563–1578. [Google Scholar] [CrossRef] [PubMed]


Publisher’s Note: MDPI stays neutral with regard to jurisdictional claims in published maps and institutional affiliations. |
© 2022 by the authors. Licensee MDPI, Basel, Switzerland. This article is an open access article distributed under the terms and conditions of the Creative Commons Attribution (CC BY) license (https://creativecommons.org/licenses/by/4.0/).
Share and Cite
Wu, H.; Dang, D.; Yang, X.; Wang, J.; Qi, R.; Yang, W.; Liang, W. Accurate and Automatic Extraction of Cell Self-Rotation Speed in an ODEP Field Using an Area Change Algorithm. Micromachines 2022, 13, 818. https://doi.org/10.3390/mi13060818
Wu H, Dang D, Yang X, Wang J, Qi R, Yang W, Liang W. Accurate and Automatic Extraction of Cell Self-Rotation Speed in an ODEP Field Using an Area Change Algorithm. Micromachines. 2022; 13(6):818. https://doi.org/10.3390/mi13060818
Chicago/Turabian StyleWu, Haiyang, Dan Dang, Xieliu Yang, Junhai Wang, Ruolong Qi, Wenguang Yang, and Wenfeng Liang. 2022. "Accurate and Automatic Extraction of Cell Self-Rotation Speed in an ODEP Field Using an Area Change Algorithm" Micromachines 13, no. 6: 818. https://doi.org/10.3390/mi13060818