
Uniform Tumor Spheroids on Surface-Optimized Microfluidic Biochips for Reproducible Drug Screening and Personalized Medicine

 , ,
, ,  , and
, and 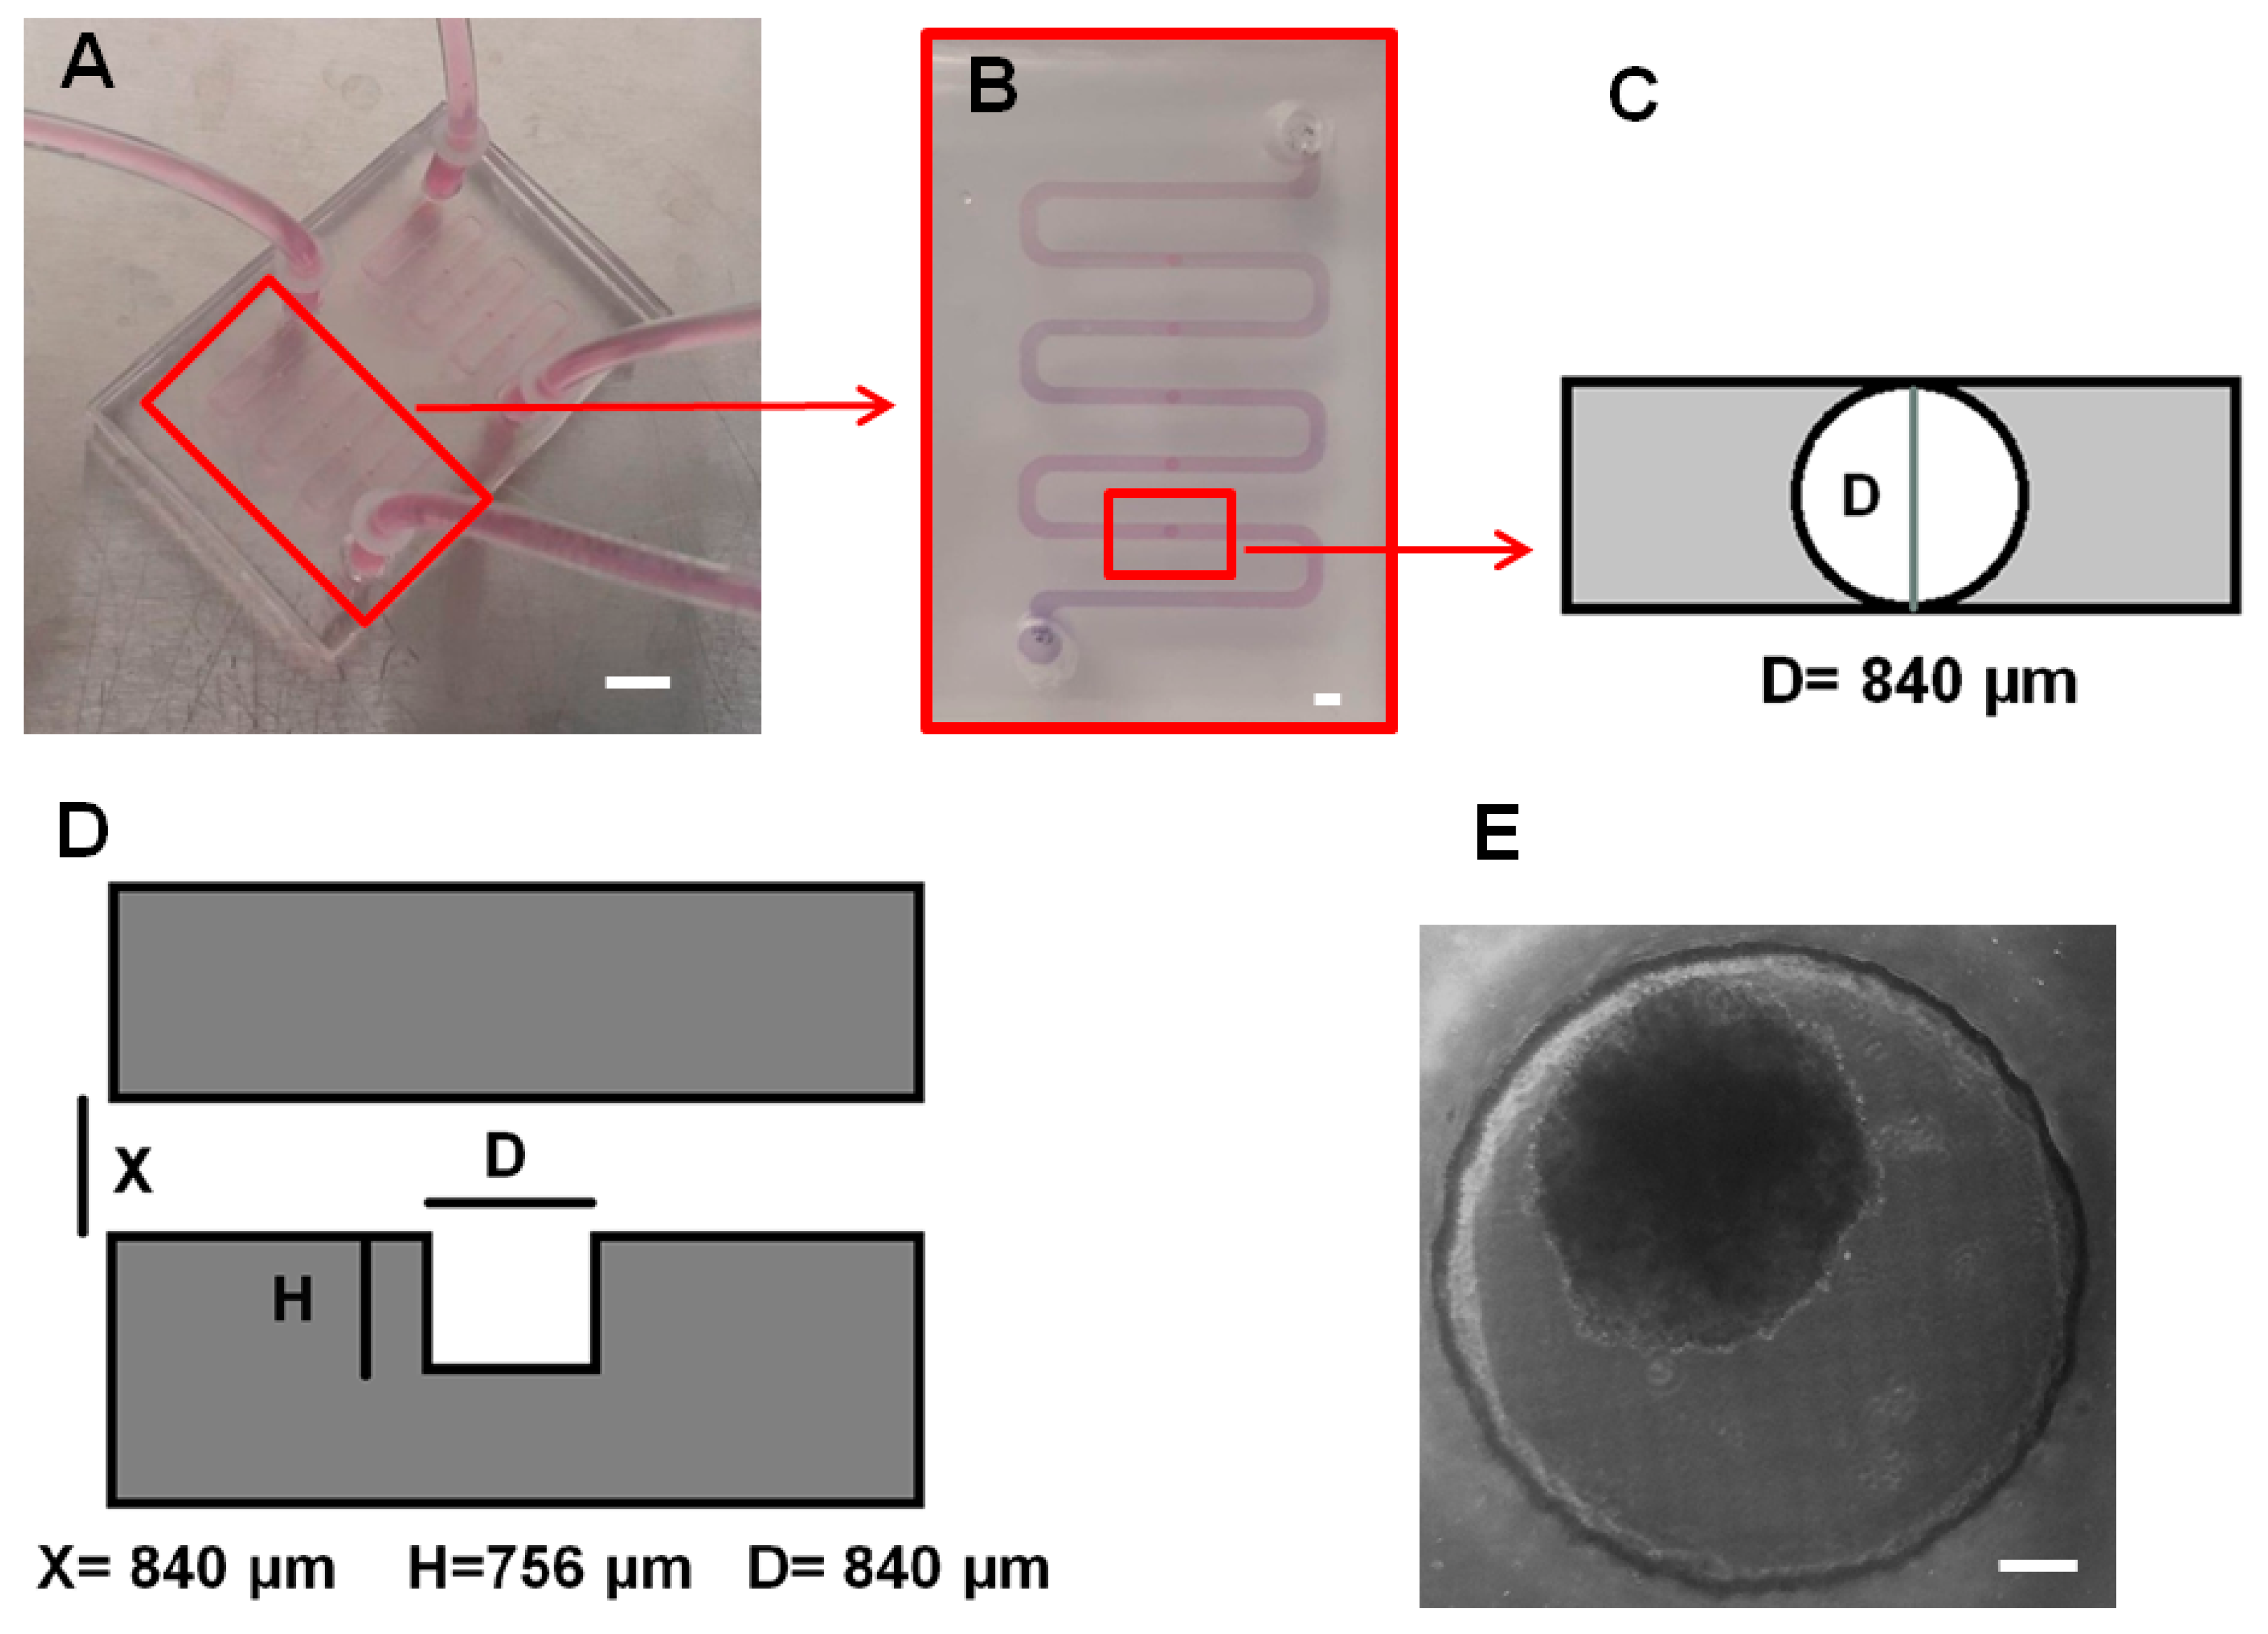
Abstract
:1. Introduction
2. Materials and Methodology
2.1. Fabrication and Surface Treatment of Microfluidic Biochips
2.2. 2D Cell Culture and On-Chip Spheroid Formation
2.2.1. Preparation of Cell Lines and Patient-Derived Cells
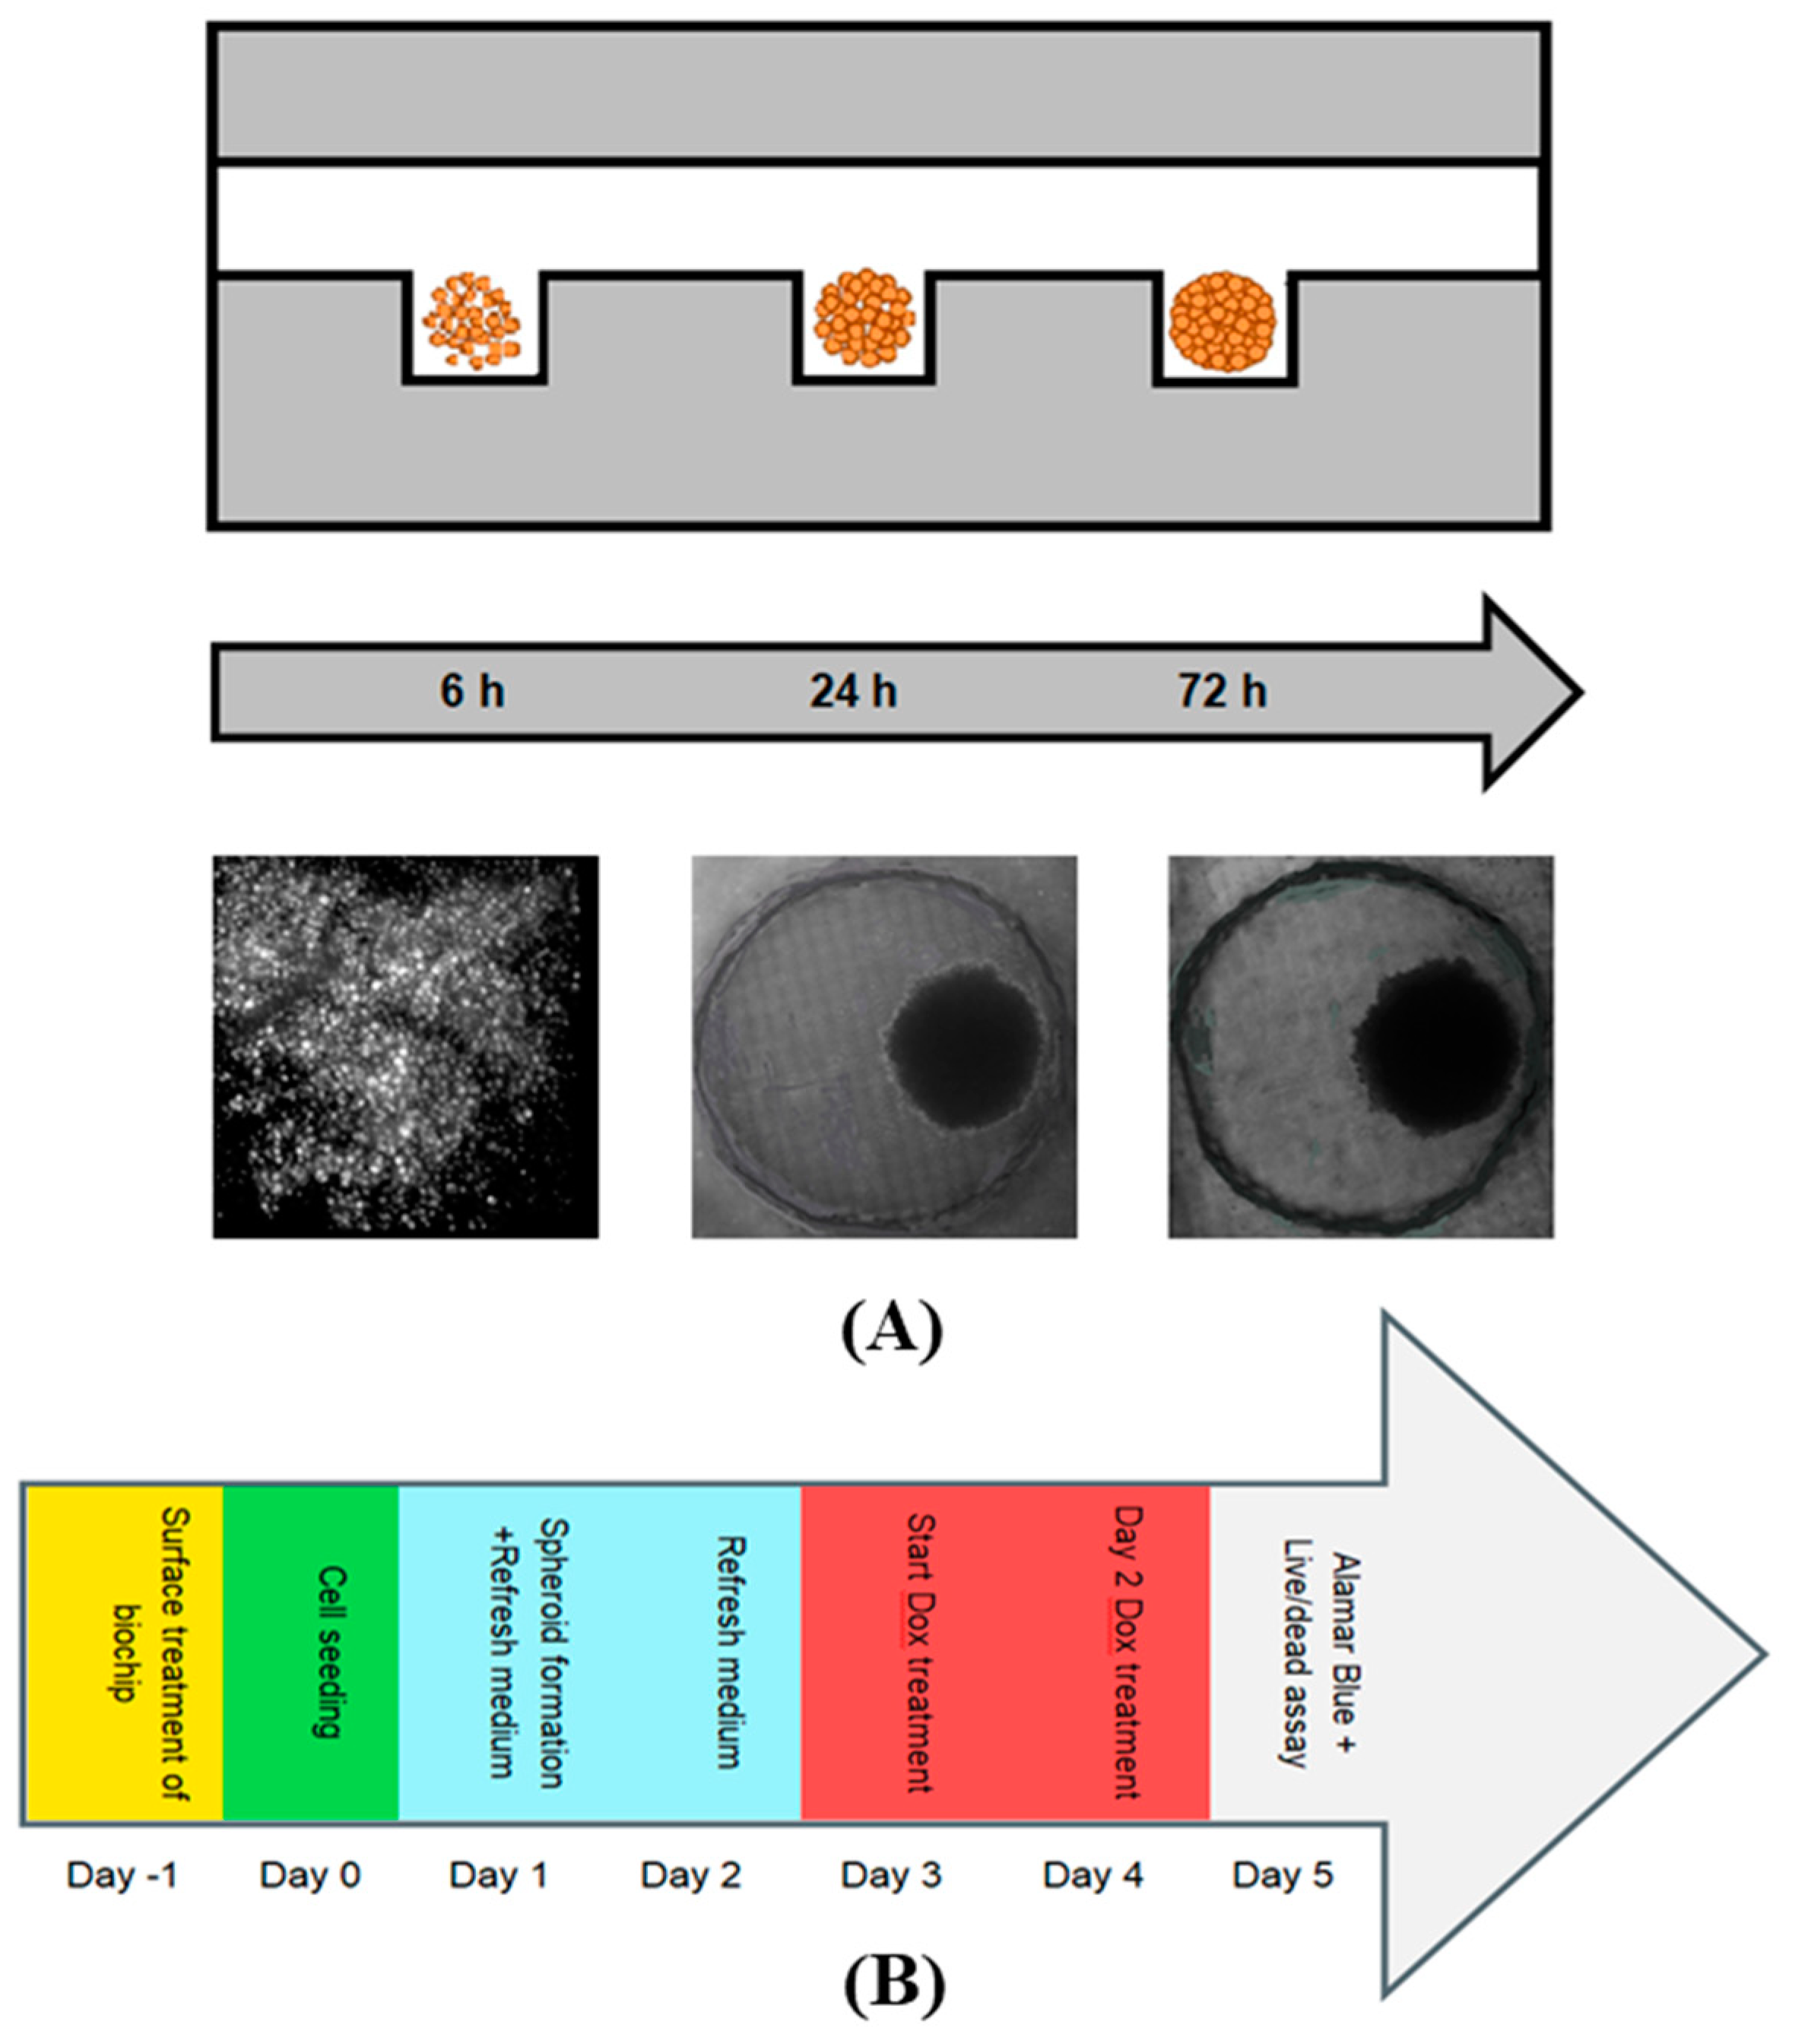
2.2.2. Construction of MCTSs on the Biochips
2.2.3. 2D Cell Culture
2.2.4. Cells/Spheroids Microscopic Monitoring
2.3. Drug Testing Evaluation
2.3.1. Metabolic Activity and Proliferation Assay Post-Drug Treatment
2.3.2. Differential Staining
2.4. Statistical Analysis
3. Results and Discussion
3.1. Biochip Fabrication and Surface Treatment
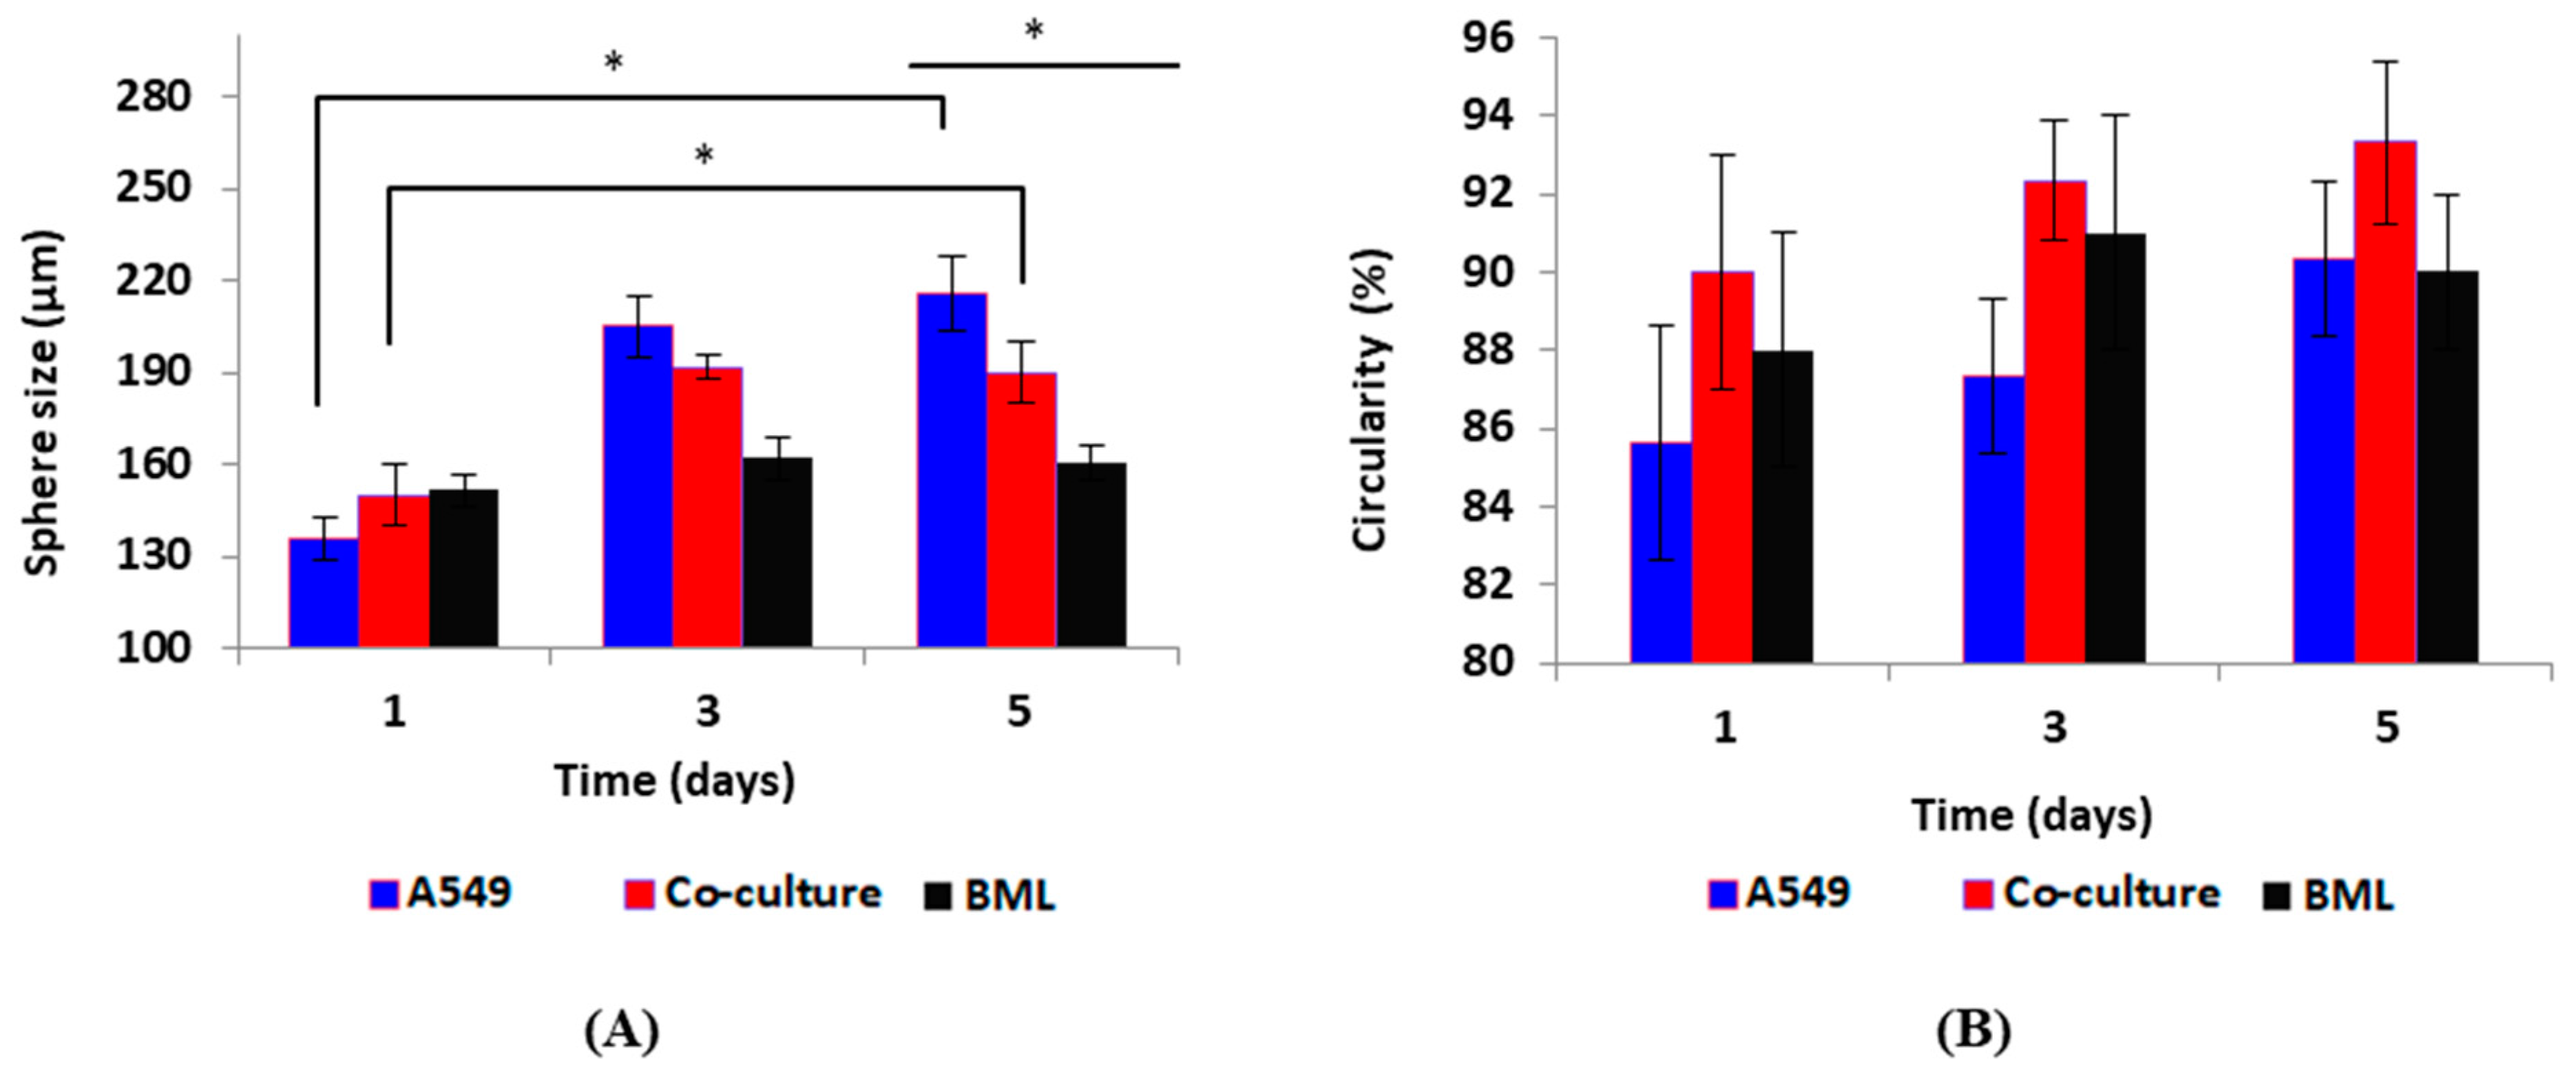
3.2. Cell Culture and Spheroid Formation Experiments
3.2.1. Spheroid Formation on Biochips and Drug Test
3.2.2. 2D Culture Model as Compared with 3D MCTSs
3.3. Drug Testing Evaluation
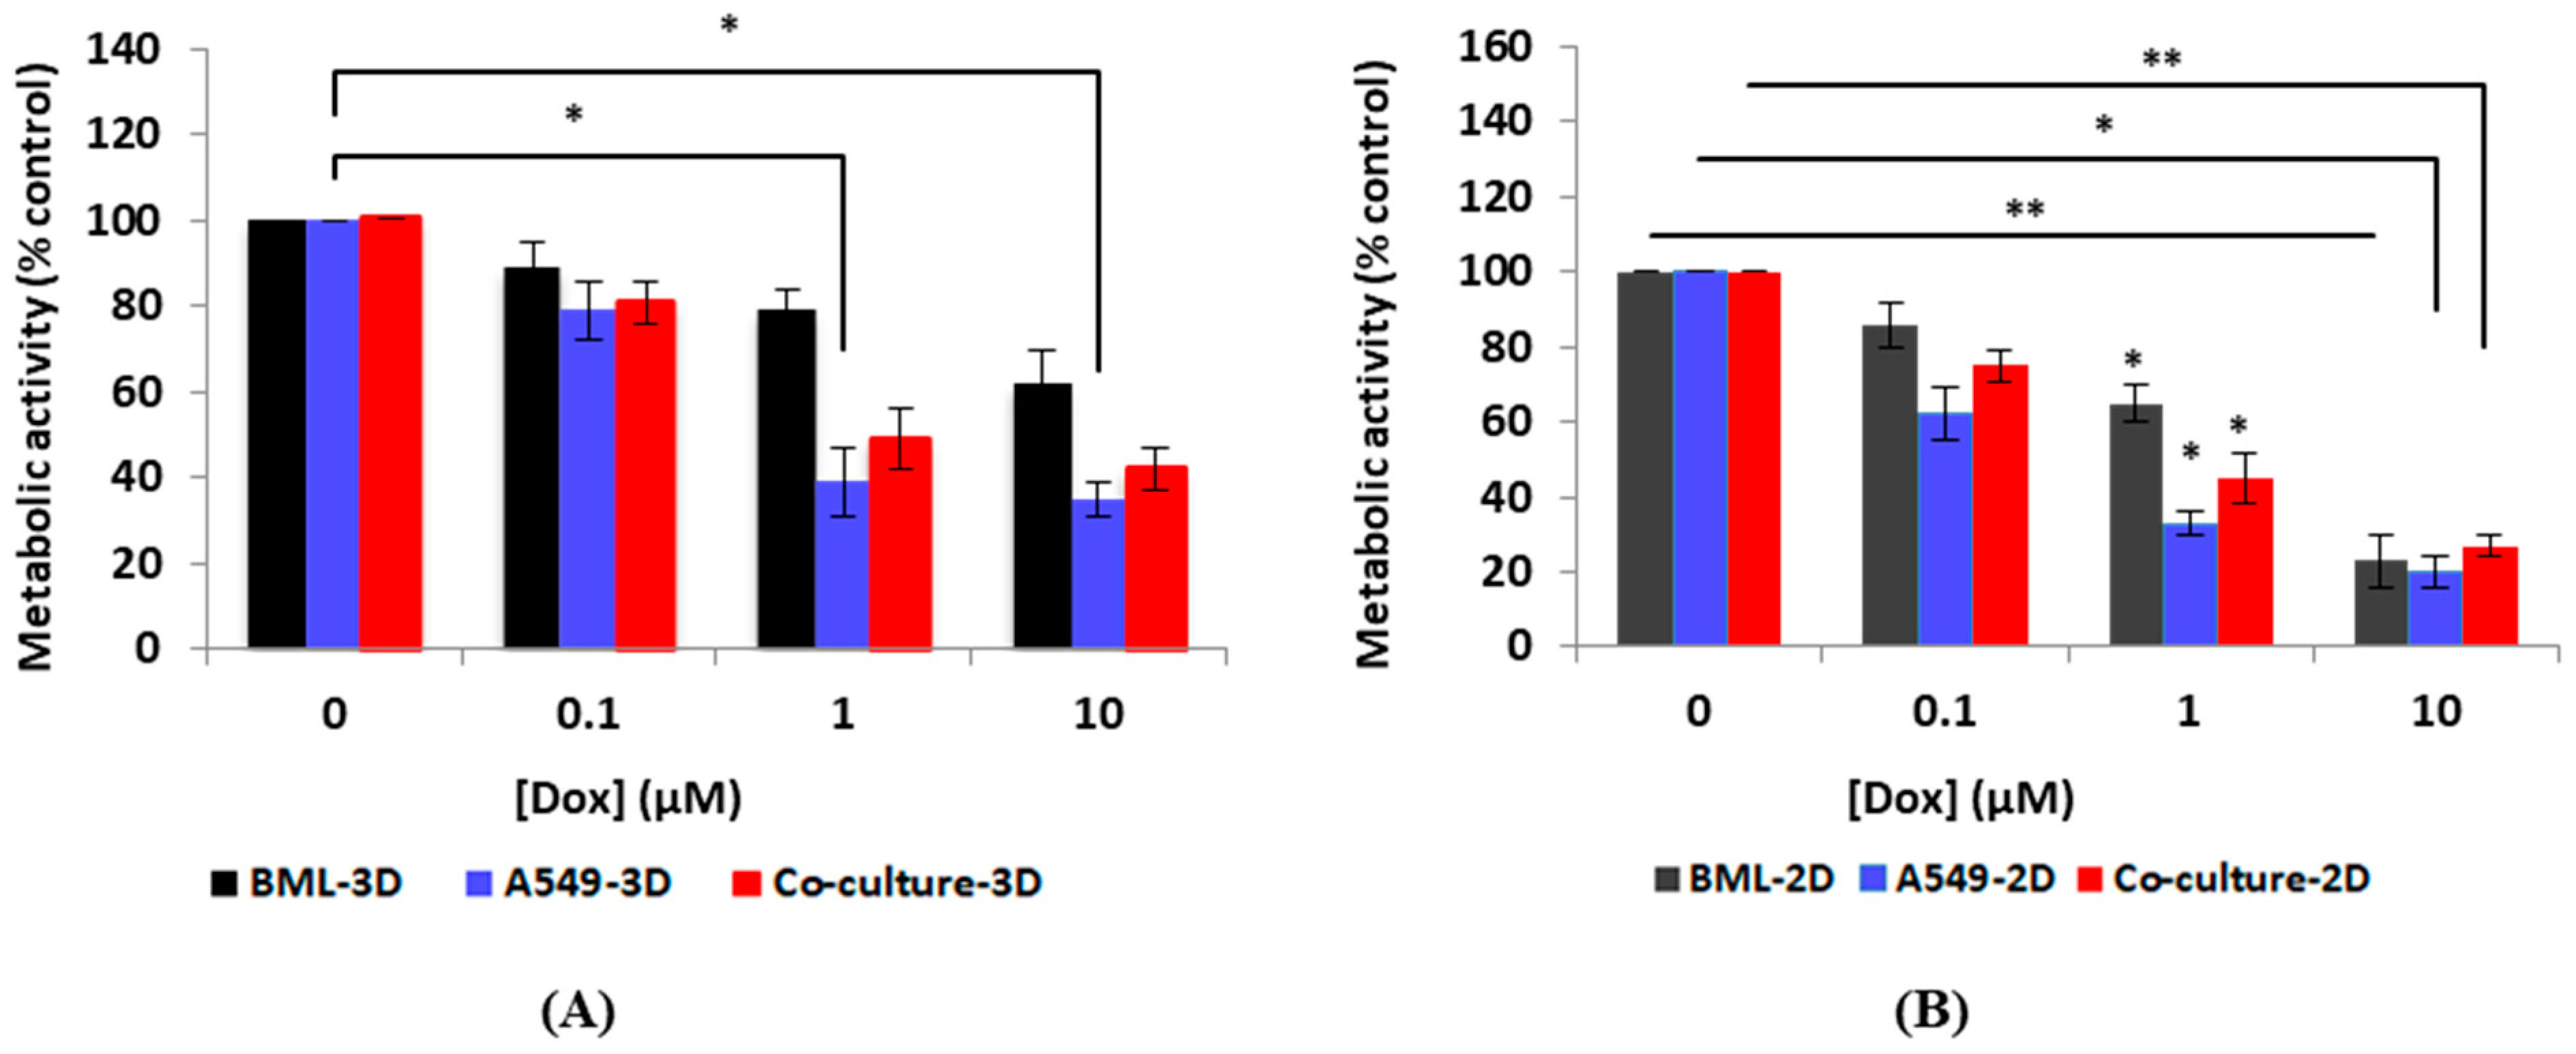
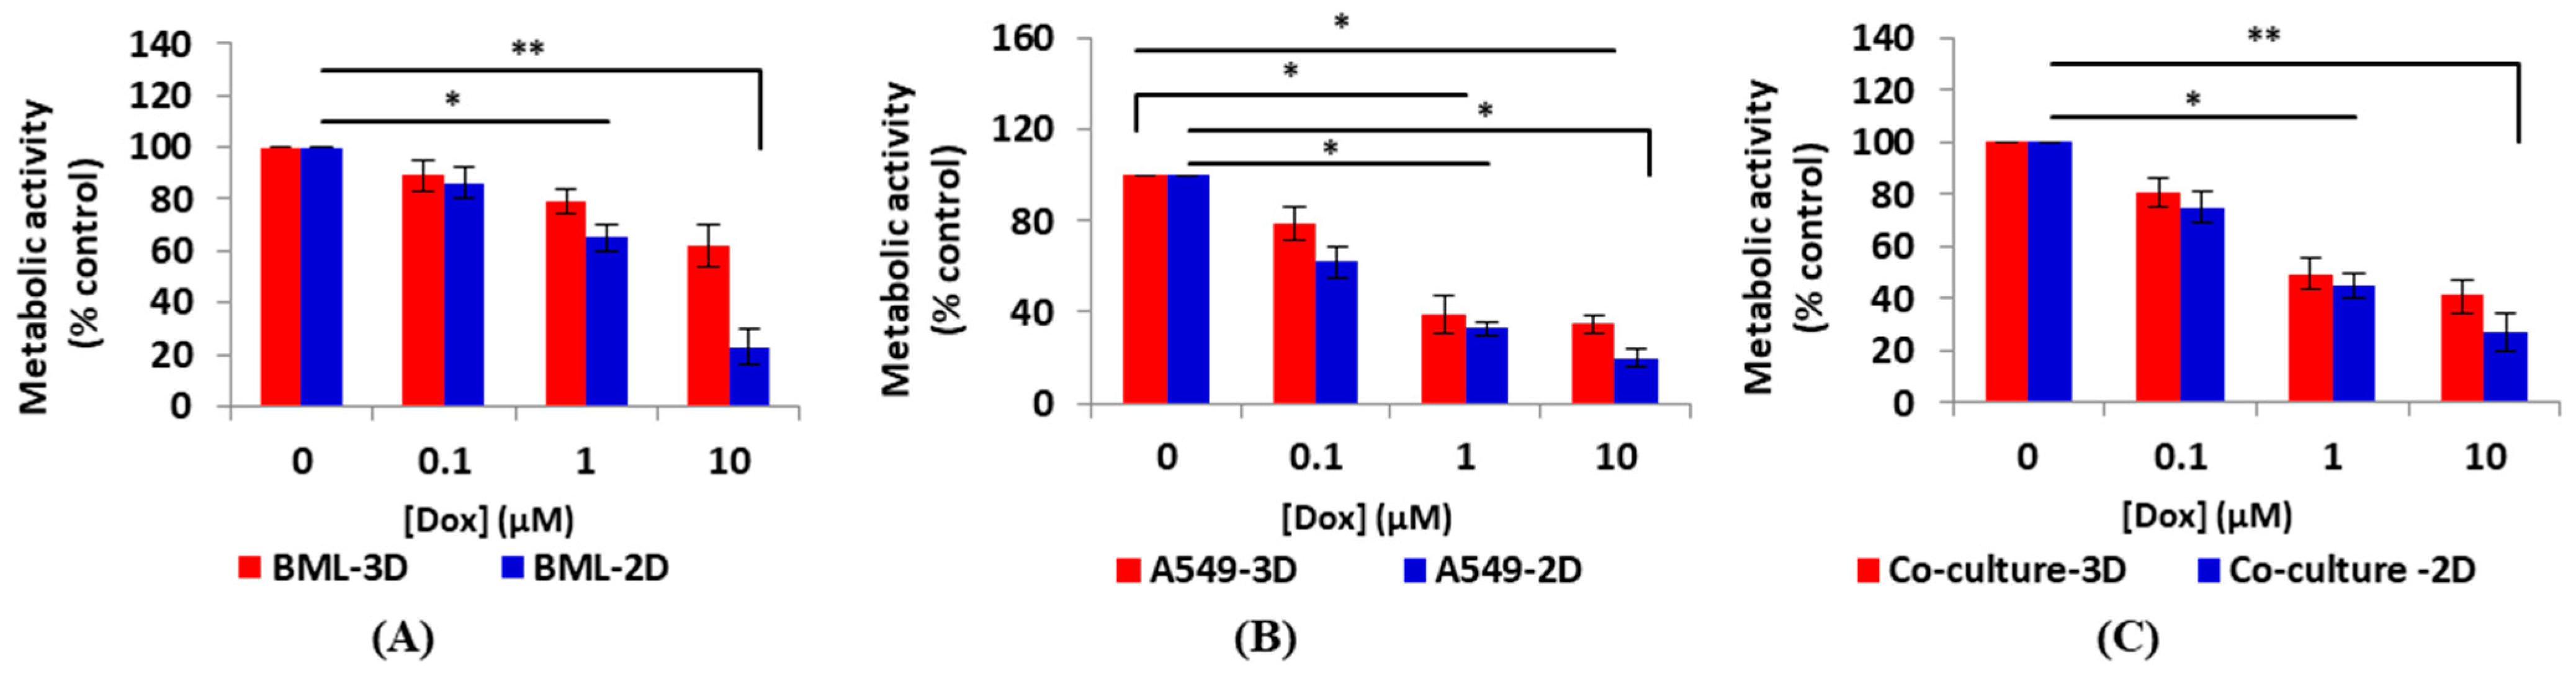
3.3.1. Metabolic Activity Testing Post-Drug Treatment Using the Alamar Blue Assay
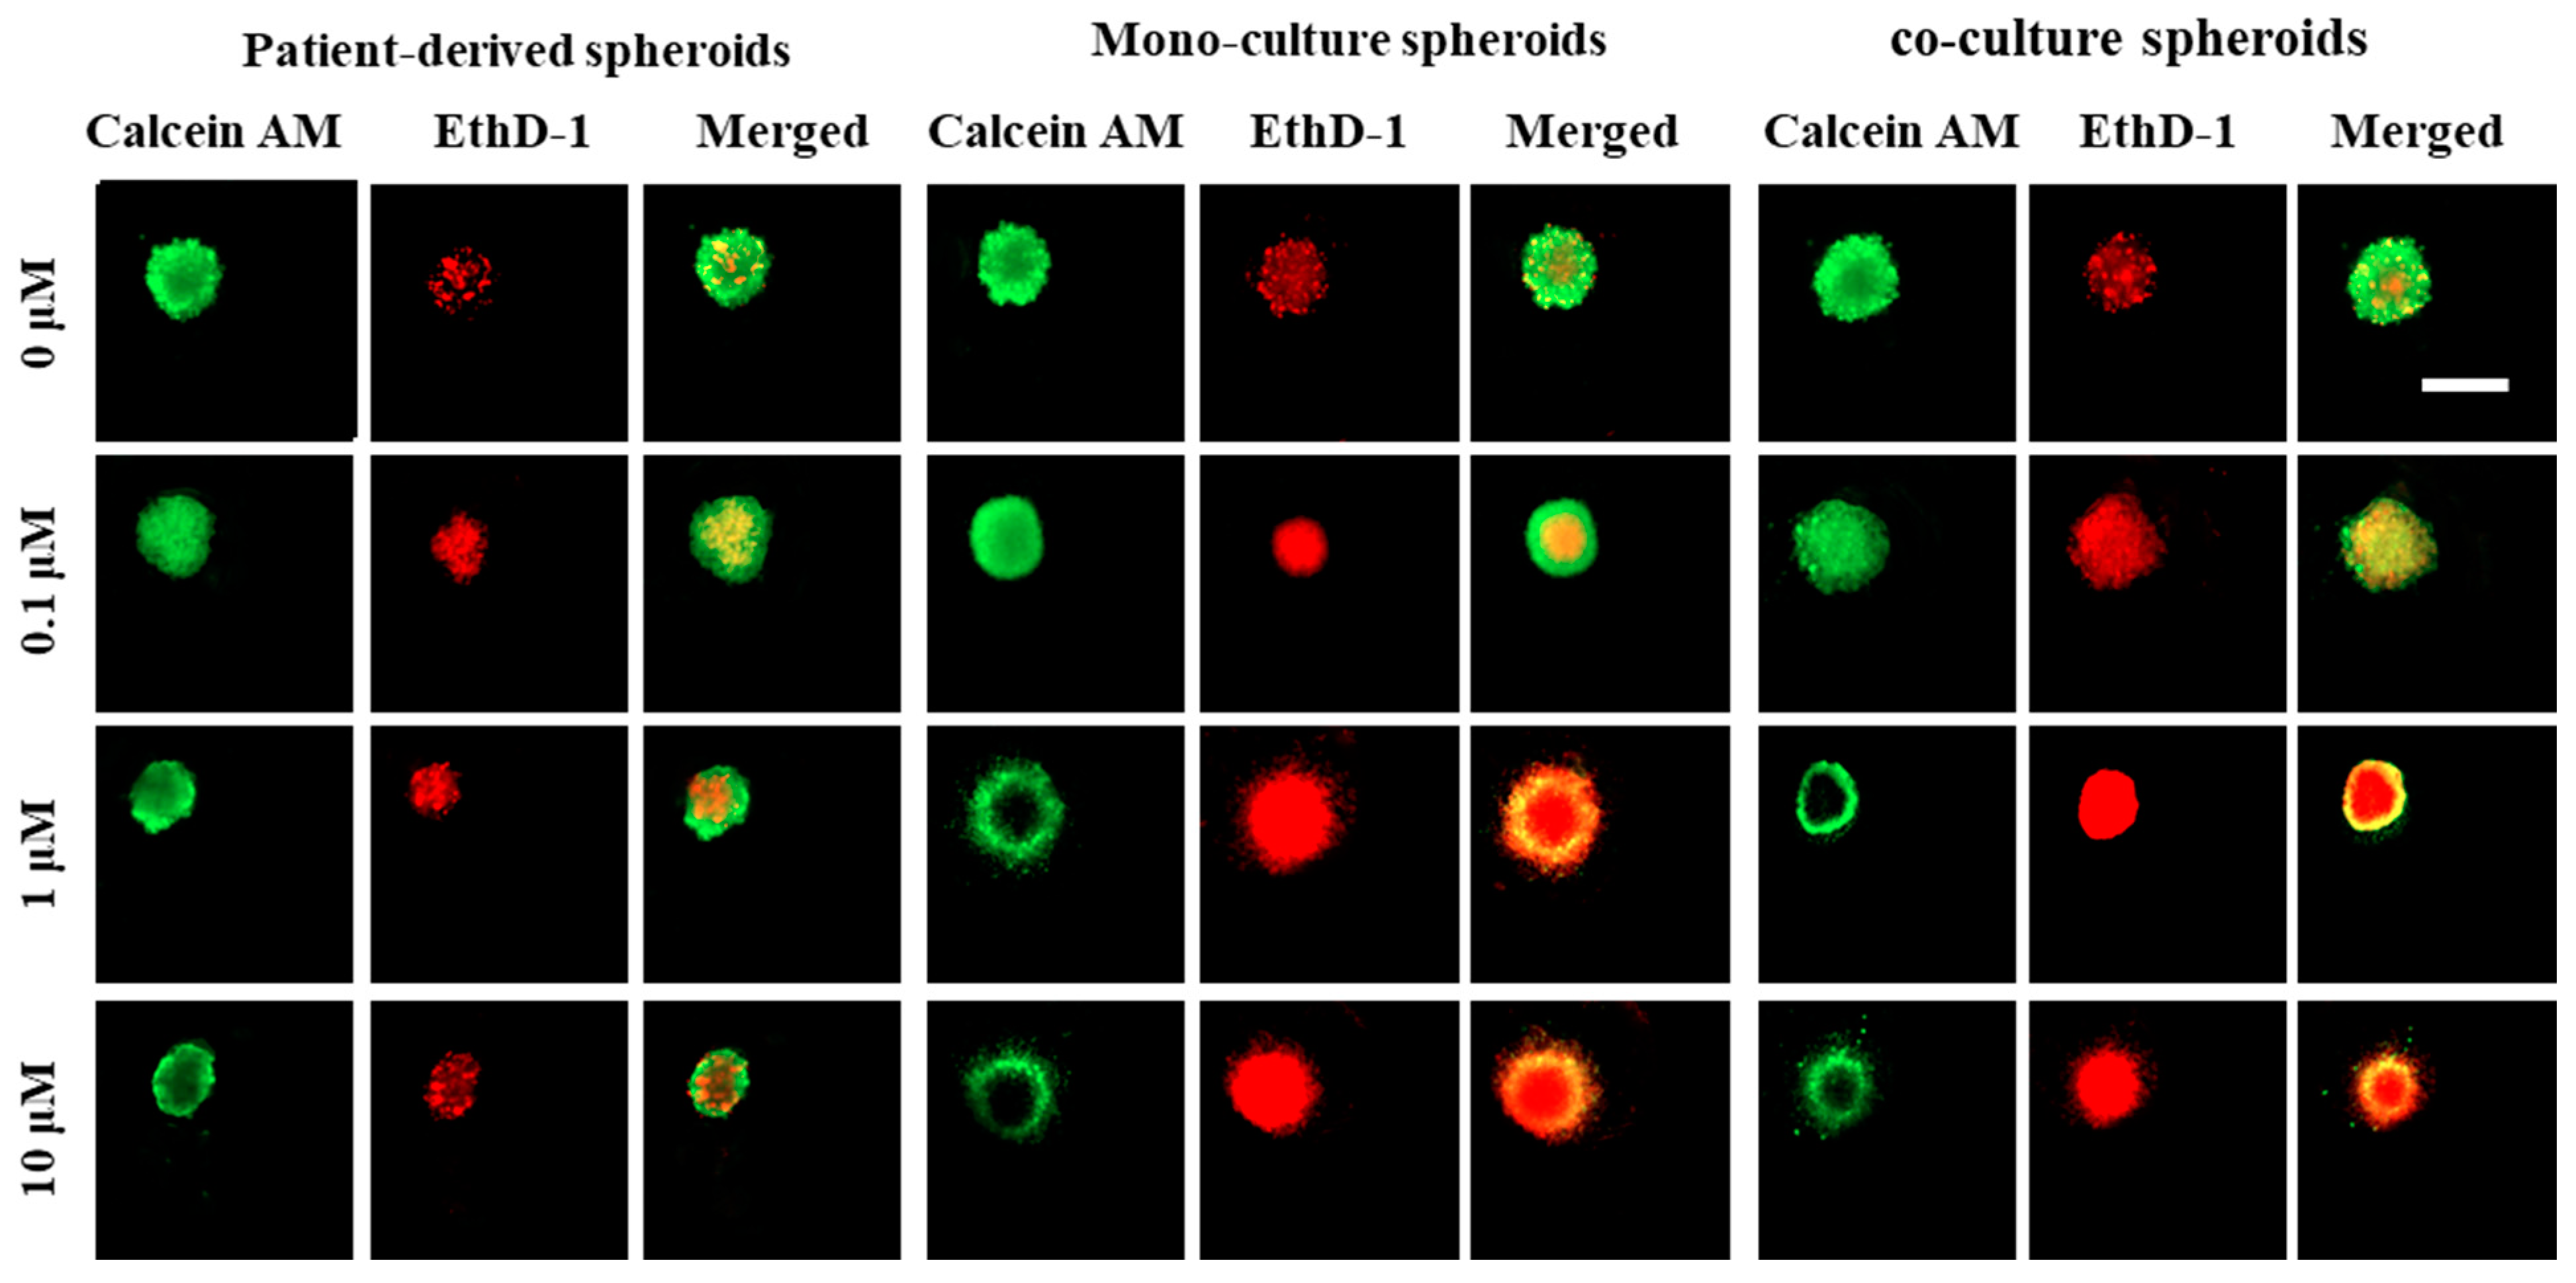
3.3.2. Differential Staining (Live/Dead Assay)
4. Conclusions
Author Contributions
Funding
Institutional Review Board Statement
Informed Consent Statement
Data Availability Statement
Acknowledgments
Conflicts of Interest
Abbreviations
| BBB | blood–brain barrier |
| BSA | Bovine serum albumin |
| DMEM | Dulbecco’s Modified Eagle’s Medium |
| ECM | Extra cellular matrix |
| EthD-1 | Ethidium homodimer-1 |
| MCTS | Multi cellular tumor spheroid |
| PBS | Phosphate buffered saline |
| PDMS | Polydimethylsiloxane |
| PVA | Polyvinyl alcohol |
| SD | Standard deviation |
| 2D | 2 dimensions |
| 3D | 3 dimensions |
References
- Hashemzadeh, H.; Shojaeilangari, S.; Allahverdi, A.; Rothbauer, M.; Ertl, P.; Naderi-Manesh, H. A combined microfluidic deep learning approach for lung cancer cell high throughput screening toward automatic cancer screening applications. Sci. Rep. 2021, 11, 1–10. [Google Scholar] [CrossRef] [PubMed]
- Torre, L.A.; Siegel, R.L.; Jemal, A. Lung cancer statistics. Lung Cancer Pers. Med. 2016, 893, 1–19. [Google Scholar]
- Zhang, Z.; Wang, H.; Ding, Q.; Xing, Y.; Xu, Z.; Lu, C.; Luo, D.; Xu, L.; Xia, W.; Zhou, C.; et al. Establishment of patient-derived tumor spheroids for non-small cell lung cancer. PLoS ONE 2018, 13, e0194016. [Google Scholar] [CrossRef] [PubMed]
- Collins, L.G.; Haines, C.; Perkel, R.; Enck, R.E. Lung cancer: Diagnosis and management. Am. Fam. Physician 2007, 75, 56–63. [Google Scholar]
- Villasante, A.; Vunjak-Novakovic, G. Tissue-engineered models of human tumors for cancer research. Expert Opin. Drug Discov. 2015, 10, 257–268. [Google Scholar] [CrossRef] [Green Version]
- Wu, S.; Pan, Y.; Mao, Y.; Chen, Y.; He, Y. Current progress and mechanisms of bone metastasis in lung cancer: A narrative review. Transl. Lung Cancer Res. 2021, 10, 439. [Google Scholar] [CrossRef]
- Bhatia, S.N.; Ingber, D.E. Microfluidic organs-on-chips. Nat. Biotechnol. 2014, 32, 760–772. [Google Scholar] [CrossRef]
- Sun, W.; Luo, Z.; Lee, J.; Kim, H.J.; Lee, K.; Tebon, P.; Feng, Y.; Dokmeci, M.R.; Sengupta, S.; Khademhosseini, A. Organ-on-a-chip for cancer and immune organs modeling. Adv. Healthc. Mater. 2019, 8, 1801363. [Google Scholar] [CrossRef]
- Shen, H.; Cai, S.; Wu, C.; Yang, W.; Yu, H.; Liu, L. Recent advances in three-dimensional multicellular spheroid culture and future development. Micromachines 2021, 12, 96. [Google Scholar] [CrossRef]
- Zou, H.; Yue, W.; Yu, W.K.; Liu, D.; Fong, C.C.; Zhao, J.; Yang, M. Microfluidic platform for studying chemotaxis of adhesive cells revealed a gradient-dependent migration and acceleration of cancer stem cells. Anal. Chem. 2015, 87, 7098–7108. [Google Scholar] [CrossRef]
- Businaro, L.; De Ninno, A.; Schiavoni, G.; Lucarini, V.; Ciasca, G.; Gerardino, A.; Belardelli, F.; Gabriele, L.; Mattei, F. Cross talk between cancer and immune cells: Exploring complex dynamics in a microfluidic environment. Lab Chip 2013, 13, 229–239. [Google Scholar] [CrossRef] [PubMed]
- Rodrigues, J.; Heinrich, M.A.; Teixeira, L.M.; Prakash, J. 3D in vitro model (R) evolution: Unveiling tumor–stroma interactions. Trends Cancer 2021, 7, 249–264. [Google Scholar] [CrossRef] [PubMed]
- Chaudhuri, O.; Cooper-White, J.; Janmey, P.A.; Mooney, D.J.; Shenoy, V.B. Effects of extracellular matrix viscoelasticity on cellular behaviour. Nature 2020, 584, 535–546. [Google Scholar] [CrossRef] [PubMed]
- Boedtkjer, E.; Pedersen, S.F. The acidic tumor microenvironment as a driver of cancer. Annu. Rev. Physiol. 2020, 82, 103–126. [Google Scholar] [CrossRef] [Green Version]
- Rhim, A.D.; Oberstein, P.E.; Thomas, D.H.; Mirek, E.T.; Palermo, C.F.; Sastra, S.A.; Dekleva, E.N.; Saunders, T.; Becerra, C.P.; Tattersall, I.W.; et al. Stromal elements act to restrain, rather than support, pancreatic ductal adenocarcinoma. Cancer Cell 2014, 25, 735–747. [Google Scholar] [CrossRef] [PubMed] [Green Version]
- Dadgar, N.; Gonzalez-Suarez, A.M.; Fattahi, P.; Hou, X.; Weroha, J.S.; Gaspar-Maia, A.; Stybayeva, G.; Revzin, A. A microfluidic platform for cultivating ovarian cancer spheroids and testing their responses to chemotherapies. Microsyst. Nanoeng. 2020, 6, 93. [Google Scholar] [CrossRef] [PubMed]
- Huang, D.; Zhang, X.; Fu, X.; Zu, Y.; Sun, W.; Zhao, Y. Liver Spheroids on Chips as Emerging Platforms for Drug Screening. Eng. Regen. 2022, 2, 246–256. [Google Scholar] [CrossRef]
- Lazzari, G.; Couvreur, P.; Mura, S. Multicellular tumor spheroids: A relevant 3D model for the in vitro preclinical investigation of polymer nanomedicines. Polym. Chem. 2017, 8, 4947–4969. [Google Scholar] [CrossRef] [Green Version]
- Dornhof, J.; Kieninger, J.; Muralidharan, H.; Maurer, J.; Urban, G.A.; Weltin, A. Microfluidic organ-on-chip system for multi-analyte monitoring of metabolites in 3D cell cultures. Lab Chip 2022, 22, 225–239. [Google Scholar] [CrossRef]
- Costa, E.C.; Moreira, A.F.; de Melo-Diogo, D.; Gaspar, V.M.; Carvalho, M.P.; Correia, I.J. 3D tumor spheroids: An overview on the tools and techniques used for their analysis. Biotechnol. Adv. 2016, 34, 1427–1441. [Google Scholar] [CrossRef]
- Nunes, A.S.; Barros, A.S.; Costa, E.C.; Moreira, A.F.; Correia, I.J. 3D tumor spheroids as in vitro models to mimic in vivo human solid tumors resistance to therapeutic drugs. Biotechnol. Bioeng. 2019, 116, 206–226. [Google Scholar] [CrossRef] [PubMed] [Green Version]
- Essaouiba, A.; Jellali, R.; Shinohara, M.; Scheidecker, B.; Legallais, C.; Sakai, Y.; Leclerc, E. Analysis of the behavior of 2D monolayers and 3D spheroid human pancreatic beta cells derived from induced pluripotent stem cells in a microfluidic environment. J. Biotechnol. 2021, 330, 5–56. [Google Scholar] [CrossRef] [PubMed]
- Fitzgerald, A.A.; Li, E.; Weiner, L.M. 3D culture systems for exploring cancer immunology. Cancers 2021, 13, 56. [Google Scholar] [CrossRef] [PubMed]
- Friedrich, J.; Seidel, C.; Ebner, R.; Kunz-Schughart, L.A. Spheroid-based drug screen: Considerations and practical approach. Nat. Protoc. 2009, 4, 309–324. [Google Scholar] [CrossRef] [PubMed]
- Ruppen, J.; Cortes-Dericks, L.; Marconi, E.; Karoubi, G.; Schmid, R.A.; Peng, R.; Marti, T.M.; Guenat, O.T. A microfluidic platform for chemoresistive testing of multicellular pleural cancer spheroids. Lab Chip 2014, 14, 1198–1205. [Google Scholar] [CrossRef] [Green Version]
- Dorrigiv, D.; Simeone, K.; Communal, L.; Kendall-Dupont, J.; St-Georges-Robillard, A.; Péant, B.; Carmona, E.; Mes-Masson, A.-M.; Gervais, T. Microdissected Tissue vs Tissue Slices—A Comparative Study of Tumor Explant Models Cultured On-Chip and Off-Chip. Cancers 2021, 13, 4208. [Google Scholar] [CrossRef]
- Prince, E.; Kheiri, S.; Wang, Y.; Xu, F.; Cruickshank, J.; Topolskaia, V.; Tao, H.; Young, E.W.K.; McGuigan, A.P.; Cescon, D.W.; et al. Microfluidic Arrays of Breast Tumor Spheroids for Drug Screening and Personalized Cancer Therapies. Adv. Healthc. Mater. 2022, 11, 2101085. [Google Scholar] [CrossRef]
- Huang, Y.L.; Ma, Y.; Wu, C.; Shiau, C.; Segall, J.E.; Wu, M. Tumor spheroids under perfusion within a 3D microfluidic platform reveal critical roles of cell-cell adhesion in tumor invasion. Sci. Rep. 2020, 10, 9648. [Google Scholar] [CrossRef]
- Sutherland, R.M.; MacDonald, H.R.; Howell, R.L. Multicellular spheroids: A new model target for in vitro studies of immunity to solid tumor allografts: Brief communication. J. Natl. Cancer Inst. 1977, 58, 1849–1853. [Google Scholar] [CrossRef]
- Rousset, N.; Monet, F.; Gervais, T. Simulation-assisted design of microfluidic sample traps for optimal trapping and culture of non-adherent single cells, tissues, and spheroids. Sci. Rep. 2017, 7, 245. [Google Scholar] [CrossRef]
- Lim, W.; Hoang, H.-H.; You, D.; Han, J.; Lee, J.E.; Kim, S.; Park, S. Formation of size-controllable tumour spheroids using a microfluidic pillar array (μFPA) device. Analyst 2018, 143, 5841–5848. [Google Scholar] [CrossRef] [PubMed]
- Patra, B.; Peng, C.; Liao, W.; Lee, C.; Tung, Y. Drug testing and flow cytometry analysis on a large number of uniform sized tumor spheroids using a microfluidic device. Sci. Rep. 2016, 6, 21061. [Google Scholar] [CrossRef] [PubMed] [Green Version]
- Marimuthu, M.; Rousset, N.; St-Georges-Robillard, A.; Lateef, M.A.; Ferland, M.; Mes-Masson, A.-M.; Gervais, T. Multi-size spheroid formation using microfluidic funnels. Lab Chip 2018, 18, 304–314. [Google Scholar] [CrossRef] [PubMed]
- Ahadian, S.; Civitarese, R.; Bannerman, D.; Mohammadi, M.H.; Lu, R.; Wang, E.; Davenport-Huyer, L.; Lai, B.; Zhang, B.; Zhao, Y.; et al. Organ-on-a-chip platforms: A convergence of advanced materials, cells, and microscale technologies. Adv. Healthc. Mater. 2018, 7, 1700506. [Google Scholar] [CrossRef] [PubMed]
- Akther, F.; Yakob, S.B.; Nguyen, N.-T.; Ta, H.T. Surface modification techniques for endothelial cell seeding in PDMS microfluidic devices. Biosensors 2020, 10, 182. [Google Scholar] [CrossRef]
- Ferrari, M.; Cirisano, F.; Morán, M.C. Mammalian cell behavior on hydrophobic substrates: Influence of surface properties. Colloids Interfaces 2019, 3, 48. [Google Scholar] [CrossRef] [Green Version]
- Zhou, J.; Ellis, A.V.; Voelcker, N.H. Recent developments in PDMS surface modification for microfluidic devices. Electrophoresis 2010, 31, 2–16. [Google Scholar] [CrossRef]
- Azizipour, N.; Avazpour, R.; Sawan, M.; Rosenzweig, D.; Ajji, A. Uniformity of spheroid-on-chip by surface treatment of PDMS microfluidic platforms. BioRxiv 2022. [Google Scholar] [CrossRef]
- Song, Y.; Kim, J.-S.; Kim, S.-H.; Park, Y.K.; Yu, E.; Kim, K.-H.; Seo, E.-J.; Oh, H.-B.; Lee, H.C.; Kim, K.M.; et al. Patient-derived multicellular tumor spheroids towards optimized treatment for patients with hepatocellular carcinoma. J. Exp. Clin. Cancer Res. 2018, 37, 1–13. [Google Scholar] [CrossRef]
- Baek, N.; Seo, O.W.; Kim, M.; Hulme, J.; An, S.S.A. Monitoring the effects of doxorubicin on 3D-spheroid tumor cells in real-time. OncoTargets Ther. 2016, 9, 7207. [Google Scholar] [CrossRef] [Green Version]
- Ahangar, P.; Akoury, E.; Luna, A.S.R.G.; Nour, A.; Weber, M.H.; Rosenzweig, D.H. Nanoporous 3D-printed scaffolds for local doxorubicin delivery in bone metastases secondary to prostate cancer. Materials 2018, 11, 1485. [Google Scholar] [CrossRef] [PubMed] [Green Version]
- Patra, B.; Lateef, M.A.; Brodeur, M.N.; Fleury, H.; Carmona, E.; Péant, B.; Provencher, D.; Mes-Masson, A.-M.; Gervais, T. Carboplatin sensitivity in epithelial ovarian cancer cell lines: The impact of model systems. PLoS ONE 2020, 15, e0244549. [Google Scholar] [CrossRef] [PubMed]
- Chen, Y.-C.; Lou, X.; Zhang, Z.; Ingram, P.; Yoon, E. High-throughput cancer cell sphere formation for characterizing the efficacy of photo dynamic therapy in 3D cell cultures. Sci. Rep. 2015, 5, 12175. [Google Scholar] [CrossRef] [PubMed] [Green Version]
- Astolfi, M.; Peant, B.; Lateef, M.A.; Rousset, N.; Kendall-Dupont, J.; Carmona, E.; Monet, F.; Saad, F.; Provencher, D.; Mes-Masson, A.-M.; et al. Micro-dissected tumor tissues on chip: An ex vivo method for drug testing and personalized therapy. Lab Chip 2016, 16, 312–325. [Google Scholar] [CrossRef] [PubMed]
- Lee, S.-A.; Kang, E.; Ju, J.; Kim, D.-S.; Lee, S.-H. Spheroid-based three-dimensional liver-on-a-chip to investigate hepatocyte–hepatic stellate cell interactions and flow effects. Lab Chip 2013, 13, 3529–3537. [Google Scholar] [CrossRef]
- Weiswald, L.-B.; Bellet, D.; Dangles-Marie, V. Spherical cancer models in tumor biology. Neoplasia 2015, 17, 1–15. [Google Scholar] [CrossRef] [Green Version]
- Czekanska, E.M. Assessment of cell proliferation with resazurin-based fluorescent dye. In Mammalian Cell Viability; Springer: Berlin/Heidelberg, Germany, 2011; pp. 27–32. [Google Scholar]
- Calitz, C.; Pavlović, N.; Rosenquist, J.; Zagami, C.; Samanta, A.; Heindryckx, F. A biomimetic model for liver Cancer to study Tumor-Stroma interactions in a 3D environment with tunable Bio-Physical properties. JoVE 2020, e61606. [Google Scholar] [CrossRef]
- Pietras, K.; Östman, A. Hallmarks of cancer: Interactions with the tumor stroma. Exp. Cell Res. 2010, 316, 1324–1331. [Google Scholar] [CrossRef]
- Fridman, I.B.; Ugolini, G.S.; VanDelinder, V.; Cohen, S.; Konry, T. High throughput microfluidic system with multiple oxygen levels for the study of hypoxia in tumor spheroids. Biofabrication 2021, 13, 035037. [Google Scholar] [CrossRef]
- Rohwer, N.; Cramer, T. Hypoxia-mediated drug resistance: Novel insights on the functional interaction of HIFs and cell death pathways. Drug Resist. Updates 2011, 14, 191–201. [Google Scholar] [CrossRef]


Publisher’s Note: MDPI stays neutral with regard to jurisdictional claims in published maps and institutional affiliations. |
© 2022 by the authors. Licensee MDPI, Basel, Switzerland. This article is an open access article distributed under the terms and conditions of the Creative Commons Attribution (CC BY) license (https://creativecommons.org/licenses/by/4.0/).
Share and Cite
Azizipour, N.; Avazpour, R.; Weber, M.H.; Sawan, M.; Ajji, A.; Rosenzweig, D.H. Uniform Tumor Spheroids on Surface-Optimized Microfluidic Biochips for Reproducible Drug Screening and Personalized Medicine. Micromachines 2022, 13, 587. https://doi.org/10.3390/mi13040587
Azizipour N, Avazpour R, Weber MH, Sawan M, Ajji A, Rosenzweig DH. Uniform Tumor Spheroids on Surface-Optimized Microfluidic Biochips for Reproducible Drug Screening and Personalized Medicine. Micromachines. 2022; 13(4):587. https://doi.org/10.3390/mi13040587
Chicago/Turabian StyleAzizipour, Neda, Rahi Avazpour, Michael H. Weber, Mohamad Sawan, Abdellah Ajji, and Derek H. Rosenzweig. 2022. "Uniform Tumor Spheroids on Surface-Optimized Microfluidic Biochips for Reproducible Drug Screening and Personalized Medicine" Micromachines 13, no. 4: 587. https://doi.org/10.3390/mi13040587