Article

Voltammetric Determination of Isoniazid in the Presence of Acetaminophen Utilizing MoS2-Nanosheet-Modified Screen-Printed Electrode

by
Somayeh Tajik
1,
Zahra Dourandish
2,
Fariba Garkani Nejad
2,
Abbas Aghaei Afshar
1 and
Hadi Beitollahi
2,*
1
Research Center of Tropical and Infectious Diseases, Kerman University of Medical Sciences, Kerman 7616913555, Iran
2
Environment Department, Institute of Science and High Technology and Environmental Sciences, Graduate University of Advanced Technology, Kerman 7631885356, Iran
*
Author to whom correspondence should be addressed.
Micromachines 2022, 13(3), 369; https://doi.org/10.3390/mi13030369
Submission received: 11 February 2022 / Revised: 21 February 2022 / Accepted: 22 February 2022 / Published: 26 February 2022
(This article belongs to the Special Issue Electrochemical Sensors in Biological Applications, Volume II)

Abstract

:
We used MoS2 nanosheets (MoS2 NSs) for surface modification of screen-printed electrode (MoS2NSs-SPE) aimed at detecting isoniazid (INZ) in the presence of acetaminophen (AC). According to analysis, an impressive catalytic performance was found for INZ and AC electro-oxidation, resulting in an appreciable peak resolution (~320 mV) for both analytes. Chronoamperometry, differential pulse voltammetry (DPV), linear sweep voltammogram (LSV), and cyclic voltammetry (CV) were employed to characterize the electrochemical behaviors of the modified electrode for the INZ detection. Under the optimal circumstances, there was a linear relationship between the peak current of oxidation and the various levels of INZ (0.035–390.0 µM), with a narrow limit of detection (10.0 nM). The applicability of the as-developed sensor was confirmed by determining the INZ and AC in tablets and urine specimens, with acceptable recoveries.

1. Introduction

Drug analysis as one of the main branches of analytical chemistry is essential to control the quality of drugs. Drug analysis has used a variety of analytical techniques such as high-performance liquid chromatography (HPLC) [1,2], mass spectrometry [3], liquid chromatography–mass spectrometry/mass-spectrometry (LC–MS/MS) [4], and chemiluminescence [5,6,7]. Despite the many advantages of all of these methods, there are some drawbacks such as sophisticated analysis, high cost, low sensitivity, and long response times.
Analytical approaches based on electrochemical sensing systems possess multiple merits such as cost-effectiveness, portability, simple devices, narrow limit of detection (LOD), high-speed analysis, extended linear dynamic range, and selectivity in exposure to interferants [8,9,10,11,12]. Voltammetric determinations, such as DPV, exhibit rapid reaction, excellent sensitivity, and impressive selectivity [13,14,15].
Screen-printing electrodes (SPEs) have been extensively employed for the mass-production of disposable electrochemical sensing systems [16]. The SPEs are affordable with the capability for mass production while maintaining sufficient reproducibility, with advantages of versatility and miniaturization [17,18,19,20,21]. The electrocatalytic activity of the bare electrode displays very substandard behavior [22]. Therefore, the electrode surface modification increases the sensitivity, reproducibility, and stability [23,24,25,26,27]. Detection of trace level of analytes can be increased by combining nanomaterials, significantly reinforcing the surface properties and electroconductivity of the electrodes, from such a function [28,29,30,31]. Nanomaterial-supported electrochemical sensors have recently attracted the attention of researchers [32,33,34].
Two-dimensional (2D) layered nanomaterials such as transition metal dichalcogenides (TMDs) and graphene are of the ideal electrode surface modifiers because of specific physicochemical features [35]. Molybdenum disulfide (MoS2) is one of the key TMDs, having an impressive layered structure, which contains monolayer of Mo atoms located within two layers of S atoms in a trigonal prismatic arrangement. These sandwich layers in the crystalline lattice are linked together by weak Van der Waals forces, such that the distance of inter-sheet molybdenum atoms are 0.65 nm [36,37,38]. A silicon-like semiconductor of bulk MoS2 has an indirect 1.23-eV bandgap, and the two-dimensional sheets of MoS2 (2D-MoS2) form a direct 1.89-eV bandgap (visible red) due to the removal of interplays between layers and confining electrons in a single plane. Furthermore, MoS2 nanosheets possess numerous unparalleled features, including impressive biocompatibility, huge surface area, durable structural stability, and appreciable junction area with electrode/reactants. Such structural merits and resultant electrical and optical features suggest the applicability of 2D-MoS2 NSs and other 2D-TMDs to develop various optoelectronic and electronic equipment such as photodetectors, field-effect transistors (FETs), varied sensors, and photovoltaic devices [39,40,41,42].
N-acetyl-p-aminophenol, known as acetaminophen, paracetamol, Tylenol, or AC, is a drug globally used for relieving moderate pain and declining fever. AC is a noncarcinogenic and effective aspirin substitute for people with hypersensitivity to acetylsalicylic acid [43,44]. The analgesic pathway of AC is to impede production of prostaglandin in the central nervous system (CNS). It can reduce fever through sedation of the hypothalamic heat-regulating center. This drug is mainly metabolized in the liver where toxic metabolites are produced. The overdose of AC (about 4 g/day) can result in side effects such as hepatoxicity, nephrotoxicity, gastrointestinal problems, and tissue failures [45,46].
The contagious infection of tuberculosis (TB) caused by Mycobacterium tuberculosis (MB-TB) bacteria can influence various body organs, in particular the lungs. Pyridine-4-carboxylic acid hydrazide, called an isonicotinic acid hydrazide, isoniazid, or INZ, is an essential organic compound and a beneficial antibiotic capable of exhibiting strong bactericidal performance in the early steps of anti-TB therapy [47,48]. Many new cases of tuberculosis are treated each year with isoniazid as the most effective and the safest treatment. TB-related medications should be prescribed for a longer period of time. It should be noted that INZ may induce hepatotoxicity in people suffering from inflammation and may even cause death after long-term exposure to INZ [49,50]. Since antibacterials (INZ) and AC are routine, commercially available medications, a growing concern has been aroused over liver damage because of INZ co-administrated with AC [51]. Accordingly, it is substantial to develop a sensitive and selective electrochemical sensor in pharmaceutical and clinical preparations to detect INZ co-administrated with AC.
Herein, we used MoS2 NSs for surface modification of a screen-printed electrode aimed at simultaneously and voltammetrically detecting INZ and its common interferant AC. The MoS2 NSs were synthesized by a single-pot hydrothermal protocol. Thus, drop-casting of dispersed MoS2 NSs on SPE surfaces leads to the preparation of sensors (MoS2NSs-SPE). These sensors had a greater electrocatalytic response to detecting INZ in buffer solution (pH = 7.0) when compared with bare (unmodified) SPEs. The applicability of the as-developed sensor was confirmed by determining the INZ and AC in real tablets and urine specimens, with acceptable recoveries.

2. Experimental

2.1. Materials and Instrumentations

A potentiostat/galvanostat AUTOLAB PGSTAT 302N (Metrohm, Herisau, Switzerland) was utilized to carry out all experiments during the electrochemical processes, under monitoring of the General Purpose Electrochemical System (GPES) software Version 4.9. The DropSens SPE (DRP-110, Oviedo, Spain) was used for all electrochemical tests. The three-electrode composition contained a 4 mm graphite as the working electrode, graphite as the auxiliary electrode, and a silver as pseudo-reference electrode. A Metrohm 713 pH meter (Metrohm, Herisau, Switzerland) equipped with a glass electrode was utilized to measure the pH values of all solutions. Deionized water from Direct-Q®® 8 UV water purification system (Millipore, Darmstadt, Germany) was applied to freshly prepare all solutions. X-ray diffraction (XRD) spectra were obtained from Panalytical X’Pert Pro X-ray diffractometer (Etten Leur, The Netherlands) with Cu/Ká radiation at ë value of 1.5418 nm. Fourier-transform infrared (FTIR) patterns were obtained from a Tensor II spectrometer (Bruker, Mannheim, Germany). Energy dispersive X-ray (EDX) patterns and scanning electron microscopy (SEM) images were obtained by the MIRA3 scanning electron microscope (Tescan, Brno, Czech Republic).
All materials in this study were of analytical grade with no extra purification, sourced from Sigma-Aldrich. Phosphoric acid was utilized to prepare phosphate buffer solutions (PBSs) with various pH values adjusted by NaOH.

2.2. Fabrication of MoS2 NSs

Based on a protocol, (NH4)6Mo7O24·4H2O (3 mmol) and thiourea (2.3 g) dispersed in deionized water (30 mL) were transferred to a Teflon autoclave (40-mL) at 200 °C for 24 h. The resultant product was adequately rinsed with ethanol and deionized water, followed by vacuum drying at 50 °C for six hours.

2.3. Preparation of MoS2 NSs-SPE

For the preparation of MoS2 NSs-SPE, 1 mg of synthesized MoS2 NSs was poured into 1 mL of deionized water under ultrasonication, followed by drop casting of the prepared solution (4 μL) on SPE and subsequently drying at ambient temperature. The prepared MoS2 NSs-SPE was used in electrochemical experiments.
The surface areas of the MoS2 NSs-SPE and the bare SPE were obtained by CV using 1 mM K3Fe(CN)6 at different scan rates. Using the Randles–Sevcik equation [52] for MoS2 NSs-SPE, the electrode surface was found to be 0.16 cm2 which was about 5.1 times greater than bare SPE.

2.4. Preparation of Real Specimens

Five AC tablets (containing 325 mg/tablet, Tehran Chemie Pharmaceutical Co., Tehran, Iran) were first powdered and then 325 mg of the powder was dissolved in water (25 mL) under ultrasonication. Next, various volumes of as-diluted solution were diluted to the mark of a 25 mL volumetric flask with PBS (pH = 7.0). The standard addition method was followed to determine the AC content.
Similarly, five INZ tablets (containing 300 mg/tablet, Tehran Chemie Pharmaceutical Co., Tehran, Iran) were first powdered and then 300 mg of the powder was dissolved in water (25 mL) under ultrasonication. Next, various volumes of as-diluted solution were diluted to the mark of a 25 mL volumetric flask with PBS (pH = 7.0). The standard addition method was followed to determine the AC content.
The instantly refrigerated urine specimens, at a certain volume (10 mL), were centrifuged at 2000 rpm for 15 min. Then, the supernatant was filtered by a 0.45 µm filter, and various volumes of it were diluted to the mark of a 25 mL volumetric flask with PBS (pH = 7.0). Next, the diluted specimens were spiked by various concentrations of INZ and AC.

3. Results and Discussion

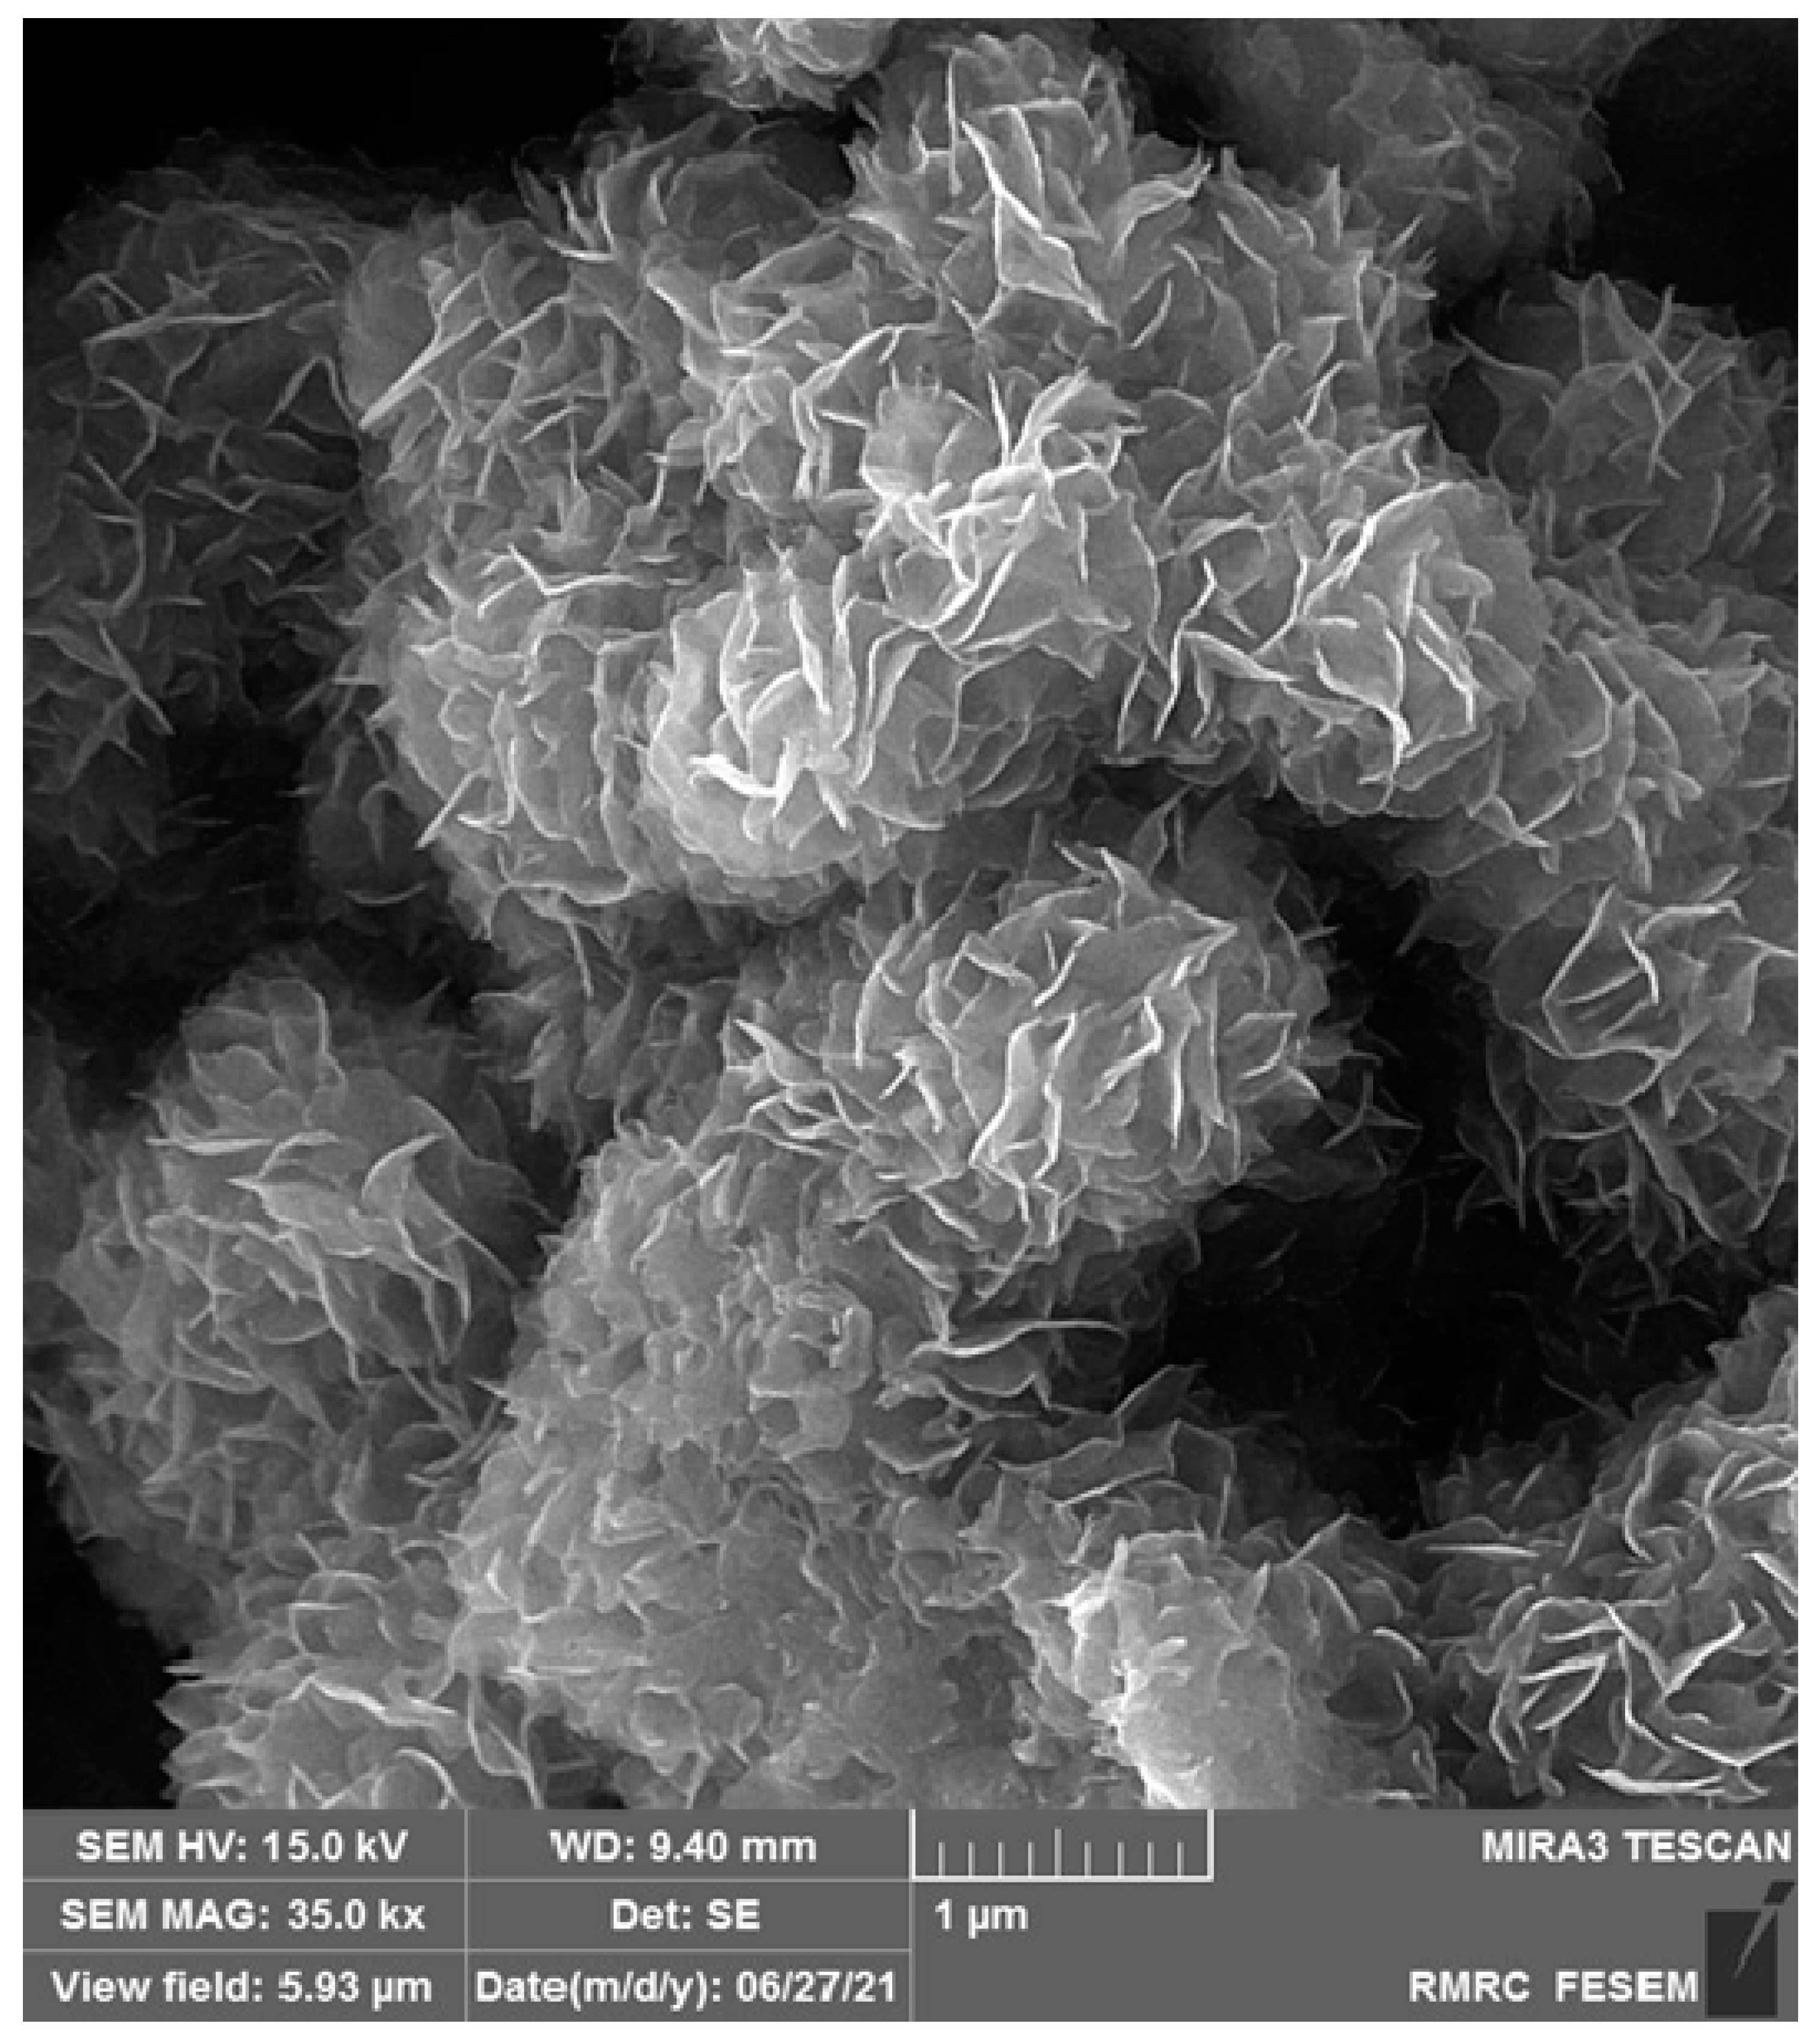
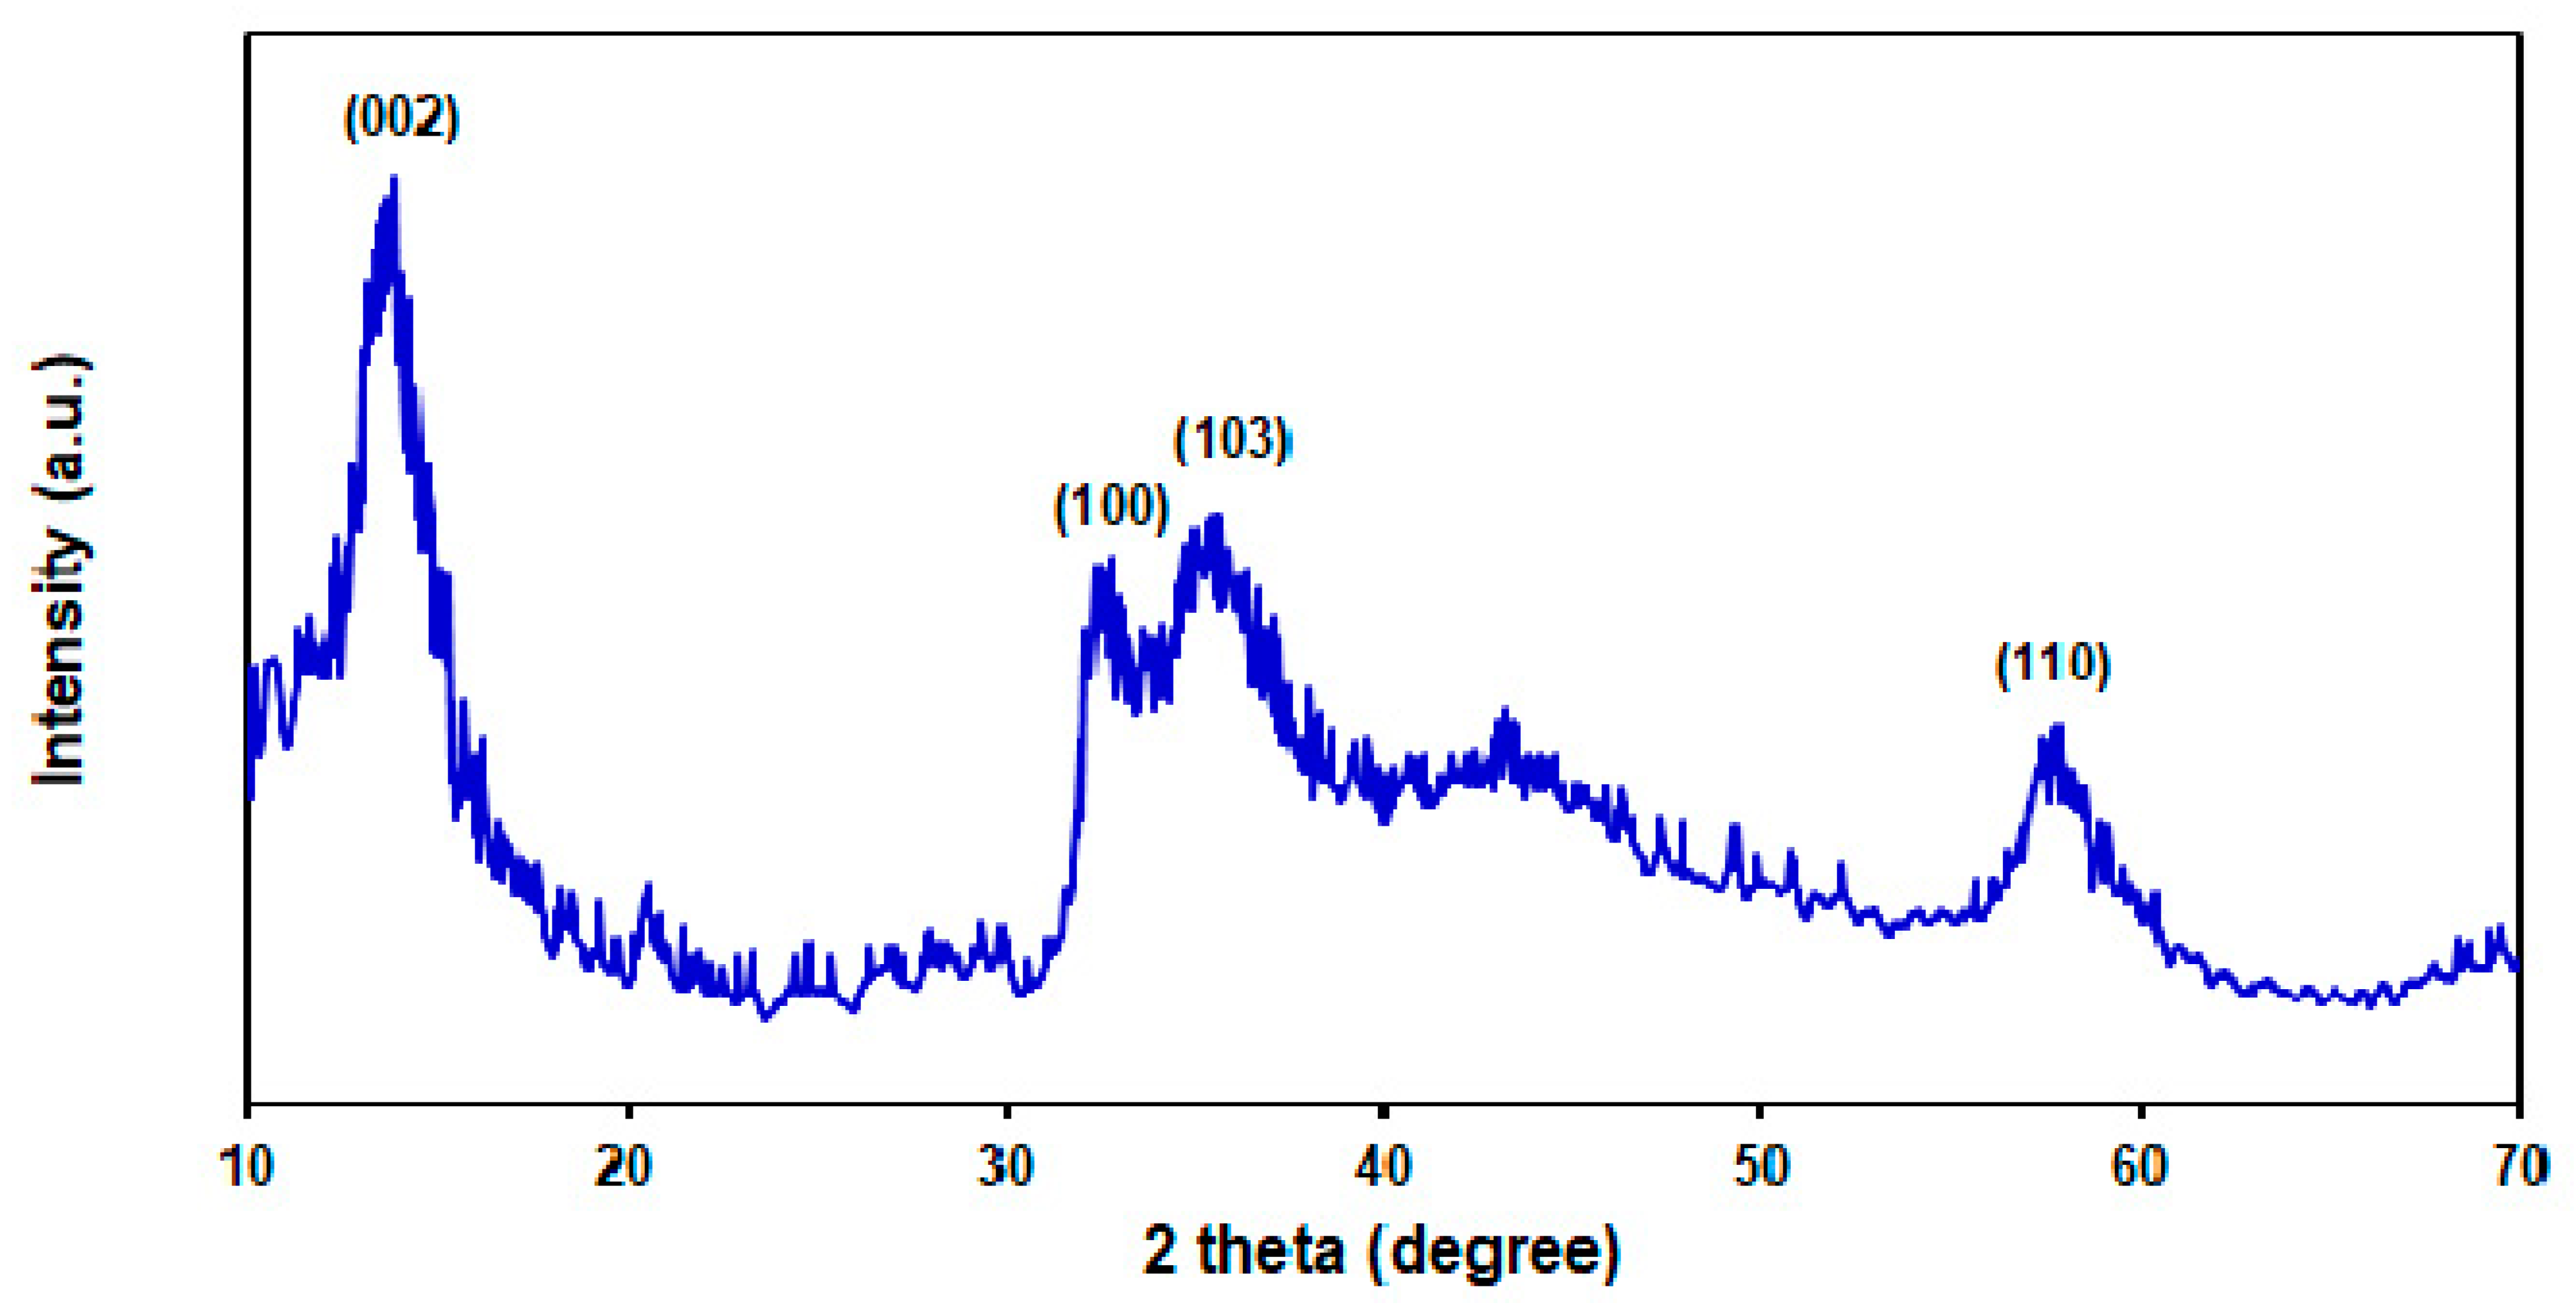
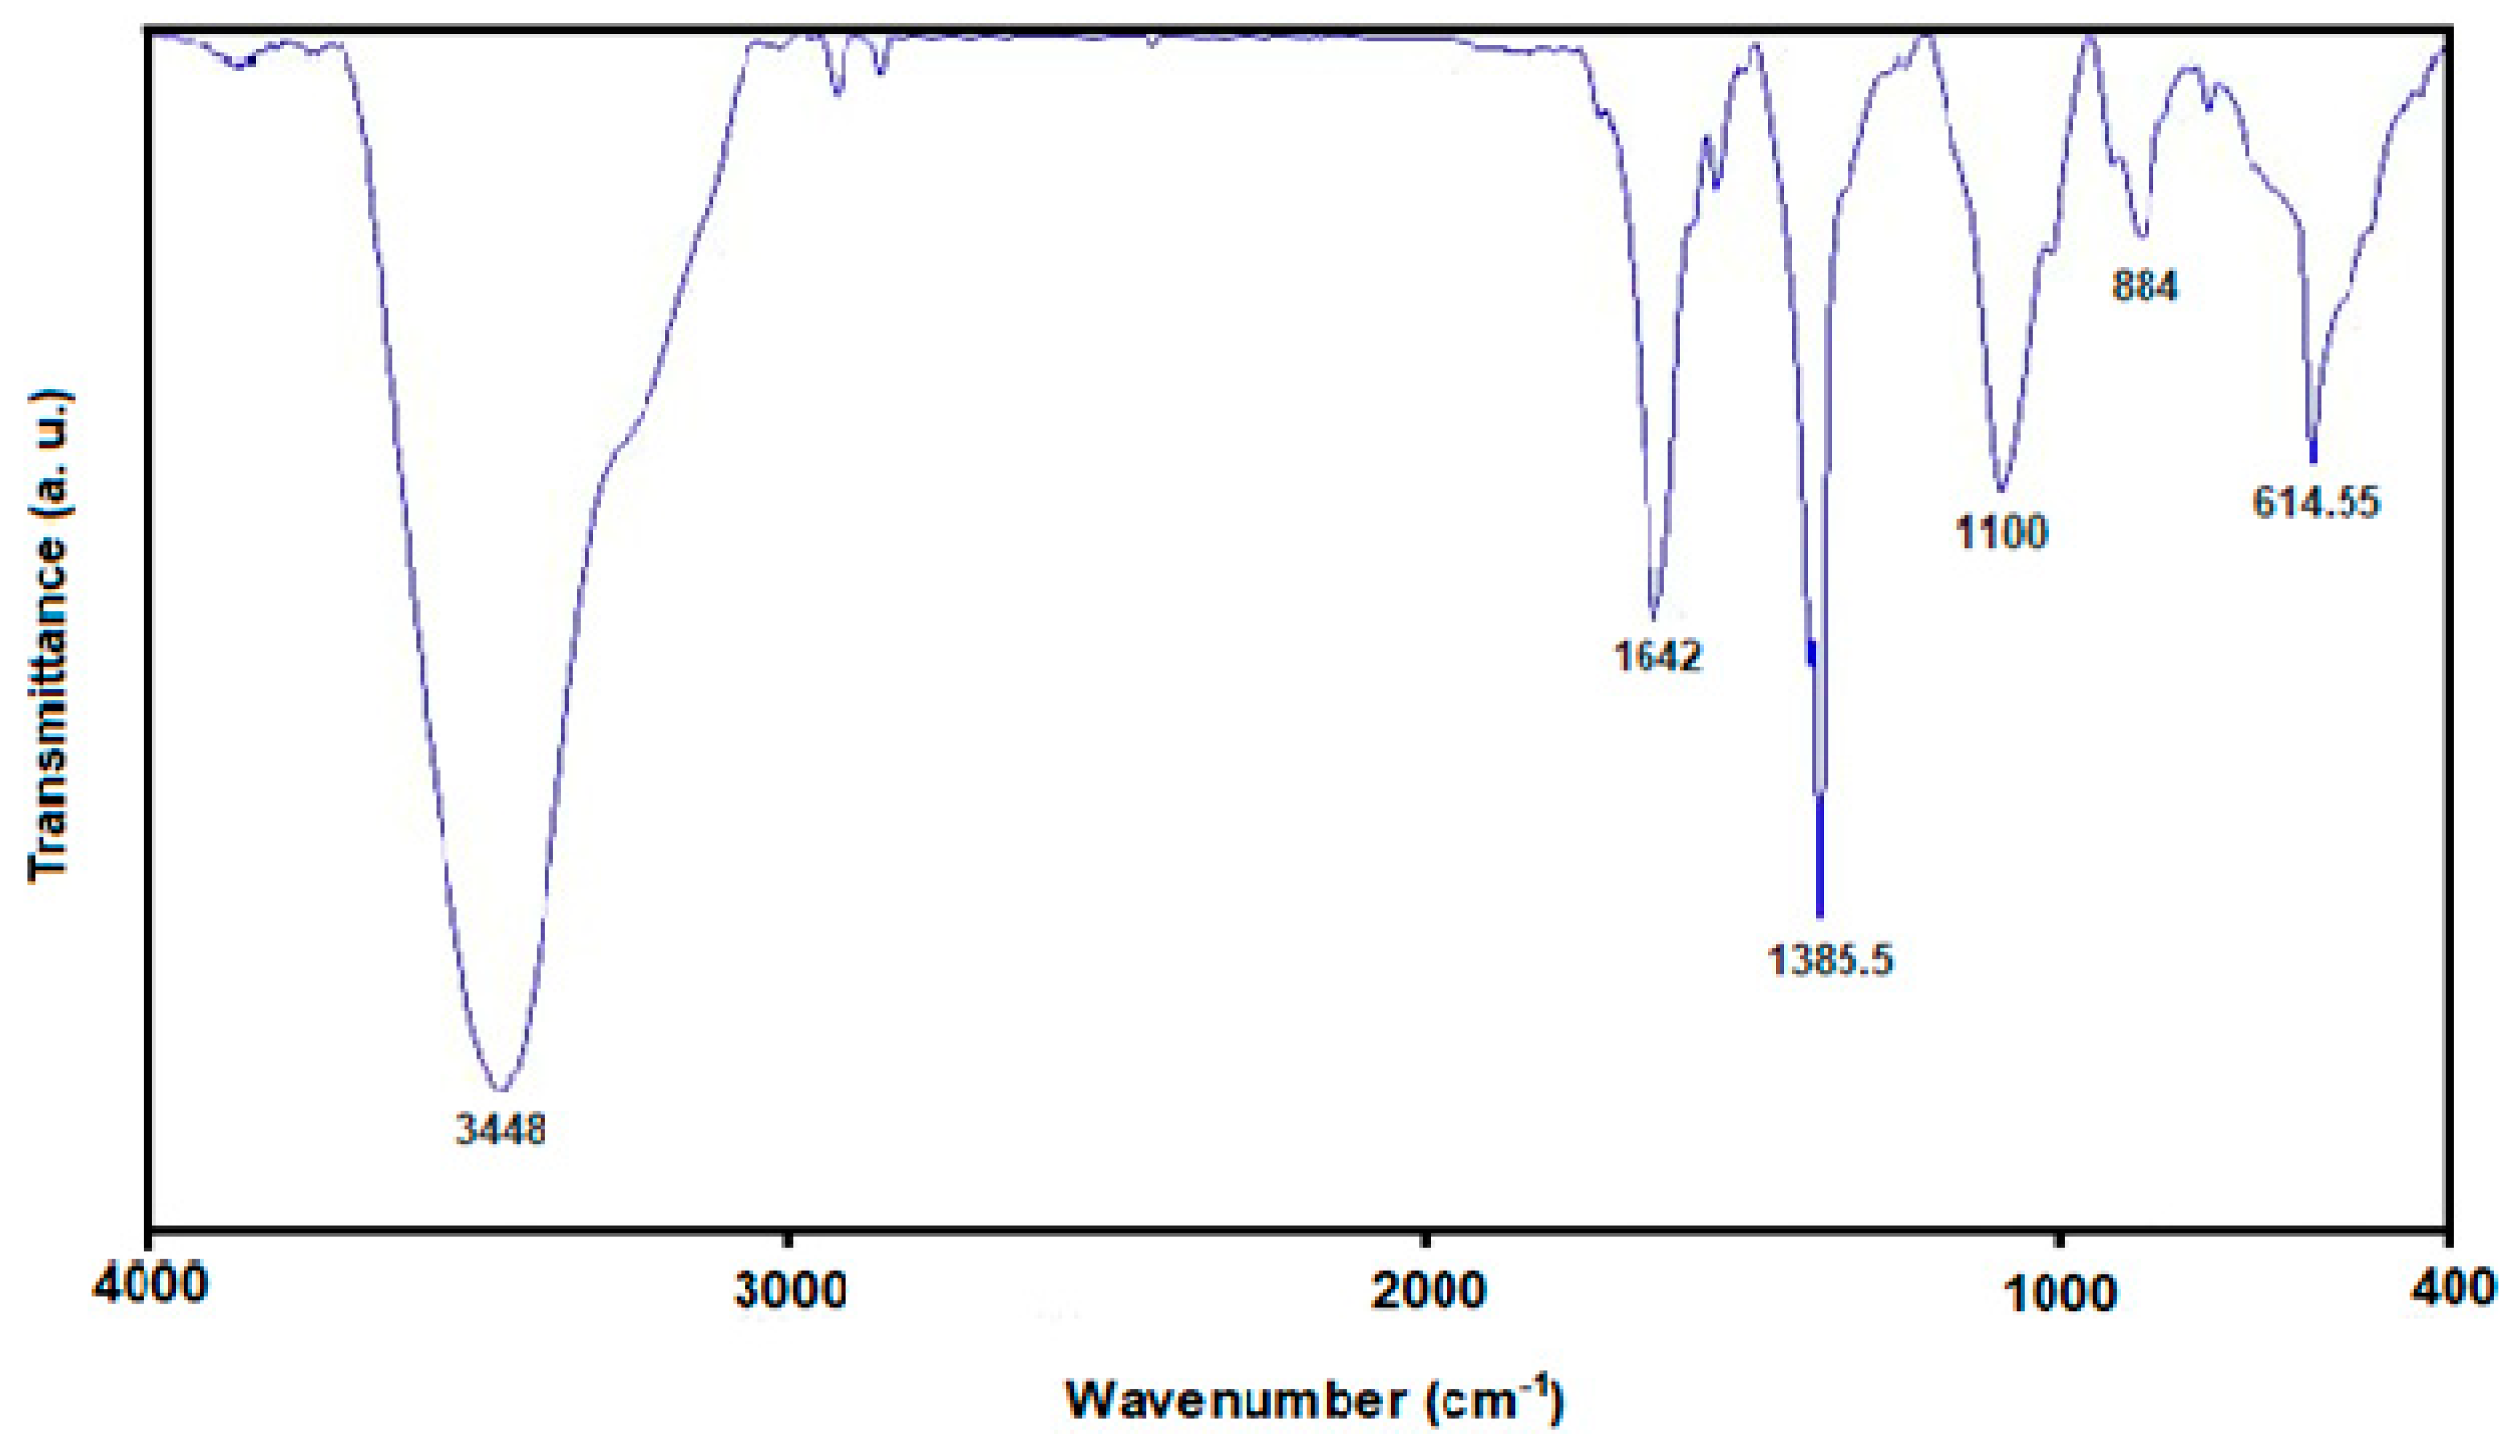
3.1. Determination of MoS2 NSs Characteristics

A scanning electron microscope was employed to capture images for the exploration of the morphology of MoS2 nanostructures (Figure 1). The MoS2 nanostructure is composed of thin sheets and the sheets are slightly curved and look like clusters composed of randomly assembled NSs. Moreover, SEM images show that the as-prepared MoS2 has a sheet-like morphology of about 12.8 nm thickness.
The XRD spectra was captured to determine the crystallographic structures of MoS2 NSs. Figure 2 shows the crystallite properties of MoS2 NSs based on the XRD spectra profiled at 57.8°, 35.3°, 32.22°, and 13.66° attributed to (110), (103), (100), and (002) crystal planes of the MoS2 structure, respectively, in line with the relevant standard card (JCPDS card No. 37-1492). There were no peaks related to any impurity or other phases [53].
Figure 3 shows the FTIR analysis of the prepared MoS2 NSs, the results of which exhibited the following absorption peaks for MoS2 at 614.55 cm−1, 884 cm−1, 1100 cm−1, 1385.5 cm−1, 1642 cm−1, and 3448 cm−1. The peaks at 614.55 cm−1, 884 cm−1, and 1642 cm−1 corresponded to Mo–S and S–S bonds and Mo–O vibrations, respectively. Moreover, the peaks at 1100  cm−1 and 3448 cm−1 were related to hydroxyl stretching vibration resulting from the absorbed water molecules [54,55].

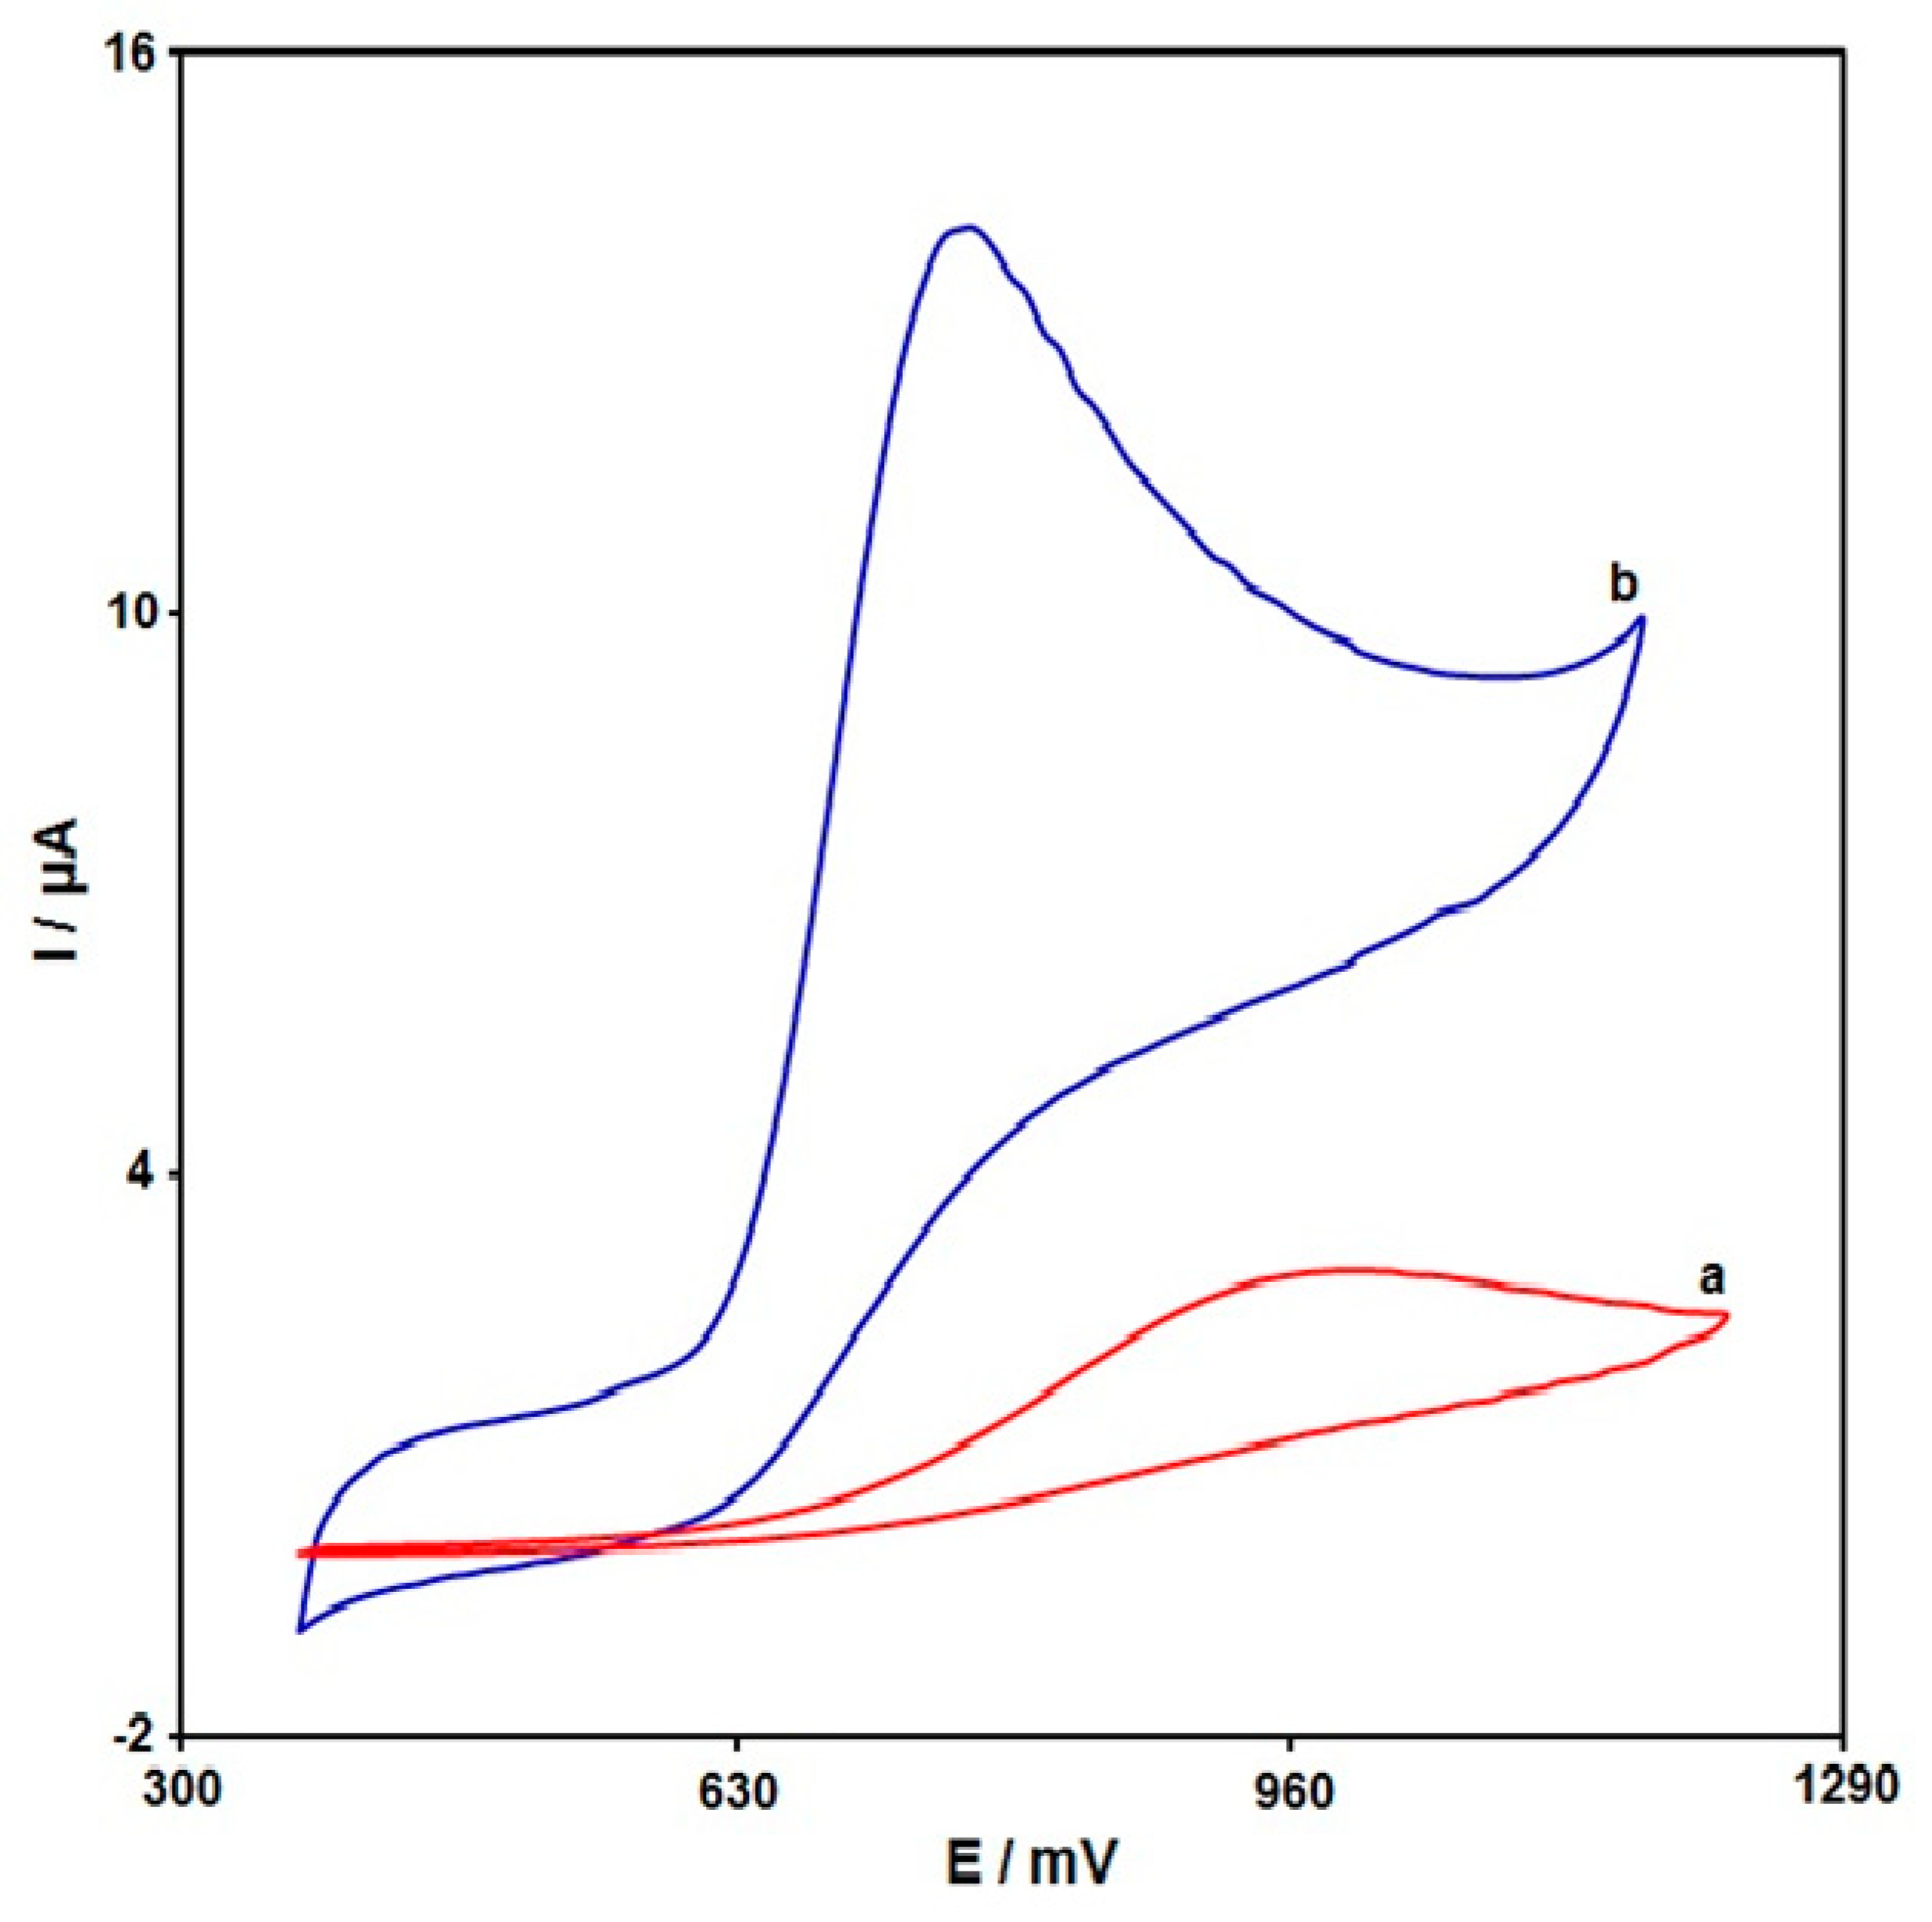
3.2. Electrochemical Evaluation of MoS2 NSs-SPE towards INZ Detection

The electrochemical determinations of INZ are significantly influenced by the solution pH. Hence, we conducted the tests to determine the pH effect on electrocatalytic behavior of MoS2 NSs-SPE towards INZ. The DPV was employed to study the effect of electrolyte solution pH (0.1 M PBS) under different values (2.0–9.0) in the presence of 40.0 μM of INZ at 50 mV/s on the MoS2 NSs-SPE. The oxidation peak current of INZ was maximum at pH 7.0, thereby selecting this value as the optimum pH in the INZ detection.
Cyclic voltammetry was utilized to carry out all electrochemical determinations for comparison of unmodified SPE and MoS2 NSs-SPE in exposure to INZ (200.0 μM) at 50 mV/s (Figure 4). Findings revealed an oxidation peak, but no reduction peak, on the electrode surfaces, which means the irreversible electrochemical action of INZ on the electrodes. There was a weak and broad anodic peak current (Ipa) of INZ oxidation on the unmodified SPE at 1000 mV with 3.0 μA, underlining weak INZ oxidation on the unmodified SPE. Compared with the unmodified SPE, the Ipa of INZ obtained on the MoS2 NSs-SPE increases to 14.0 μA, which is almost a 4.6-fold elevation when compared with the unmodified SPE. In addition, the oxidation of INZ was seen at a lower potential when compared with the unmodified SPE. The most sensitive voltammetric response of INZ at MoS2 NSs-SPE was obtained from the good electrocatalytic activity of MoS2 NSs.

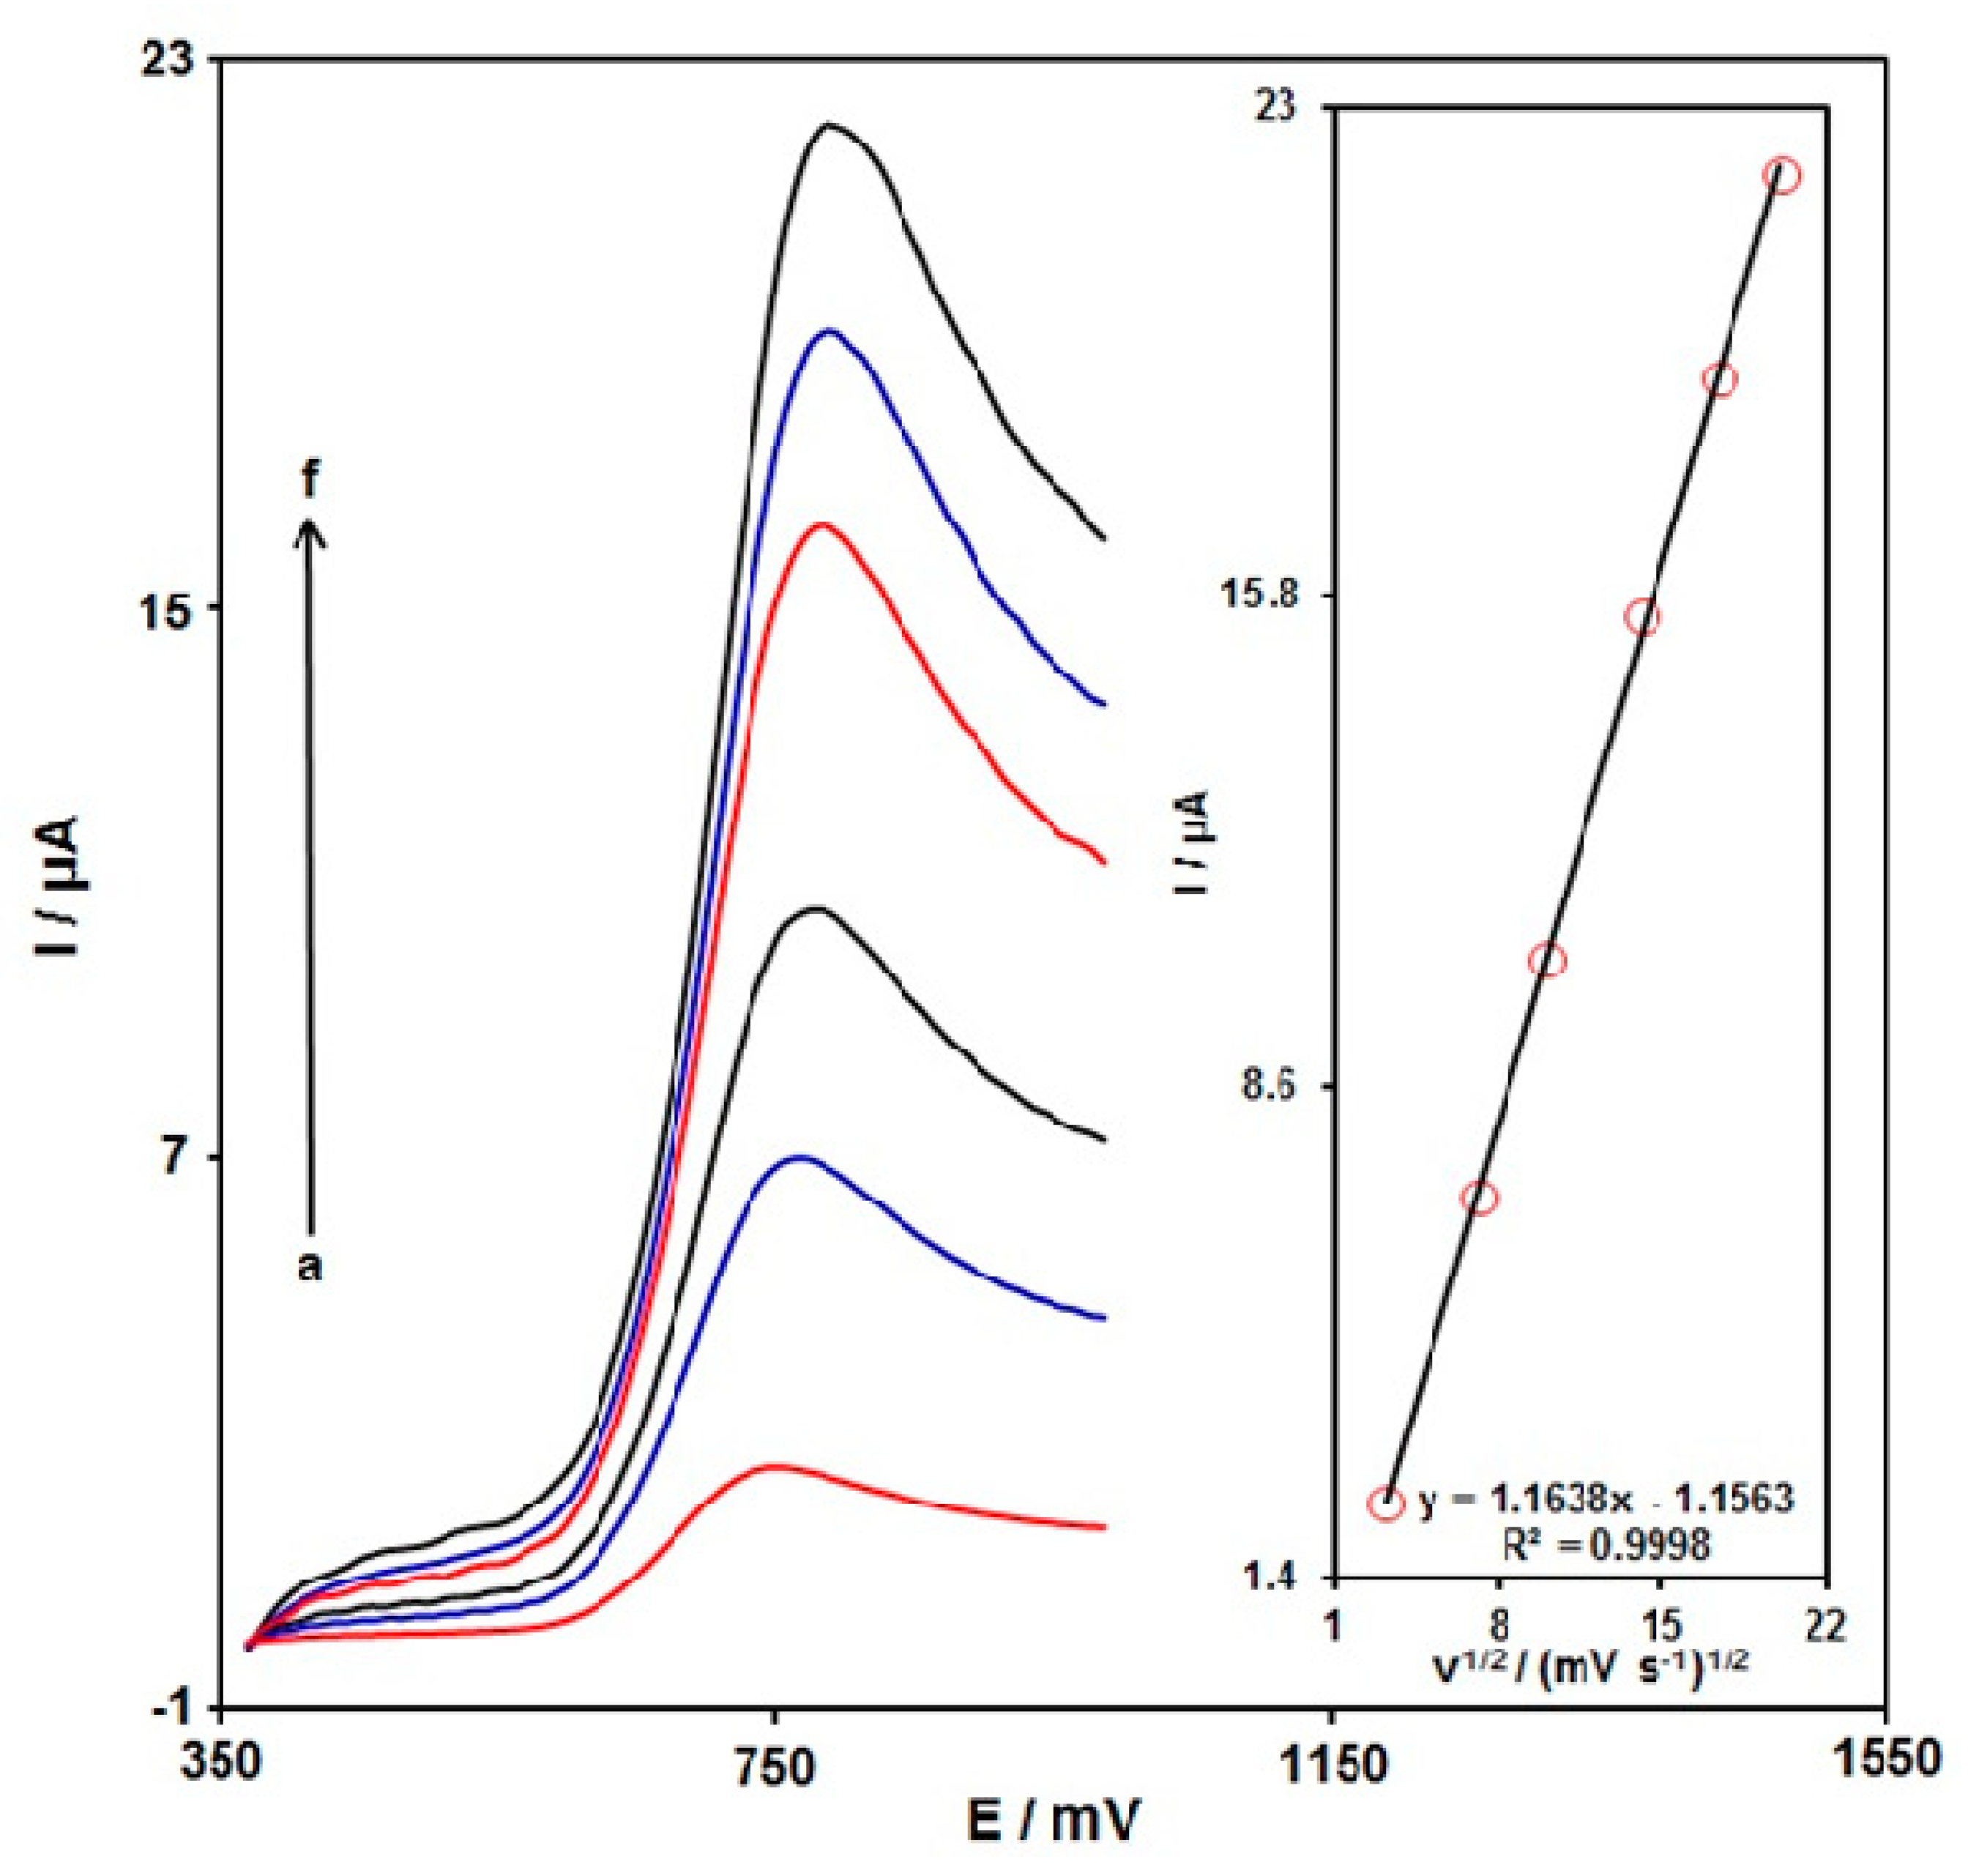
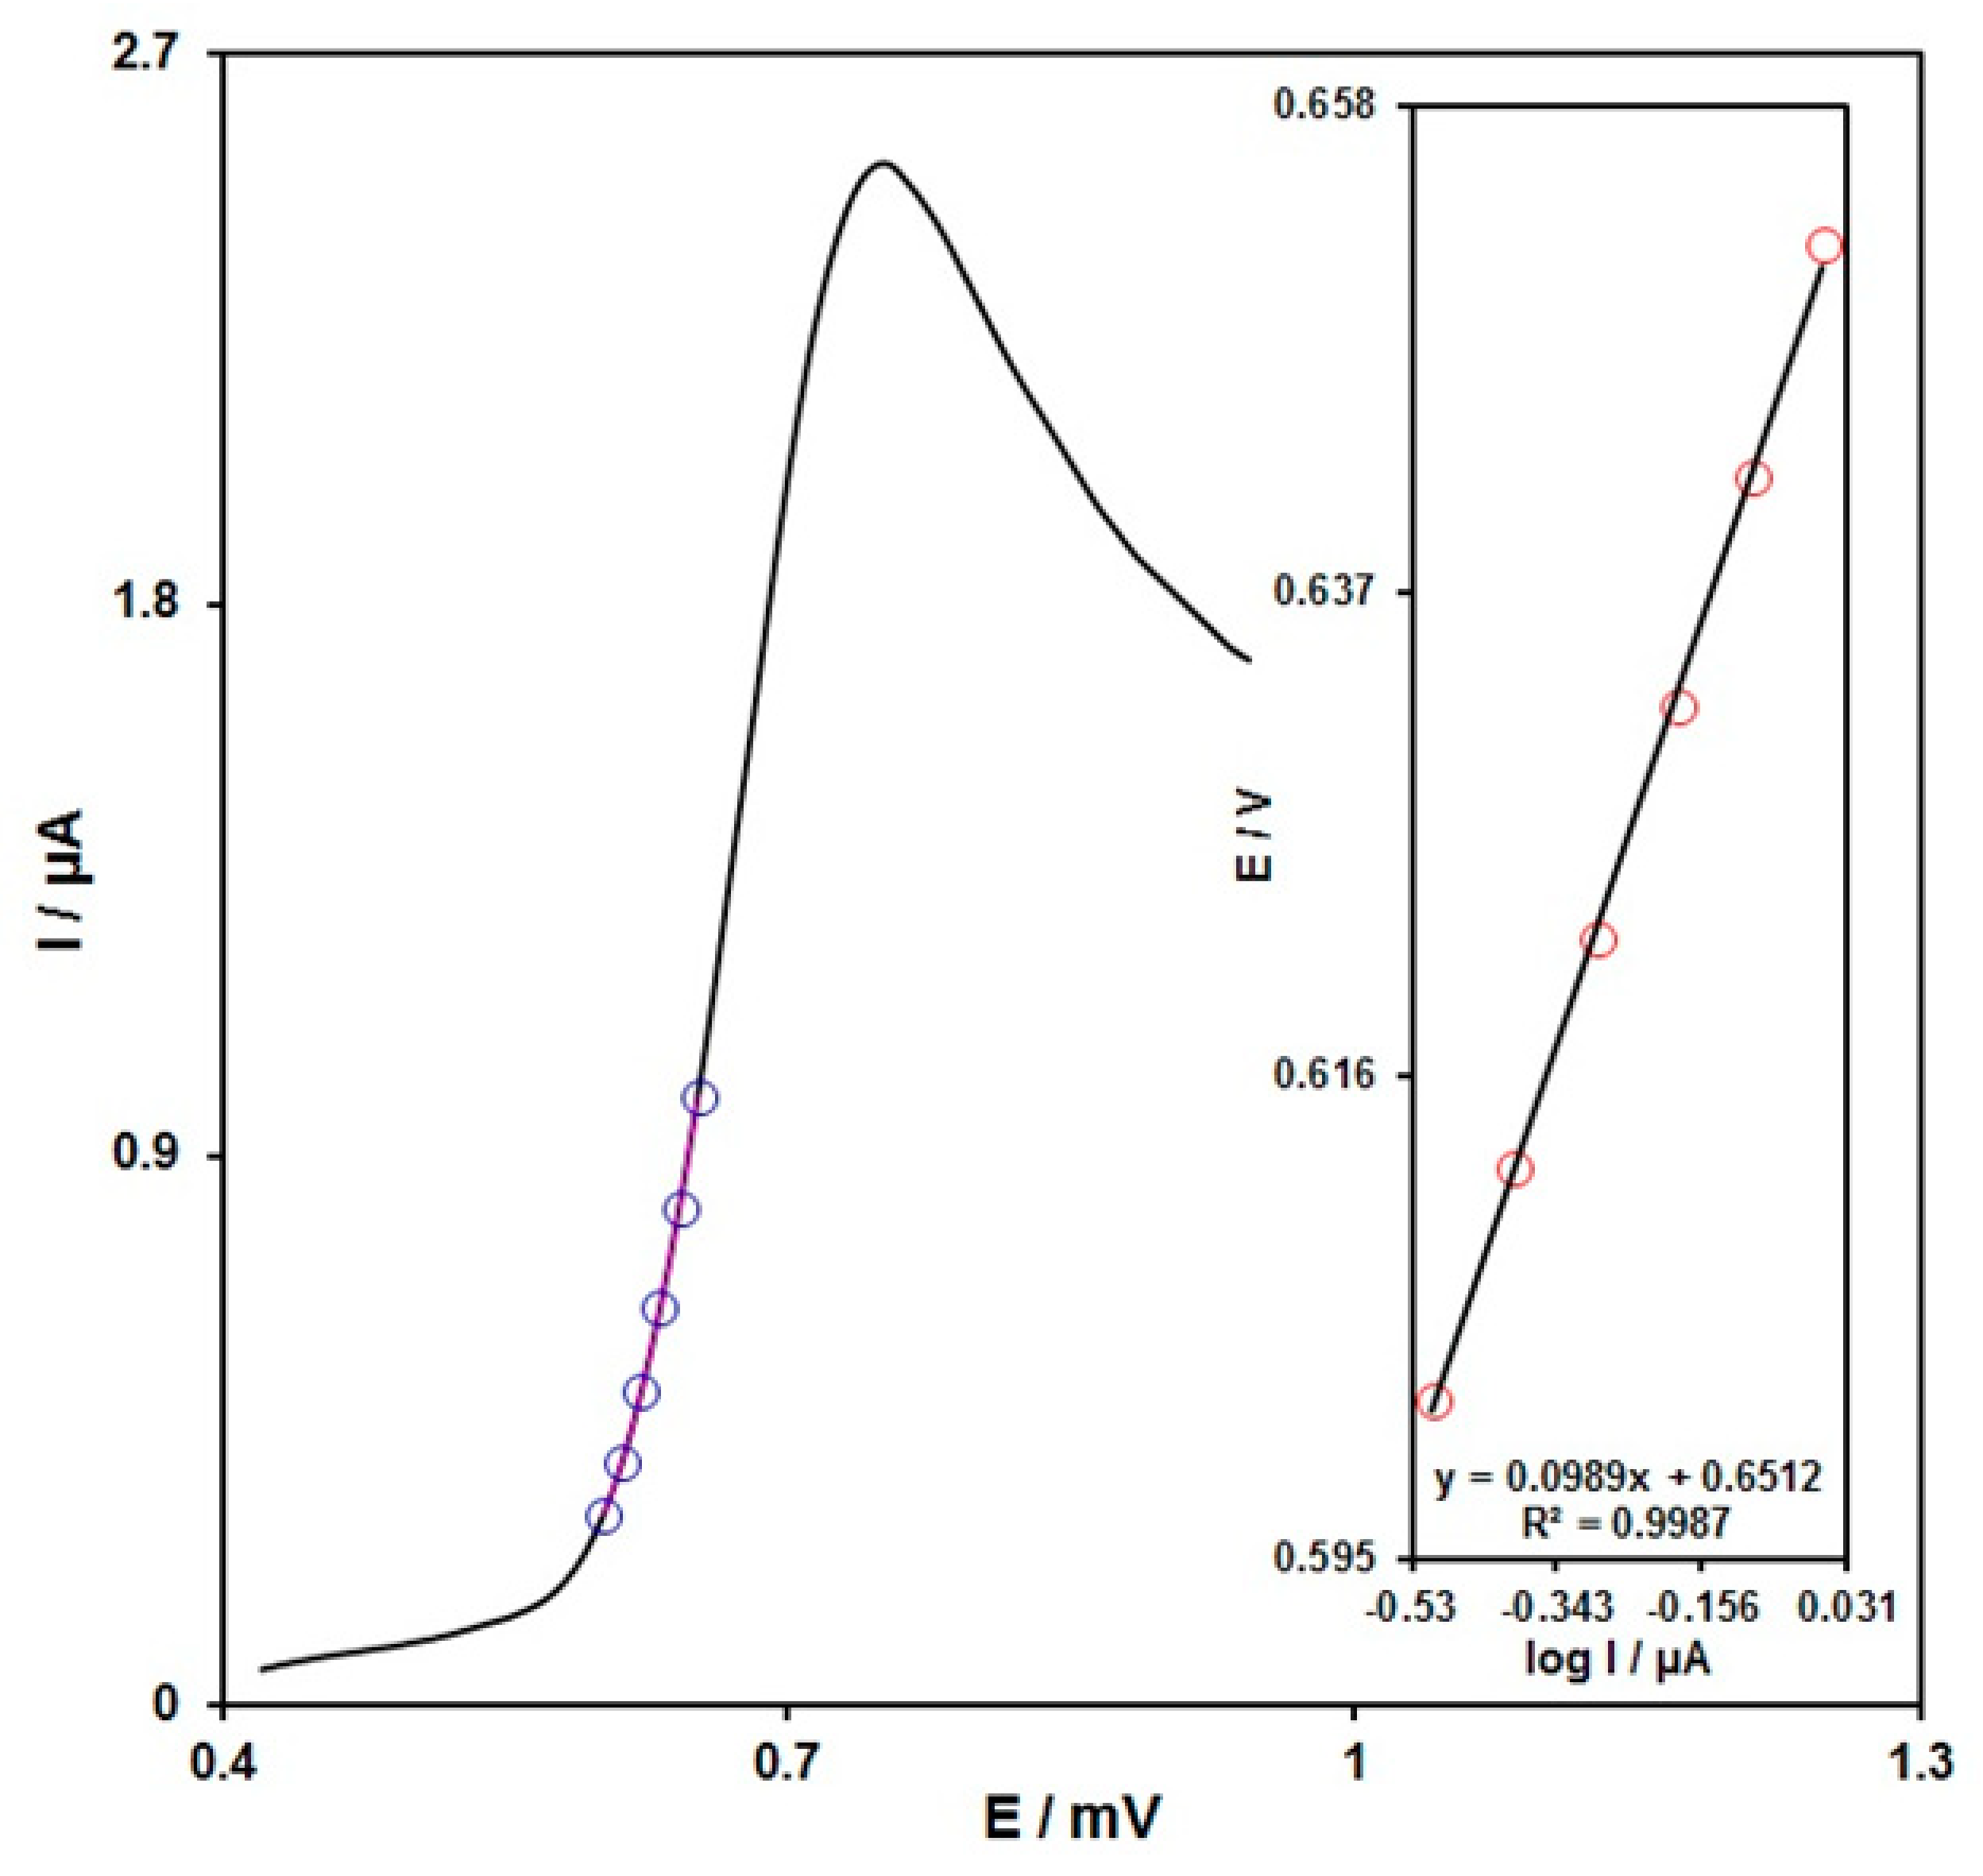
3.3. Effect of Scan Rate

Figure 5 shows the use of LSV to determine the scan rate influence on the INZ oxidation electrocatalytically on the MoS2 NSs-SPE. As seen in Figure 5, the peak potential of oxidation was towards more positive directions by elevating the scan rate, which means the kinetic restriction in electrochemical process. The peak height (Ip) plot versus the scan rate square root (ν1/2) was linear ranging from 10 mV/s to 400 mV/s, which means the diffusion process is the main mechanism.
To study the rate-determining step as shown in Figure 6, the data related to the rising section of current vs. voltage curve obtained at 10 mV/s scan rate were applied to draw a Tafel plot for 100.0 μM of INZ. The linearity of E versus log I plot reveals the kinetics of the electrode process. The slope obtained from this plot was utilized to compute the electrons transfer number in the rate-determining step. Figure 6 illustrates the Tafel slope of 0.0989 V for a linear part of the plot, underlining the rate-limiting step of one-electron transfer having a transfer coefficient (α) of 0.4.

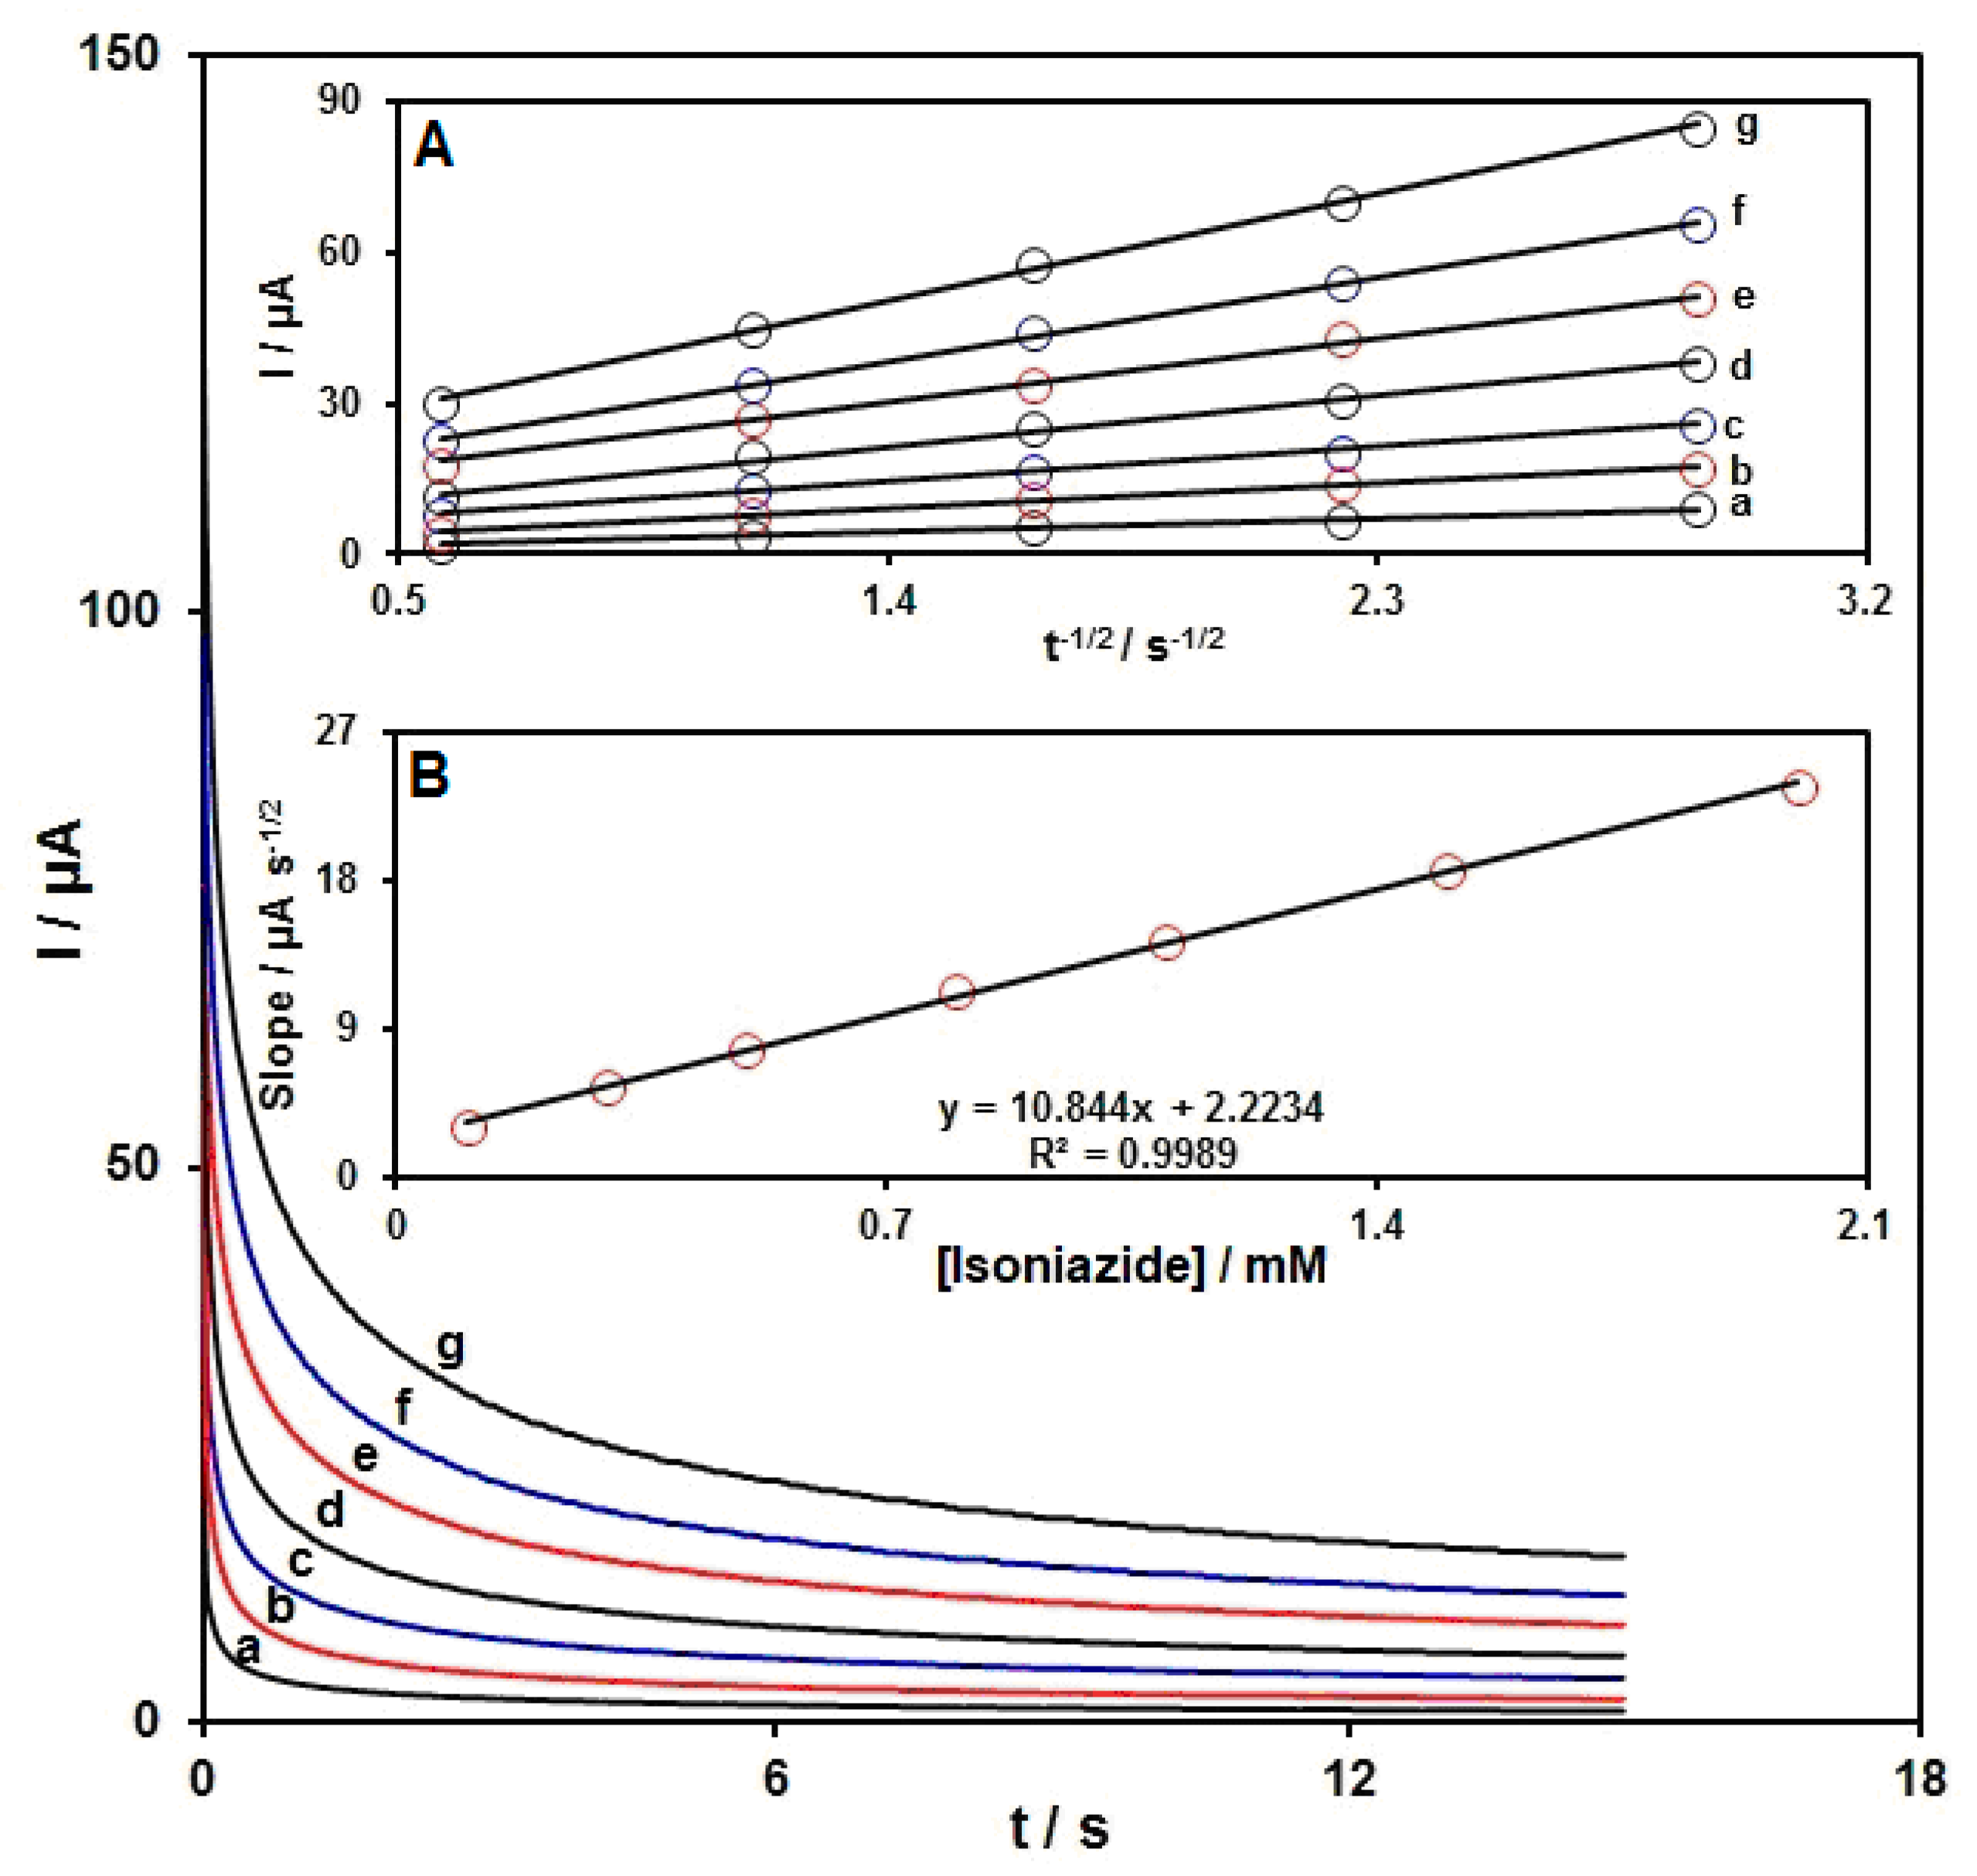
3.4. Chronoamperometric Measurement

Chronoamperometric determinations of INZ on the MoS2 NSs-SPE surface were done by adjusting the potential of the working electrode at 810 mV (Figure 7). The findings from various INZ contents in PBS (at a pH value of 7.0) are depicted in Figure 8. The chronoamperometric measurement of electroactive moieties under the limited conditions of mass transfer was based on the Cottrell equation as follows:
I = nFAD 1/2Cbπ−1/2t−1/2
In this equation, D stands for the diffusion coefficient (cm2/s) and Cb for the bulk concentration (mol/cm3). The I plot against t−1/2 was on the basis of empirical data (Figure 7A), with the optimal fits for various INZ contents. Then, the slopes from straight lines (Figure 7A) were drawn against INZ content (Figure 7B). At last, the slope from the plot in Figure 7B and the Cottrell equation were applied to calculate the mean D value, which was 1.0 × 10⁻⁵ cm2/s.

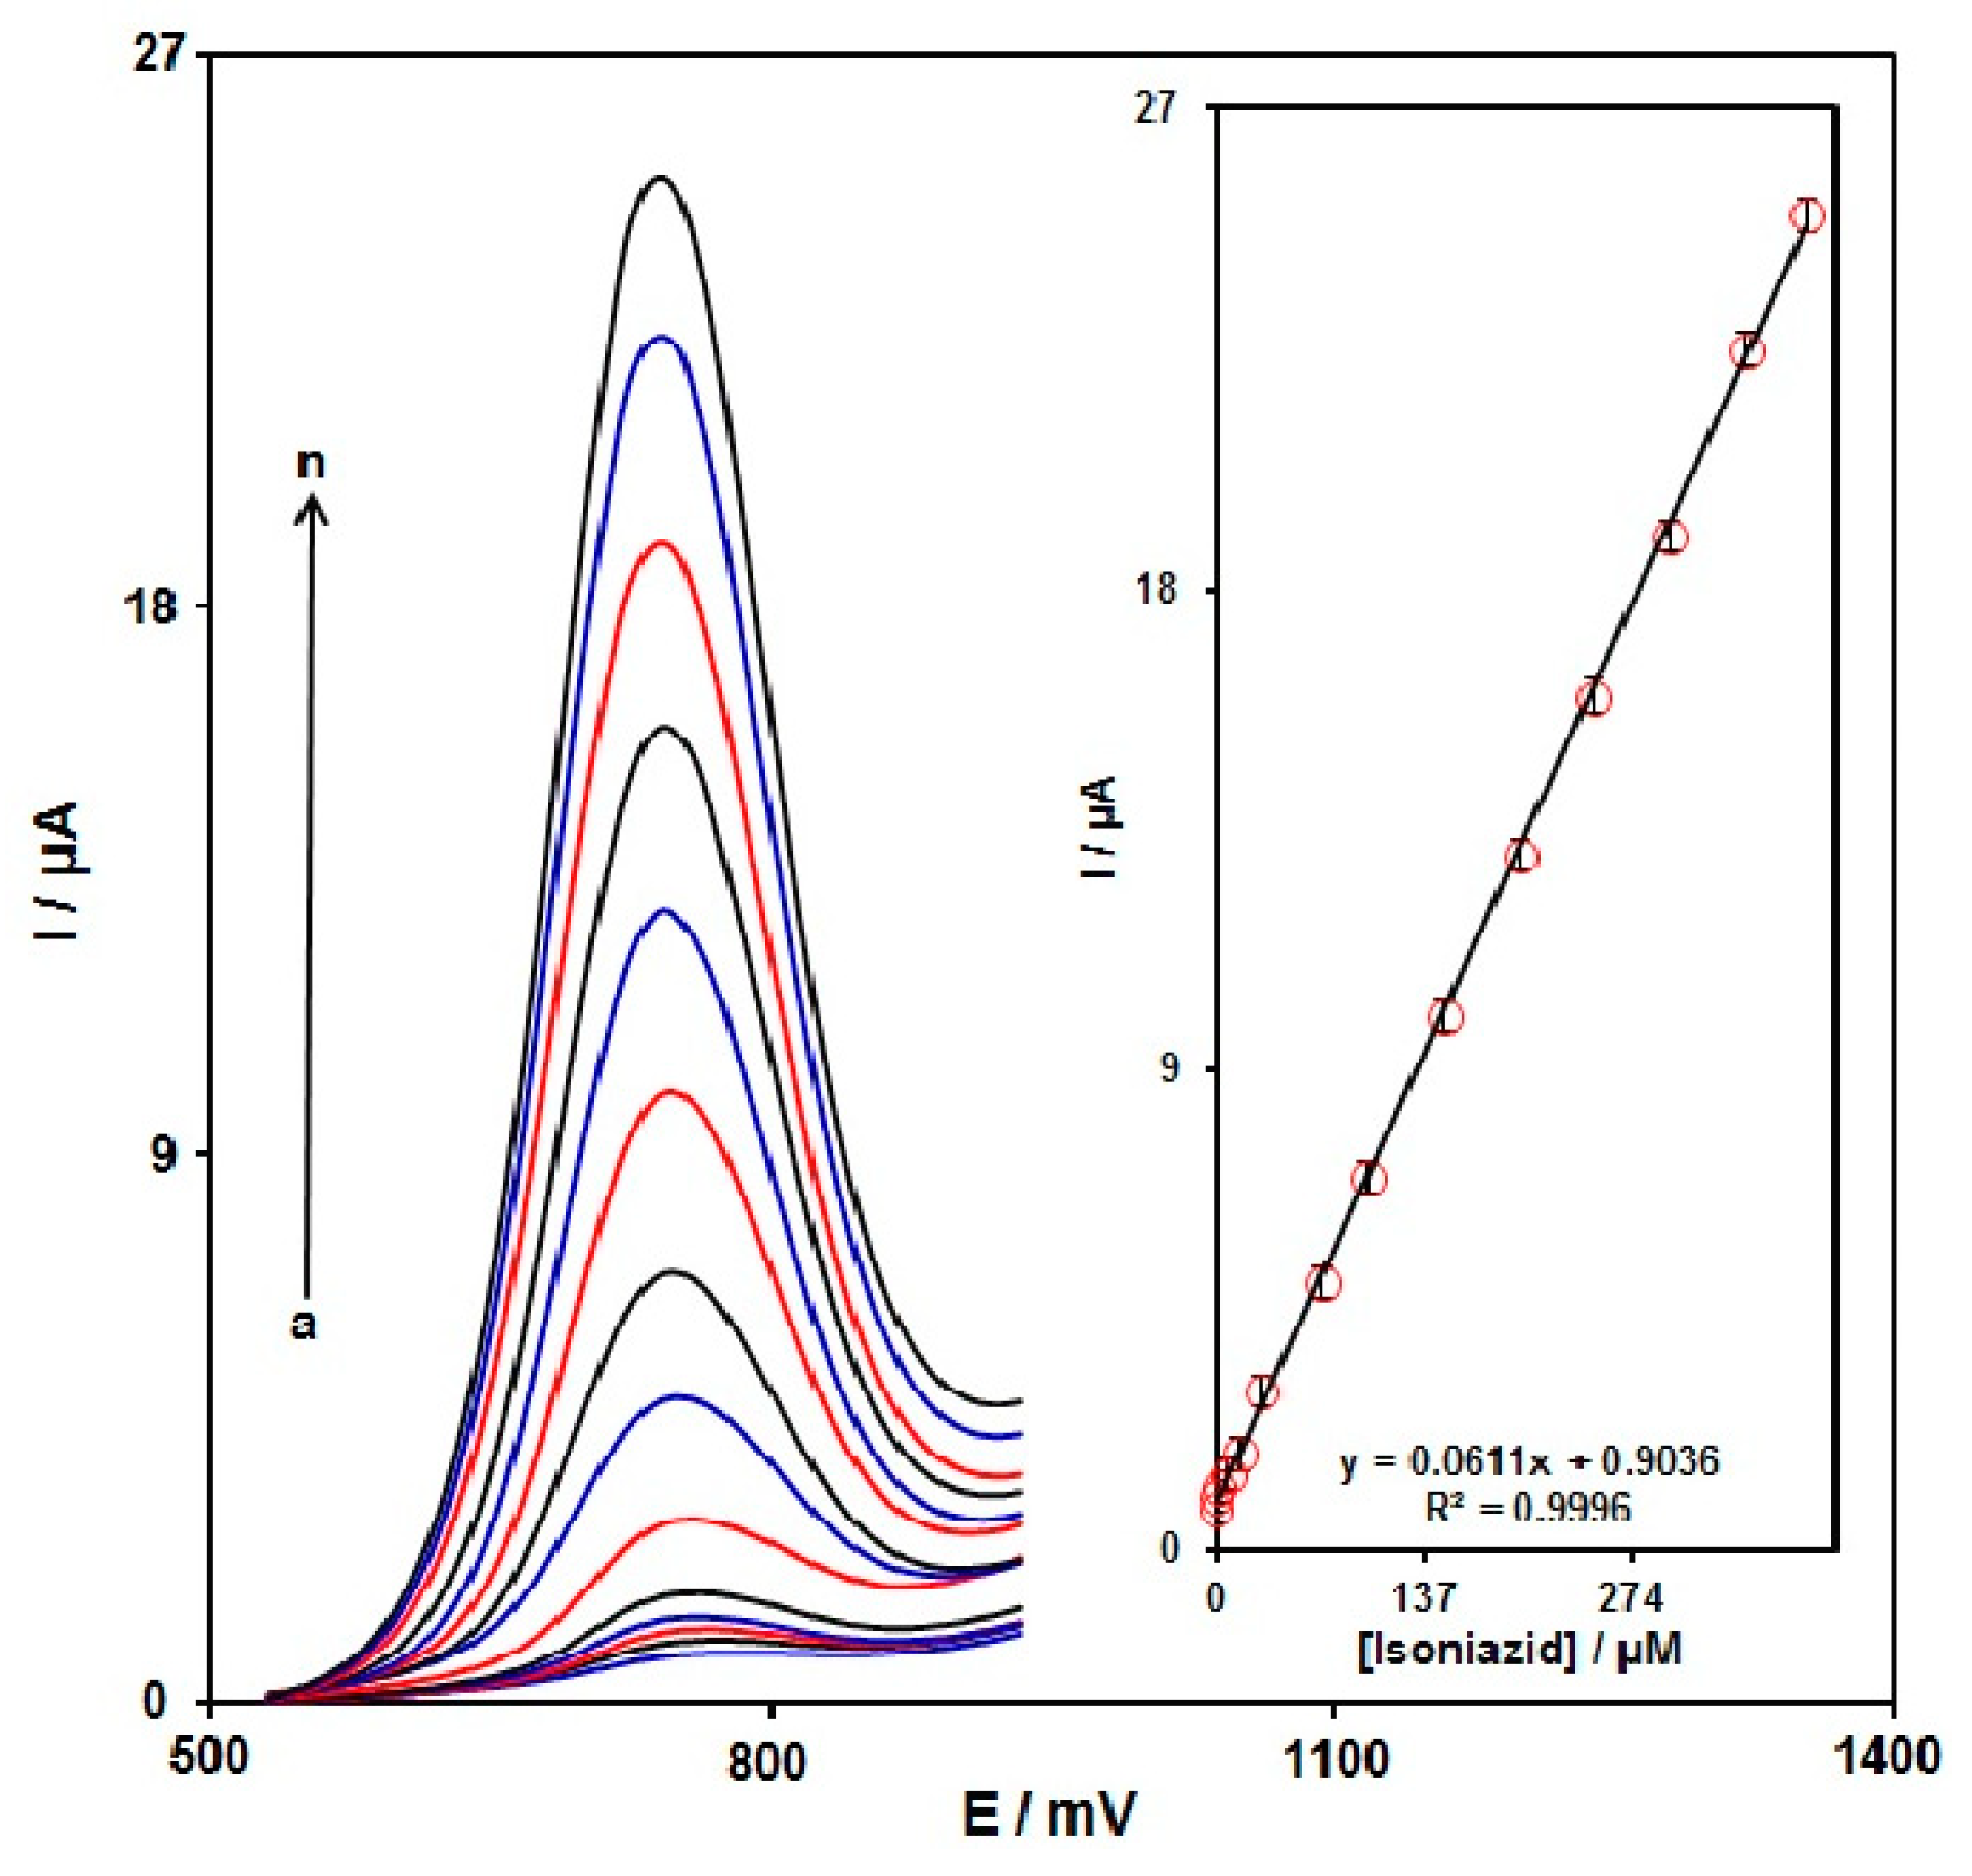
3.5. DPV Detection of INZ on the Developed Sensor Surface

DPV can increase sensitivity and better features for analytical purposes. Therefore, the voltammetric sensor of MoS2 NSs-SPE towards INZ detection was investigated by DPV. Figure 8 shows the DPV curves of INZ with various concentrations in PBS (0.1 M, pH 7.0) solution. Based on Figure 8, the anodic peak currents exhibited linear elevation with various INZ contents (0.035–390.0 μM). The LOD was estimated 10.0 nM. The LOD and linear range of INZ at MoS2 NSs-SPE electrode presented in this work were compared with the reported modified electrodes and are provided in Table 1.

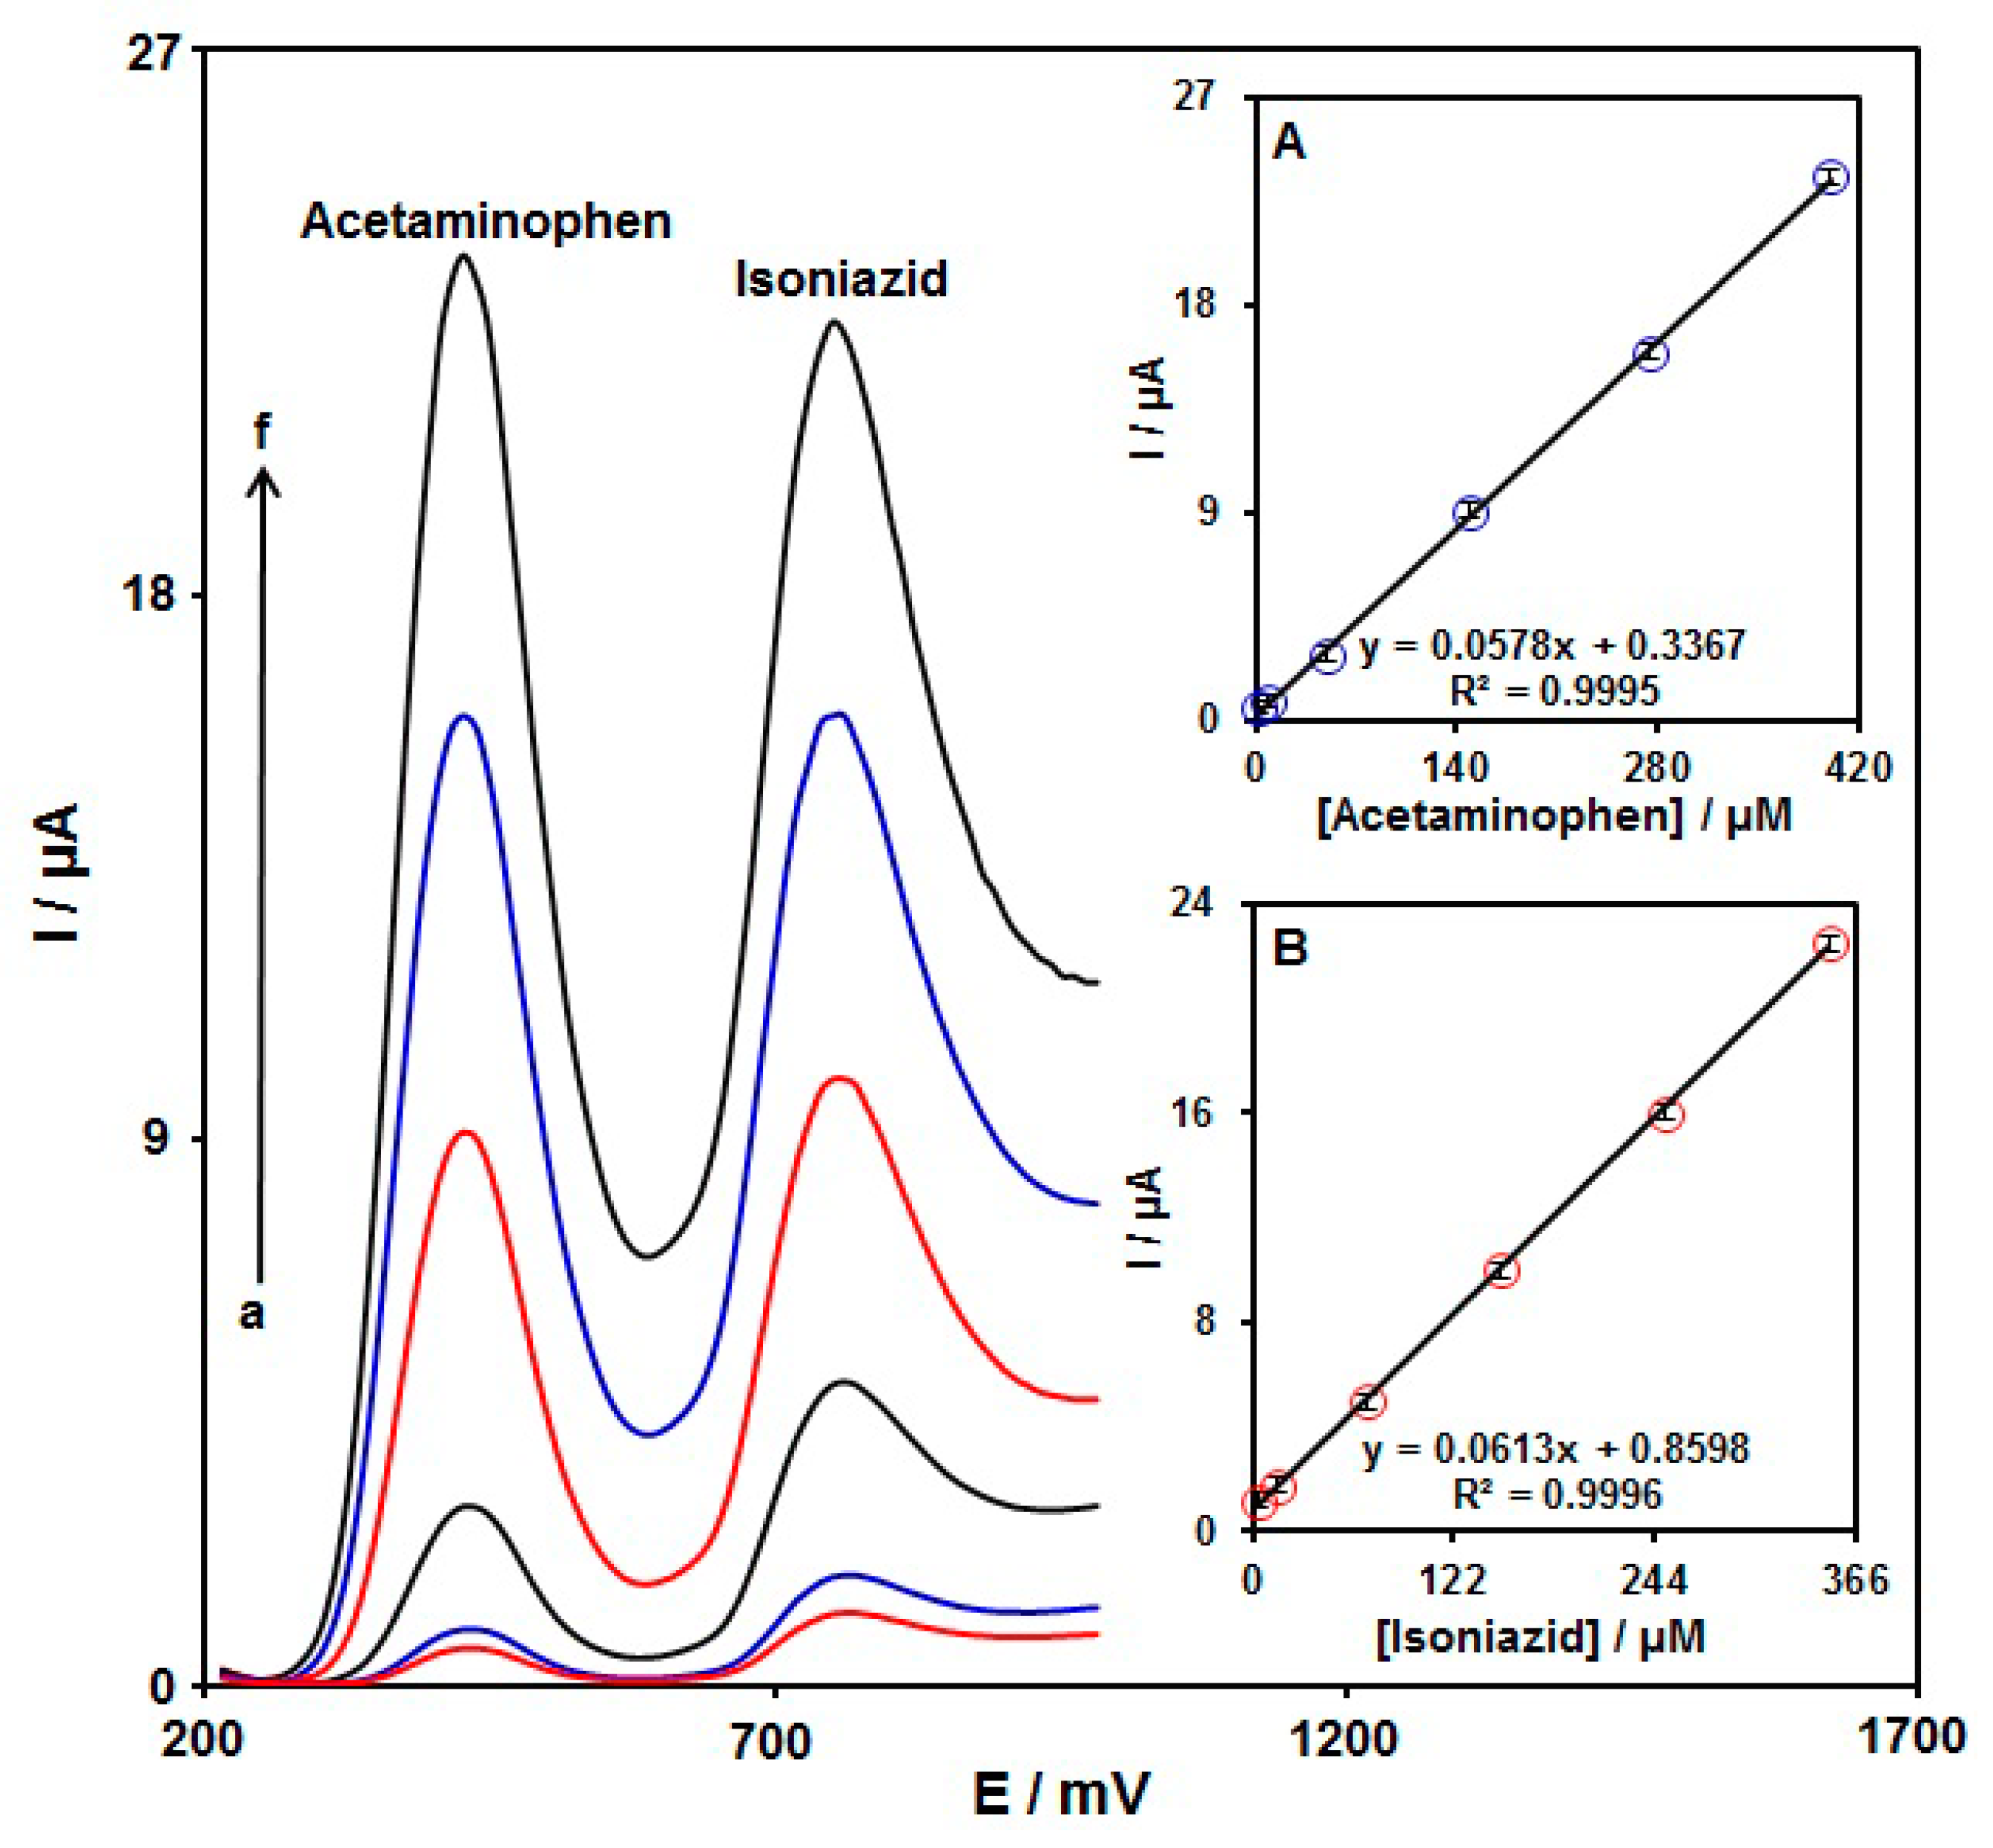
3.6. Determination of INZ in Combination with AC on MoS2 NSs-SPE

The DPVs for the detection of INZ in combination with AC via MoS2 NSs-SPE are presented in Figure 9. The peaks at 440 and 760 V were related to the AC and INZ oxidation, respectively. The peak current intensity was linearly elevated for both analytes by simultaneously elevating their concentrations. Figure 9 (insets A and B) shows the corresponding calibration curves for AC and INZ. The slope from the linear regression line for the calibration curve of INZ (0.0613 μA μM−1) was nearly equal to that without AC (0.0611 μA/μM−1, Section 3.5), highlighting the applicability of MoS2 NSs-SPE for detection of the concentrations of INZ and AC simultaneously.

3.7. Stability

The DPV method was used to test the stability of MoS2 NSs-SPE in ambient conditions. Based on the observations, the peak current of the INZ (50.0 μM) on the modified electrode maintained 96.5% of its initial current after one week, 94.7% after two weeks, and 92.6% after four weeks, which demonstrates the exceptional long-term stability of the produced sensor.

3.8. Interference Studies

The possible interfering effect of some potentially coexisting species with INZ in real samples was investigated. The results showed that the presence of an 800-fold concentration of Na+, Mg2+, Cl, and NO3; 500-fold concentration of glucose, Zn2+, Al3+, CO32−, and SO42−; and a 150-fold concentration of dopamine, ascorbic acid, uric acid, and sodium citrate caused signal changes less than ±5% for 50.0 μM INZ. However, cysteine and tryptophan with two-folds excess showed interferences. The interference experiment showed that the MoS2 NSs-SPE has good selectivity for determination of INZ.

3.9. Real Sample Analysis

The applicability of the as-developed MoS2 NSs-SPE towards the detection of INZ and AC was tested for INZ tablets, AC tablets, and urine specimens using the standard addition method (Table 2). According to data, the proposed electrode could preserve its efficiency for sensing INZ and AC in real specimens. As seen, reasonable recovery of INZ and AC and also satisfactory reproducibility were confirmed based on the mean relative standard deviation (RSD).

4. Conclusions

A novel electrochemical sensor on the basis of MoS2-NSs-modified SPE was established for the determination of INZ in the presence of AC. According to the findings, the MoS2 NSs exhibited a huge surface area and an admirable conductivity, thereby providing good electron transfer and unparalleled electrocatalytic performance in INZ and AC oxidation. There were distinct INZ and AC oxidation peaks that predisposed the detection of these two analytes concurrently on MoS2 NSs-SPE. A low cost of production, impressive sensitivity, and narrow limit of detection make this sensor an appropriate candidate for selective determinations of target analytes in clinical and pharmaceutical preparations. The applicability of the as-developed sensor was confirmed by determining the INZ and AC in real tablets and urine specimens, with acceptable recoveries.

Author Contributions

Conceptualization, S.T. and H.B.; methodology, S.T., H.B. and A.A.A.; software, S.T.; validation, F.G.N. and Z.D.; formal analysis, S.T.; investigation, H.B.; resources, S.T.; data curation, F.G.N. and Z.D.; writing—original draft preparation, S.T., H.B. and A.A.A.; writing—review and editing, S.T. and H.B.; visualization, S.T.; supervision, S.T. and H.B.; project administration, S.T.; funding acquisition, S.T. All authors have read and agreed to the published version of the manuscript.

Funding

This study was financially supported by the Research Center of Tropical and Infectious Diseases, Kerman University of Medical Sciences, Kerman, Iran (grant number 400000679 and research ethics committees code of IR.KMU.REC.1400.463).

Institutional Review Board Statement

Not applicable.

Informed Consent Statement

Not applicable.

Data Availability Statement

The data presented in this study are available on request from the corresponding authors.

Conflicts of Interest

The authors declare no conflict of interest.

References

  1. Shabir, G.A. Validation of high-performance liquid chromatography methods for pharmaceutical analysis: Understanding the differences and similarities between validation requirements of the US Food and Drug Administration, the US Pharmacopeia and the International Conference on Harmonization. J. Chromatogr. A 2003, 987, 57–66. [Google Scholar] [PubMed]
  2. Hewitt, E.F.; Lukulay, P.; Galushko, S. Implementation of a rapid and automated high performance liquid chromatography method development strategy for pharmaceutical drug candidates. J. Chromatogr. A 2006, 1107, 79–87. [Google Scholar] [CrossRef] [PubMed]
  3. Römpp, A.; Guenther, S.; Takats, Z.; Spengler, B. Mass spectrometry imaging with high resolution in mass and space (HR2MSI) for reliable investigation of drug compound distributions on the cellular level. Anal. Bioanal. Chem. 2011, 401, 65–73. [Google Scholar] [CrossRef] [PubMed]
  4. Little, J.L.; Wempe, M.F.; Buchanan, C.M. Liquid chromatography–mass spectrometry/mass spectrometry method development for drug metabolism studies: Examining lipid matrix ionization effects in plasma. J. Chromatogr. B 2006, 833, 219–230. [Google Scholar] [CrossRef]
  5. Miller, J.N. Photoluminescence and chemiluminescence methods of drug analysis. J. Pharm. Biomed. Anal. 1983, 1, 525–535. [Google Scholar] [CrossRef]
  6. Koukli, I.I.; Calokerinos, A.C.; Hadjiioannou, T.P. Continuous-flow chemiluminescence determination of acetaminophen by reduction of cerium (IV). Analyst 1989, 114, 711–714. [Google Scholar] [CrossRef]
  7. Haghighi, B.; Bozorgzadeh, S. Flow injection chemiluminescence determination of isoniazid using luminol and silver nanoparticles. Microchem. J. 2010, 95, 192–197. [Google Scholar] [CrossRef]
  8. Yan, X.; Bo, X.; Guo, L. Electrochemical behaviors and determination of isoniazid at ordered mesoporous carbon modified electrode. Sens. Actuators B Chem. 2011, 155, 837–842. [Google Scholar] [CrossRef]
  9. Tajik, S.; Aflatoonian, M.R.; Beitollahi, H.; Skekh Shoaie, I.; Dourandish, Z.; Garkani Nejad, F.; Aflatoonian, B.; Bamorovat, M. Electrocatalytic oxidation and selective voltammetric detection of methyldopa in the presence of hydrochlorothiazide in real samples. Microchem. J. 2020, 158, 105182. [Google Scholar] [CrossRef]
  10. Shahrokhian, S.; Asadian, E. Simultaneous voltammetric determination of ascorbic acid, acetaminophen and isoniazid using thionine immobilized multi-walled carbon nanotube modified carbon paste electrode. Electrochim. Acta 2010, 55, 666–672. [Google Scholar] [CrossRef]
  11. Mohajeri, S.; Dolati, A.; Yazdanbakhsh, K. Synthesis and characterization of a novel non-enzymatic glucose biosensor based on polyaniline/zinc oxide/multi-walled carbon nanotube ternary nanocomposite. J. Electrochem. Sci. Eng. 2019, 9, 207–222. [Google Scholar] [CrossRef] [Green Version]
  12. Chen, C.; Han, Z.; Lei, W.; Ding, Y.; Lv, J.; Xia, M.; Hao, Q. A sensitive electrochemical sensor based on polypyrrole/electrochemically reduced graphene oxide for the determination of imidacloprid. J. Electrochem. Sci. Eng. 2019, 9, 143–152. [Google Scholar] [CrossRef]
  13. Beitollahi, H.; Tajik, S.; Asadi, M.H.; Biparva, P. Application of a modified graphene nanosheet paste electrode for voltammetric determination of methyldopa in urine and pharmaceutical formulation. J. Anal. Sci. Technol. 2014, 5, 29. [Google Scholar] [CrossRef] [Green Version]
  14. El-Maali, N.A. Voltammetric analysis of drugs. Bioelectrochemistry 2004, 64, 99–107. [Google Scholar] [CrossRef] [PubMed]
  15. Karimi-Maleh, H.; Yola, M.L.; Atar, N.; Orooji, Y.; Karimi, F.; Kumar, P.S.; Rouhi, J.; Baghayeri, M. A novel detection method for organophosphorus insecticide fenamiphos: Molecularly imprinted electrochemical sensor based on core-shell Co3O4@ MOF-74 nanocomposite. J. Colloid Interface Sci. 2021, 592, 174–185. [Google Scholar] [CrossRef] [PubMed]
  16. Hayat, A.; Marty, J.L. Disposable screen printed electrochemical sensors: Tools for environmental monitoring. Sensors 2014, 14, 10432–10453. [Google Scholar] [CrossRef] [PubMed] [Green Version]
  17. Morrin, A.; Killard, A.J.; Smyth, M.R. Electrochemical characterization of commercial and home-made screen-printed carbon electrodes. Anal. Lett. 2003, 36, 2021–2039. [Google Scholar] [CrossRef] [Green Version]
  18. Tajik, S.; Beitollahi, H.; Askari, M.B.; Di Bartolomeo, A. Screen-Printed Electrode Surface Modification with NiCo2O4/RGO Nanocomposite for Hydroxylamine Detection. Nanomaterials 2021, 11, 3208. [Google Scholar] [CrossRef]
  19. Arduini, F.; Amine, A.; Majorani, C.; Di Giorgio, F.; De Felicis, D.; Cataldo, F.; Moscone, D.; Palleschi, G. High performance electrochemical sensor based on modified screen-printed electrodes with cost-effective dispersion of nanostructured carbon black. Electrochem. Commun. 2010, 12, 346–350. [Google Scholar] [CrossRef]
  20. Shahsavari, M.; Mortazavi, M.; Tajik, S.; Sheikhshoaie, I.; Beitollahi, H. Synthesis and Characterization of GO/ZIF-67 Nanocomposite: Investigation of Catalytic Activity for the Determination of Epinine in the Presence of Dobutamine. Micromachines 2022, 13, 88. [Google Scholar] [CrossRef]
  21. Das, R.; Sharma, M.K.; Rao, V.K.; Bhattacharya, B.K.; Garg, I.; Venkatesh, V.; Upadhyay, S. An electrochemical genosensor for Salmonella typhi on gold nanoparticles-mercaptosilane modified screen printed electrode. J. Biotechnol. 2014, 188, 9–16. [Google Scholar] [CrossRef] [PubMed]
  22. Kaleeswarran, P.; Sriram, B.; Wang, S.F.; Baby, J.N.; Arumugam, A.; Bilgrami, A.L.; Hashsham, S.A.; Sayegh, F.A.; Liu, C.J. Electrochemical detection of antipsychotic drug in water samples based on nano/sub-microrod-like CuBi2− xInxO4 electrocatalysts. Microchem. J. 2021, 163, 105886. [Google Scholar] [CrossRef]
  23. Karimi-Maleh, H.; Cellat, K.; Arıkan, K.; Savk, A.; Karimi, F.; Şen, F. Palladium–Nickel nanoparticles decorated on Functionalized-MWCNT for high precision non-enzymatic glucose sensing. Mater. Chem. Phys. 2020, 250, 123042. [Google Scholar] [CrossRef]
  24. Tajik, S.; Beitollahi, H.; Shahsavari, S.; Garkani Nejad, F. Simultaneous and selective electrochemical sensing of methotrexate and folic acid in biological fluids and pharmaceutical samples using Fe3O4/ppy/Pd nanocomposite modified screen printed graphite electrode. Chemosphere 2021, 291, 132736. [Google Scholar] [CrossRef] [PubMed]
  25. Mehmandoust, M.; Erk, N.; Karaman, C.; Karimi, F.; Salmanpour, S. Sensitive and selective electrochemical detection of epirubicin as anticancer drug based on nickel ferrite decorated with gold nanoparticles. Micromachines 2021, 12, 1334. [Google Scholar] [CrossRef] [PubMed]
  26. Beitollahi, H.; Dourandish, Z.; Tajik, S.; Ganjali, M.R.; Norouzi, P.; Faridbod, F. Application of graphite screen printed electrode modified with dysprosium tungstate nanoparticles in voltammetric determination of epinephrine in the presence of acetylcholine. J. Rare Earths 2018, 36, 750–757. [Google Scholar] [CrossRef]
  27. Karimi-Maleh, H.; Arotiba, O.A. Simultaneous determination of cholesterol, ascorbic acid and uric acid as three essential biological compounds at a carbon paste electrode modified with copper oxide decorated reduced graphene oxide nanocomposite and ionic liquid. J. Colloid Interface Sci. 2020, 560, 208–212. [Google Scholar] [CrossRef]
  28. Devi, R.; Gogoi, S.; Barua, S.; Dutta, H.S.; Bordoloi, M.; Khan, R. Electrochemical detection of monosodium glutamate in foodstuffs based on Au@ MoS2/chitosan modified glassy carbon electrode. Food Chem. 2019, 276, 350–357. [Google Scholar] [CrossRef]
  29. Sadeghi, H.; Shahidi, S.A.; Naghizadeh Raeisi, S.; Ghorbani-HasanSaraei, A.; Karimi, F. Electrochemical Determination of Folic Acid in Fruit Juices Samples Using Electroanalytical Sensor Amplified with CuO/SWCNTs and 1-Butyl-2, 3-dimethylimidazolium Hexafluorophosphate. Chem. Methodol. 2020, 4, 743–753. [Google Scholar]
  30. Beitollahi, H.; Raoof, J.B.; Hosseinzadeh, R. Electroanalysis and simultaneous determination of 6-thioguanine in the presence of uric acid and folic acid using a modified carbon nanotube paste electrode. Anal. Sci. 2011, 27, 991. [Google Scholar] [CrossRef] [Green Version]
  31. Tahernejad-Javazmi, F.; Shabani-Nooshabadi, M.; Karimi-Maleh, H. 3D reduced graphene oxide/FeNi3-ionic liquid nanocomposite modified sensor; an electrical synergic effect for development of tert-butylhydroquinone and folic acid sensor. Compos. B Eng. 2019, 172, 666–670. [Google Scholar] [CrossRef]
  32. Moghaddam, A.; Zamani, H.A.; Karimi-Maleh, H. A New Sensing Strategy for Determination of Tamoxifen Using Fe3O4/Graphene-Ionic Liquid Nanocomposite Amplified Paste Electrode. Chem. Methodol. 2021, 5, 373–380. [Google Scholar]
  33. Moshirian-Farahi, S.S.; Zamani, H.A.; Abedi, M. Nano-molar level determination of isoprenaline in pharmaceutical and clinical samples: A nanostructure electroanalytical strategy. Eurasian Chem. Commun. 2020, 2, 702–711. [Google Scholar] [CrossRef] [Green Version]
  34. Beitollahi, H.; Dourandish, Z.; Tajik, S.; Mohammadzadeh Jahani, P. Application of Conductive Polymer Nanocomposites. Am. Chem. Soc. 2022, 1405, 313–344. [Google Scholar]
  35. Zhang, Y.; Li, X.; Li, D.; Wei, Q. A laccase based biosensor on AuNPs-MoS2 modified glassy carbon electrode for catechol detection. Colloids Surf. B Biointerfaces 2020, 186, 110683. [Google Scholar] [CrossRef] [PubMed]
  36. Li, Y.; Mei, S.; Liu, S.; Hun, X. A photoelectrochemical sensing strategy based on single-layer MoS2 modified electrode for methionine detection. J. Pharm. Biomed. Anal. 2019, 165, 94–100. [Google Scholar] [CrossRef] [PubMed]
  37. Sagar, P.; Srivastava, M.; Prakash, R.; Srivastava, S.K. The fabrication of an MoS2 QD–AuNP modified screen-printed electrode for the improved electrochemical detection of cefixime. Anal. Methods 2020, 12, 3014–3024. [Google Scholar] [CrossRef]
  38. Ganguly, A.; Benson, J.; Papakonstantinou, P. Sensitive chronocoulometric detection of miRNA at screen-printed electrodes modified by gold-decorated MoS2 nanosheets. ACS Appl. Bio Mater. 2018, 1, 1184–1194. [Google Scholar] [CrossRef] [Green Version]
  39. Villa-Manso, A.M.; Revenga-Parra, M.; Vera-Hidalgo, M.; Sulleiro, M.V.; Pérez, E.M.; Lorenzo, E.; Pariente, F. 2D MoS2 nanosheets and hematein complexes deposited on screen-printed graphene electrodes as an efficient electrocatalytic sensor for detecting hydrazine. Sens. Actuators B Chem. 2021, 345, 130385. [Google Scholar] [CrossRef]
  40. Li, H.; Lu, G.; Yin, Z.; He, Q.; Li, H.; Zhang, Q.; Zhang, H. Optical identification of single-and few-layer MoS2 sheets. Small 2012, 8, 682–686. [Google Scholar] [CrossRef]
  41. Mak, K.F.; Lee, C.; Hone, J.; Shan, J.; Heinz, T.F. Atomically thin MoS2: A new direct-gap semiconductor. Phys. Rev. Lett. 2010, 105, 136805. [Google Scholar] [CrossRef] [PubMed] [Green Version]
  42. Sinha, A.; Tan, B.; Huang, Y.; Zhao, H.; Dang, X.; Chen, J.; Jain, R. MoS2 nanostructures for electrochemical sensing of multidisciplinary targets: A review. TrAC Trends Anal. Chem. 2018, 102, 75–90. [Google Scholar] [CrossRef]
  43. Cao, F.; Dong, Q.; Li, C.; Chen, J.; Ma, X.; Huang, Y.; Song, D.; Ji, C.; Lei, Y. Electrochemical sensor for detecting pain reliever/fever reducer drug acetaminophen based on electrospun CeBiOx nanofibers modified screen-printed electrode. Sens. Actuators B Chem. 2018, 256, 143–150. [Google Scholar] [CrossRef]
  44. Tao, T.; Gao, N.; He, H.; Zhou, R.; Tu, B.; Cai, Z.; Ji, X. Au-PEDOT/rGO nanocomposites functionalized graphene electrochemical transistor for ultra-sensitive detection of acetaminophen in human urine. Anal. Chim. Acta 2022, 1191, 339306. [Google Scholar] [CrossRef] [PubMed]
  45. Tahernejad-Javazmi, F.; Shabani-Nooshabadi, M.; Karimi-Maleh, H. Analysis of glutathione in the presence of acetaminophen and tyrosine via an amplified electrode with MgO/SWCNTs as a sensor in the hemolyzed erythrocyte. Talanta 2018, 176, 208–213. [Google Scholar] [CrossRef] [PubMed]
  46. Tseng, T.W.; Chen, T.W.; Chen, S.M.; Kokulnathan, T.; Ahmed, F.; Hasan, P.M.Z.; Bilgrami, A.L.; Kumar, S. Construction of strontium phosphate/graphitic-carbon nitride: A flexible and disposable strip for acetaminophen detection. J. Hazard. Mater. 2021, 410, 124542. [Google Scholar] [CrossRef]
  47. Sepehri, Z.; Bagheri, H.; Ranjbari, E.; Amiri-Aref, M.; Amidi, S.; Rouini, M.R.; Ardakani, Y.H. Simultaneous electrochemical determination of isoniazid and ethambutol using poly-melamine/electrodeposited gold nanoparticles modified pre-anodized glassy carbon electrode. Ionics 2018, 24, 1253–1263. [Google Scholar] [CrossRef]
  48. Cheemalapati, S.; Palanisamy, S.; Chen, S.M. Electrochemical determination of isoniazid at electrochemically reduced graphene oxide modified electrode. Int. J. Electrochem. Sci. 2013, 8, 3953–3962. [Google Scholar]
  49. Yan, H.; Xiao, H.; Xie, Q.; Liu, J.; Sun, L.; Zhou, Y.; Zhang, Y.; Chao, L.; Chen, C.; Yao, S. Simultaneous electroanalysis of isoniazid and uric acid at poly (sulfosalicylic acid)/electroreduced carboxylated graphene modified glassy carbon electrode. Sens. Actuators B Chem. 2015, 207, 167–176. [Google Scholar] [CrossRef]
  50. Liang, W.; Ren, H.; Li, Y.; Qiu, H.; Ye, B.C. A robust electrochemical sensing based on bimetallic metal-organic framework mediated Mo2C for simultaneous determination of acetaminophen and isoniazid. Anal. Chim. Acta 2020, 1136, 99–105. [Google Scholar] [CrossRef]
  51. Zhang, Y.; Jiang, X.; Zhang, J.; Zhang, H.; Li, Y. Simultaneous voltammetric determination of acetaminophen and isoniazid using MXene modified screen-printed electrode. Biosens. Bioelectron. 2019, 130, 315–321. [Google Scholar] [CrossRef] [PubMed]
  52. Bard, A.J.; Faulkner, L.R. Electrochemical Methods: Fundamentals and Applications, 2nd ed.; John Wiley & Sons: New York, NY, USA, 2001. [Google Scholar]
  53. Zhang, X.; Cao, Q.; Guo, Z.; Zhang, M.; Zhou, M.; Zhai, Z.; Xu, Y. Self-assembly of MoS2 nanosheet on functionalized pomelo peel derived carbon and its electrochemical sensor behavior toward taxifolin. Inorg. Chem. Commun. 2021, 129, 108631. [Google Scholar] [CrossRef]
  54. Lalithambika, K.C.; Shanmugapriya, K.; Sriram, S. Photocatalytic activity of MoS2 nanoparticles: An experimental and DFT analysis. Appl. Phys. A 2019, 125, 817. [Google Scholar] [CrossRef]
  55. Feng, W.; Chen, L.; Qin, M.; Zhou, X.; Zhang, Q.; Miao, Y.; Qiu, K.; Zhang, Y.; He, C. Flower-like PEGylated MoS2 nanoflakes for near-infrared photothermal cancer therapy. Sci. Rep. 2015, 5, 17422. [Google Scholar] [CrossRef] [PubMed] [Green Version]
  56. Absalan, G.; Akhond, M.; Soleimani, M.; Ershadifar, H. Efficient electrocatalytic oxidation and determination of isoniazid on carbon ionic liquid electrode modified with electrodeposited palladium nanoparticles. J. Electroanal. Chem. 2016, 761, 1–7. [Google Scholar] [CrossRef]
  57. Santos, B.G.; Gonçalves, J.M.; Rocha, D.P.; Higino, G.S.; Yadav, T.P.; Pedrotti, J.J.; Angnes, L. Electrochemical sensor for isoniazid detection by using a WS2/CNTs nanocomposite. Sens. Actuators Rep. 2022, 4, 100073. [Google Scholar] [CrossRef]
  58. Gowthaman, N.S.K.; Kesavan, S.; John, S.A. Monitoring isoniazid level in human fluids in the presence of theophylline using gold@ platinum core@shell nanoparticles modified glassy carbon electrode. Sens. Actuators B Chem. 2016, 230, 157–166. [Google Scholar] [CrossRef]
Figure 1. The SEM images captured for MoS2 NSs.
Micromachines 13 00369 g001
Figure 2. The XRD pattern captured for MoS2 NSs.
Micromachines 13 00369 g002
Figure 3. The FTIR spectrum captured for MoS2 NSs.
Micromachines 13 00369 g003
Figure 4. The CV curves for (curve a) unmodified SPE, and (curve b) MoS2 NSs-SPE in PBS (0.1 M) spiked with INZ (200.0 μM) at the scan rate of 50 mV/s.
Micromachines 13 00369 g004
Figure 5. The LSV curves for INZ (100.0 μM) in PBS (0.1 M, pH 7.0) at different scan rates (10 to 400 mV/s) on MoS2 NSs-SPE (a–f: 10 mV/s, 50 mV/s, 100 mV/s, 200.0 mV/s, 300.0 mV/s, and 400.0 mV/s, respectively). Inset: plot of INZ oxidation peak current against square root of scan rate.
Micromachines 13 00369 g005
Figure 6. The LSV response for INZ (100.0 μM) at the scan rate of 10 mV/s. inset: Tafel plot from rising section or relevant voltammogram.
Micromachines 13 00369 g006
Figure 7. The chronoamperograms obtained on MoS2 NSs-SPE in PBS (0.1 M, pH = 7.0) for various INZ contents; a–g: 0.1 mM, 0.3 mM, 0.5 mM, 0.8 mM, 1.1 mM, 1.5 mM, and 2.0 mM of INZ, respectively. Inset (A): the plot of I against t−1/2 seen by chronoamperograms from a to g. Inset (B): the slope from the plot of straight line against INZ content.
Micromachines 13 00369 g007
Figure 8. The DPV responses of INZ on MoS2 NSs-SPE at various INZ contents (a–n: 0.035 μM, 0.2 μM, 2.5 μM, 7.5 μM, 15.0 μM, 30.0 μM, 70.0 μM, 100.0 μM, 150.0 μM, 200.0 μM, 250.0 μM, 300.0 μM, 350 μM, and 390 μM) in PBS (0.1 M, pH = 7.0). Inset: the relationship of INZ oxidation peak currents and various INZ contents.
Micromachines 13 00369 g008
Figure 9. The DPVs of MoS2 NSs-SPE in PBS (0.1 M, pH = 7.0) with various levels of AC and INZ; a–f: 2.5 µM + 2.5 µM, 7.5 µM + 15.0 µM, 50.0 µM + 70.0 µM, 150.0 µM + 150.0 µM, 275.0 µM + 250.0 µM, and 400.0 µM + 350.0 µM of AC and INZ, respectively. Inset (A): the Ipa plot vs. AC concentration. Inset (B): the Ip plot vs. INZ concentration.
Micromachines 13 00369 g009
Table 1. Comparison of the efficiency of the MoS2 NSs-SPE with literature modified electrodes for INZ determination.
Electrochemical SensorElectrochemical MethodLinear RangeLODRef.
Ordered mesoporous carbon/glassy carbon electrodeAmperometry0.1–370 μM83.5 nM[8]
Electrochemically reduced graphene oxide/glassy carbon electrodeLinear sweep voltammetry2–70 μM0.17 ìM[48]
Palladium nanoparticles/carbon ionic liquid electrodeCyclic voltammetry5–100 μM0.47 ìM[56]
WS2/carbon nanotubes/glassy carbon electrodeDPV10–80 μM0.24 ìM[57]
Au–Pt core-shell nanoparticles/glassy carbon electrodeAmperometry0.05–100 μM29 nM[58]
MoS2 NSs-SPEDPV0.035–390.0 μM10.0 nMThis work
Table 2. Determining AC and INZ in real specimens on MoS2 NSs-SPE. All concentrations are in μM (n = 5).
SampleSpikedFoundRecovery (%)R.S.D. (%)
ACINZACINZACINZACINZ
AC Tablet003.7---3.5-
2.05.05.65.198.2102.02.73.2
3.06.06.85.8101.596.73.11.7
4.07.07.96.9102.698.61.92.9
5.08.08.68.398.8103.72.42.5
INZ Tablet00-3.2---2.9
5.02.04.95.398.0101.92.73.2
7.53.07.76.0102.796.83.12.2
10.04.09.97.599.0104.22.12.4
12.55.012.68.0100.897.61.83.0
Urine00------
5.04.05.13.9102.097.51.63.3
7.06.06.96.198.6101.73.51.9
9.08.09.37.9103.398.72.72.4
11.010.010.710.397.3103.02.22.8
Publisher’s Note: MDPI stays neutral with regard to jurisdictional claims in published maps and institutional affiliations.

