
Force and Velocity Analysis of Particles Manipulated by Toroidal Vortex on Optoelectrokinetic Microfluidic Platform
Abstract
:1. Introduction
2. Theory
2.1. AC Electrothermal
2.2. AC Electroosmosis
2.3. Dielectrophoresis
2.4. Thermophoresis
3. Materials and Methods
3.1. Chip Fabrication
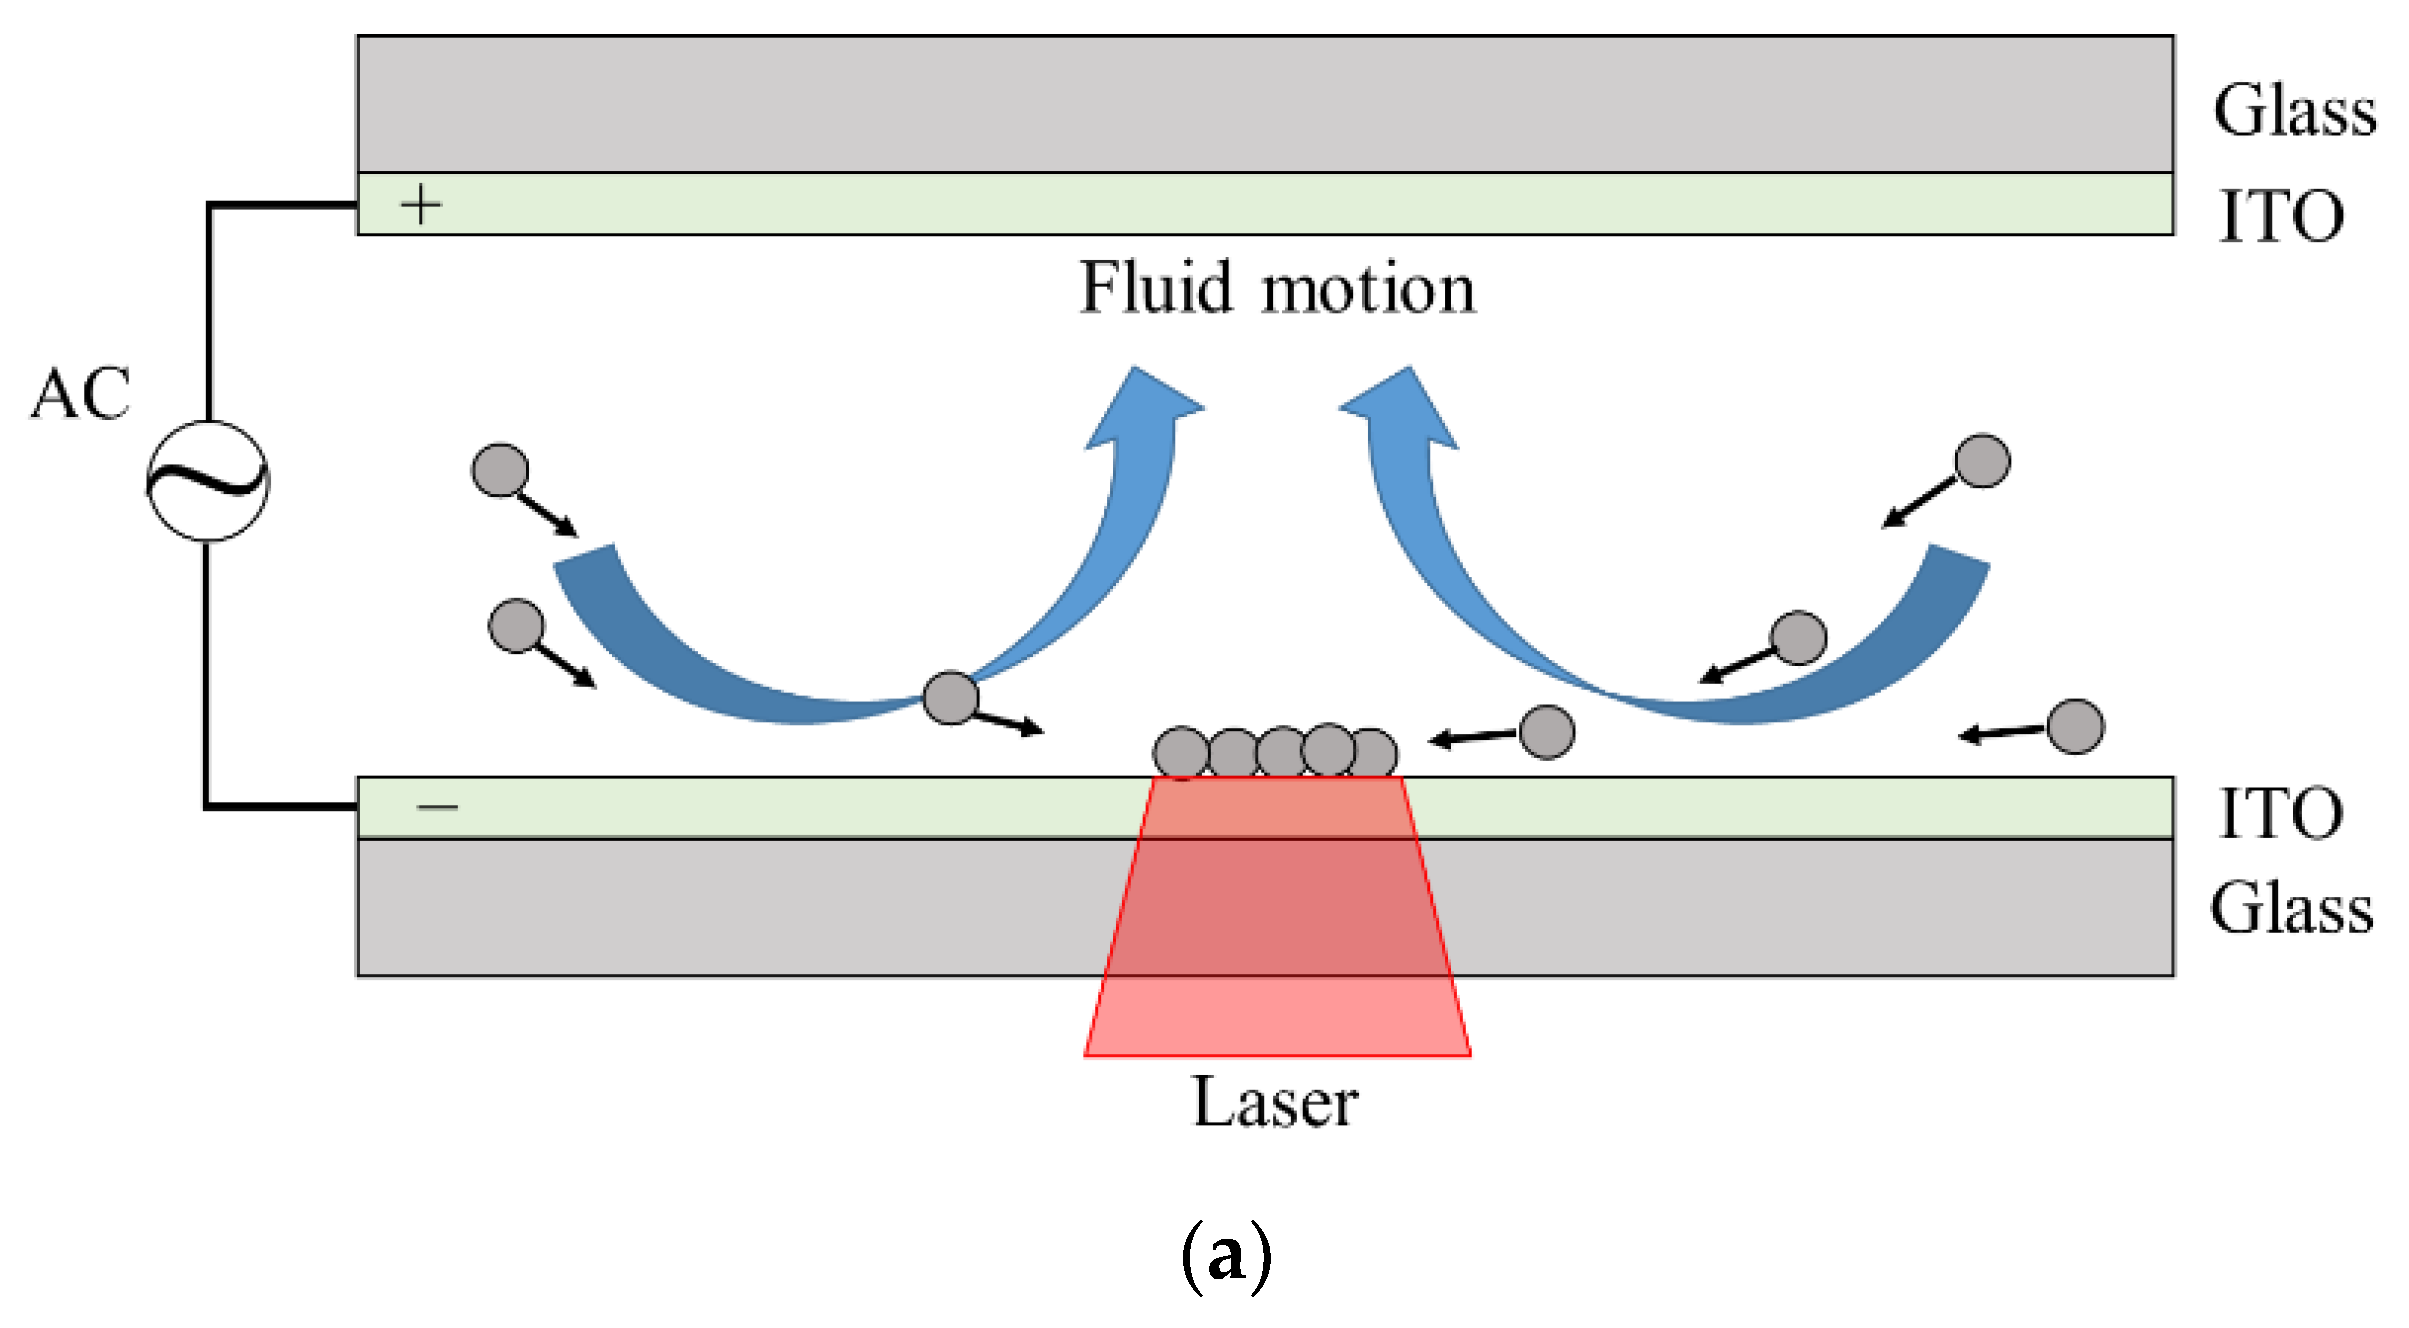
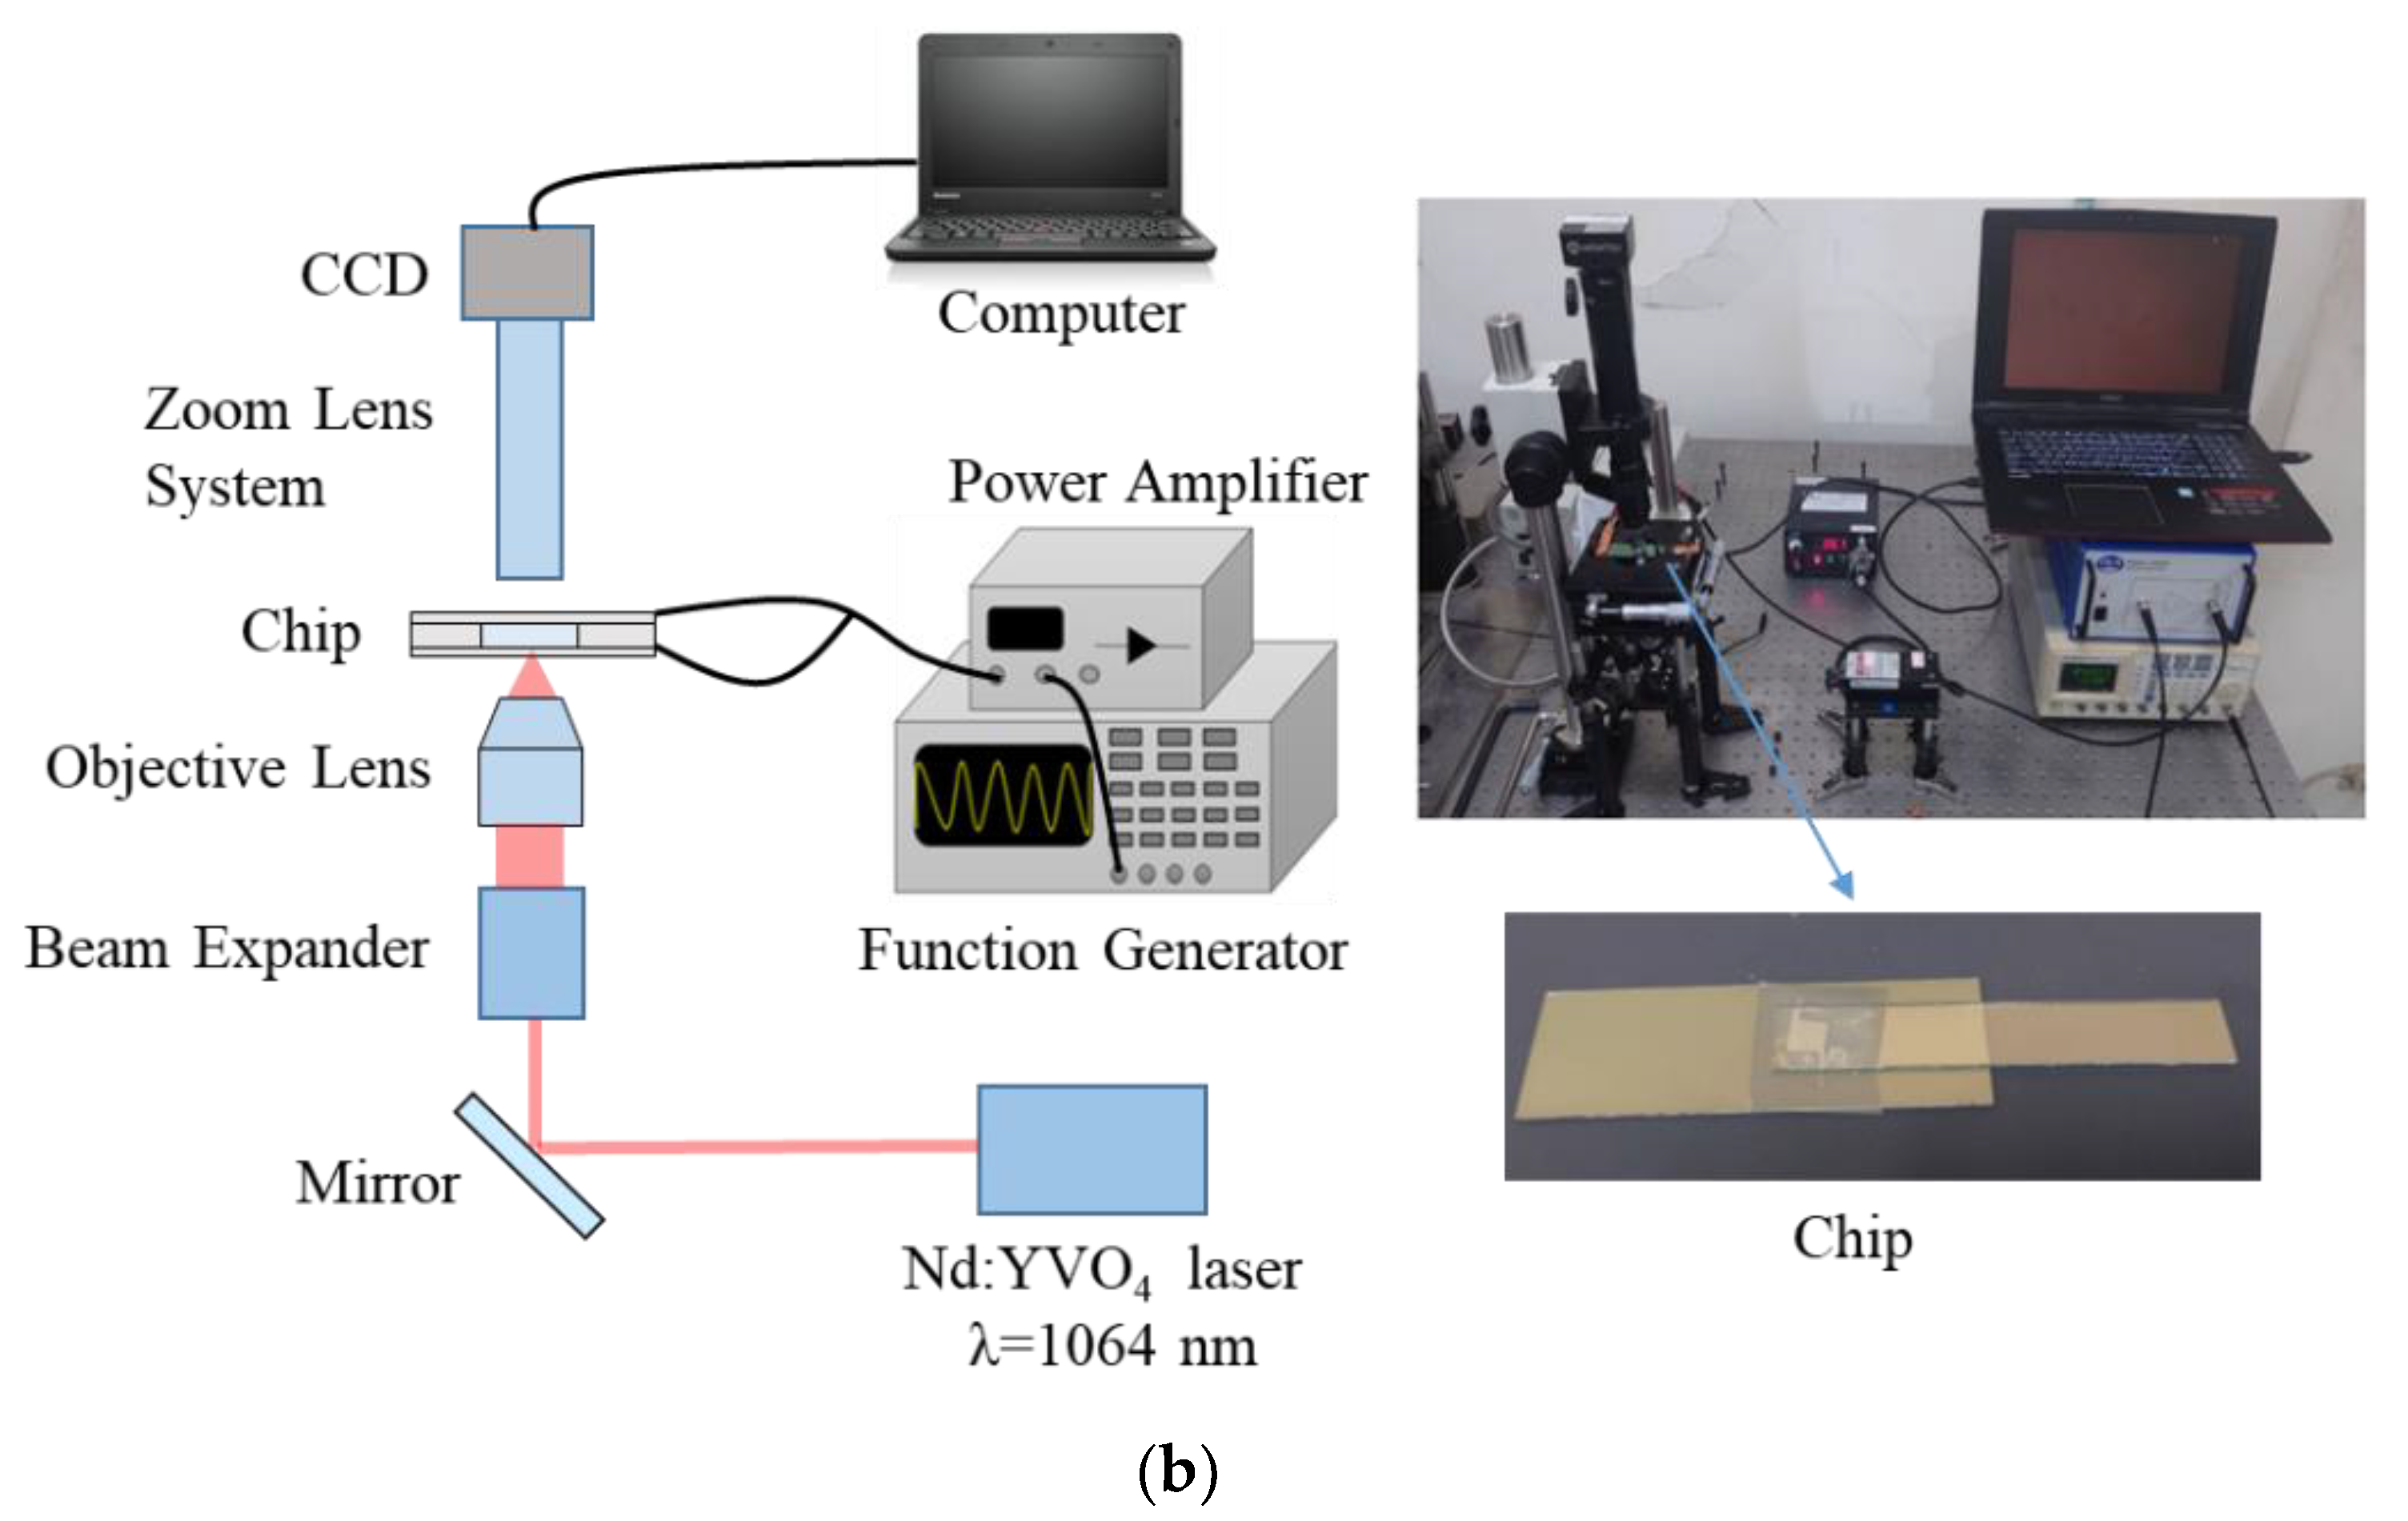
3.2. Experimental Setup
3.3. Numerical Simulations
4. Results and Discussion
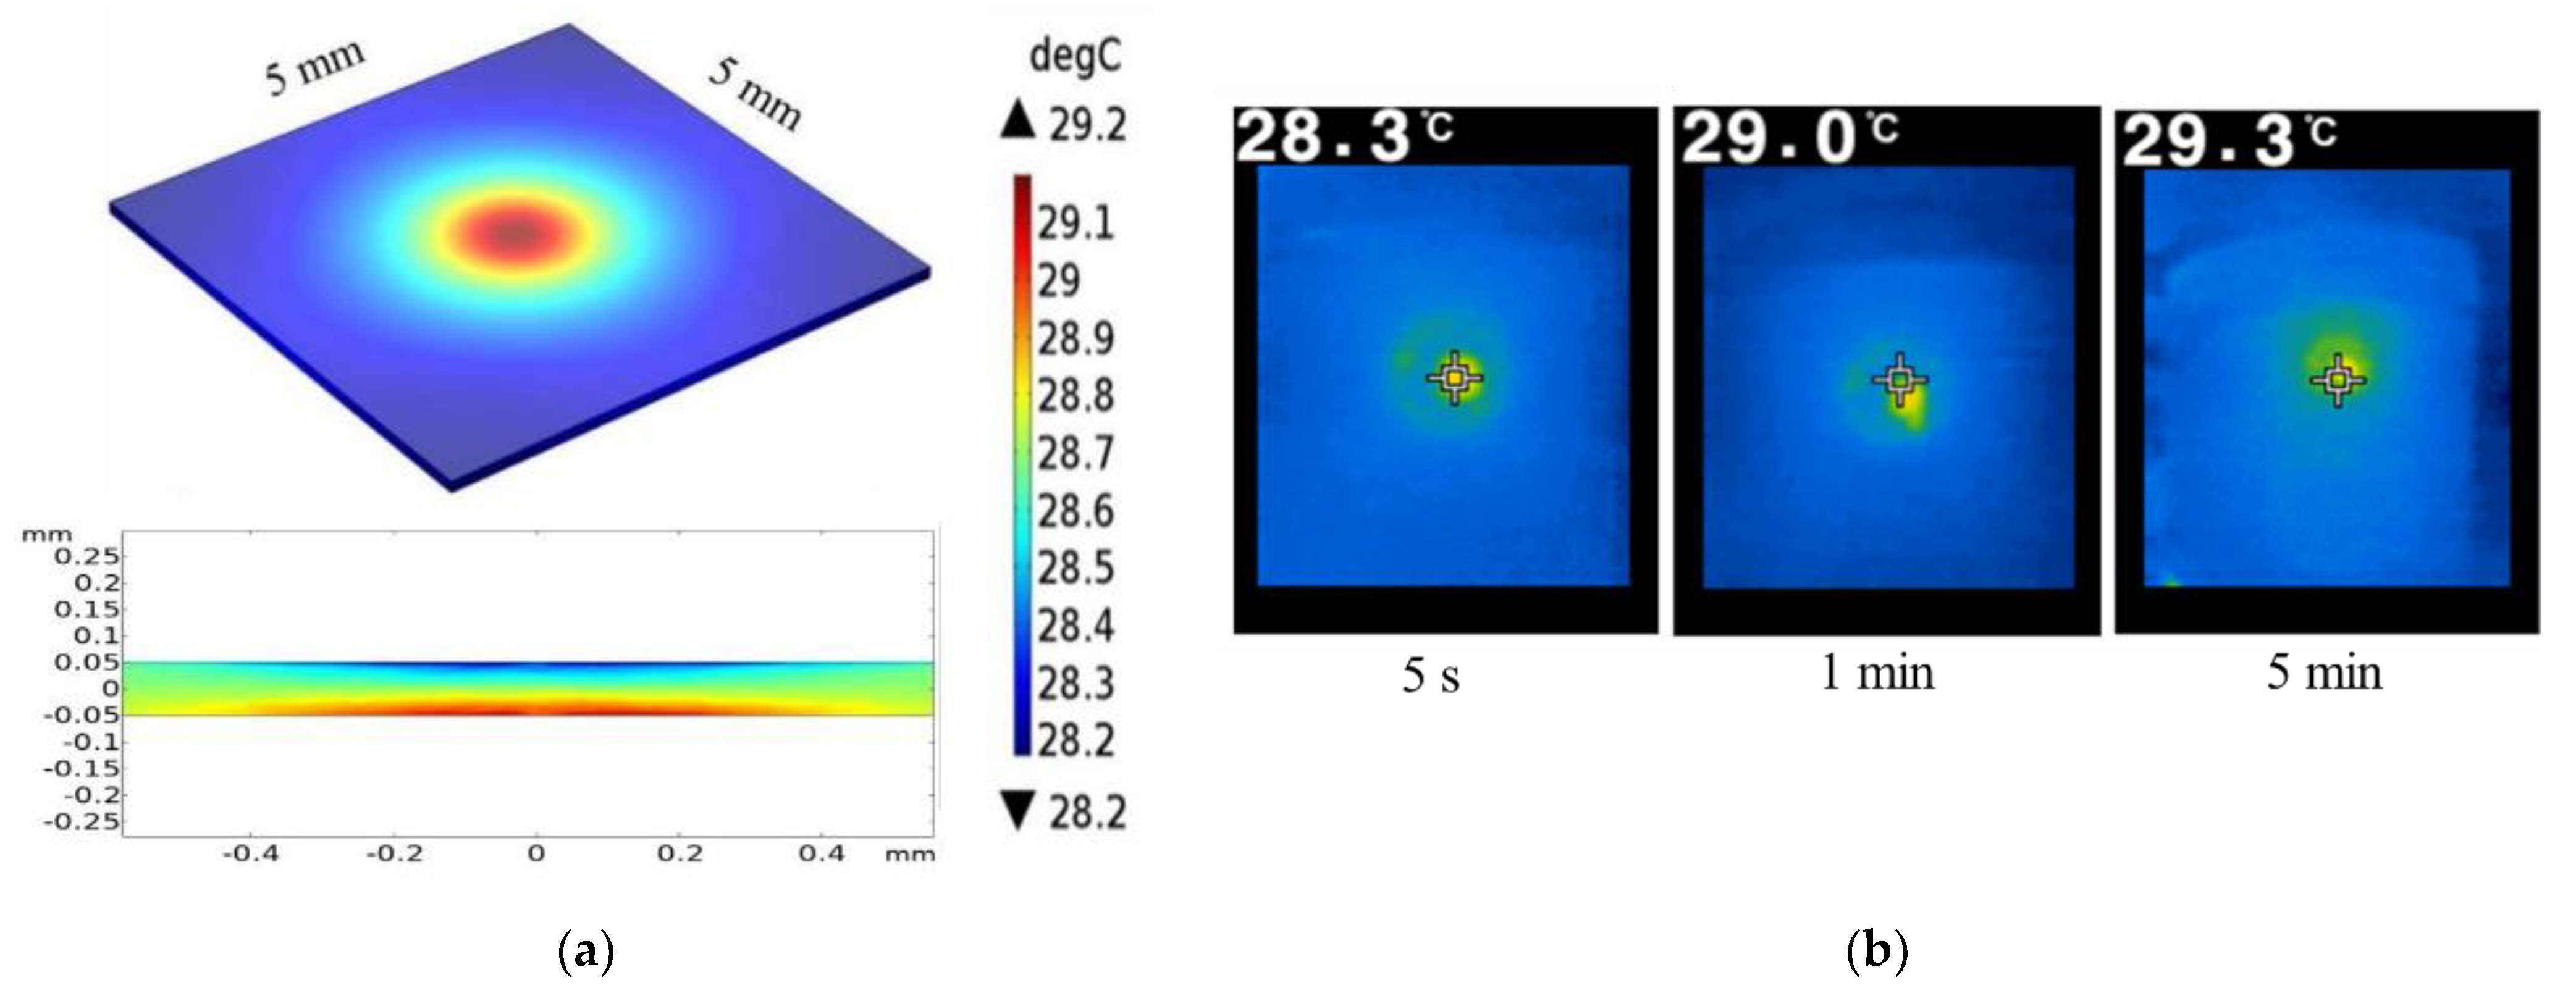
4.1. Temperature Gradient
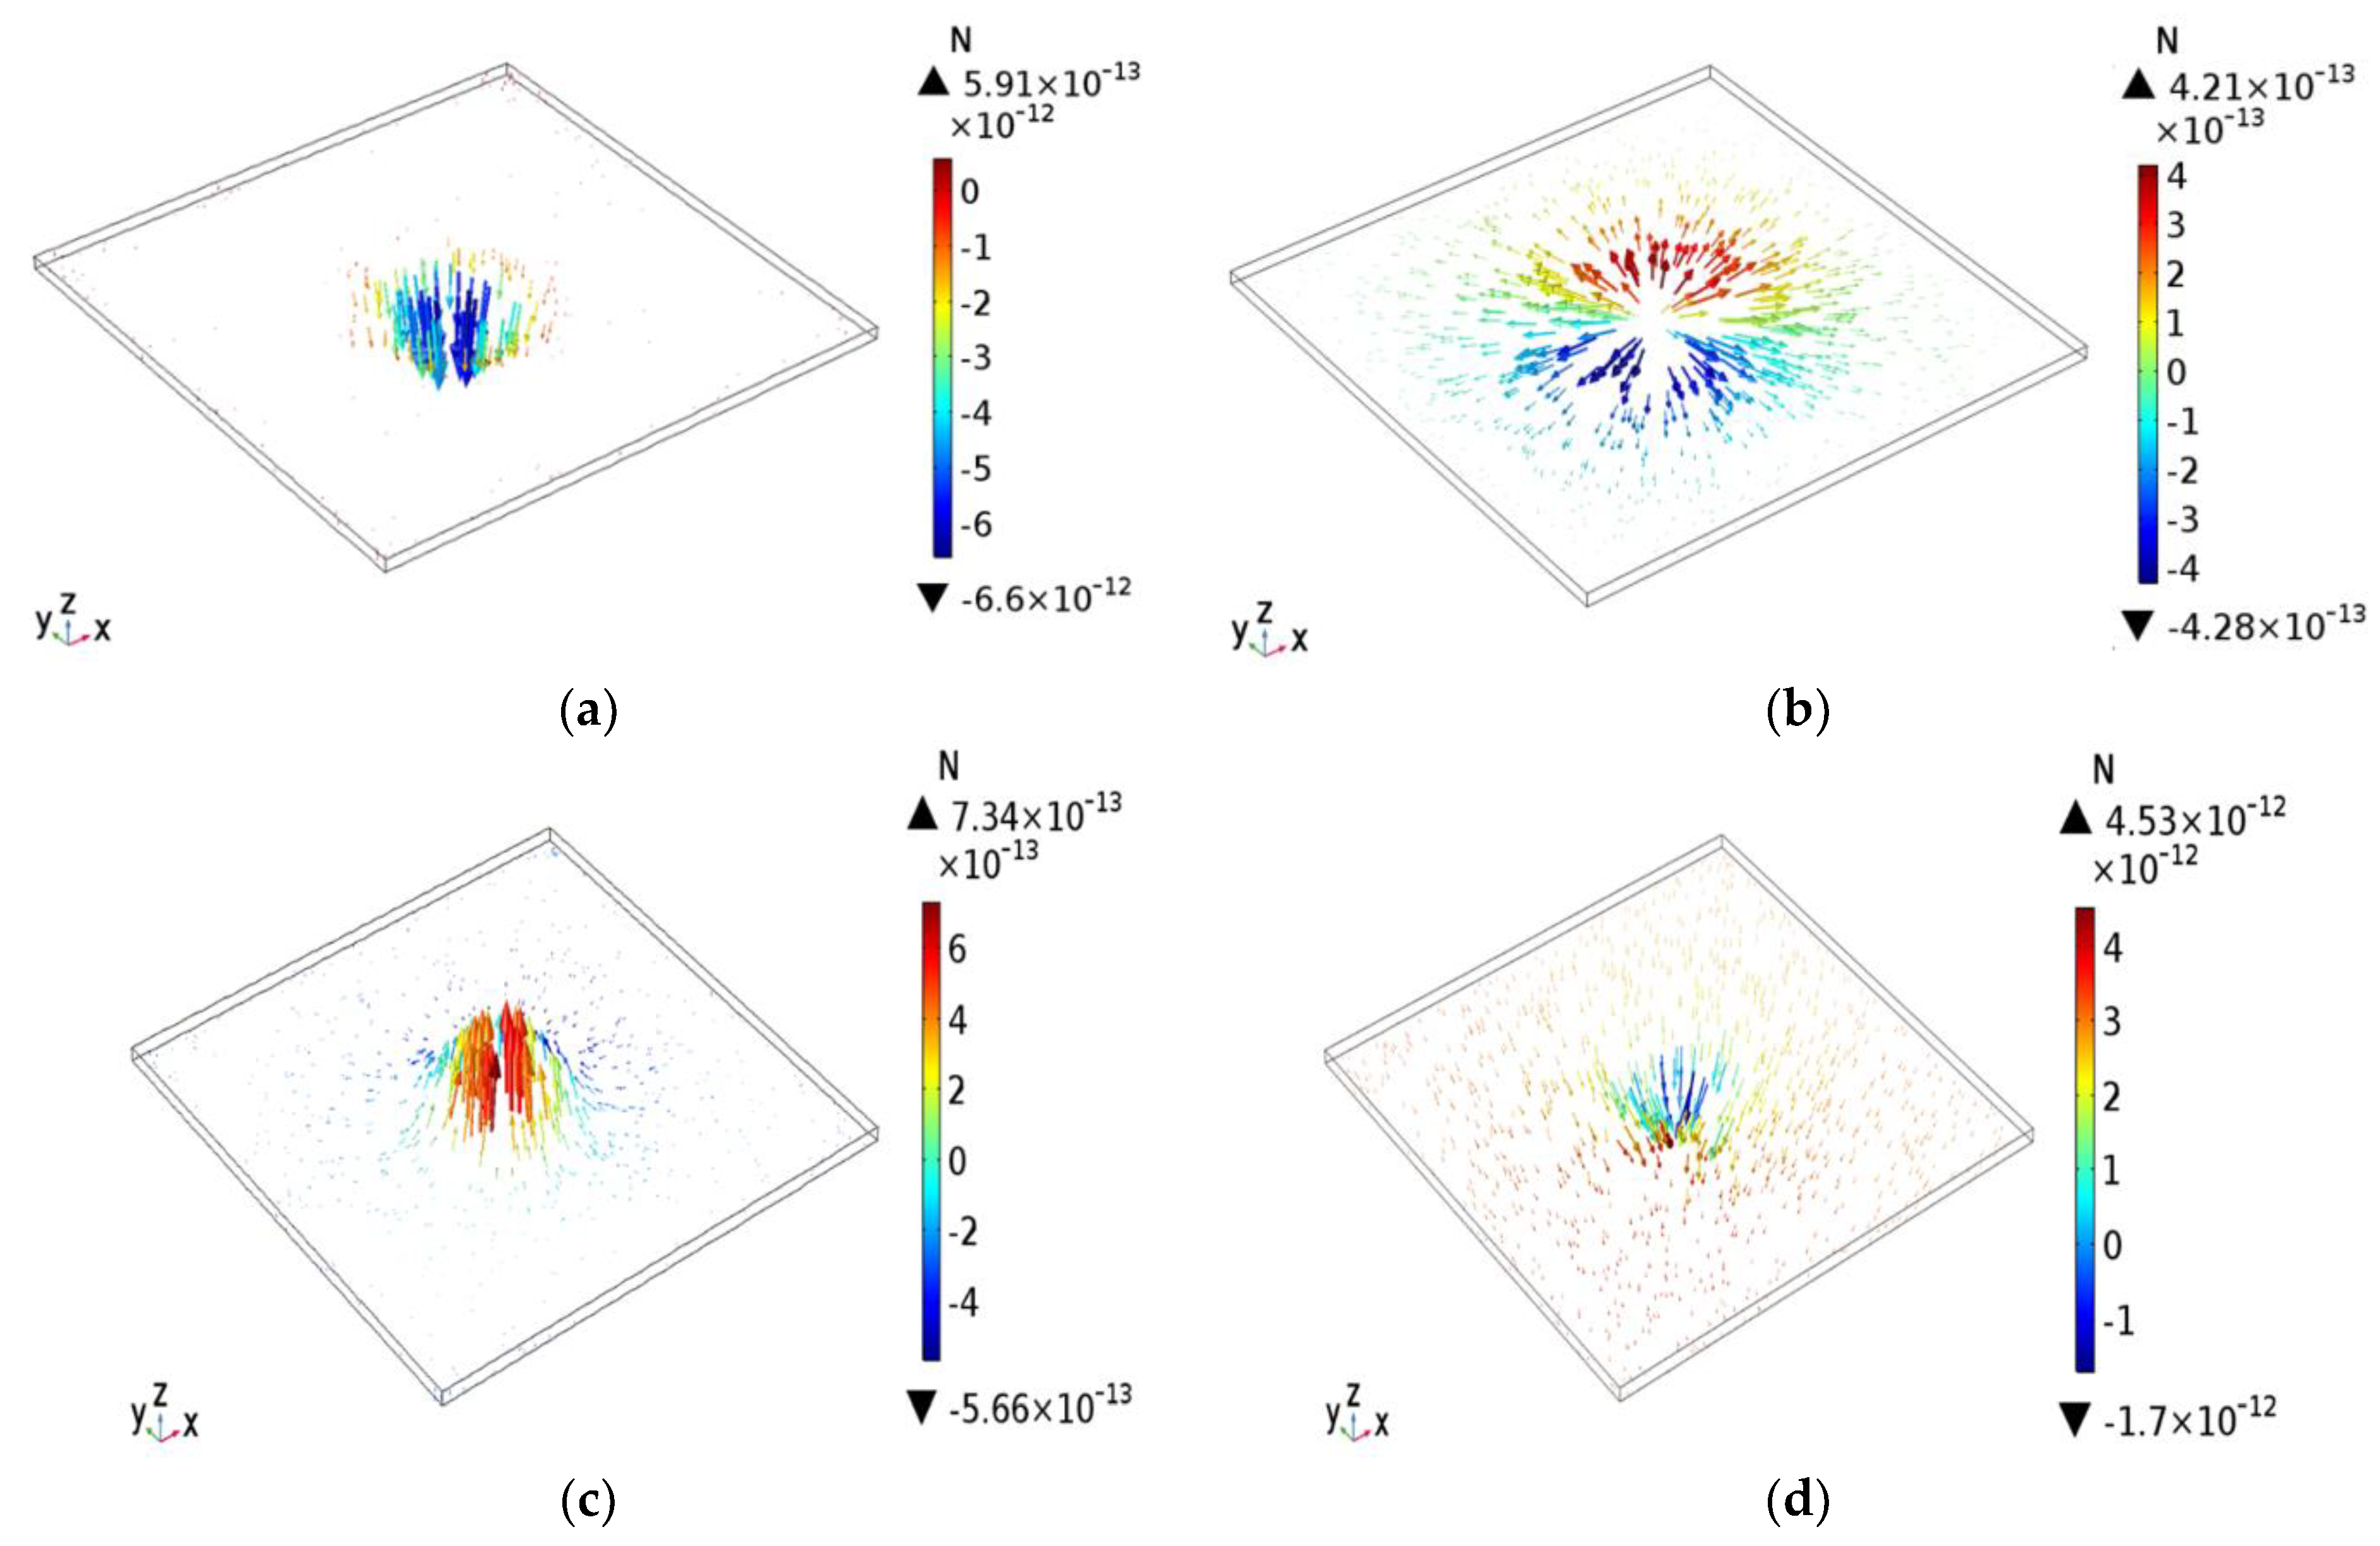
4.2. Optoelectrokinetic Synergy Force
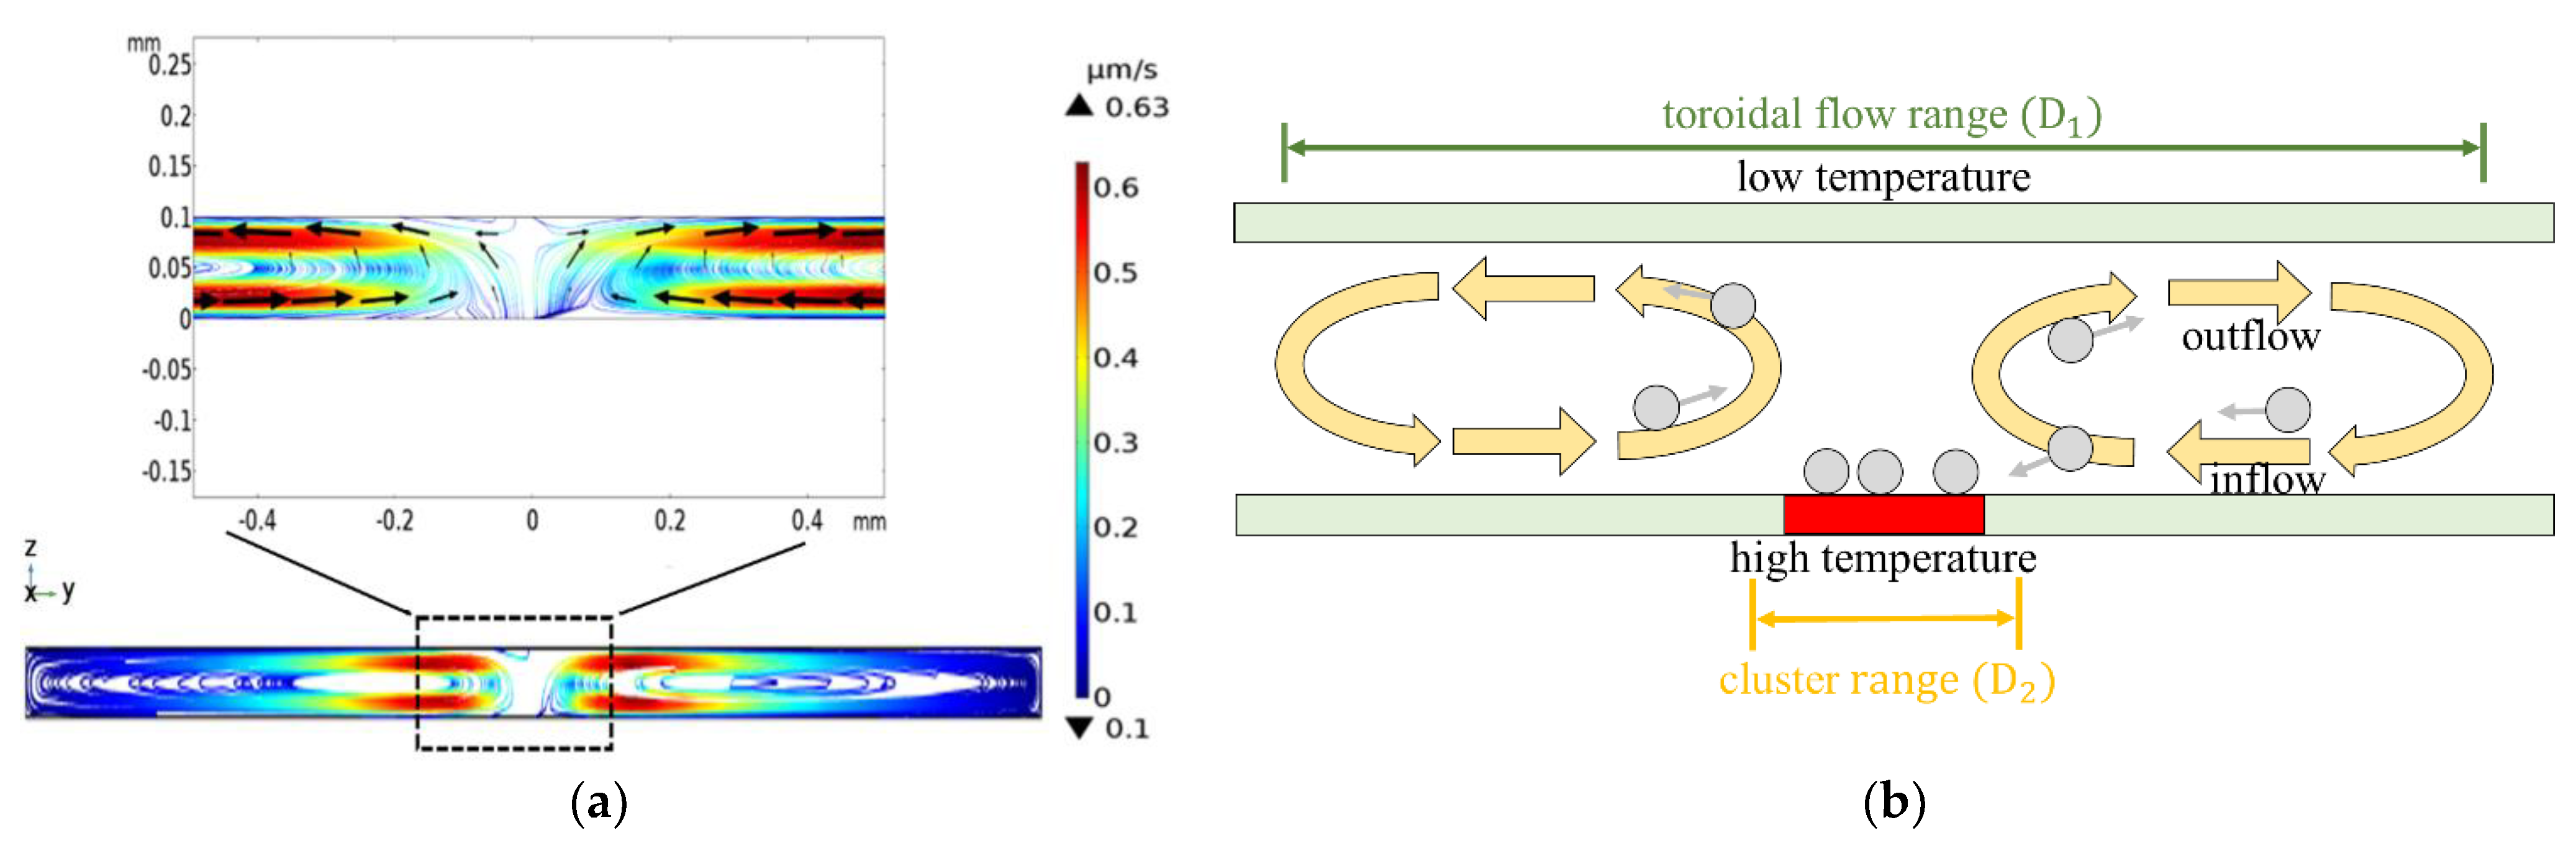
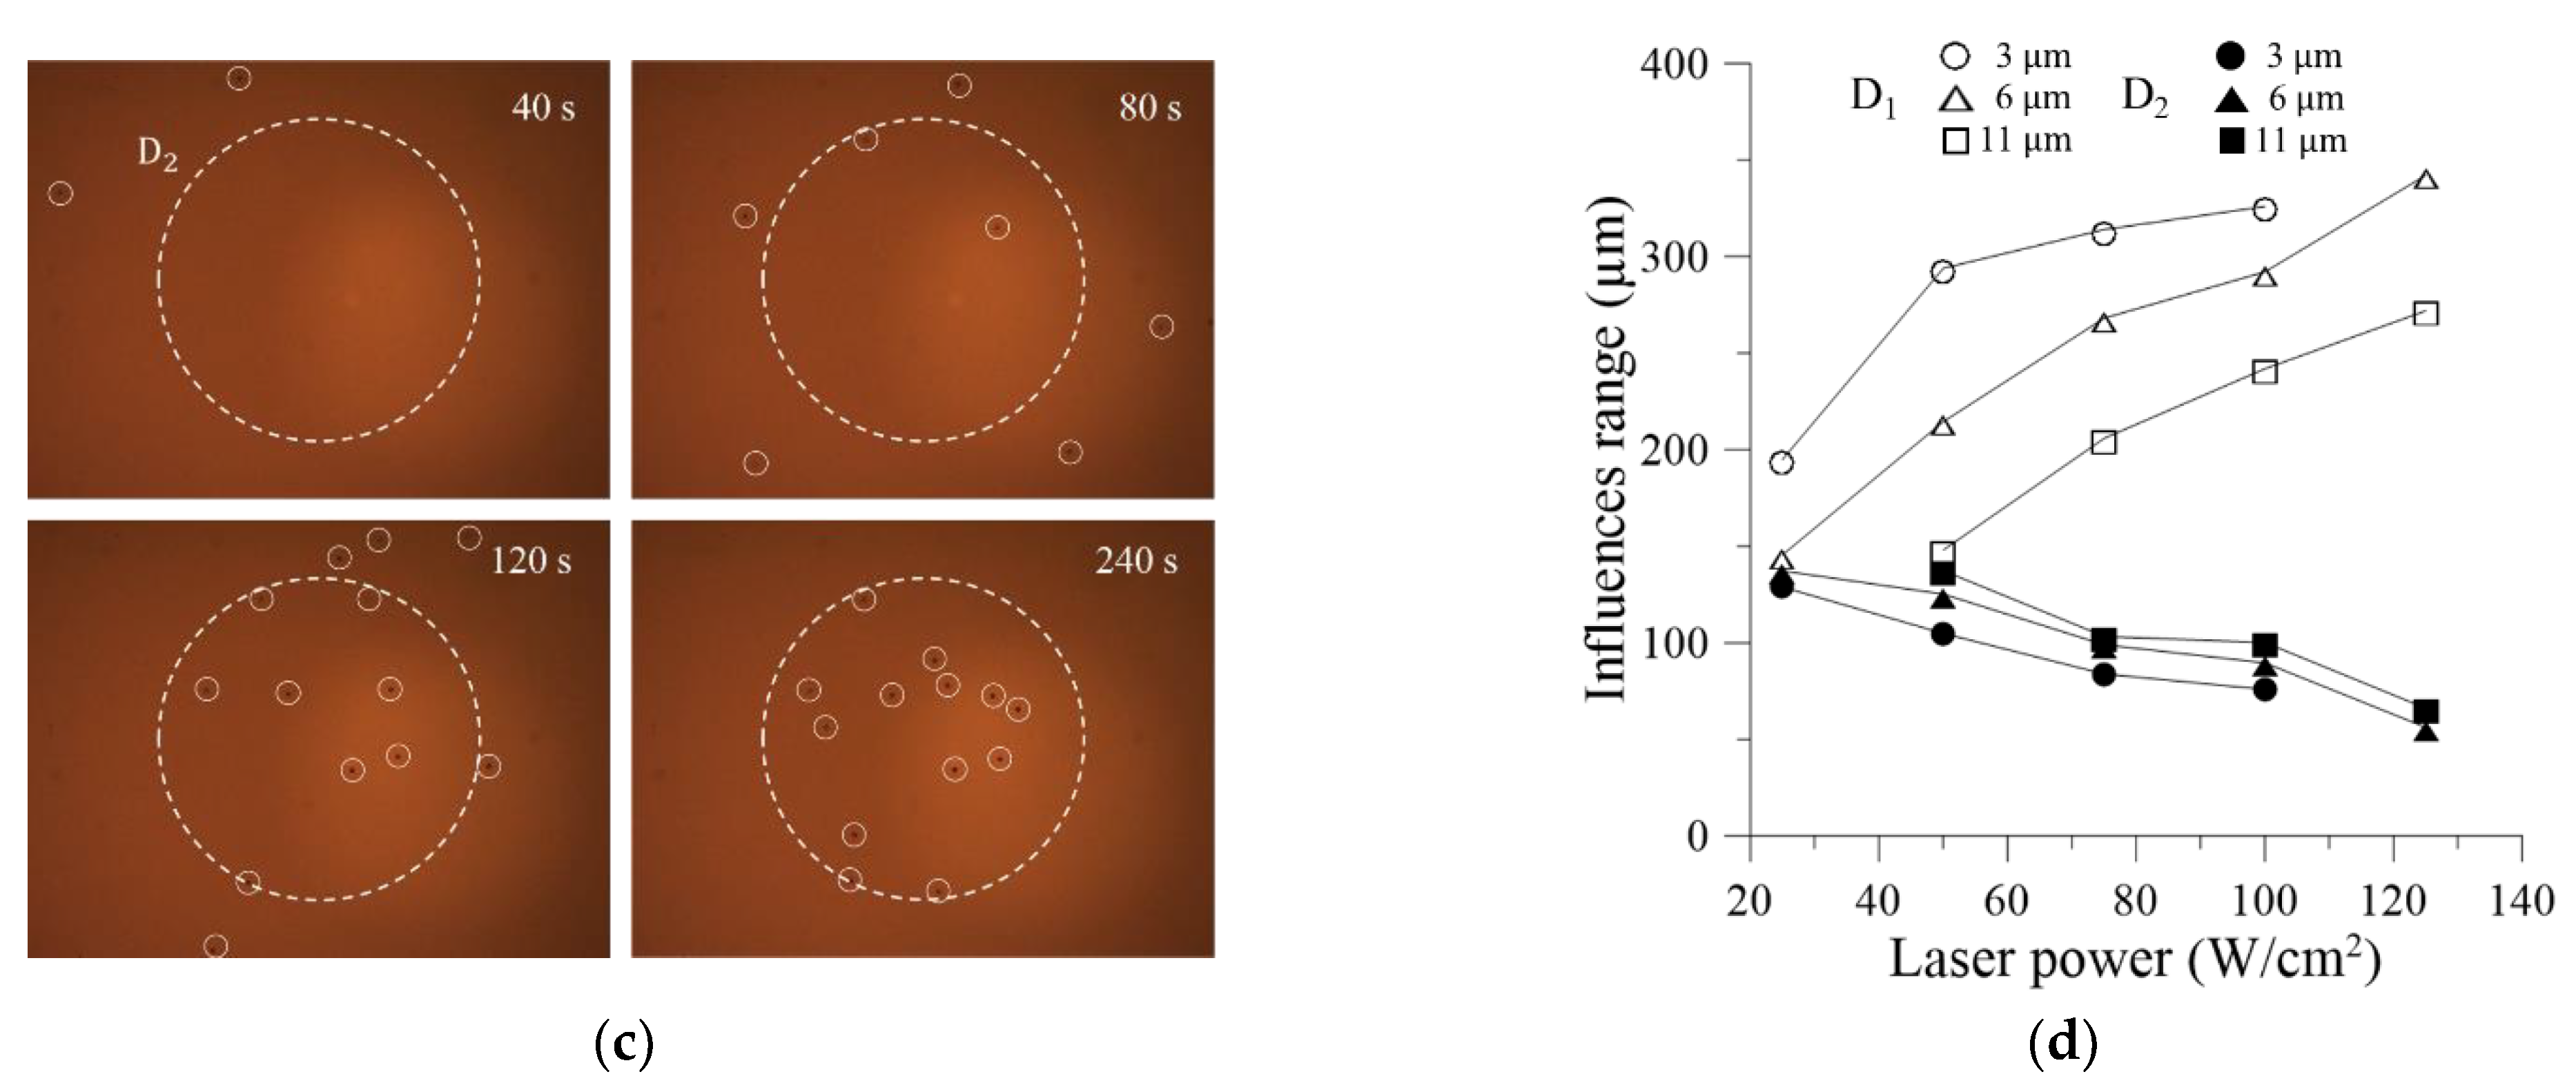
4.3. Influence Range of Toroidal Vortex
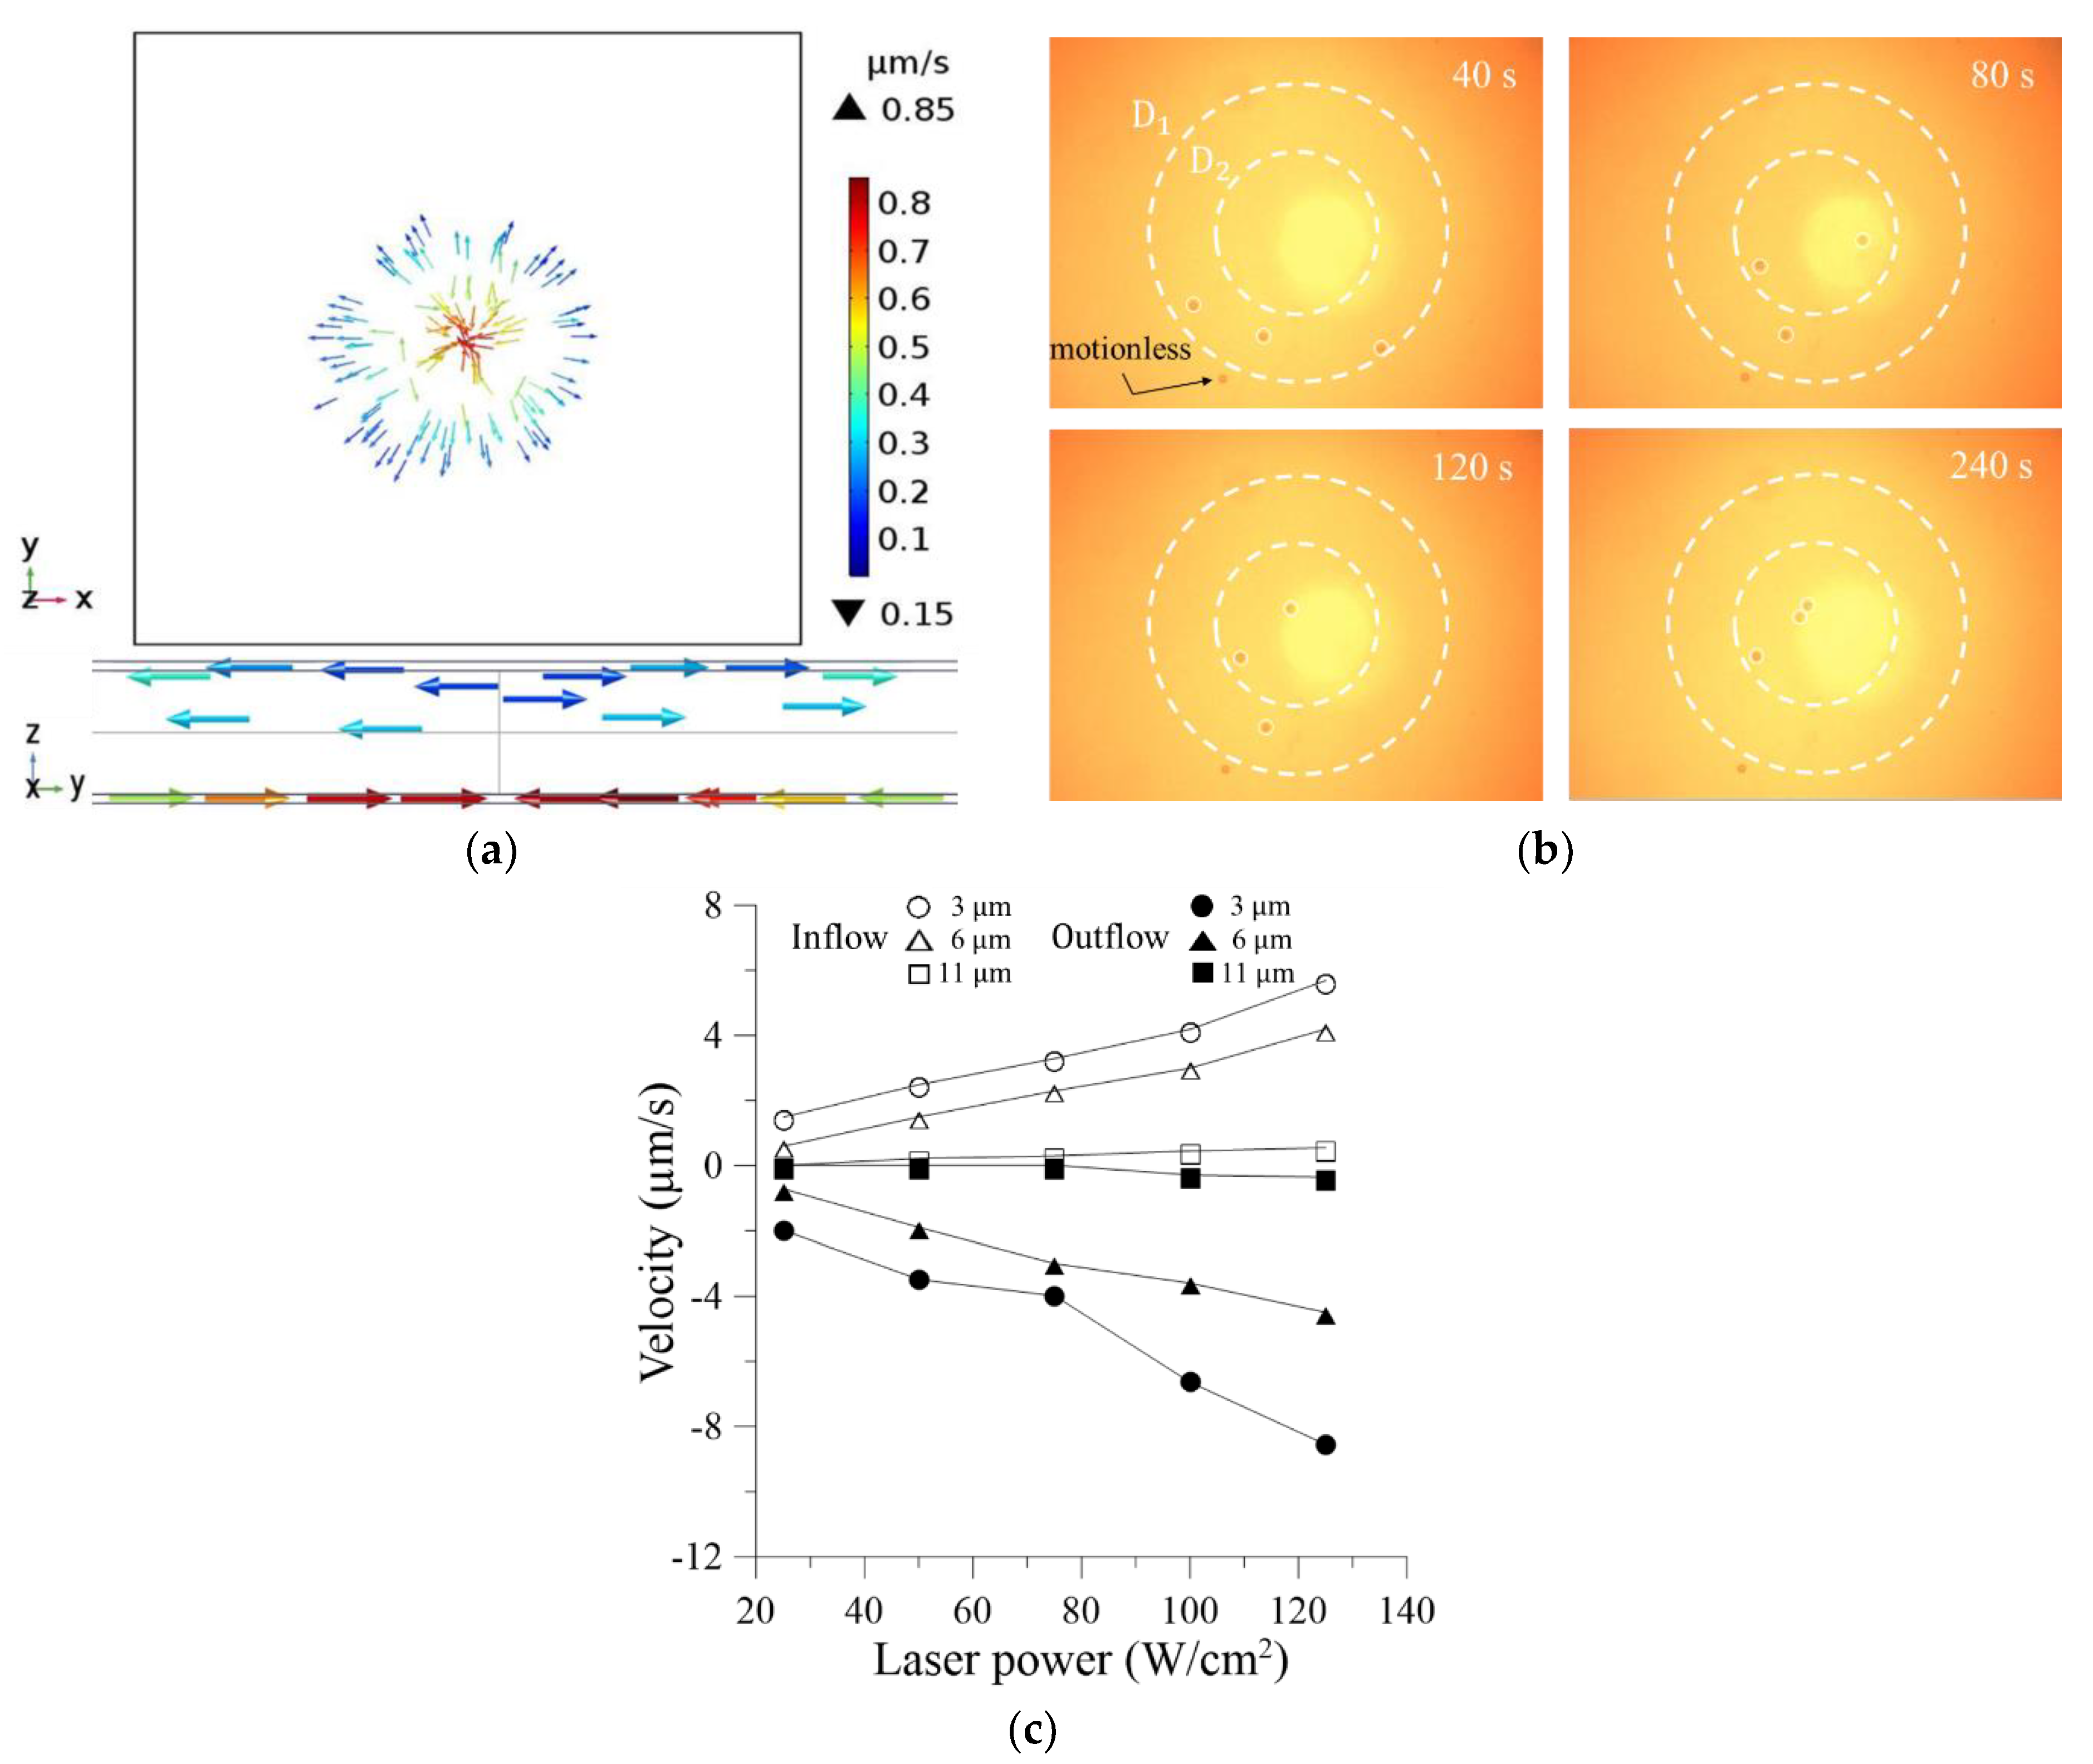
4.4. Particle Velocity
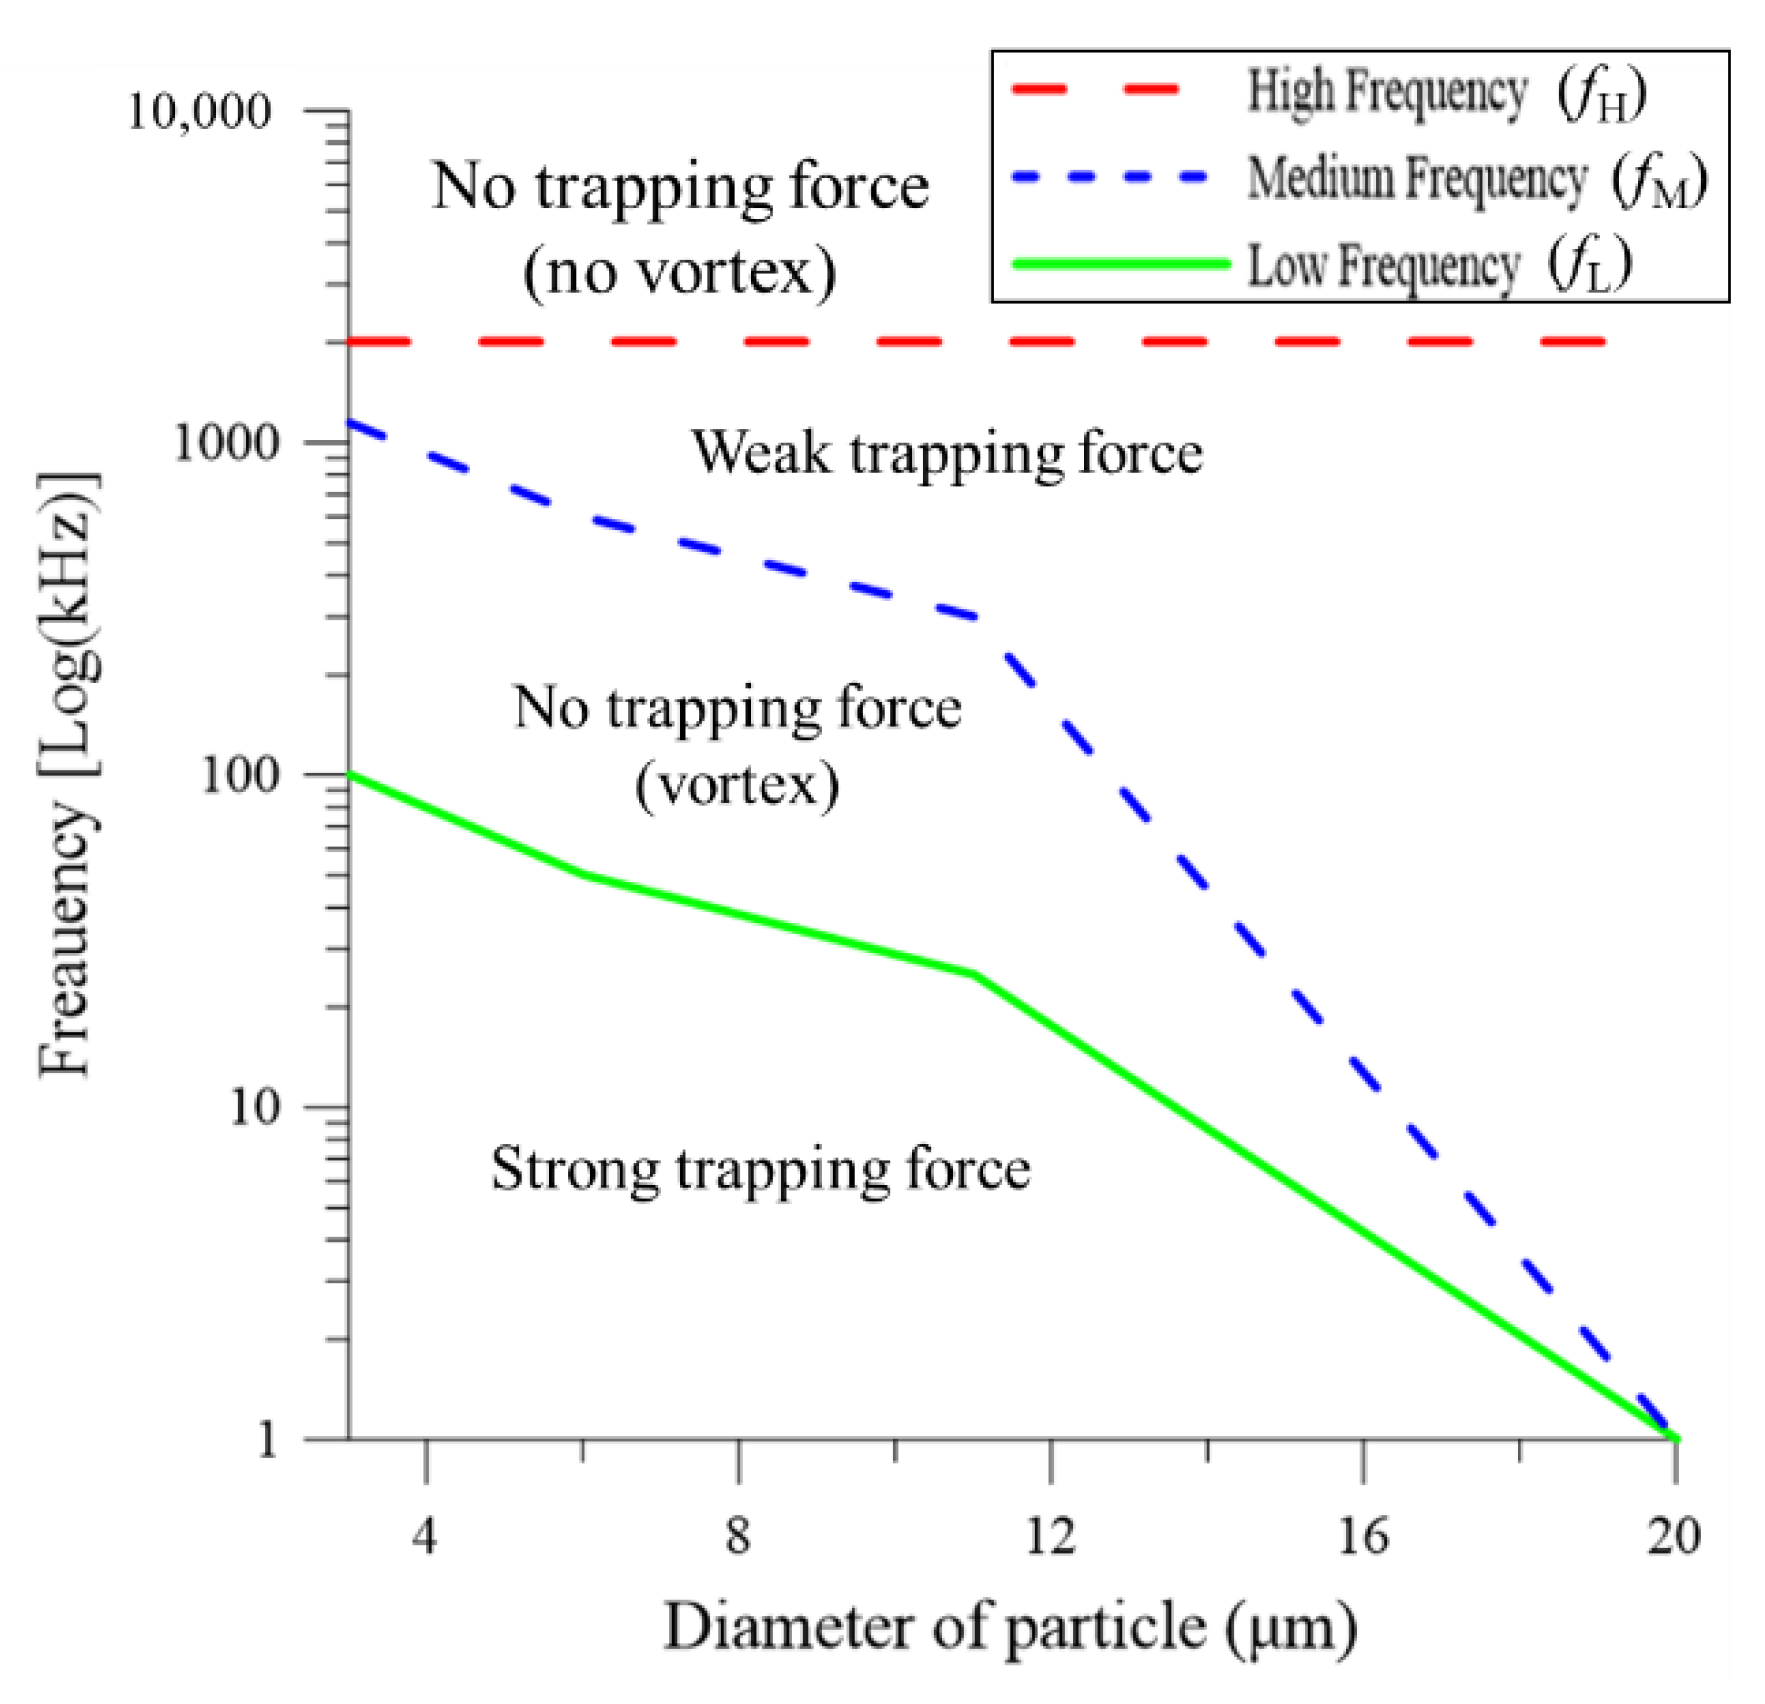
4.5. Effect of Driving Frequency on Particle Behavior
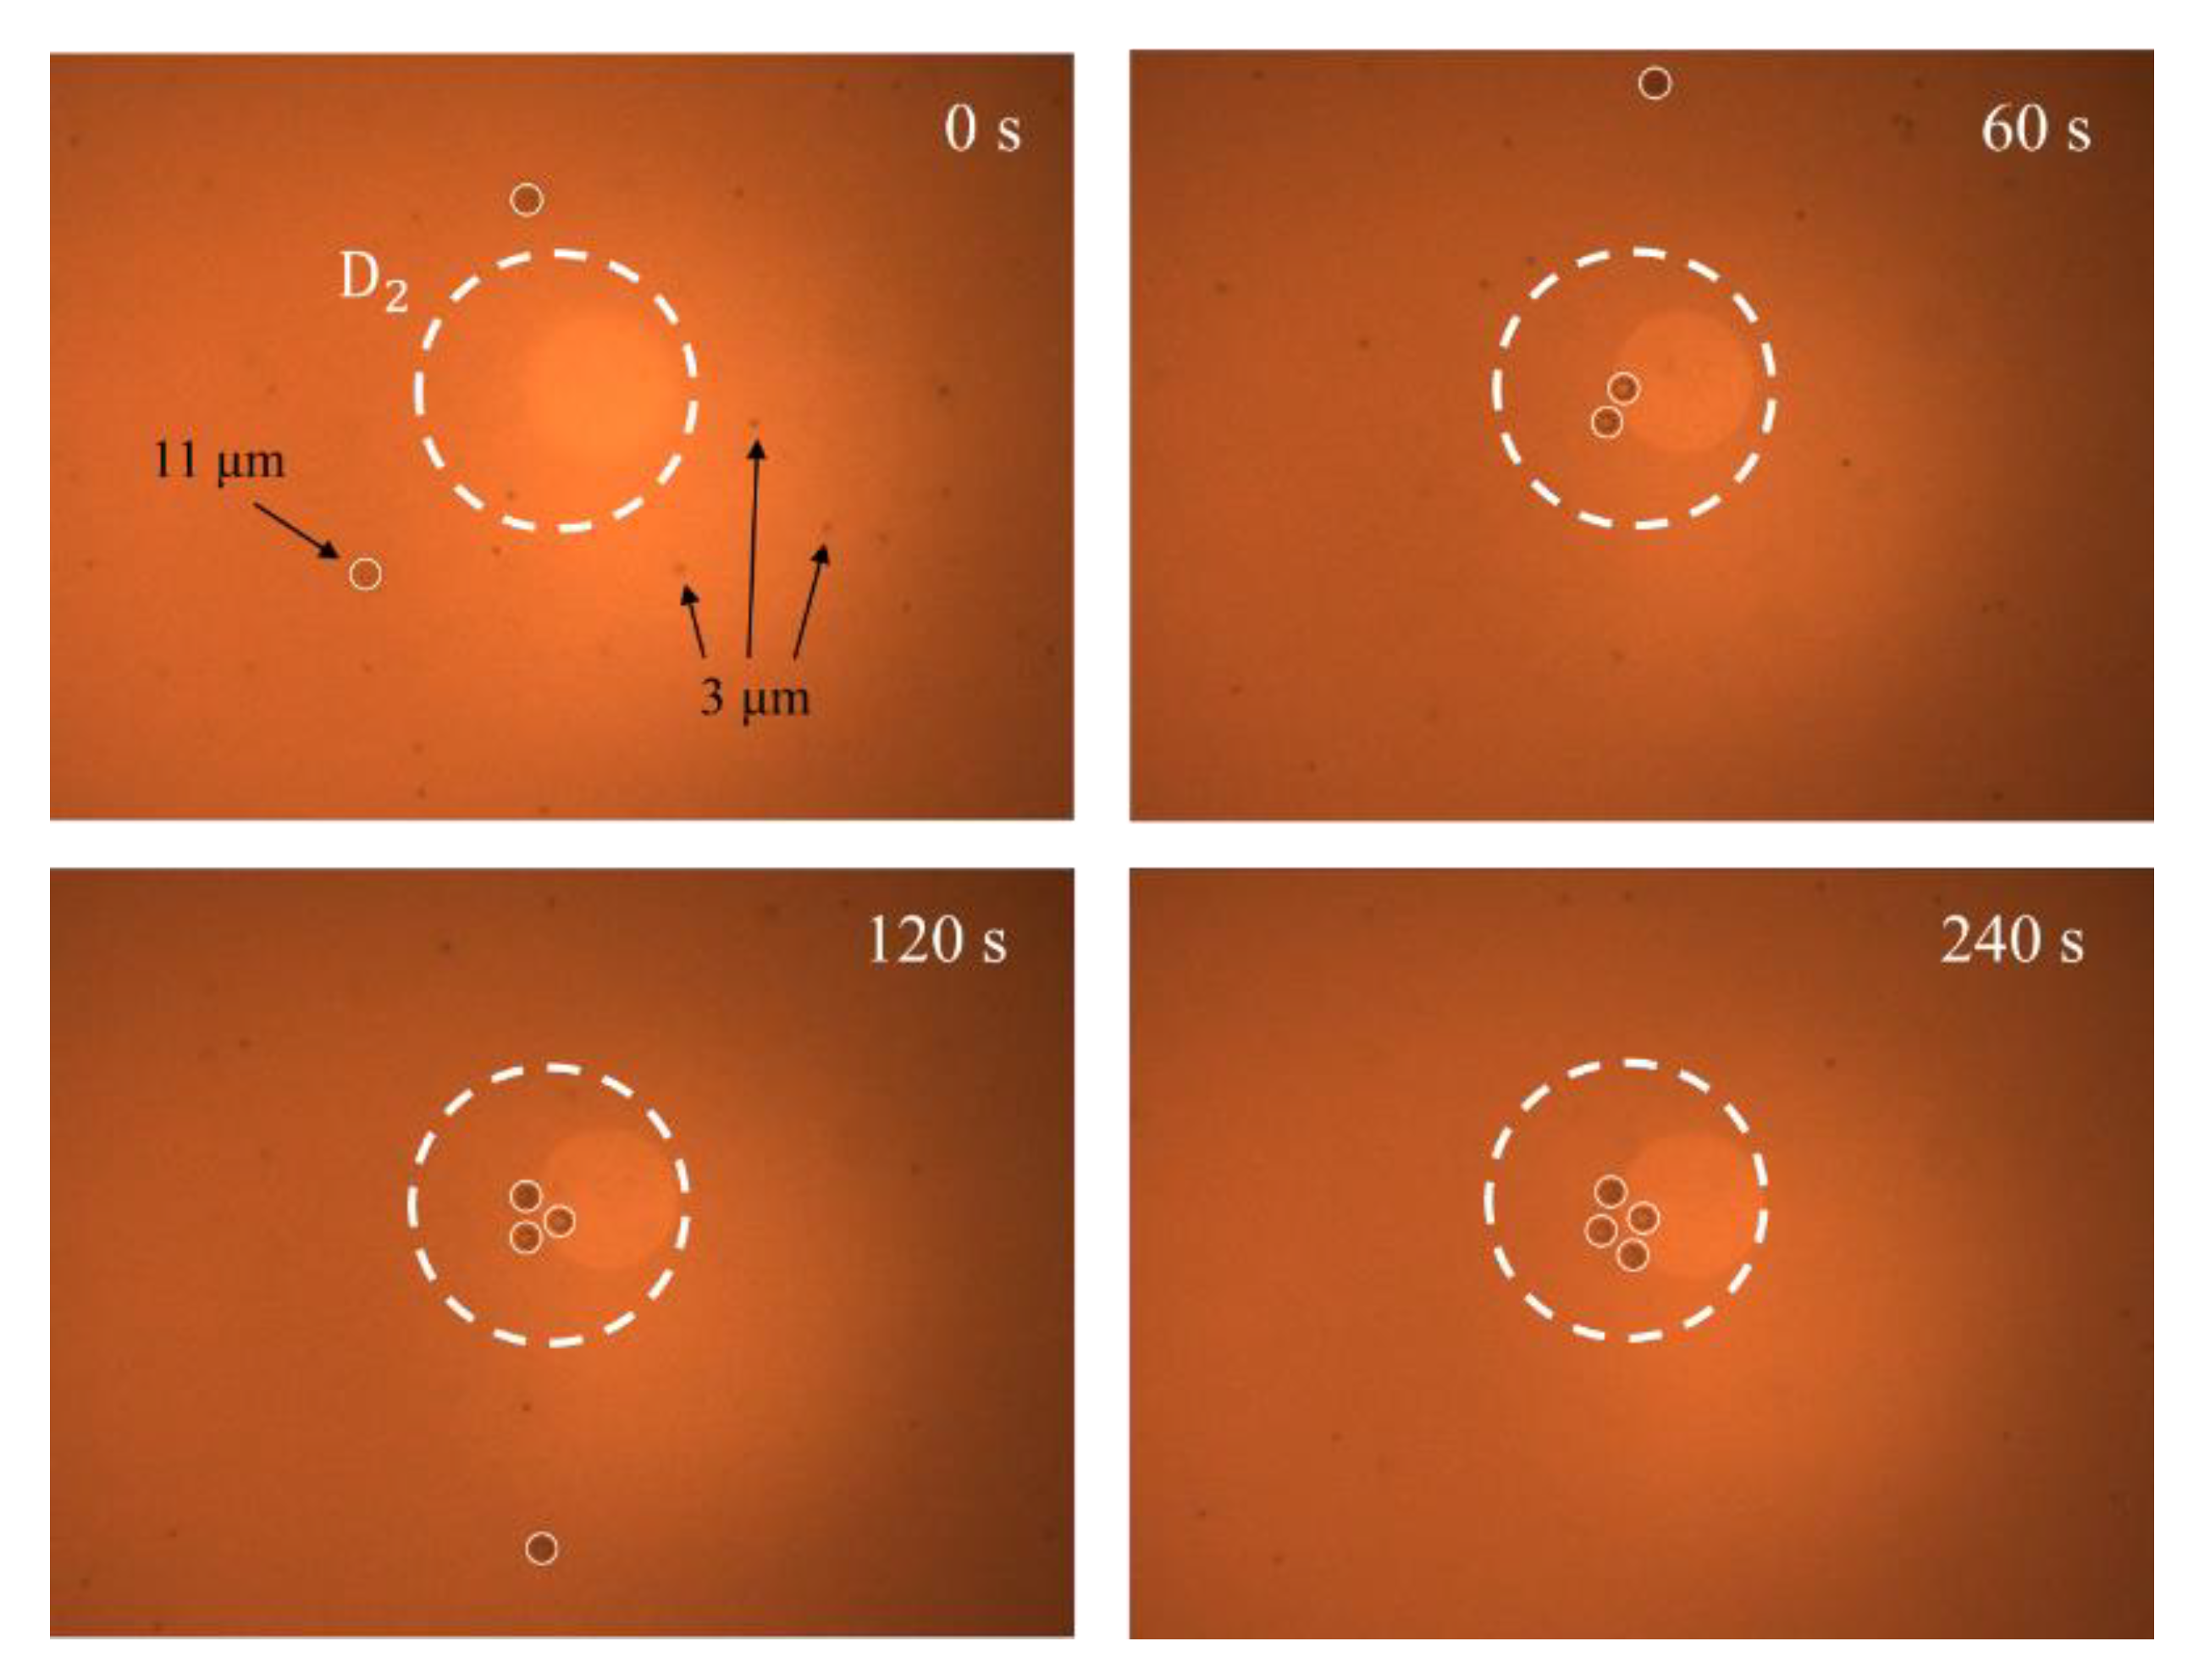
4.6. Particle Sorting
5. Conclusions
Author Contributions
Funding
Data Availability Statement
Acknowledgments
Conflicts of Interest
References
- Suscillon, C.; Velev, O.D.; Slaveykova, V.I. Alternating current-dielectrophoresis driven on-chip collection and chaining of green microalgae in freshwaters. Biomicrofluidics 2013, 7, 24109. [Google Scholar] [CrossRef] [PubMed] [Green Version]
- Kim, H.T.; Bae, H.; Zhang, Z.; Kusimo, A.; Yu, M. Optofluidic microvalve-on-a-chip with a surface plasmonenhanced fiber optic microheater. Biomicrofluidics 2014, 8, 54126. [Google Scholar] [CrossRef] [PubMed] [Green Version]
- Huang, H.Y.; Huang, Y.H.; Kao, W.L.; Yao, D.J. Embryo formation from low sperm concentration by using dielectrophoretic force. Biomicrofluidics 2015, 9, 22404. [Google Scholar] [CrossRef] [Green Version]
- Li, S.; Li, M.; Bougot-Robin, K.; Cao, W.; Chau, I.Y.Y.; Li, W.; Wen, W. High-throughput particle manipulation by hydrodynamic, electrokinetic, and dielectrophoretic effects in an integrated microfluidic chip. Biomicrofluidics 2013, 7, 24106. [Google Scholar] [CrossRef] [PubMed] [Green Version]
- Williams, S.J.; Kumar, A.; Wereley, S.T. Electrokinetic patterning of colloidal particles with optical landscapes. Lab Chip 2008, 8, 1879–1882. [Google Scholar] [CrossRef] [PubMed]
- Demircan, Y.; Ozgur, E.; Kulah, H. Dielectrophoresis: Applications and future outlook in point of care. Electrophoresis 2013, 34, 1008–1027. [Google Scholar] [CrossRef]
- Juan, M.L.; Righini, M.; Quidant, R. Plasmon nano-optical tweezers. Nat. Photonics 2011, 5, 349–356. [Google Scholar] [CrossRef]
- Ashkin, A.; Dziedzic, J.M.; Yamane, T. Optical trapping and manipulation of single cells using infrared laser beam. Nature 1987, 330, 769–771. [Google Scholar] [CrossRef]
- Zheng, T.; Wang, C.; Xu, C.; Hu, Q.; Wei, S. Patterning microparticles into a two-dimensional pattern using one column standing surface acoustic waves. Sens. Actuators A Phys. 2018, 284, 168–171. [Google Scholar] [CrossRef]
- Ebrahimian, H.; Giesguth, M.; Dietz, K.-J.; Reiss, G.; Herth, S. Magnetic tweezers for manipulation of magnetic particles in single cells. Appl. Phys. Lett. 2014, 104, 63701. [Google Scholar] [CrossRef]
- Cummins, Z.; Probst, R.; Shapiro, B. Electrokinetic tweezing: Three-dimensional manipulation of microparticles by real-time imaging and flow control. Lab Chip 2013, 13, 4040–4046. [Google Scholar] [CrossRef] [PubMed]
- Velasco, V.; Williams, S.J. Electrokinetic concentration, patterning, and sorting of colloids with thin film heaters. J. Colloid Interface Sci. 2013, 394, 598–603. [Google Scholar] [CrossRef] [PubMed]
- Ndukaife, J.C.; Mishra, A.; Guler, U.; Nnanna, A.G.A.; Wereley, S.T.; Boltasseva, A. Photothermal heating enabled by plasmonic nanostructures for electrokinetic manipulation and sorting of particles. ACS Nano 2014, 8, 9035–9043. [Google Scholar] [CrossRef] [PubMed]
- Zhang, H.; Liu, K.-K. Optical tweezers for single cells. J. R. Soc. Interface 2008, 5, 671–690. [Google Scholar] [CrossRef] [Green Version]
- Chiou, P.Y.; Ohta, A.T.; Wu, M.C. Massively parallel manipulation of single cells and microparticles using optical images. Nature 2005, 436, 370–372. [Google Scholar] [CrossRef]
- Kumar, A.; Williams, S.J.; Wereley, S.T. Experiments on opto-electrically generated microfluidic vortices. Microfluid. Nanofluid. 2009, 6, 637–646. [Google Scholar] [CrossRef]
- Williams, S.J.; Kumar, A.; Green, N.G.; Wereley, S.T. Optically induced electrokinetic concentration and sorting of colloids. J. Micromech. Microeng. 2010, 20, 15022. [Google Scholar] [CrossRef]
- Wang, K.C.; Kumar, A.; Williams, S.J.; Green, N.G.; Kim, K.C.; Chuang, H.S. An optoelectrokinetic technique for programmable particle manipulation and bead-based biosignal enhancement. Lab Chip 2014, 14, 3958–3967. [Google Scholar] [CrossRef]
- Liang, W.; Liu, L.; Wang, J.; Yang, X.; Wang, Y.; Li, W.J.; Yang, W. A review on optoelectrokinetics-based manipulation and fabrication of micro/nanomaterials. Micromachines 2020, 11, 78. [Google Scholar] [CrossRef] [Green Version]
- Chen, W.L.; Jayan, M.; Kwon, J.S.; Chuang, H.S. Facile open-well immunofluorescence enhancement with coplanar-electrodes-enabled optoelectrokinetics and magnetic particles. Biosens. Bioelectron. 2021, 193, 113527. [Google Scholar] [CrossRef]
- Kumar, A.; Cierpka, C.; Williams, S.J.; Kähler, C.J.; Wereley, S.T. 3D3C velocimetry measurements of an electrothermal microvortex using wavefront deformation PTV and a single camera. Microfluid. Nanofluid. 2011, 10, 355–365. [Google Scholar] [CrossRef]
- Kwon, J.S.; Wereley, S.T. Light-actuated electrothermal microfluidic motion: Experimental investigation and physical interpretation. Microfluid. Nanofluid. 2015, 19, 609–619. [Google Scholar] [CrossRef]
- Williams, S.J.; Kumar, A.; Green, N.G.; Wereley, S.T. A simple, optically induced electrokinetic method to concentrate and pattern nanoparticles. Nanoscale 2009, 1, 133–137. [Google Scholar] [CrossRef] [PubMed] [Green Version]
- Kumar, A.; Kwon, J.S.; Williams, S.J.; Green, N.G.; Yip, N.K.; Wereley, S.T. Optically modulated electrokinetic manipulation and concentration of colloidal particles near an electrode surface. Langmuir 2010, 26, 5262–5272. [Google Scholar] [CrossRef] [PubMed] [Green Version]
- Kwon, J.S.; Wereley, S.T. Towards new methodologies for manipulation of colloidal particles in a miniaturized fluidic device: Optoelectrokinetic manipulation technique. J. Fluids Eng. 2013, 135, 21306. [Google Scholar] [CrossRef]
- Mishra, A.; Kwon, J.S.; Thakur, R.; Wereley, S. Optoelectrical microfluidics as a promising tool in biology. Trends Biotechnol. 2014, 32, 414–421. [Google Scholar] [CrossRef]
- Mishra, A.; Gupta, K.; Wereley, S.T. Nature of trapping forces in optically induced electrothermal vortex based tweezers. Phys. Rev. Fluids 2021, 6, 23701. [Google Scholar] [CrossRef]
- Kunti, G.; Agarwal, T.; Bhattacharya, A.; Maiti, T.K.; Chakraborty, S. On-chip concentration and patterning of biological cells using interplay of electrical and thermal fields. Anal. Chem. 2020, 92, 838–844. [Google Scholar] [CrossRef] [Green Version]
- Gupta, K.; Chen, Z.; Williams, S.J.; Wereley, S.T. Time-resolved particle image velocimetry analysis and computational modeling of transient optically induced electrothermal micro vortex. Electrophoresis 2021, 42, 2483–2489. [Google Scholar] [CrossRef]
- Kunti, G.; Bhattacharya, A.; Chakraborty, S. Electrothermally actuated moving contact line dynamics over chemically patterned surfaces with resistive heaters. Phys. Fluids 2018, 30, 62004. [Google Scholar] [CrossRef]
- Kunti, G.; Mondal, P.K.; Bhattacharya, A.; Chakraborty, S. Electrothermally modulated contact line dynamics of a binary fluid in a patterned fluidic environment. Phys. Fluids 2018, 30, 92005. [Google Scholar] [CrossRef]
- Ramos, A.; Morgan, H.; Green, N.G.; Castellanos, A. AC electric-field-induced fluid flow in microelectrodes. J. Colloid. Interface. Sci. 1999, 217, 420–422. [Google Scholar] [CrossRef] [PubMed]
- Hughes, M.P.; Pethig, R.; Wang, X.B. Dielectrophoretic forces on particle in traveling electric fields. J. Phys. D Appl. Phys. 1996, 29, 474–482. [Google Scholar] [CrossRef]
- Jerome, B.; Mykolas, Z.; Robin, L.; Yang, L.; Erika, E. Colloidal motion under the action of a thermophoretic force. J. Chem. Phys. 2017, 147, 94906. [Google Scholar]
- Liu, S.; Lin, L.; Sun, H.B. Opto-thermophoretic manipulation. ACS Nano 2021, 15, 5925–5943. [Google Scholar] [CrossRef] [PubMed]
- Kim, D.; Shim, J.; Chuang, H.S.; Kim, K.C. Numerical simulation on the opto-electro-kinetic patterning for rapid concentration of particles in a microchannel. Biomicrofluidics 2015, 9, 34102. [Google Scholar] [CrossRef] [PubMed] [Green Version]
- Chiou, C.H.; Chien, L.J.; Lin, J.L.; Kuo, J.N. Novel electrodeless dielectrophoresis device for nanoparticle trapping using three dimensional inverted-pyramid arrays. Appl. Phys. Express 2016, 9, 57001. [Google Scholar] [CrossRef]


| (kg/m3) | (S/m) | (J/kgK) | κ(W/mK) | ||
|---|---|---|---|---|---|
| Fluid | 1000 | 78 | 4200 | 0.6 | |
| Particle | 1040 | 2.7 | 0.0009 | 1300 | 0.033 |
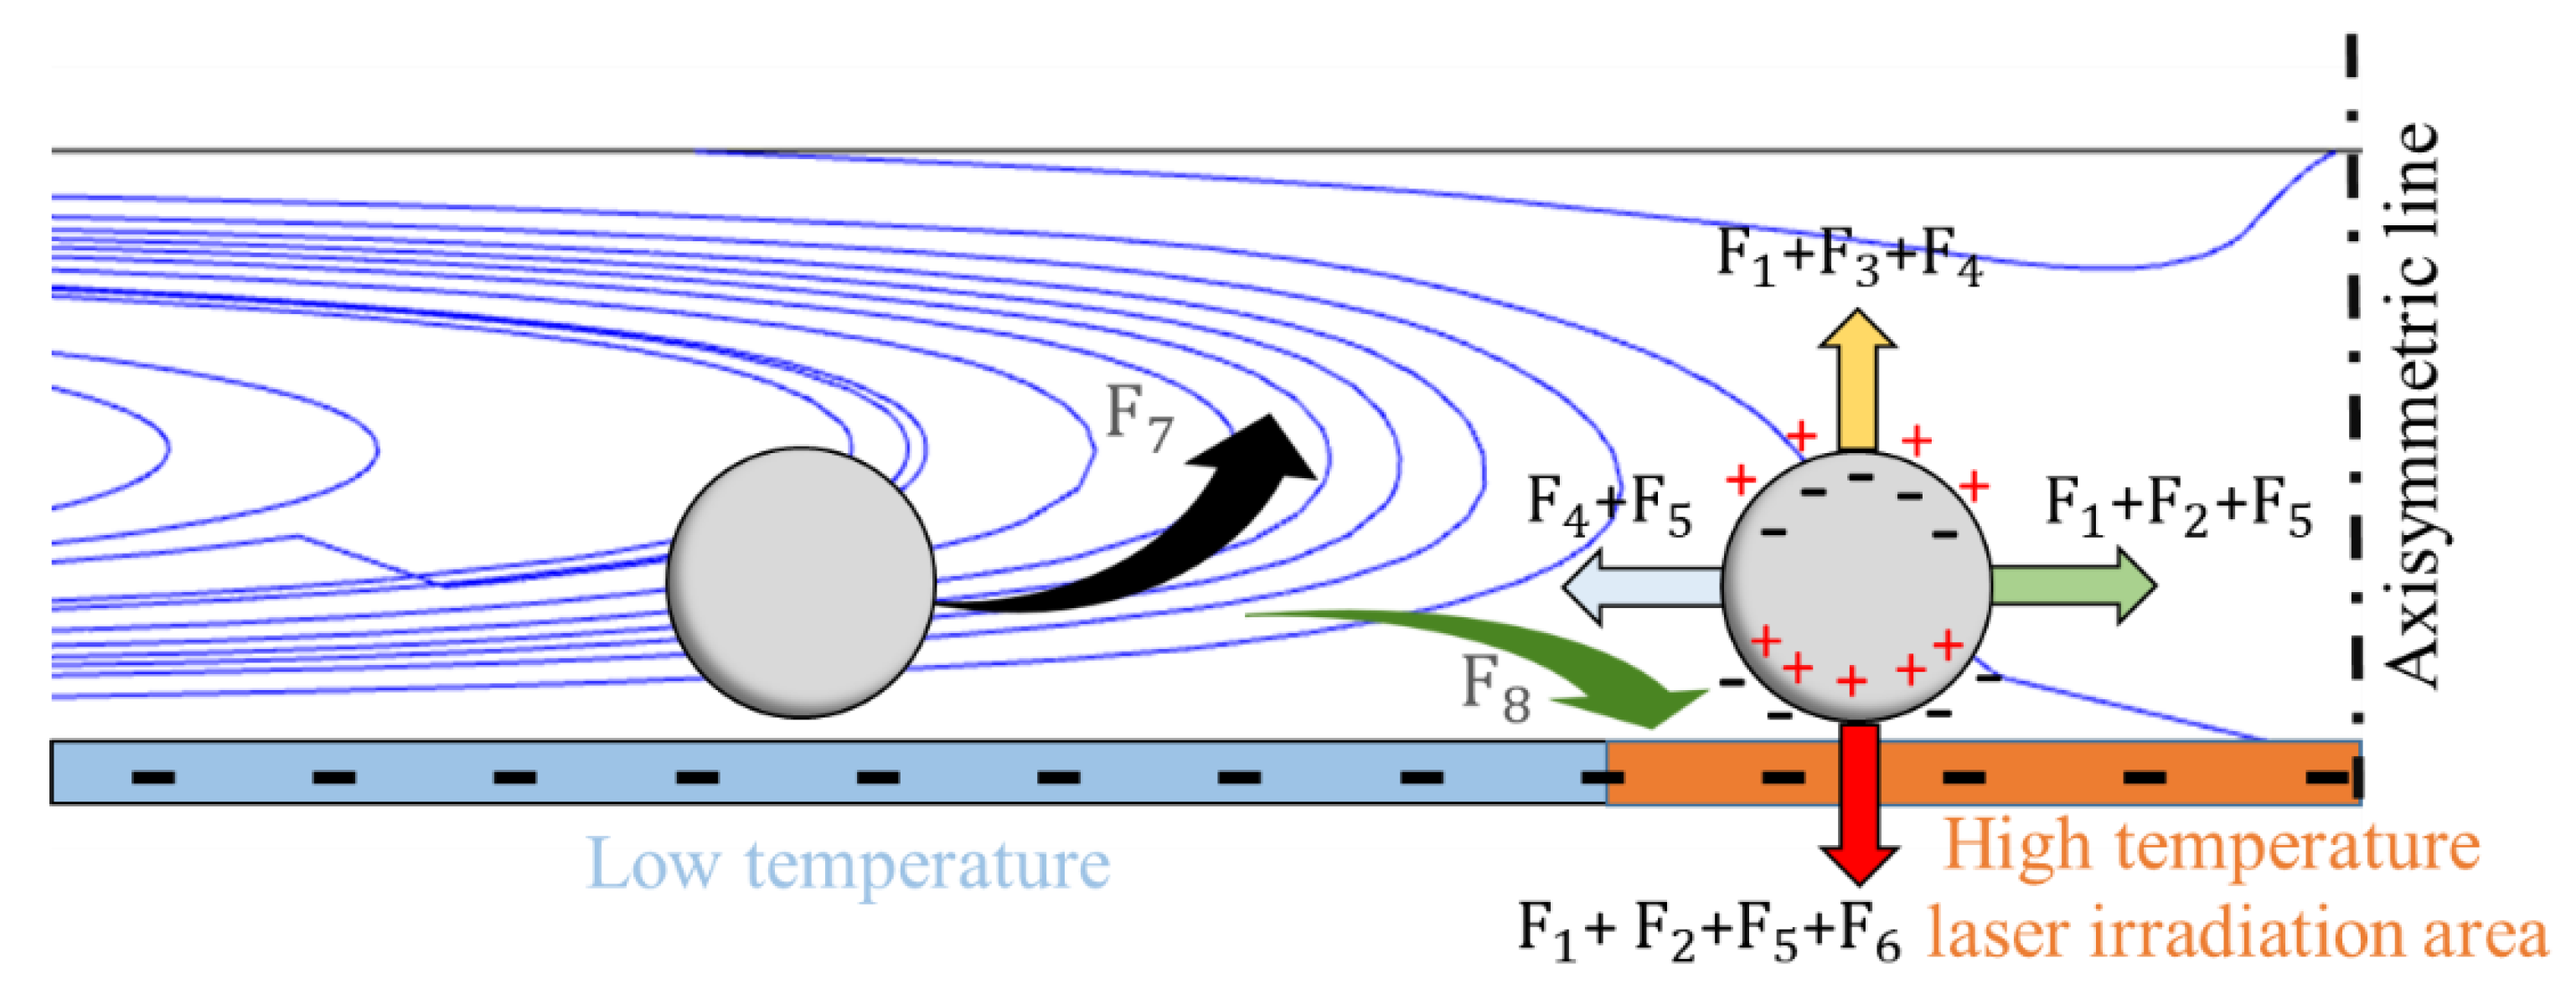
| Force | Description |
|---|---|
| F1 | AC Electrothermal, ACET |
| F2 | Dielectrophoresis, DEP |
| F3 | AC Electroosmosis, ACEO |
| F4 | Thermophoretic force |
| F5 | Electrical double layer, EDL |
| F6 | Gravity |
| F7 | Drag force (F1+F3+F6) |
| F8 | Trapping force (the sum of all forces) |
Publisher’s Note: MDPI stays neutral with regard to jurisdictional claims in published maps and institutional affiliations. |
© 2022 by the authors. Licensee MDPI, Basel, Switzerland. This article is an open access article distributed under the terms and conditions of the Creative Commons Attribution (CC BY) license (https://creativecommons.org/licenses/by/4.0/).
Share and Cite
Zhang, S.-J.; Yang, Z.-R.; Kuo, J.-N. Force and Velocity Analysis of Particles Manipulated by Toroidal Vortex on Optoelectrokinetic Microfluidic Platform. Micromachines 2022, 13, 2245. https://doi.org/10.3390/mi13122245
Zhang S-J, Yang Z-R, Kuo J-N. Force and Velocity Analysis of Particles Manipulated by Toroidal Vortex on Optoelectrokinetic Microfluidic Platform. Micromachines. 2022; 13(12):2245. https://doi.org/10.3390/mi13122245
Chicago/Turabian StyleZhang, Sheng-Jie, Zong-Rui Yang, and Ju-Nan Kuo. 2022. "Force and Velocity Analysis of Particles Manipulated by Toroidal Vortex on Optoelectrokinetic Microfluidic Platform" Micromachines 13, no. 12: 2245. https://doi.org/10.3390/mi13122245