Author Contributions
Conceptualization, D.-H.L., C.-H.C., Z.-H.W., C.-K.Y., C.-F.L. and C.-T.P.; Data curation, D.-H.L., C.-H.C., M.O.S., C.-F.L. and C.-T.P.; Methodology, D.-H.L., C.-H.C., M.O.S., Y.-S.D., Z.-H.W., C.-K.Y. and C.-F.L.; Resources, S.-Y.W. and Z.-H.W.; Writing—original draft, M.O.S. and Y.-S.D.; Writing—review & editing, Y.-S.D., S.-Y.W., C.-F.L. and C.-T.P. All authors have read and agreed to the published version of the manuscript.
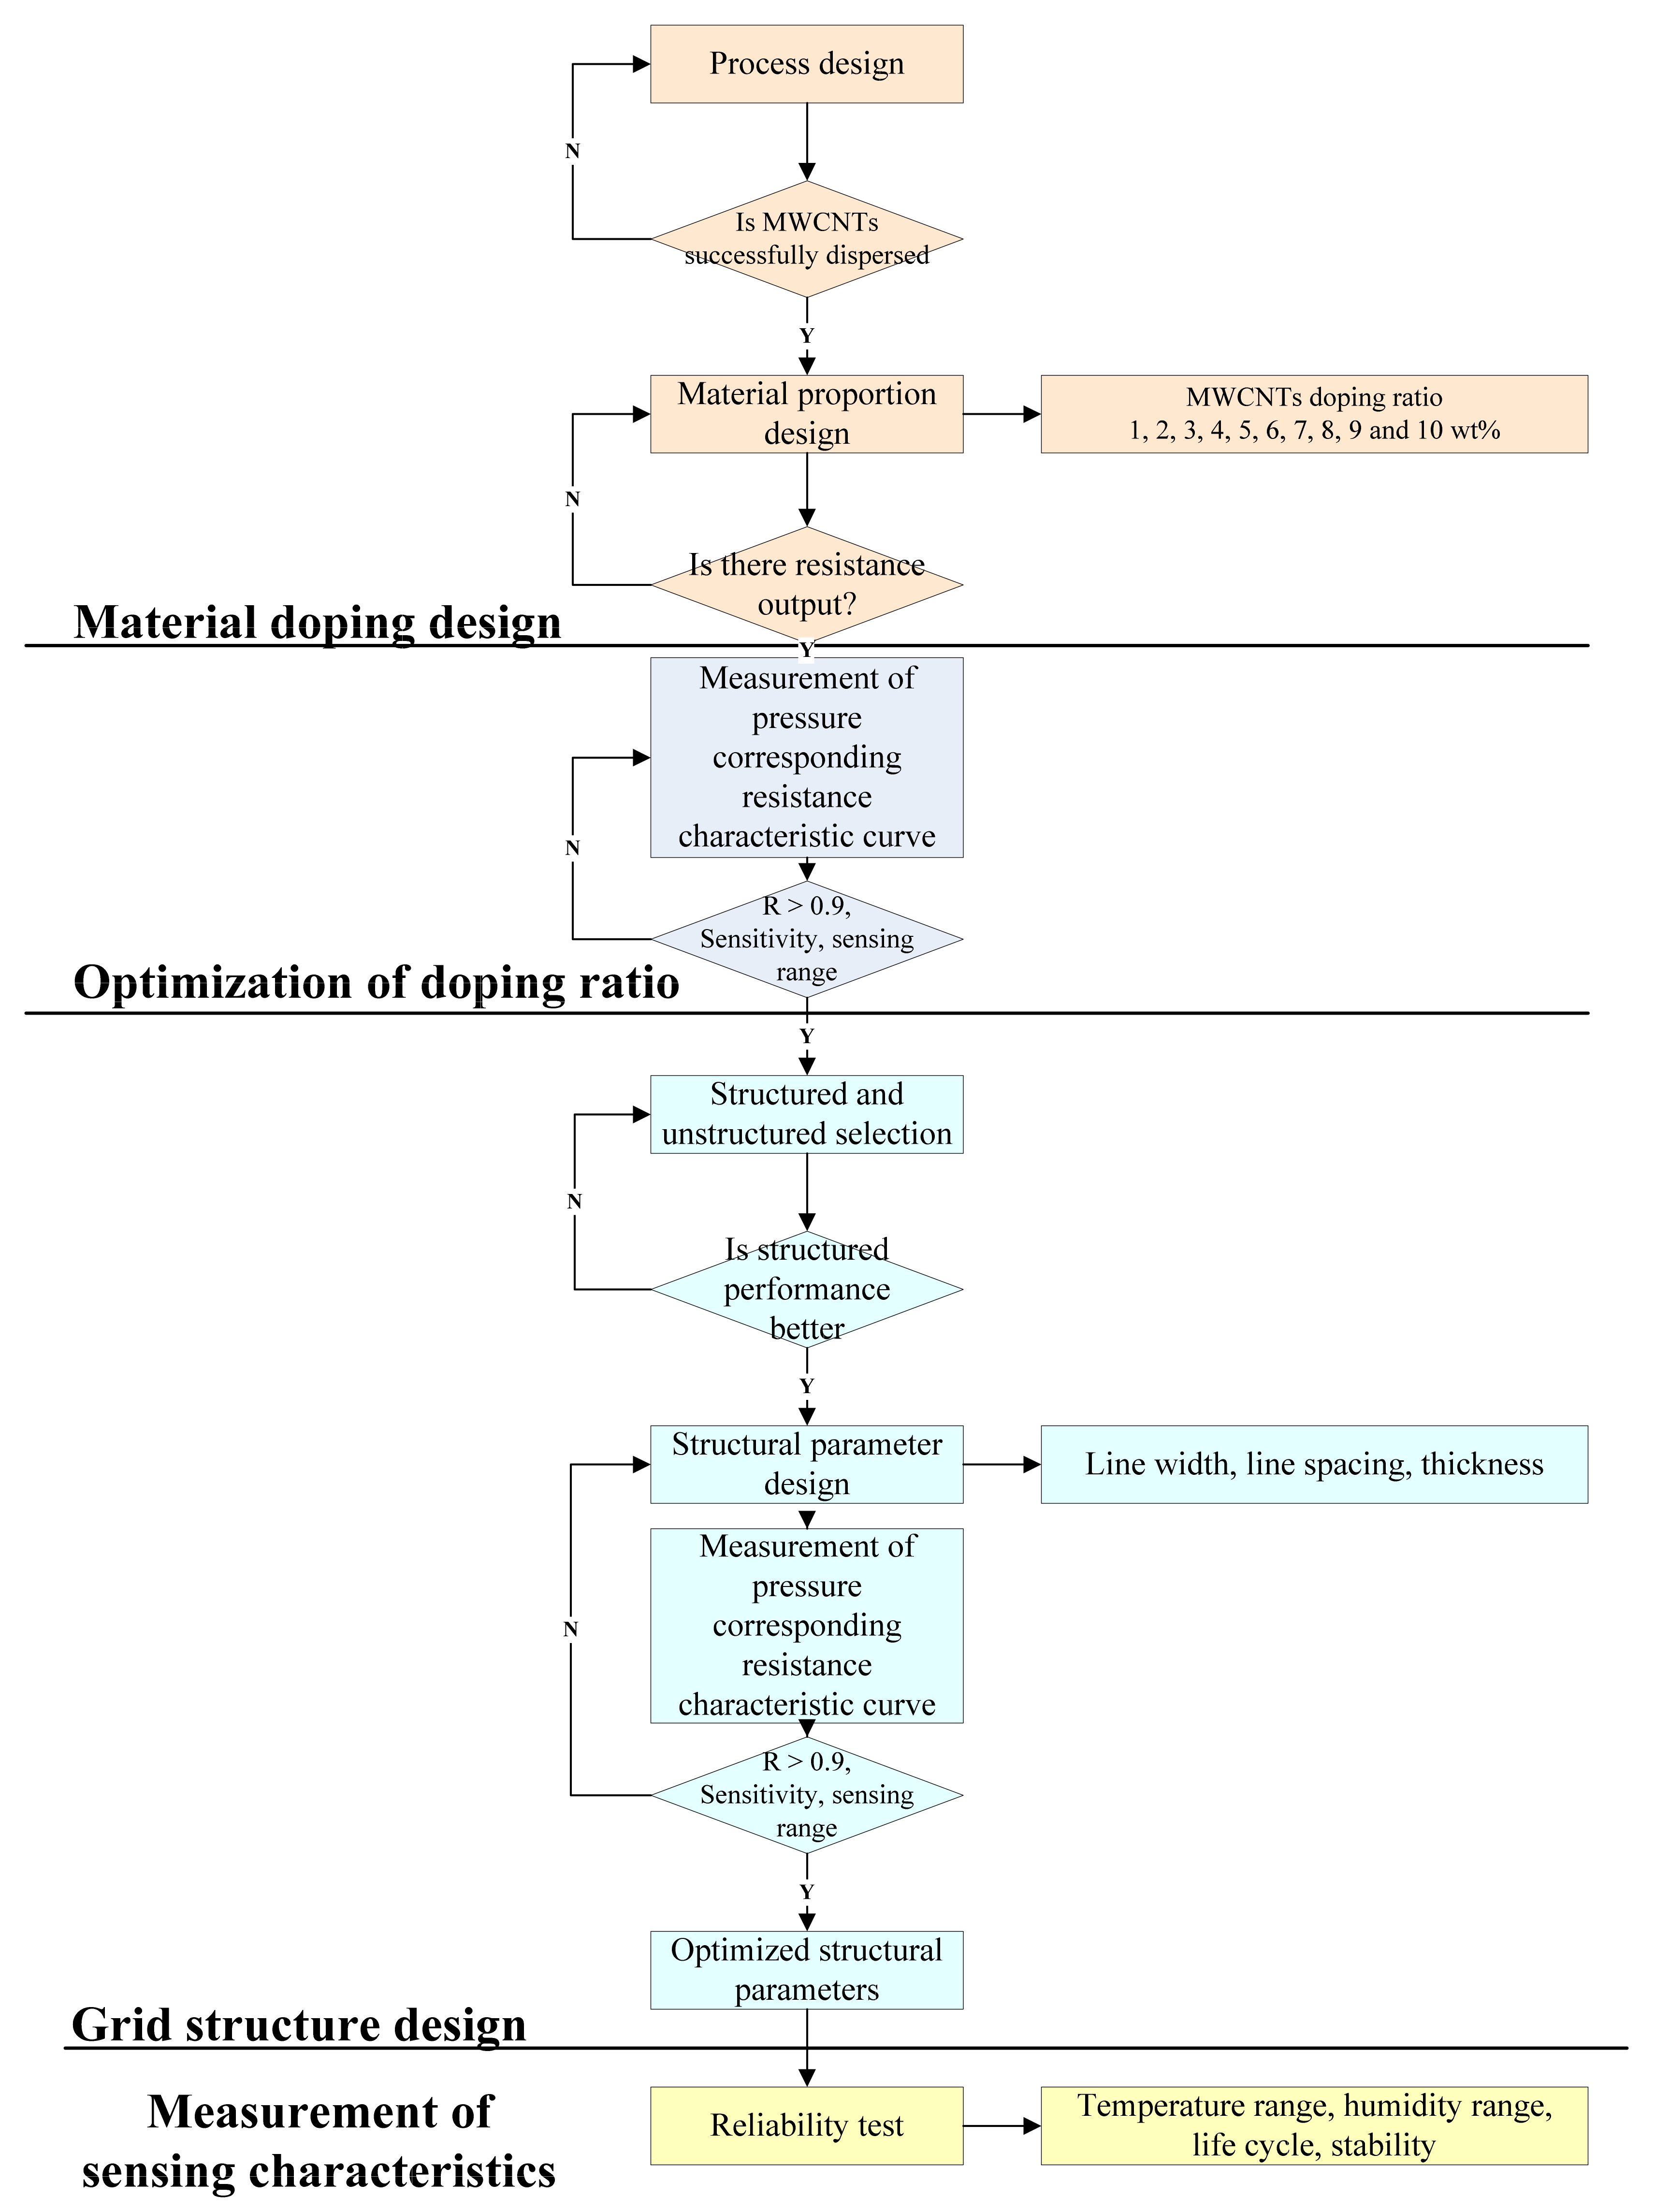
Figure 1.
Flow diagram to highlight the research process of the proposed tactile sensor.
Figure 1.
Flow diagram to highlight the research process of the proposed tactile sensor.
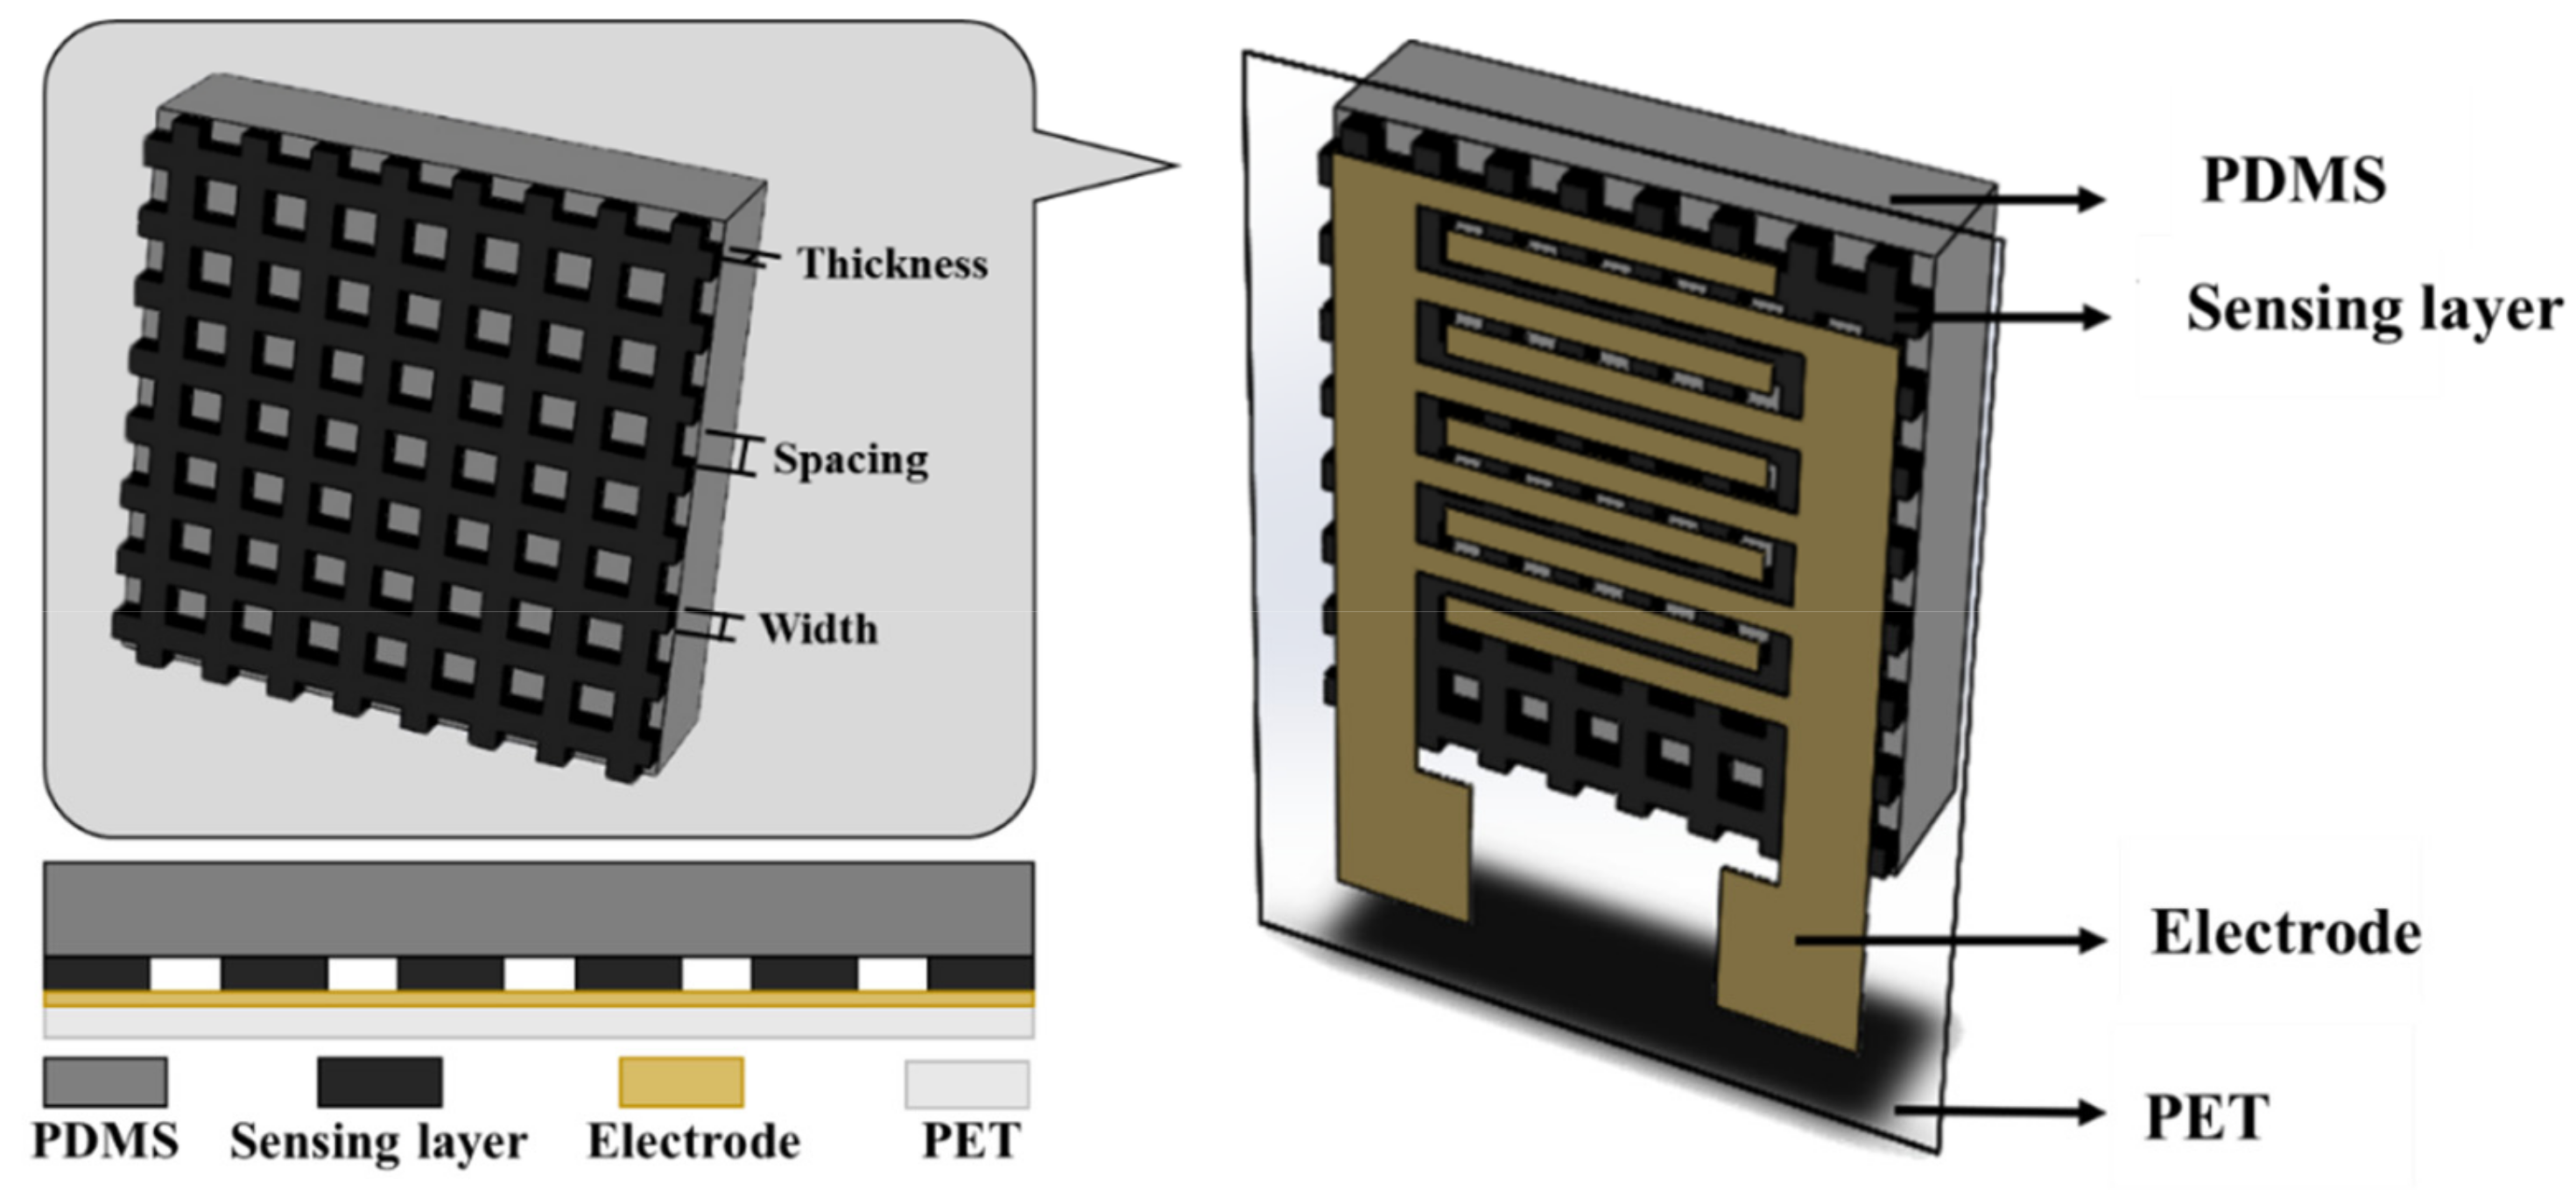
Figure 2.
Schematic of the flexible piezoresistive tactile sensor with grid–type microstructures.
Figure 2.
Schematic of the flexible piezoresistive tactile sensor with grid–type microstructures.
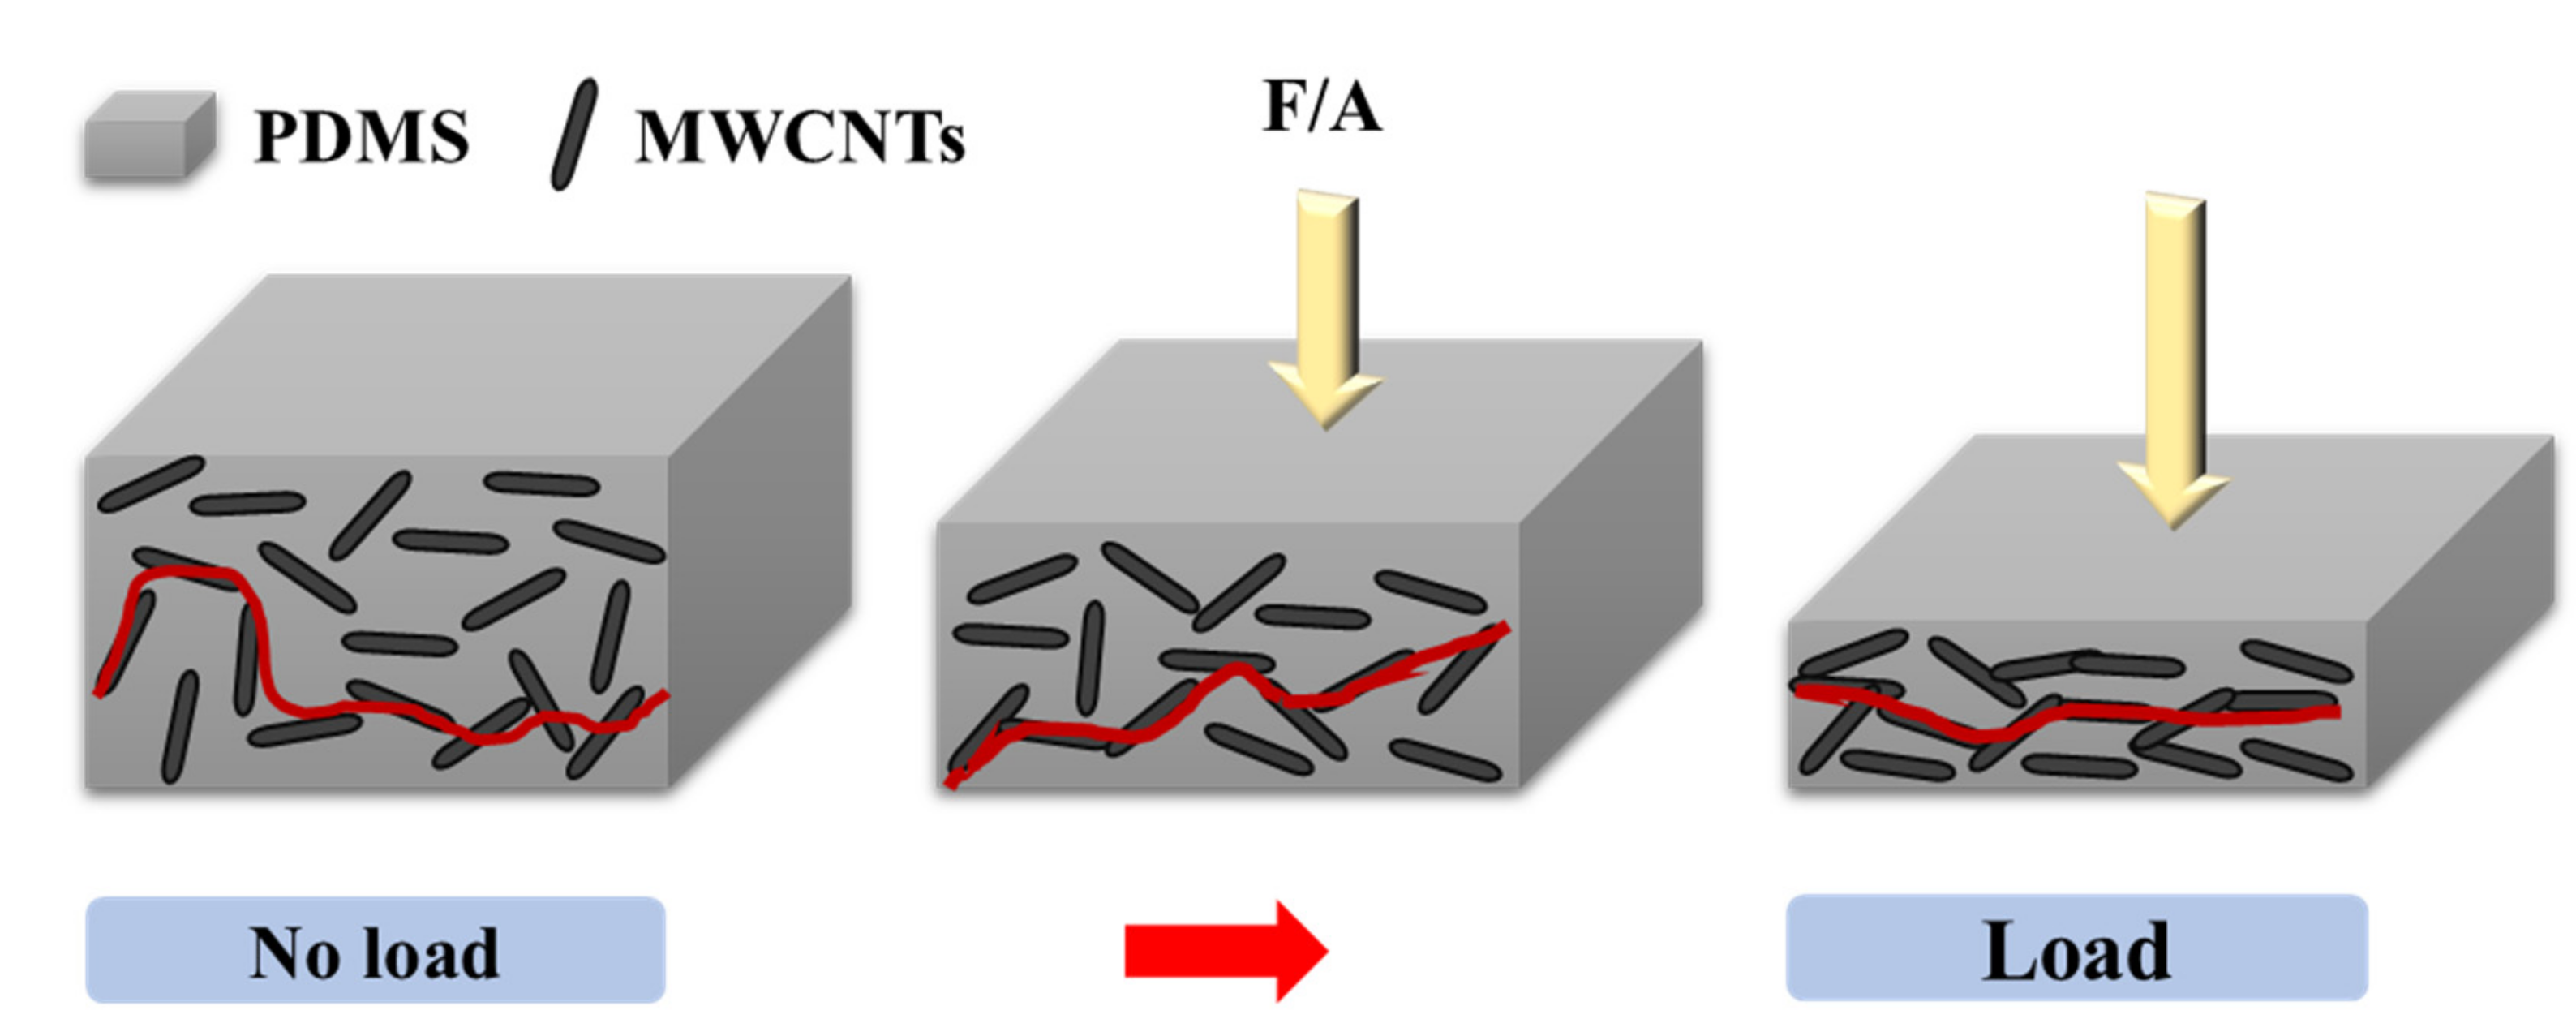
Figure 3.
Schematic illustration of the sensor operation principle.
Figure 3.
Schematic illustration of the sensor operation principle.
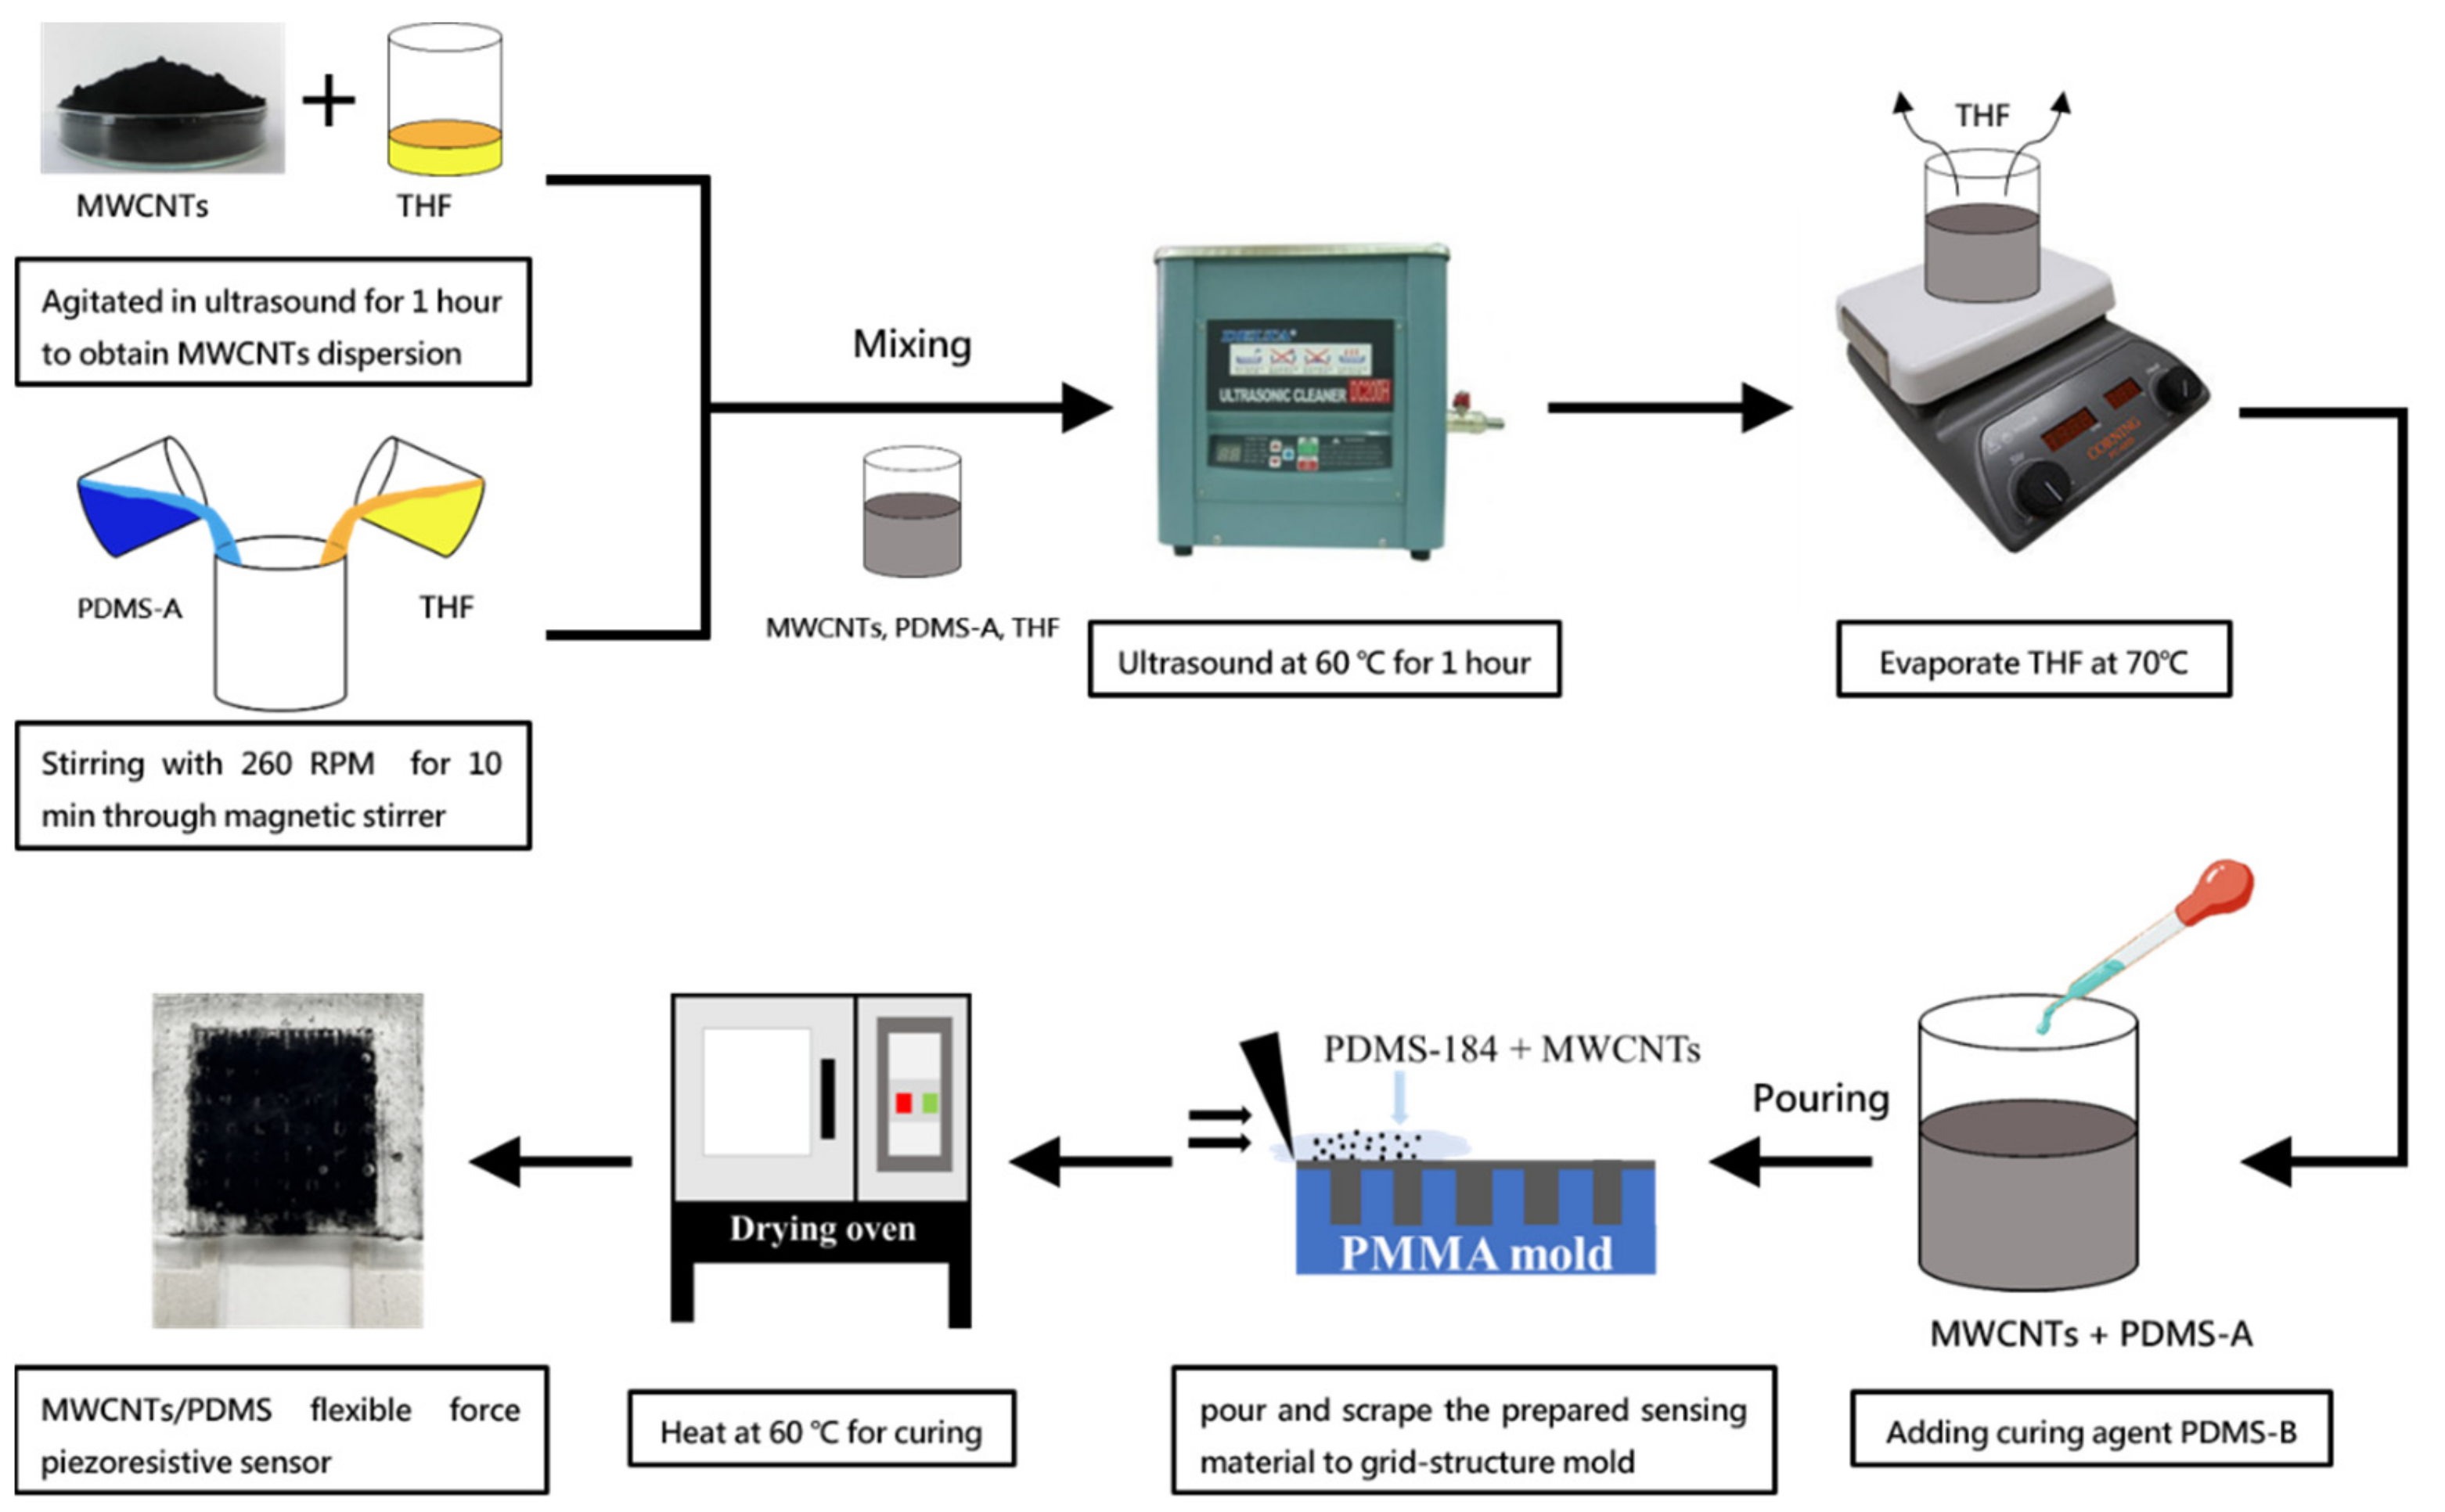
Figure 4.
Schematic of the process flow diagram to fabricate the sensing material.
Figure 4.
Schematic of the process flow diagram to fabricate the sensing material.
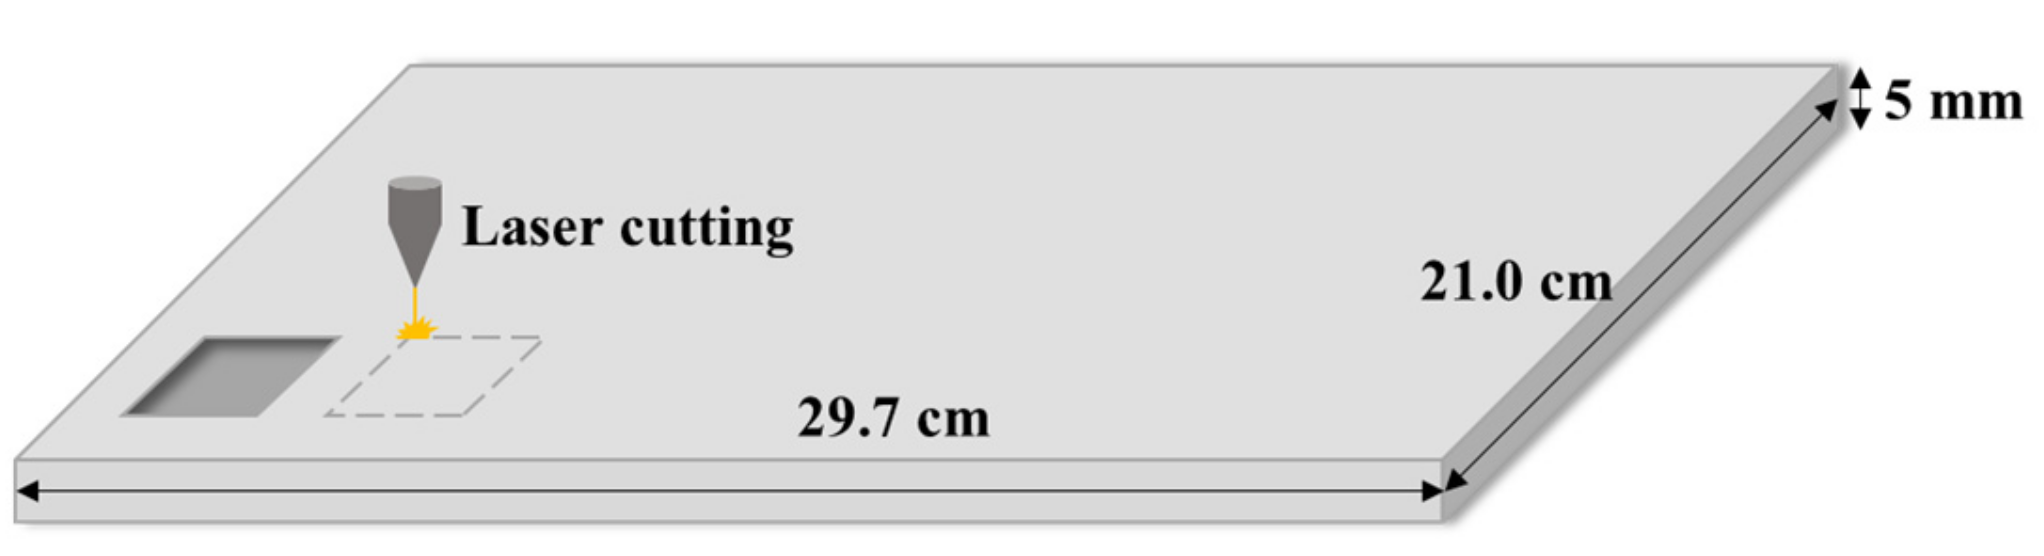
Figure 5.
Schematic of the laser processing method to fabricate the mold.
Figure 5.
Schematic of the laser processing method to fabricate the mold.
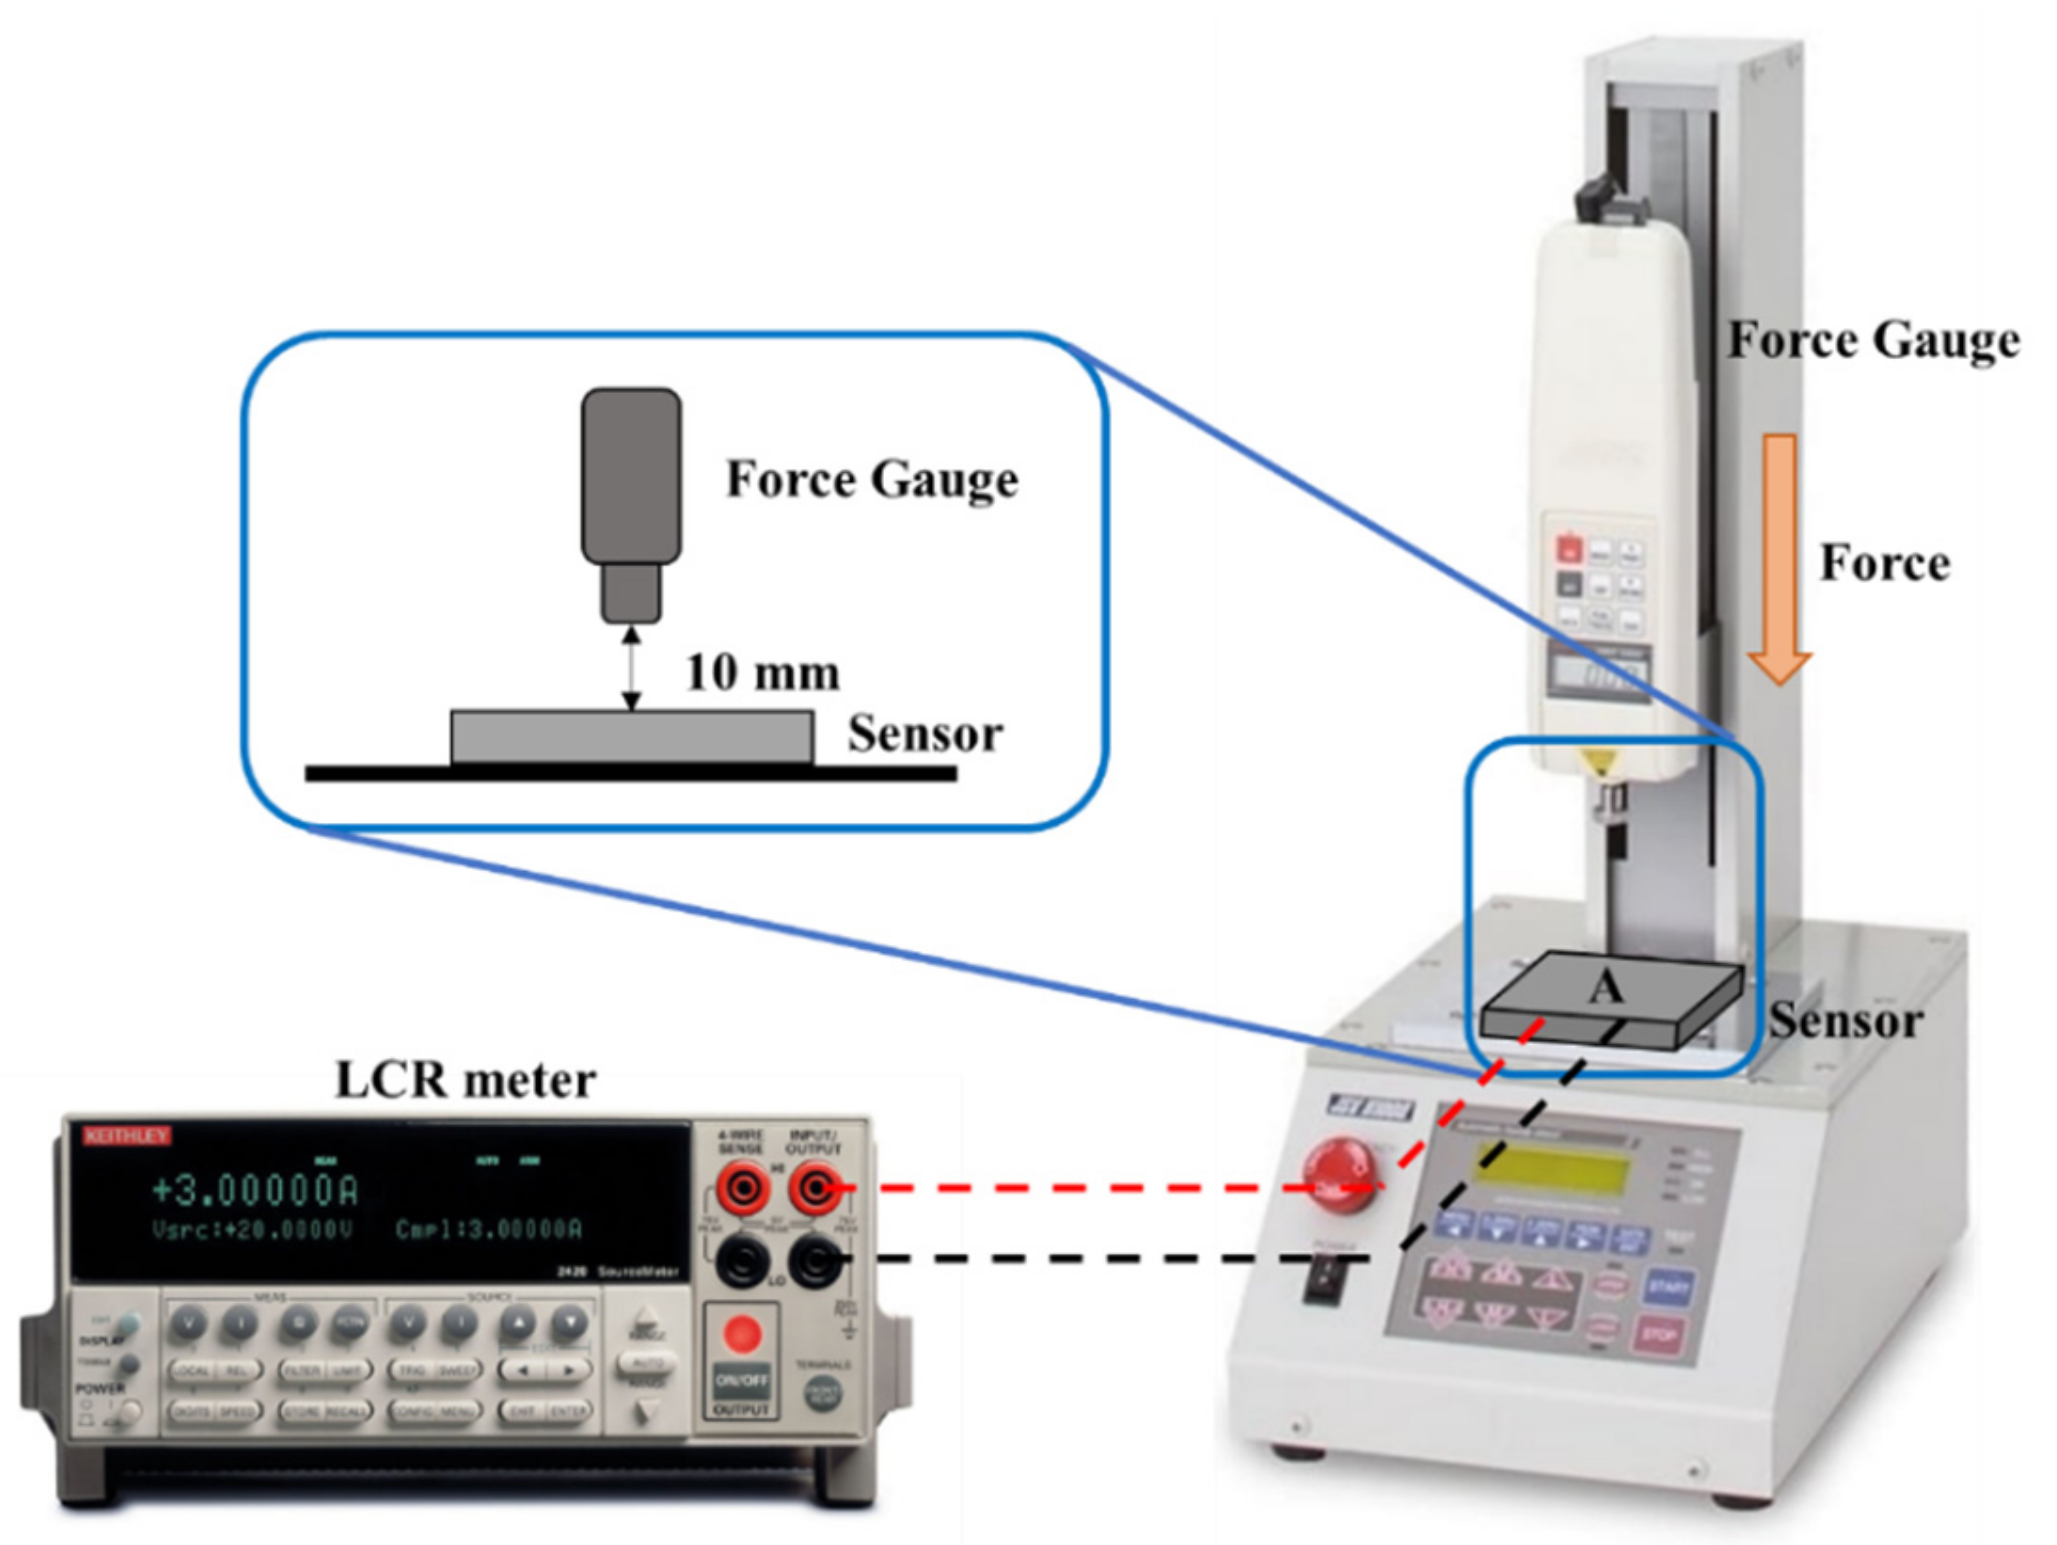
Figure 6.
Schematic of the static normal force measurement platform.
Figure 6.
Schematic of the static normal force measurement platform.
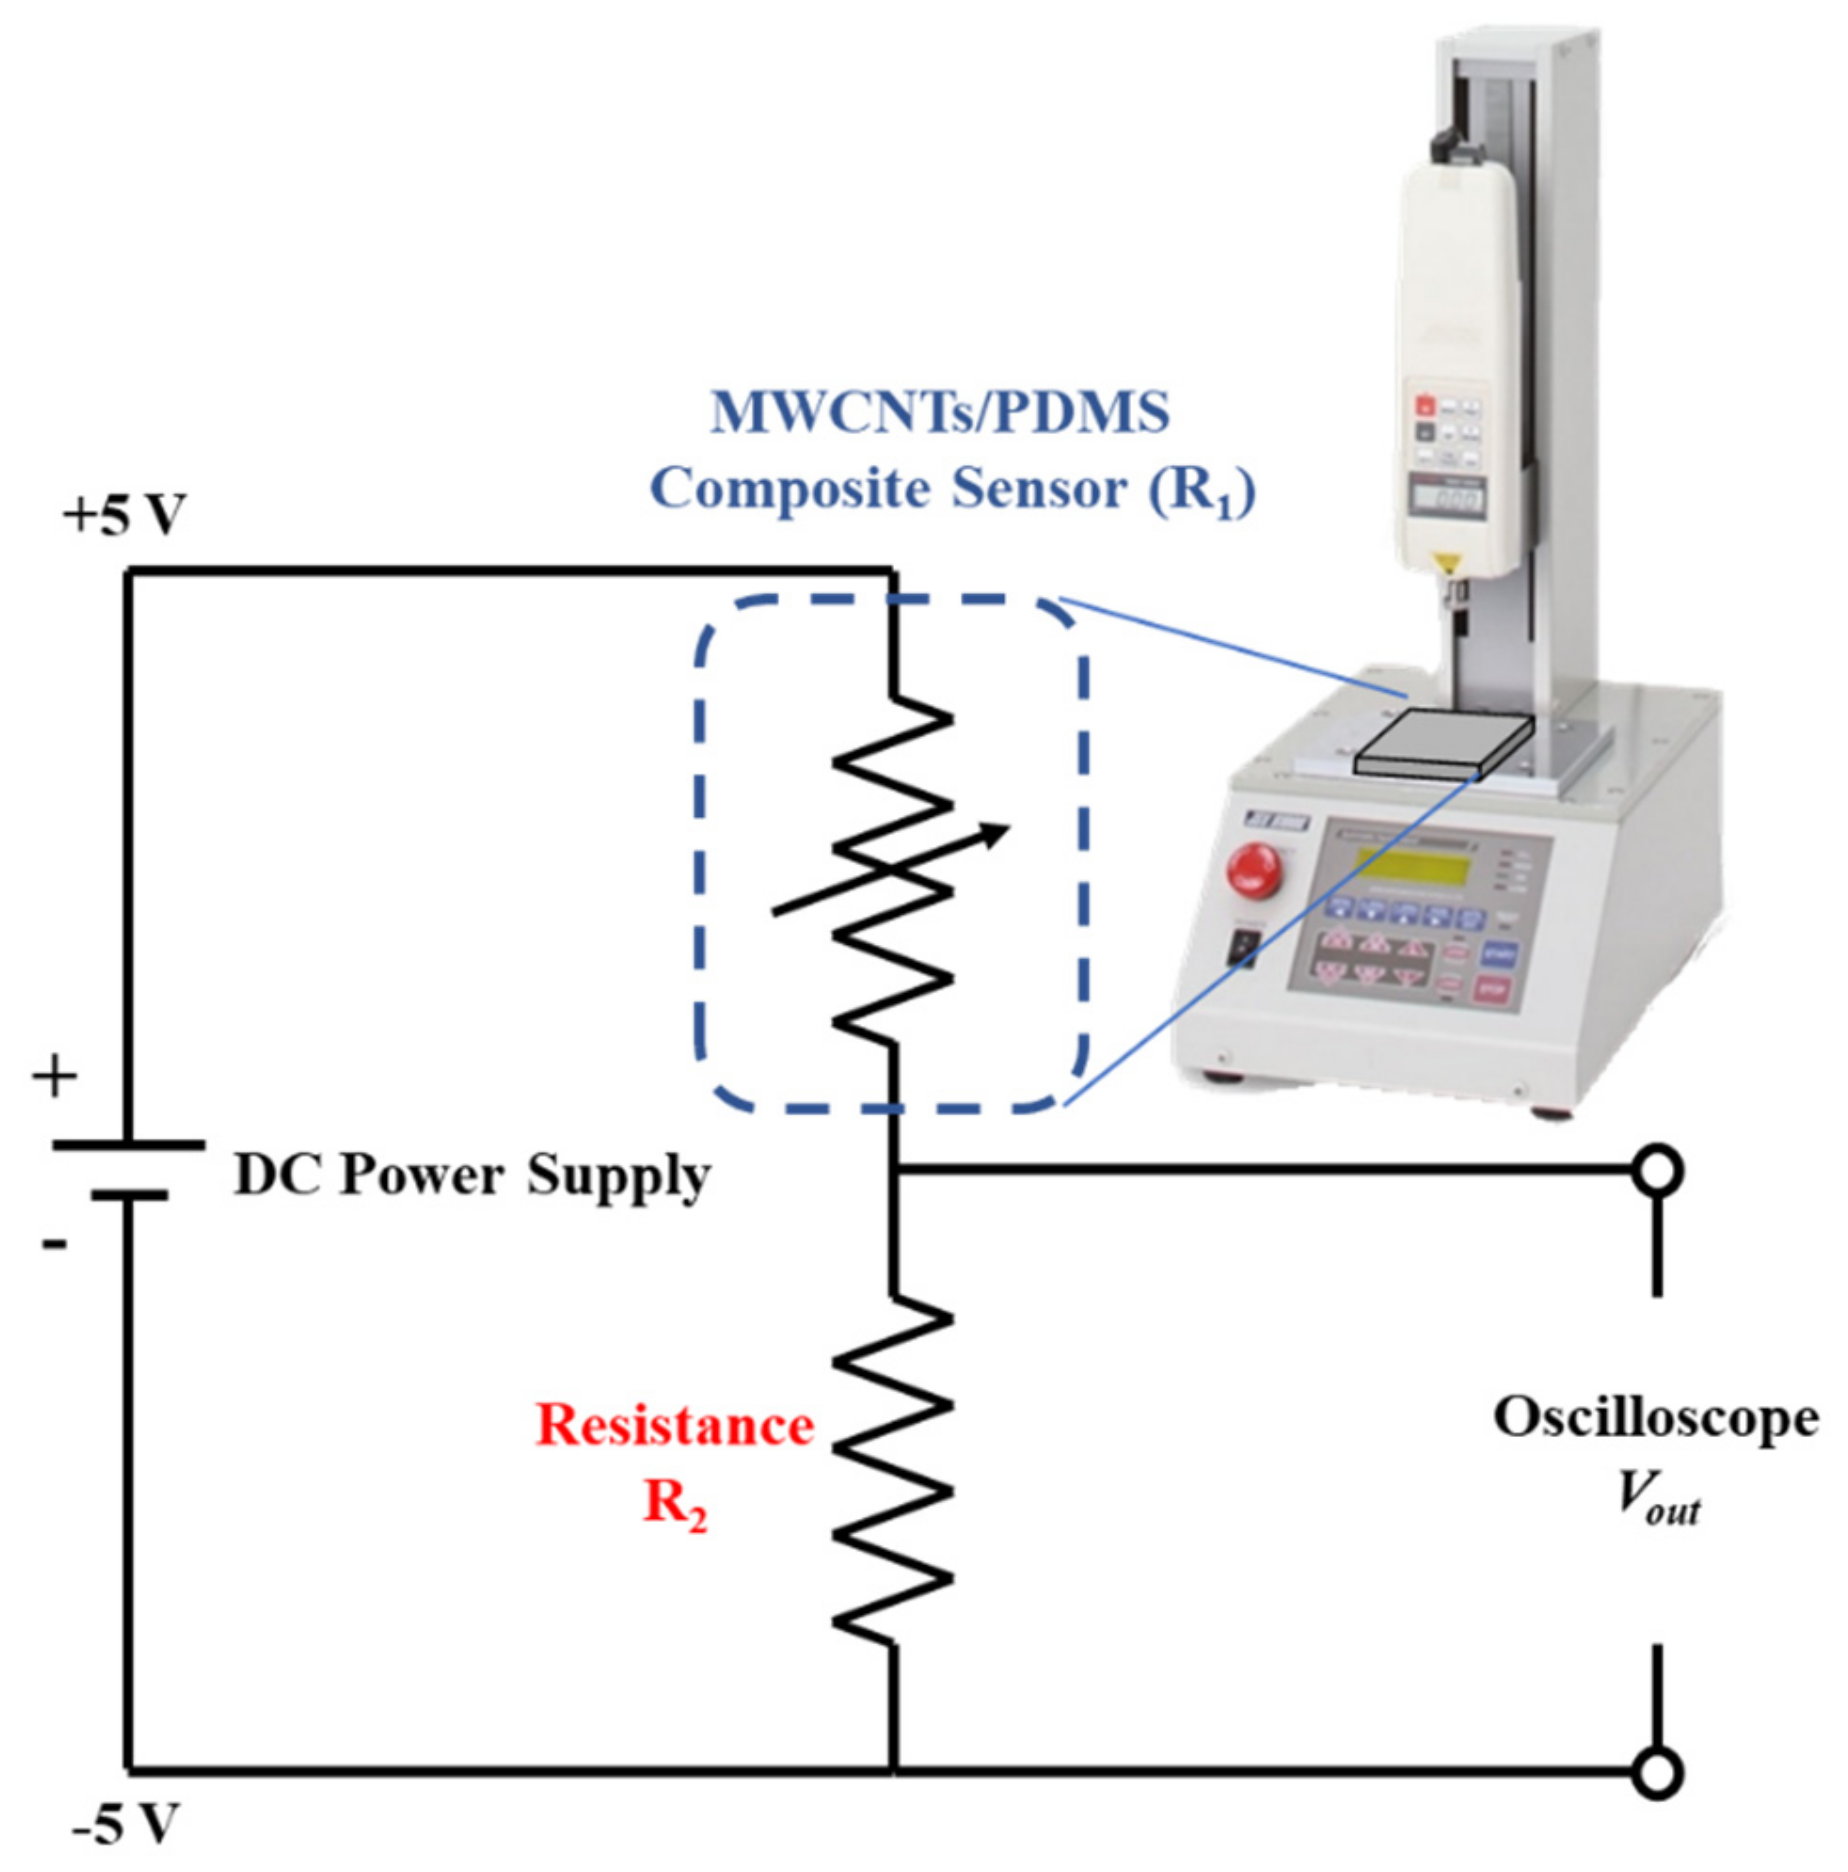
Figure 7.
The linear conversion system architecture for signal output.
Figure 7.
The linear conversion system architecture for signal output.
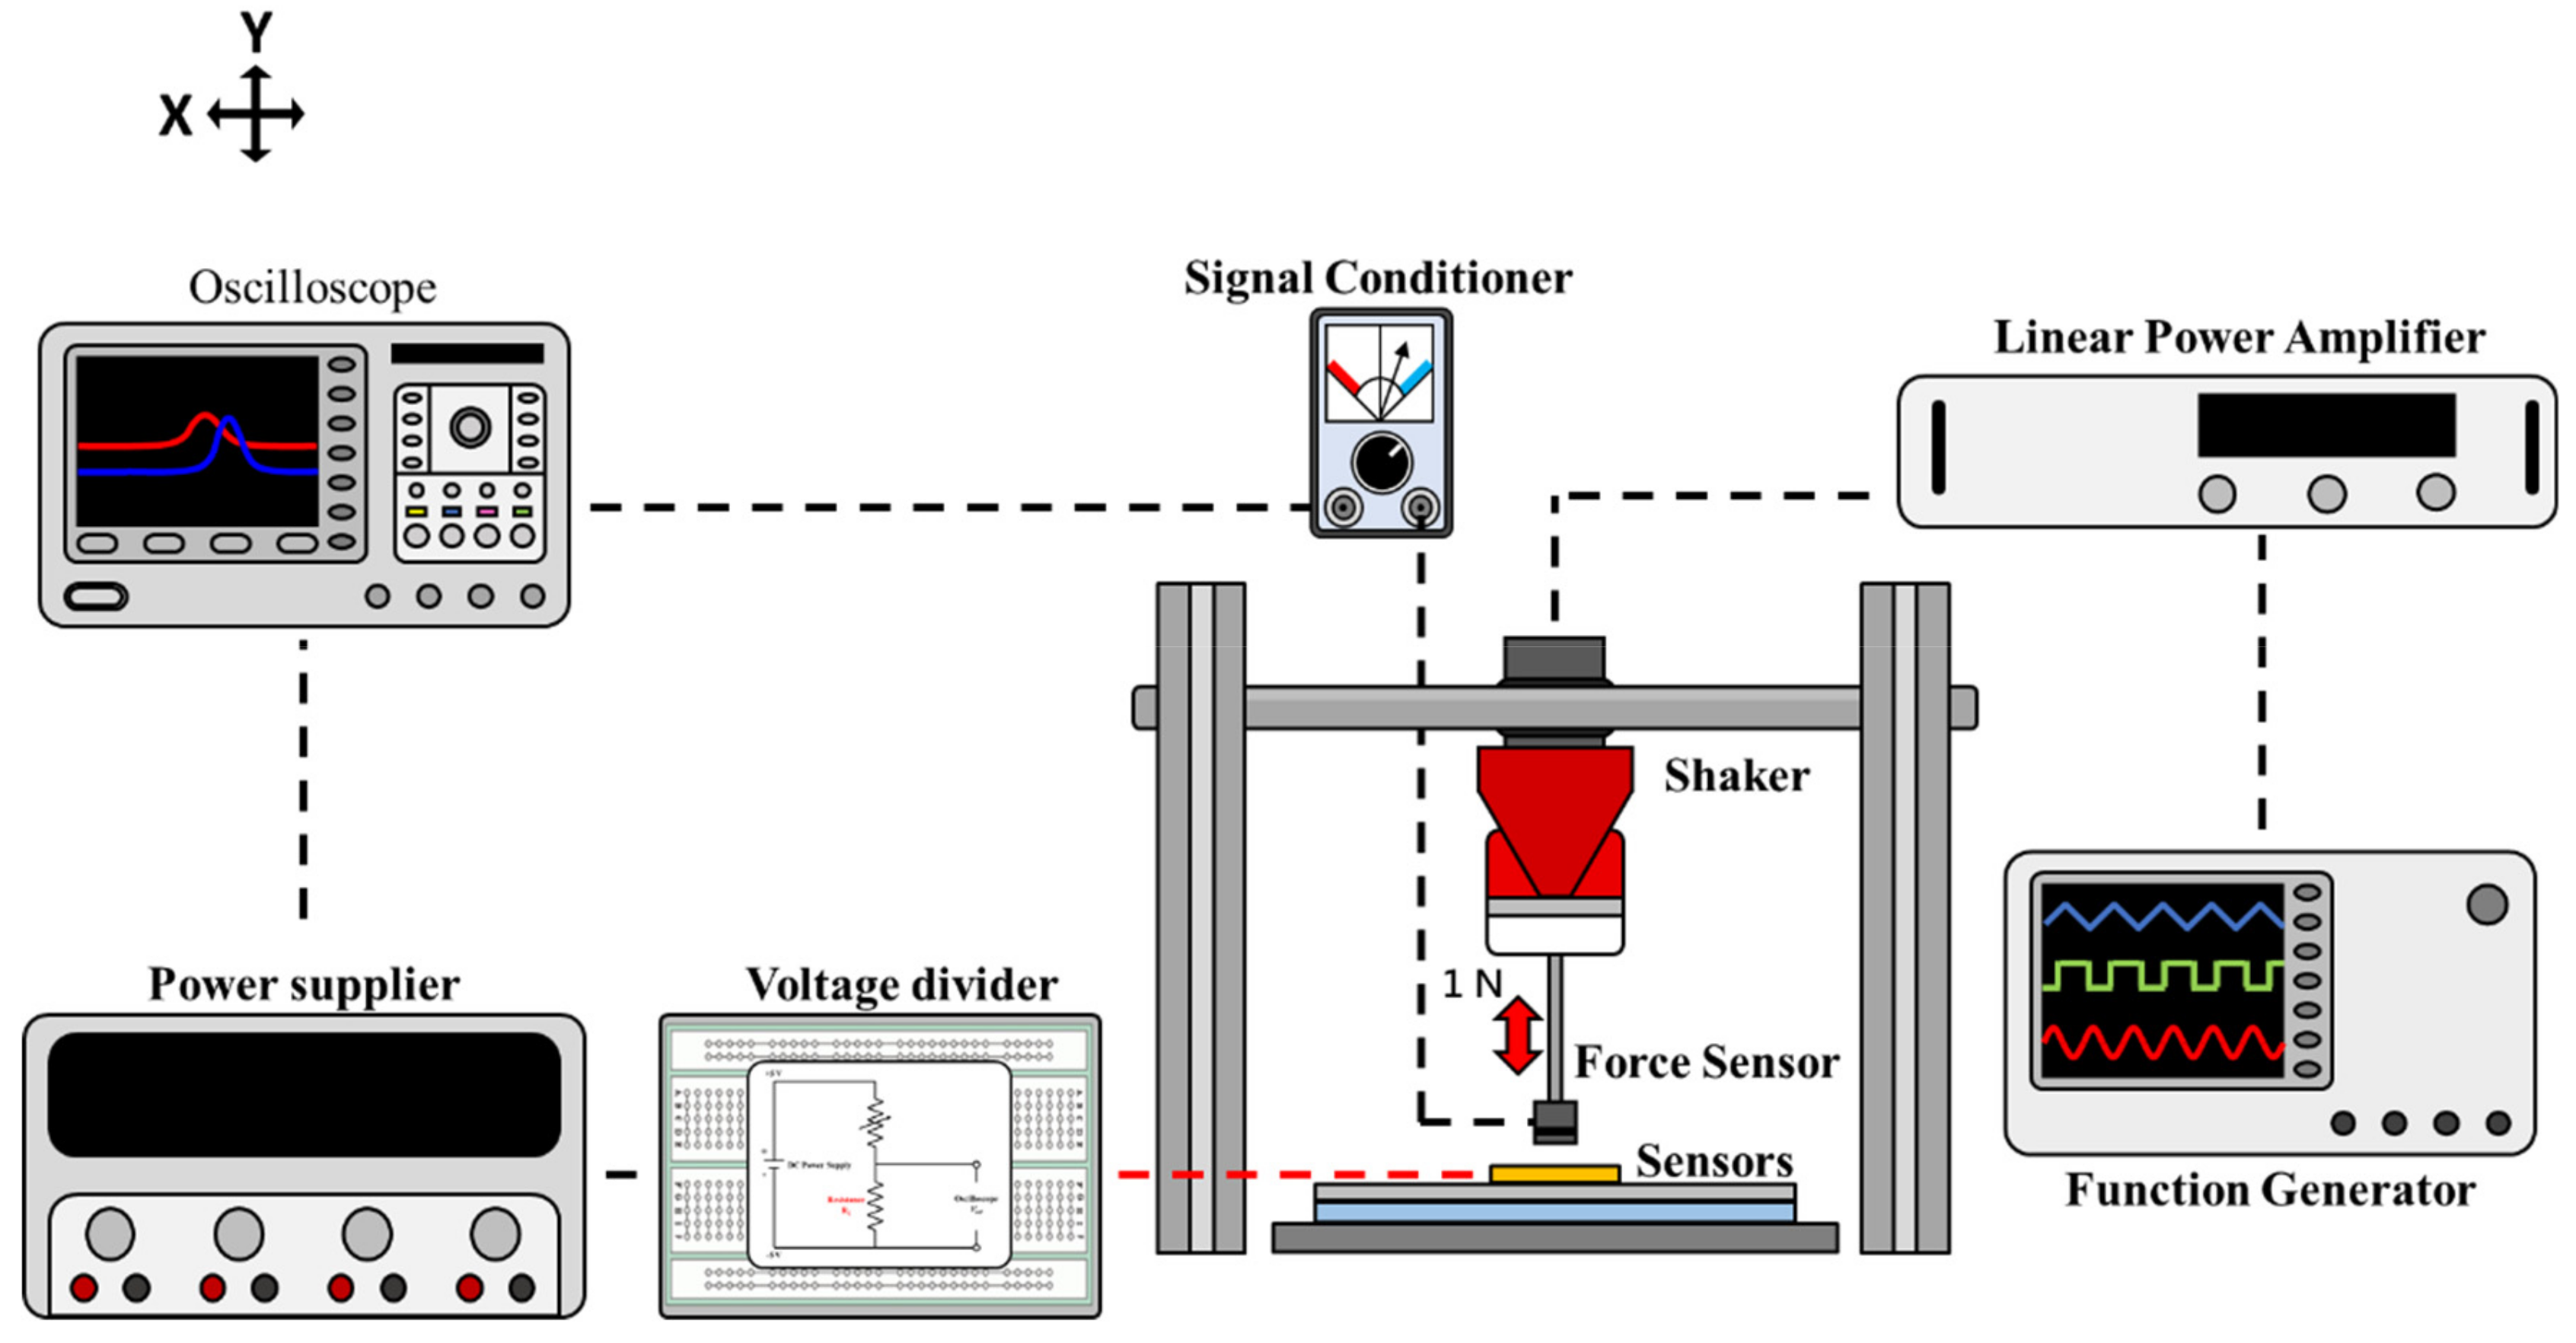
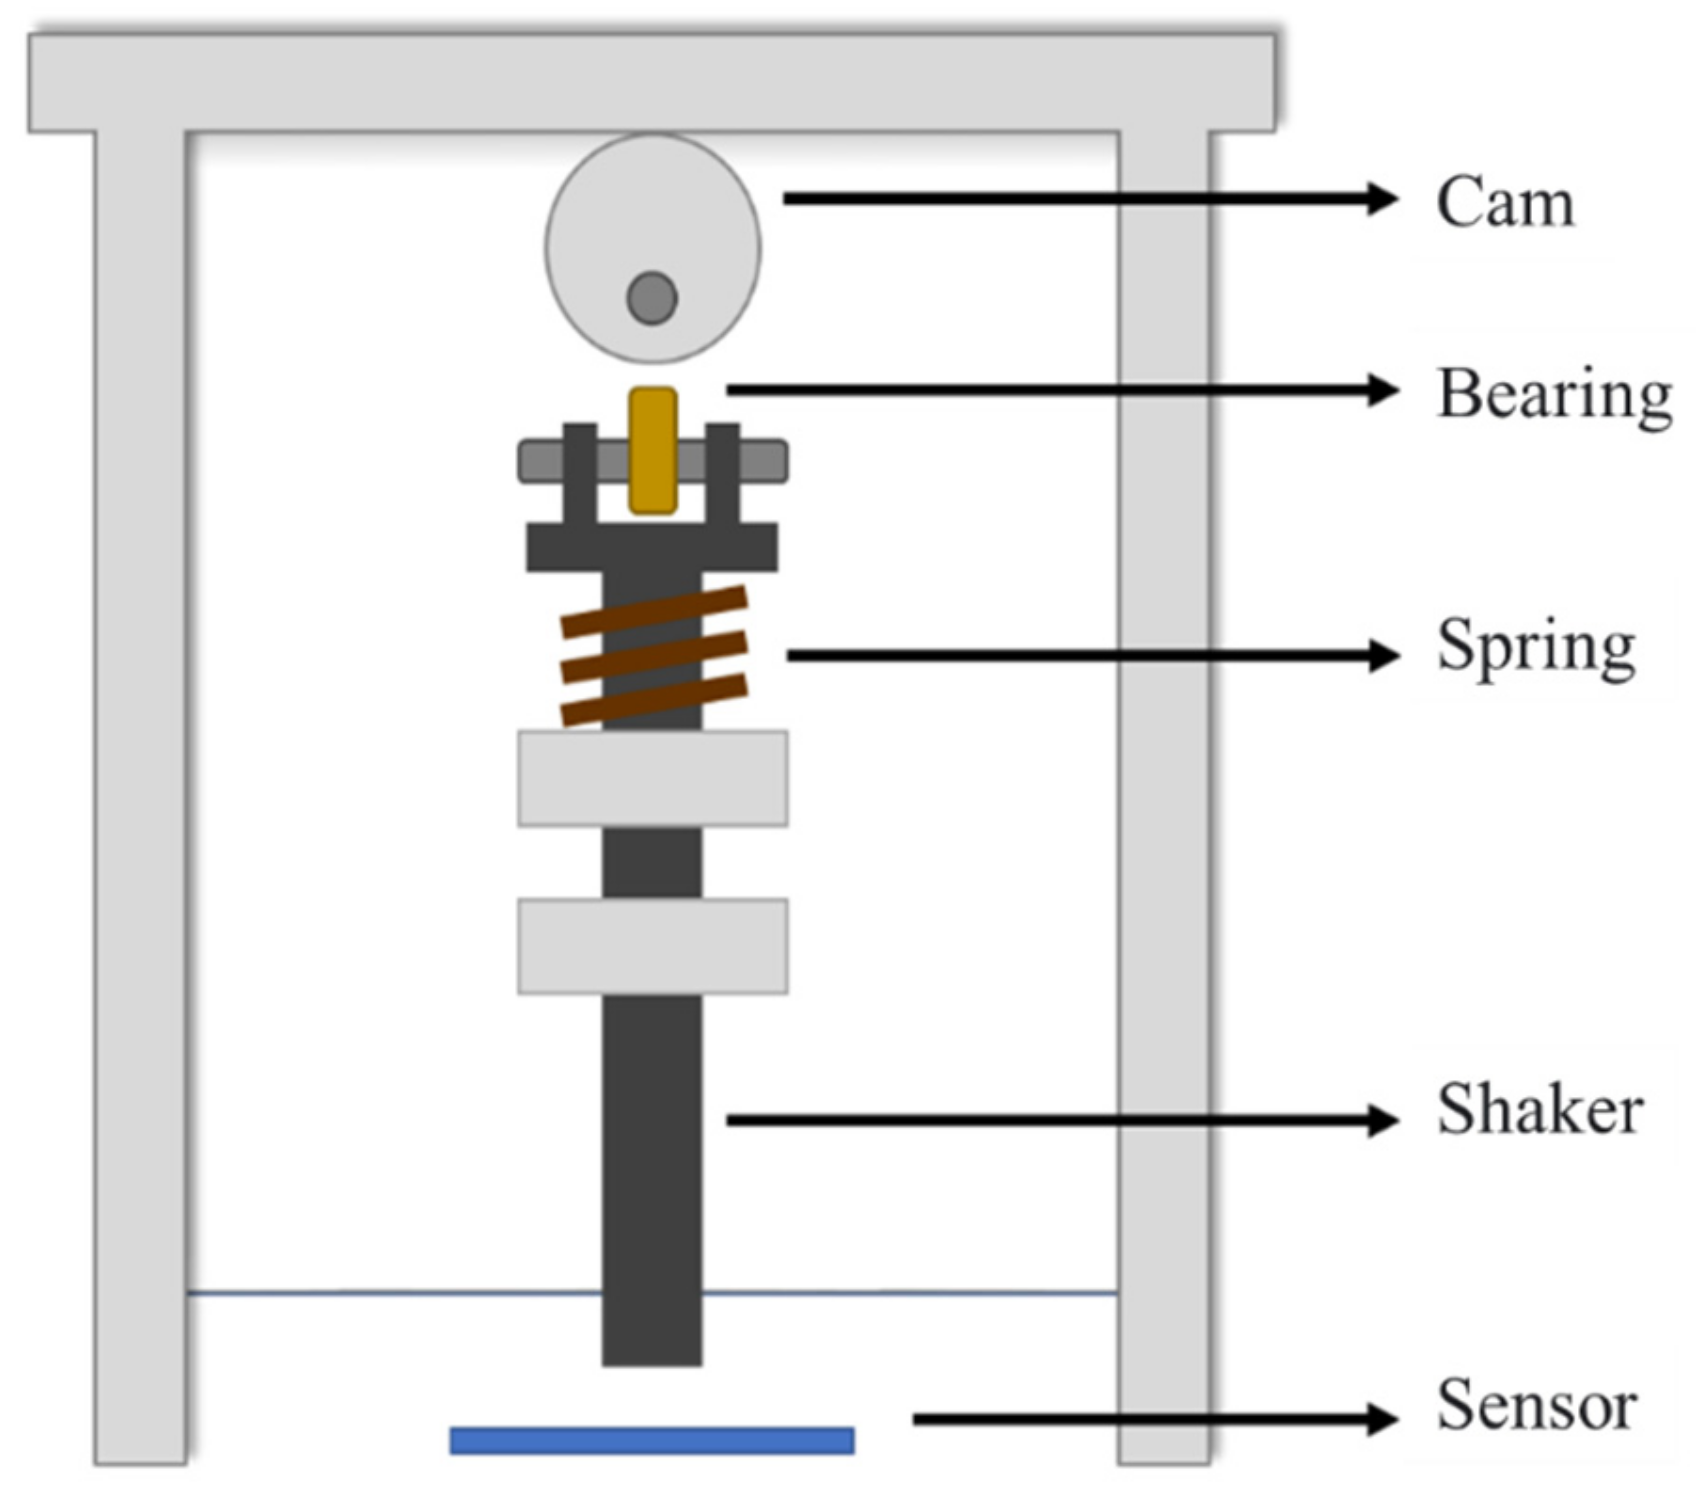
Figure 8.
Schematic of the dynamic normal force measurement platform.
Figure 8.
Schematic of the dynamic normal force measurement platform.
Figure 9.
Self-made miniaturized dynamic force platform for analyzing the effects of environmental temperature on the tactile sensing response.
Figure 9.
Self-made miniaturized dynamic force platform for analyzing the effects of environmental temperature on the tactile sensing response.
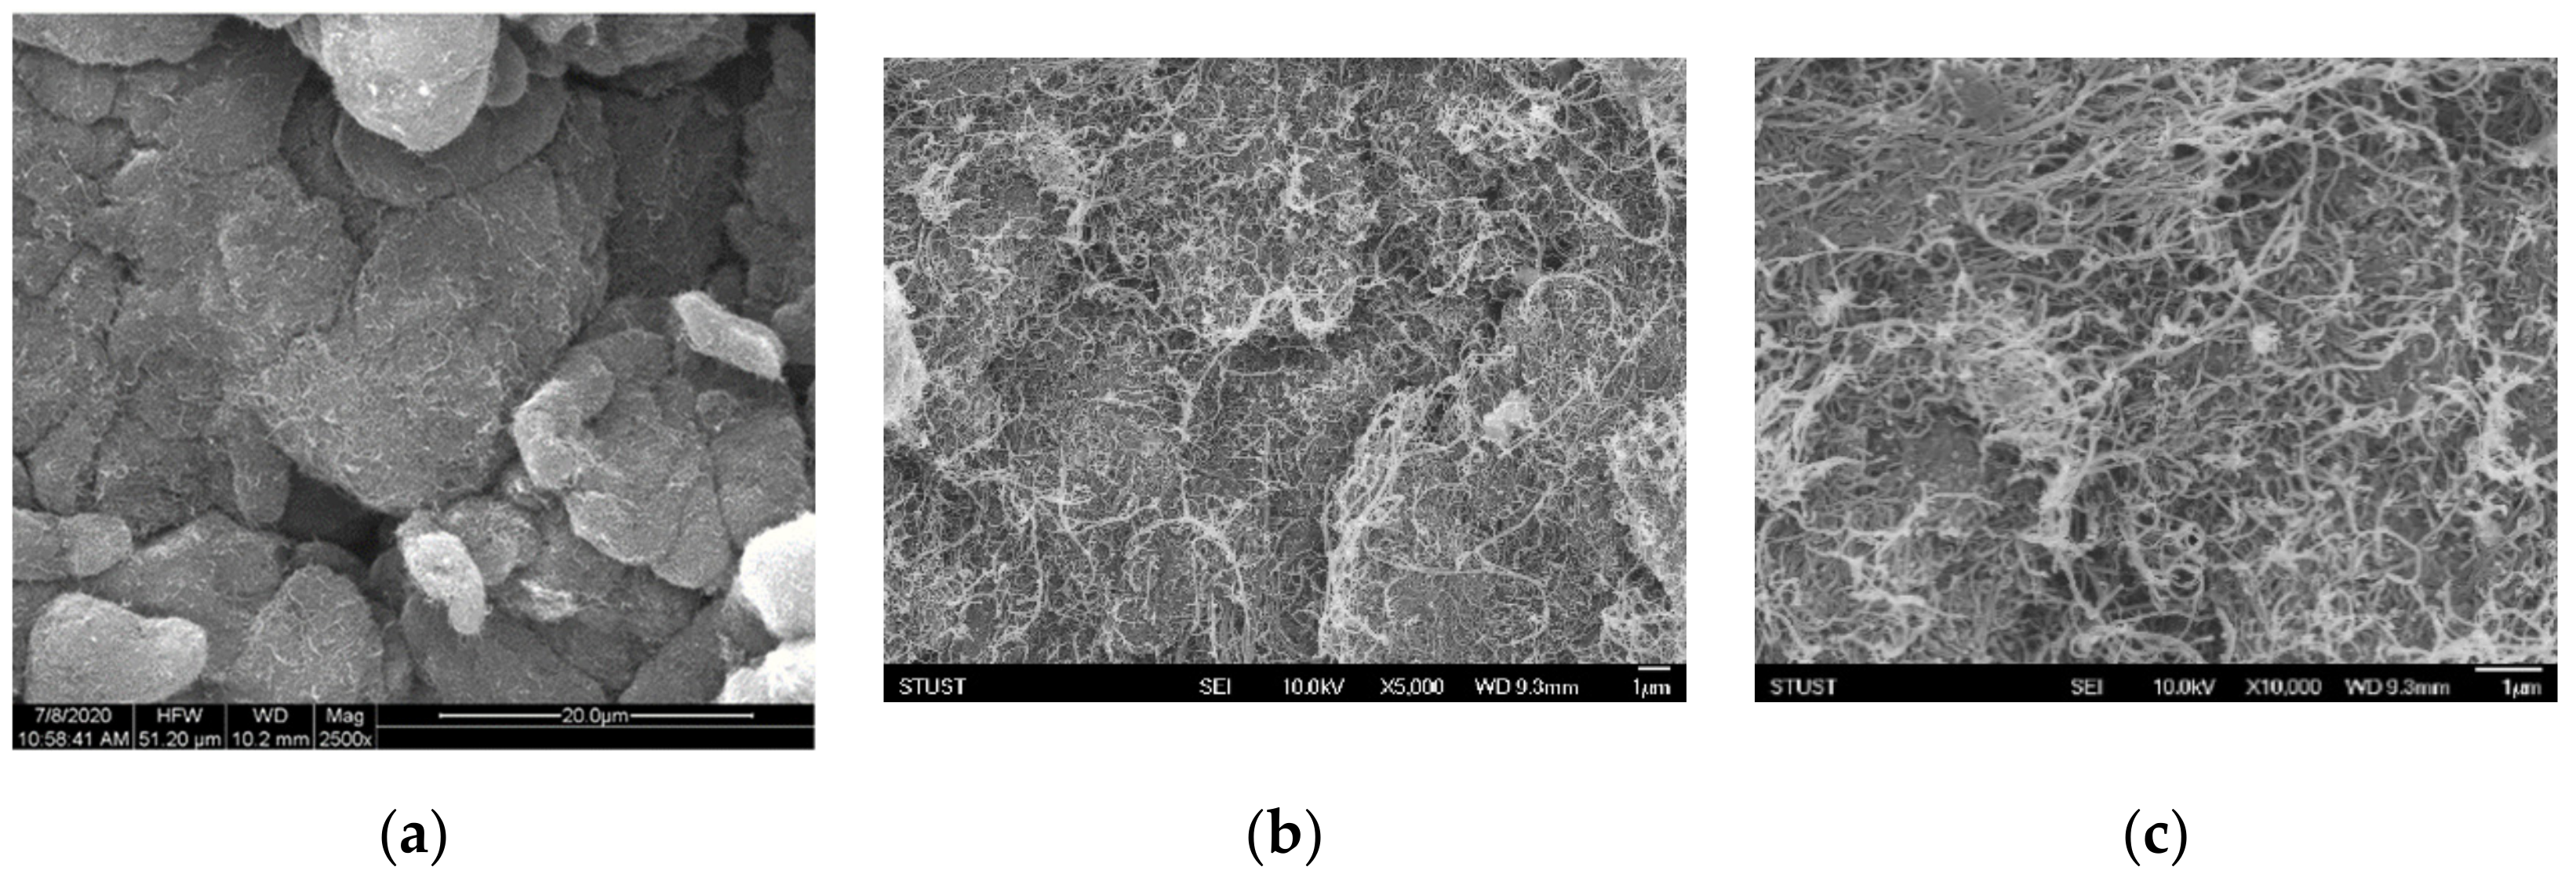
Figure 10.
Scanning electron microscopy (SEM) images of the original MWCNT at magnifications of (a) 2500×, (b) 5000×, and (c) 10,000×.
Figure 10.
Scanning electron microscopy (SEM) images of the original MWCNT at magnifications of (a) 2500×, (b) 5000×, and (c) 10,000×.
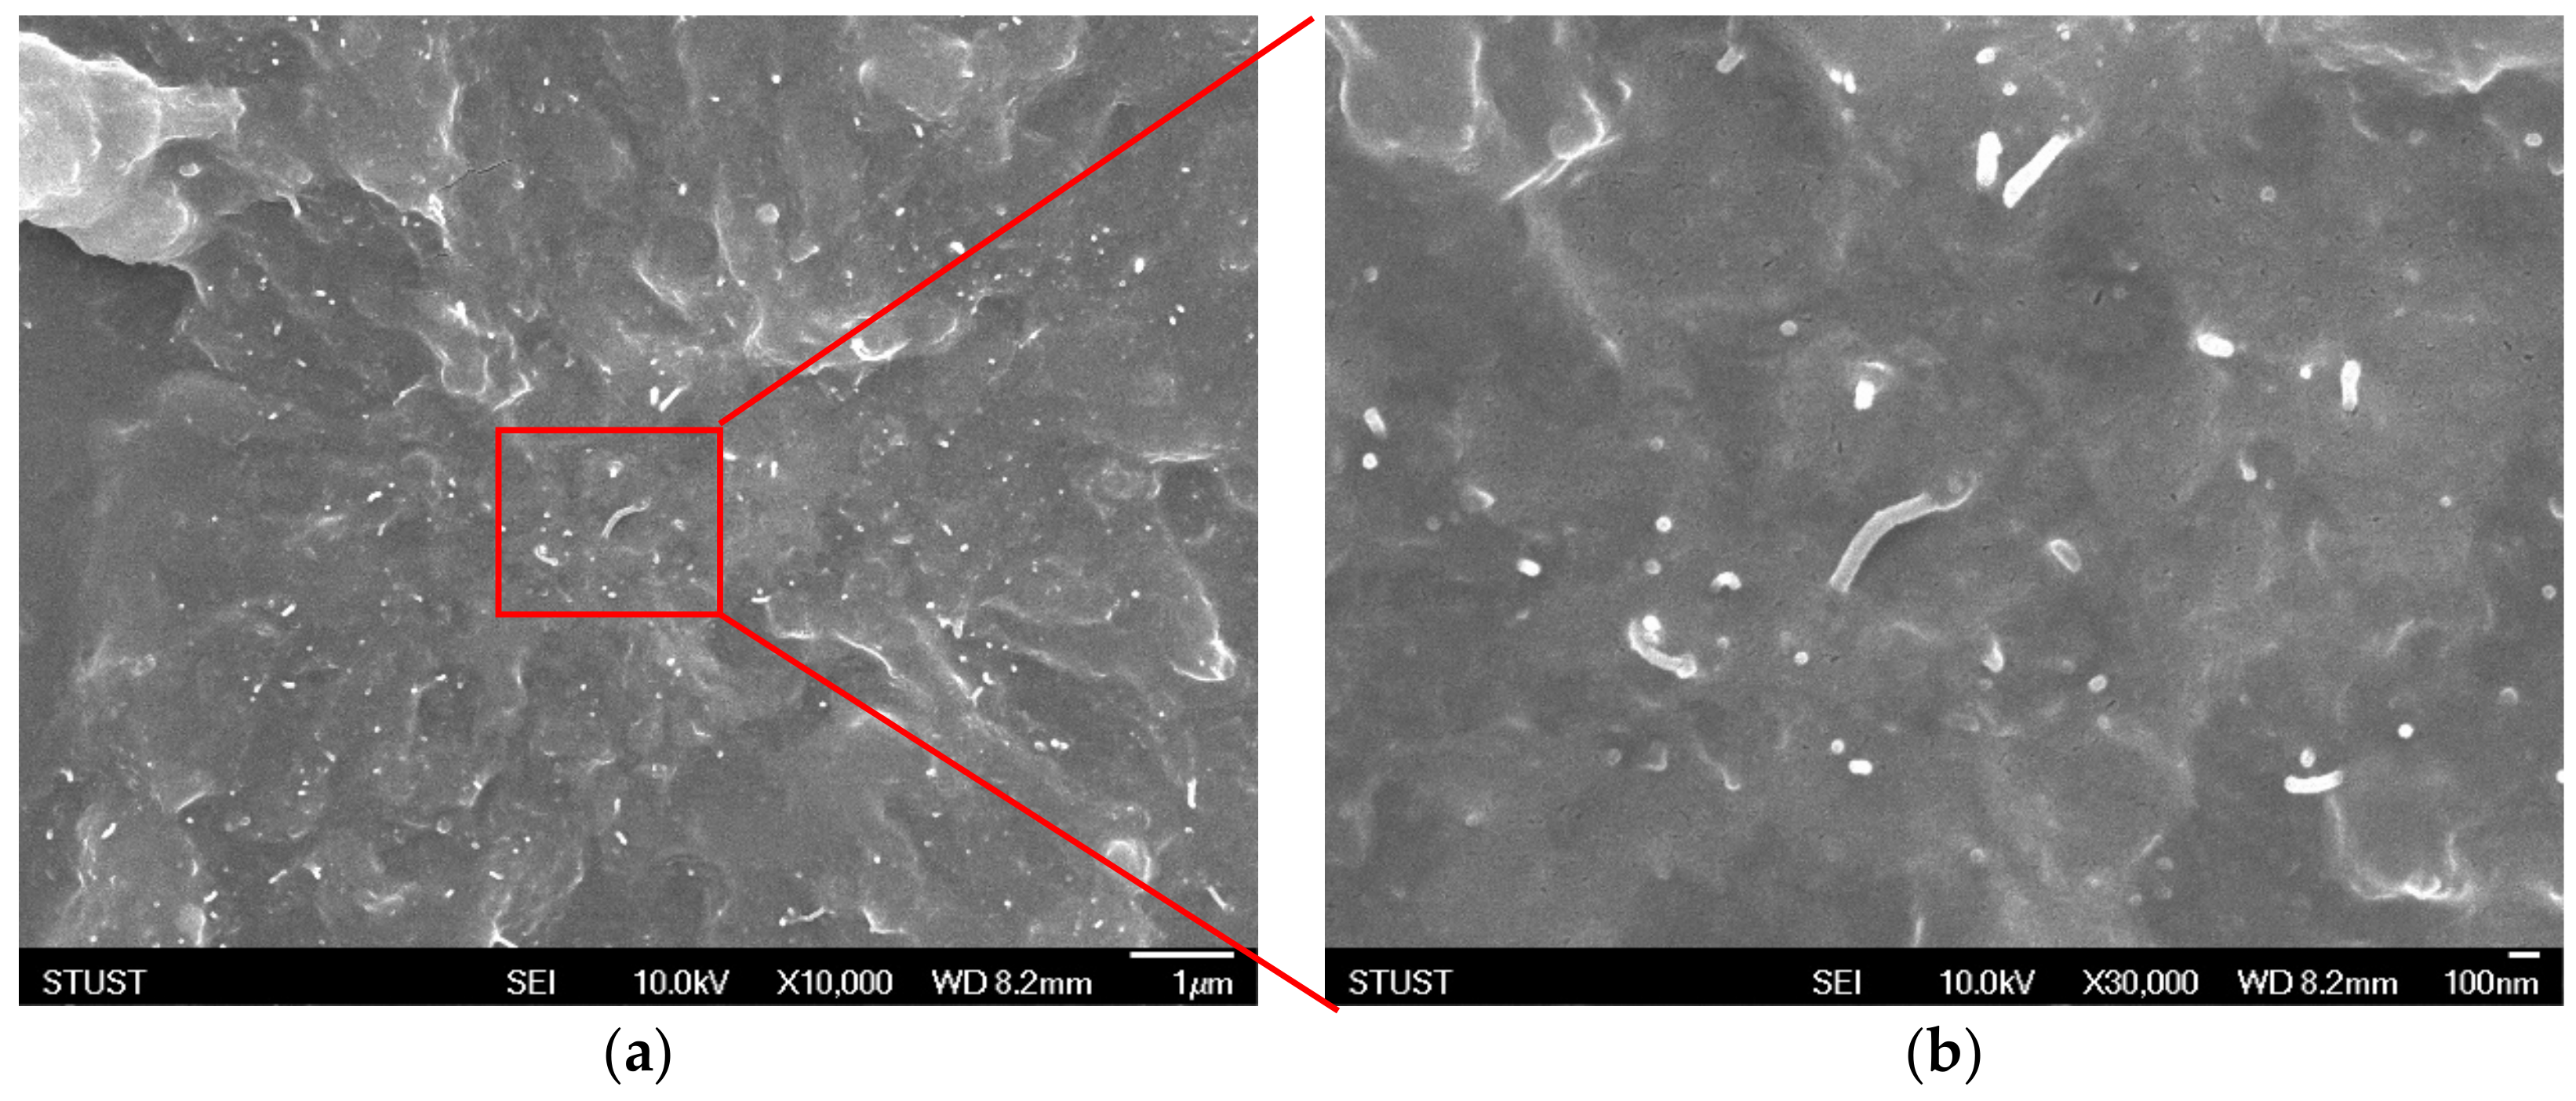
Figure 11.
Cross–sectional SEM images of the THF–dispersed MWCNT/PDMS composite at magnifications of (a) 10,000× and (b) 30,000×.
Figure 11.
Cross–sectional SEM images of the THF–dispersed MWCNT/PDMS composite at magnifications of (a) 10,000× and (b) 30,000×.
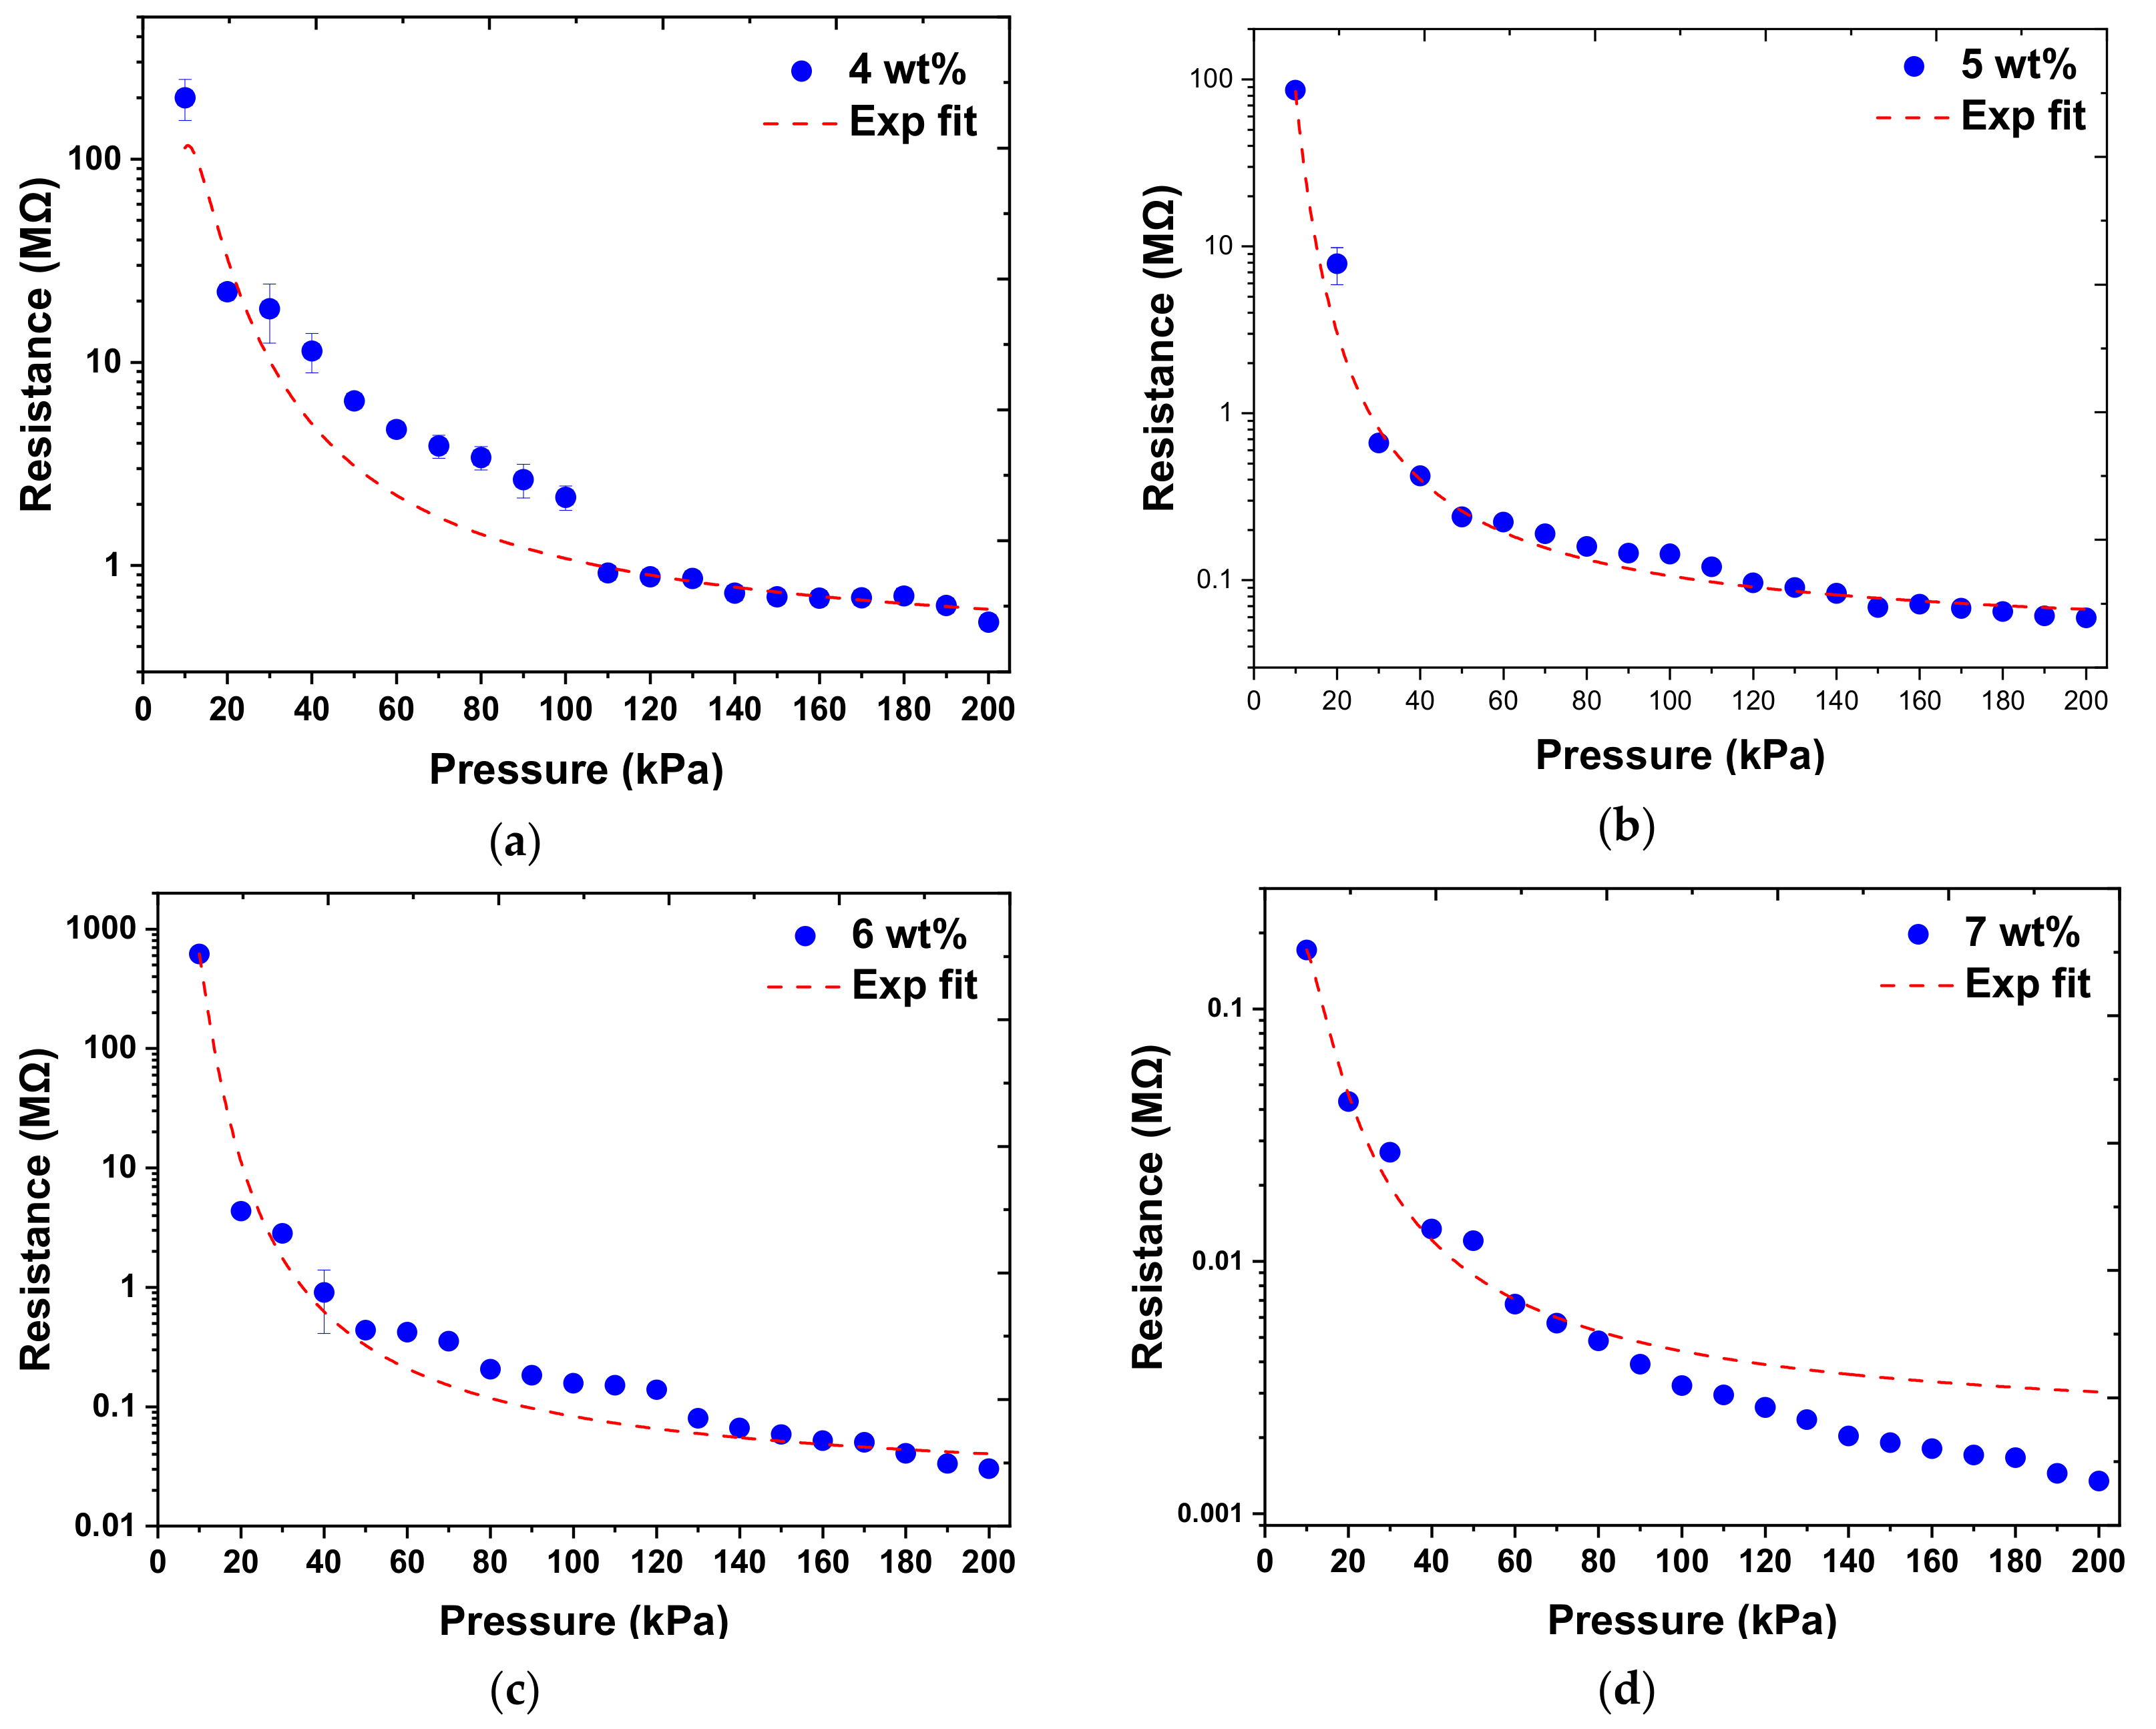
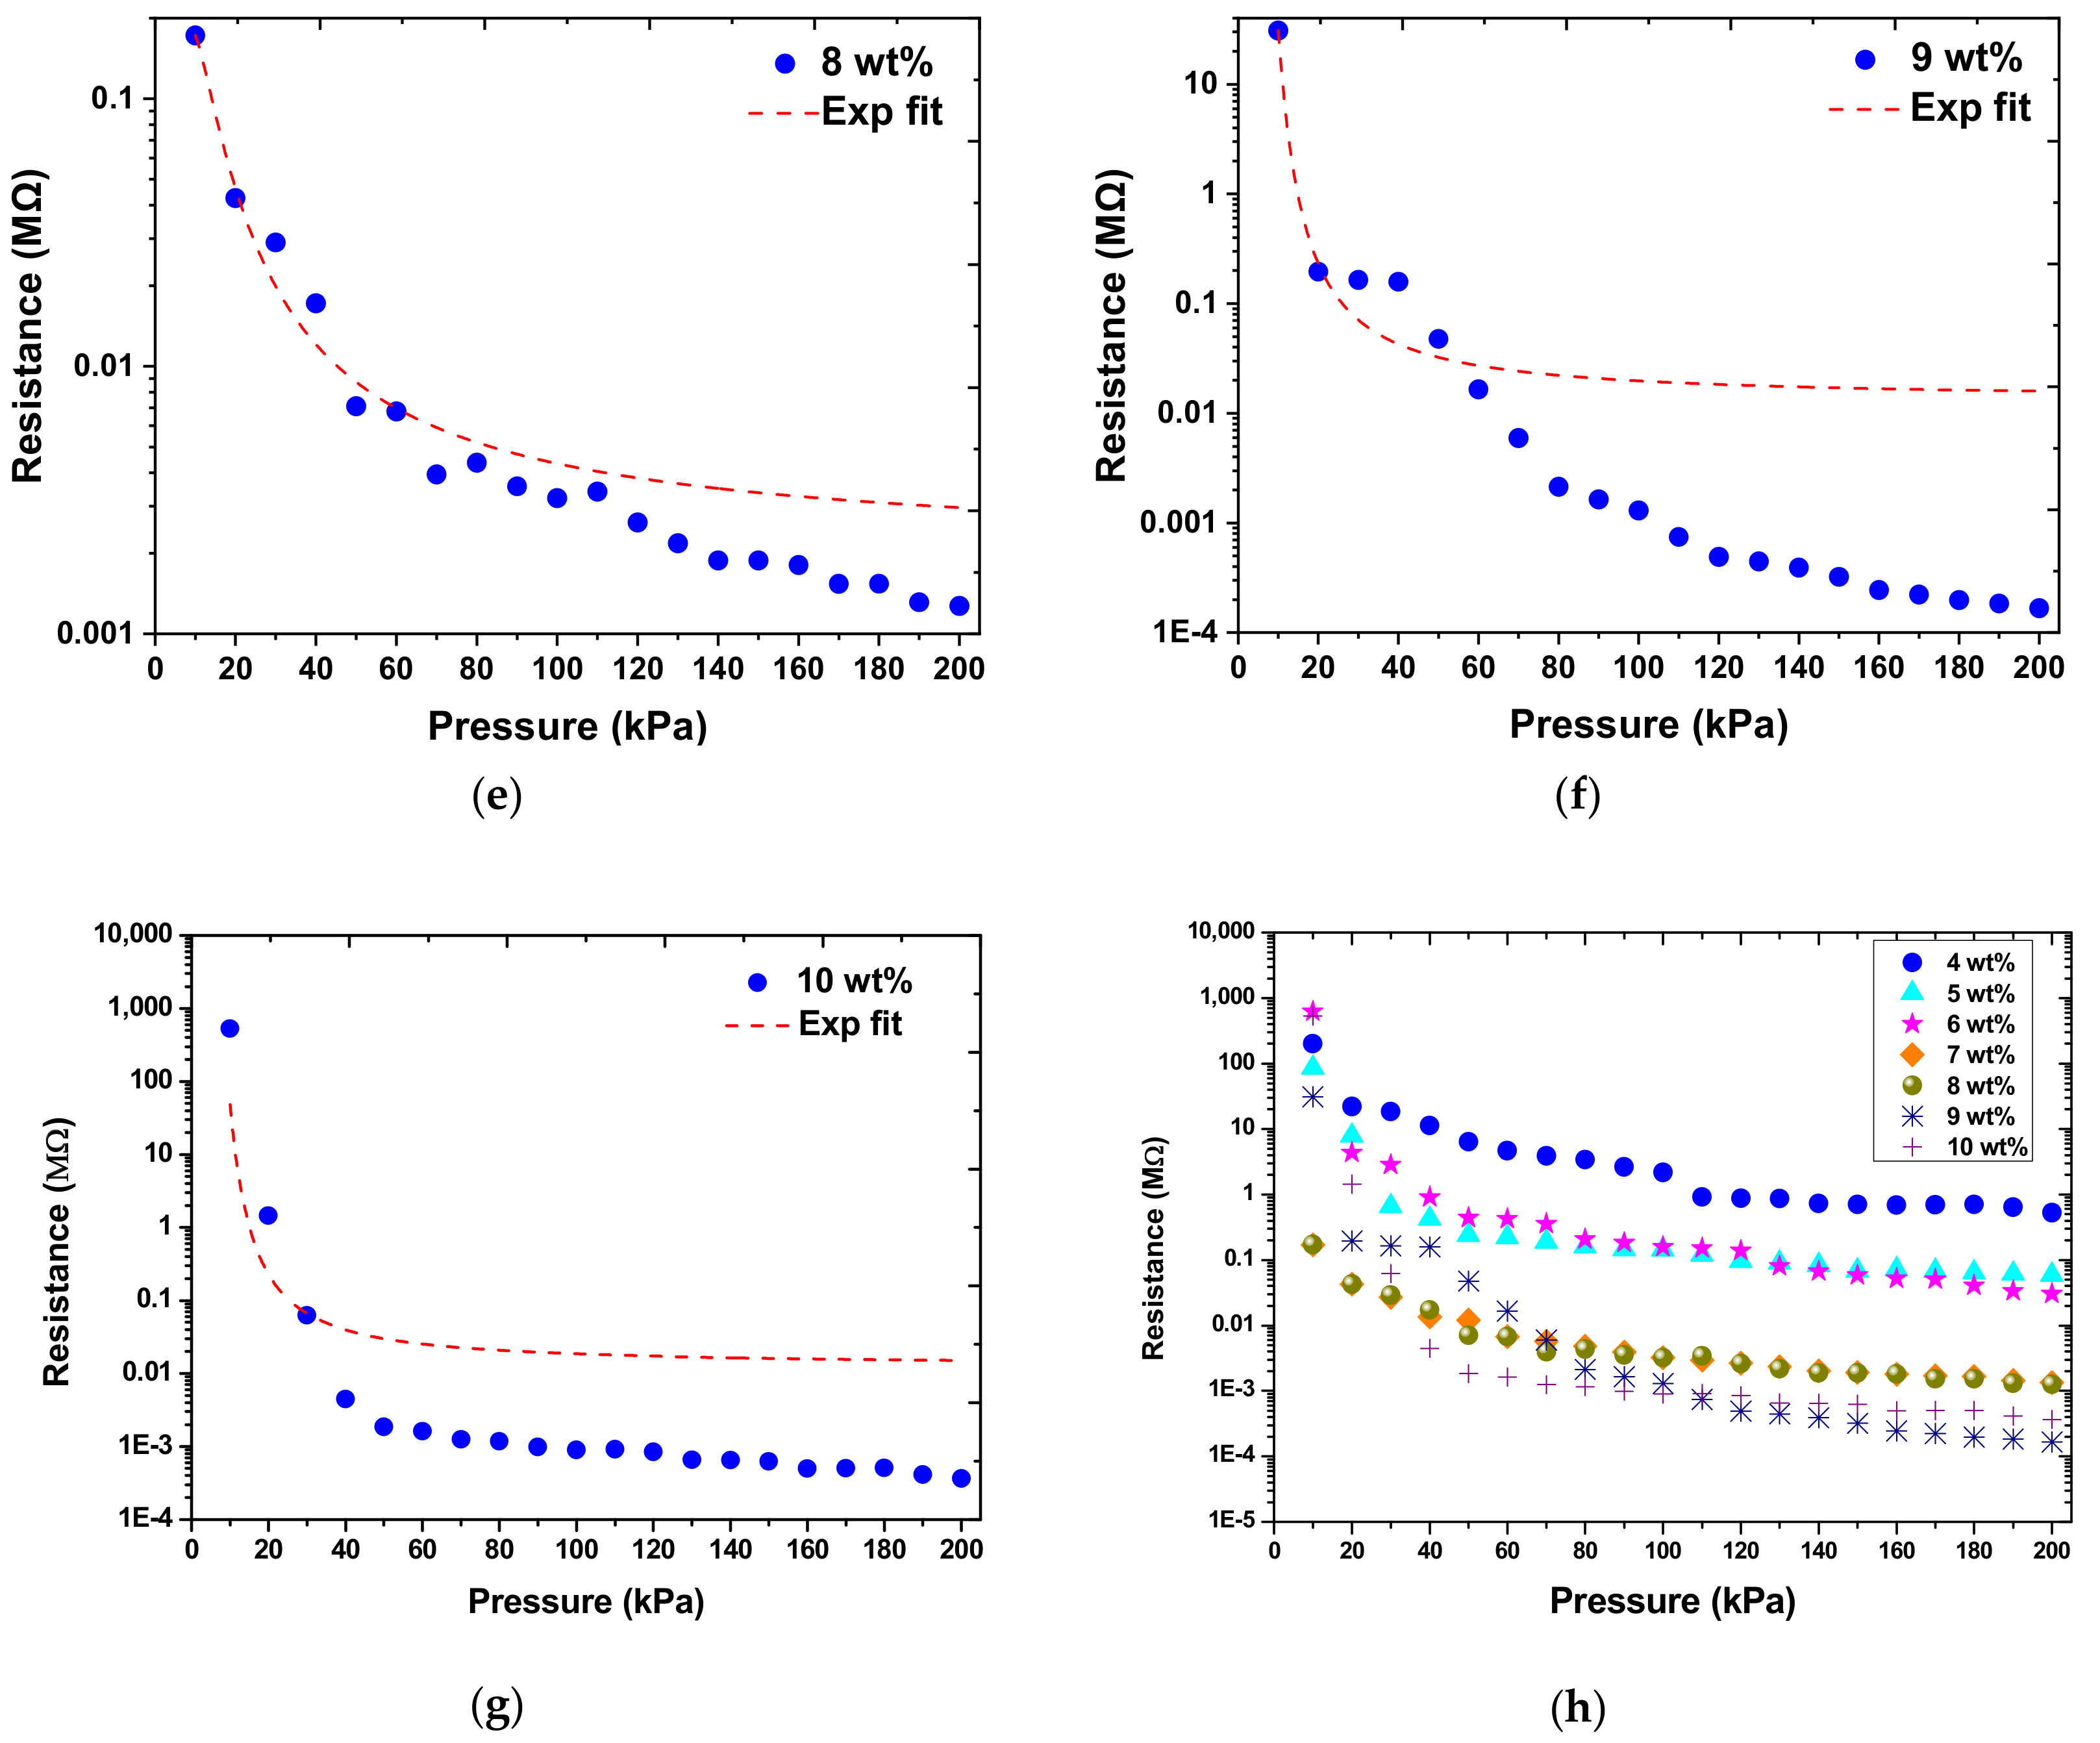
Figure 12.
The resistance output as function of applied pressure for MWCNT doping ratios of (a) 4 wt.%, (b) 5 wt.%, (c) 6 wt.%, (d) 7 wt.%, (e) 8 wt.%, (f) 9 wt.%, (g) 10 wt.%, and (h) 4–10 wt.%.
Figure 12.
The resistance output as function of applied pressure for MWCNT doping ratios of (a) 4 wt.%, (b) 5 wt.%, (c) 6 wt.%, (d) 7 wt.%, (e) 8 wt.%, (f) 9 wt.%, (g) 10 wt.%, and (h) 4–10 wt.%.
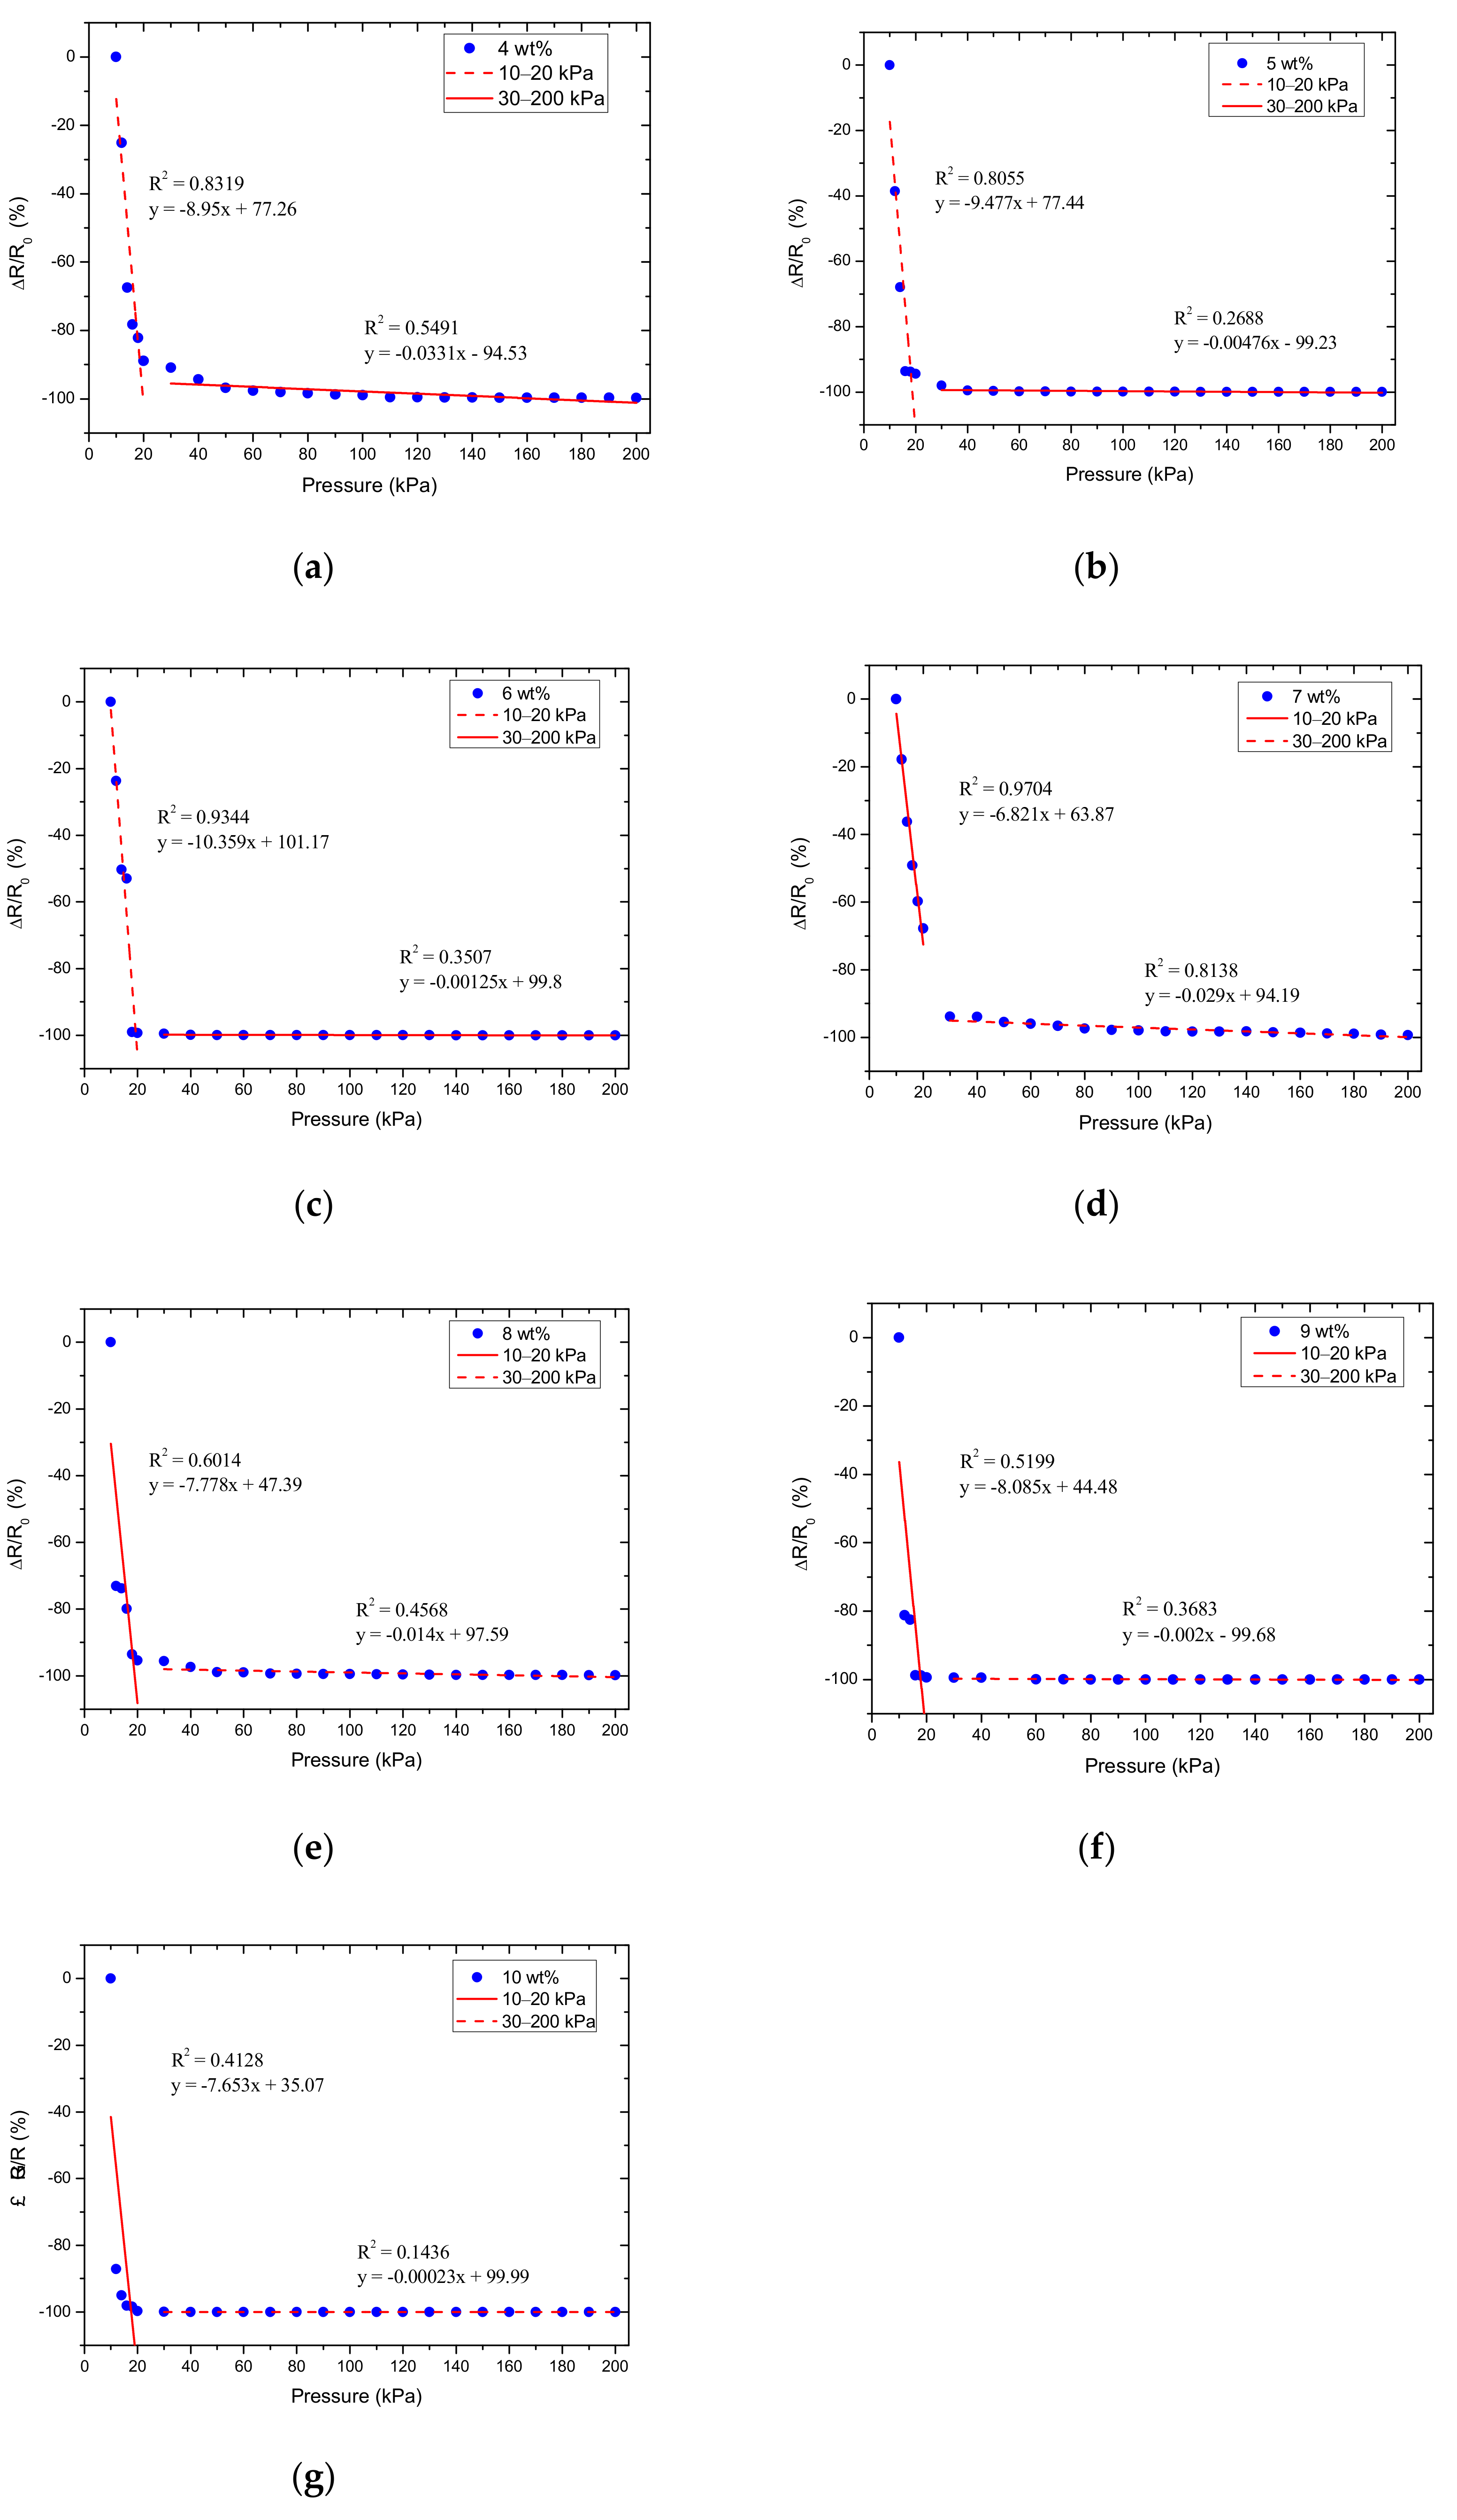
Figure 13.
The relative resistance change as a function of applied pressure for MWCNT doping ratios of (a) 4 wt.%, (b) 5 wt.%, (c) 6 wt.%, (d) 7 wt.%, (e) 8 wt.%, (f) 9 wt.%, and (g) 10 wt.%.
Figure 13.
The relative resistance change as a function of applied pressure for MWCNT doping ratios of (a) 4 wt.%, (b) 5 wt.%, (c) 6 wt.%, (d) 7 wt.%, (e) 8 wt.%, (f) 9 wt.%, and (g) 10 wt.%.
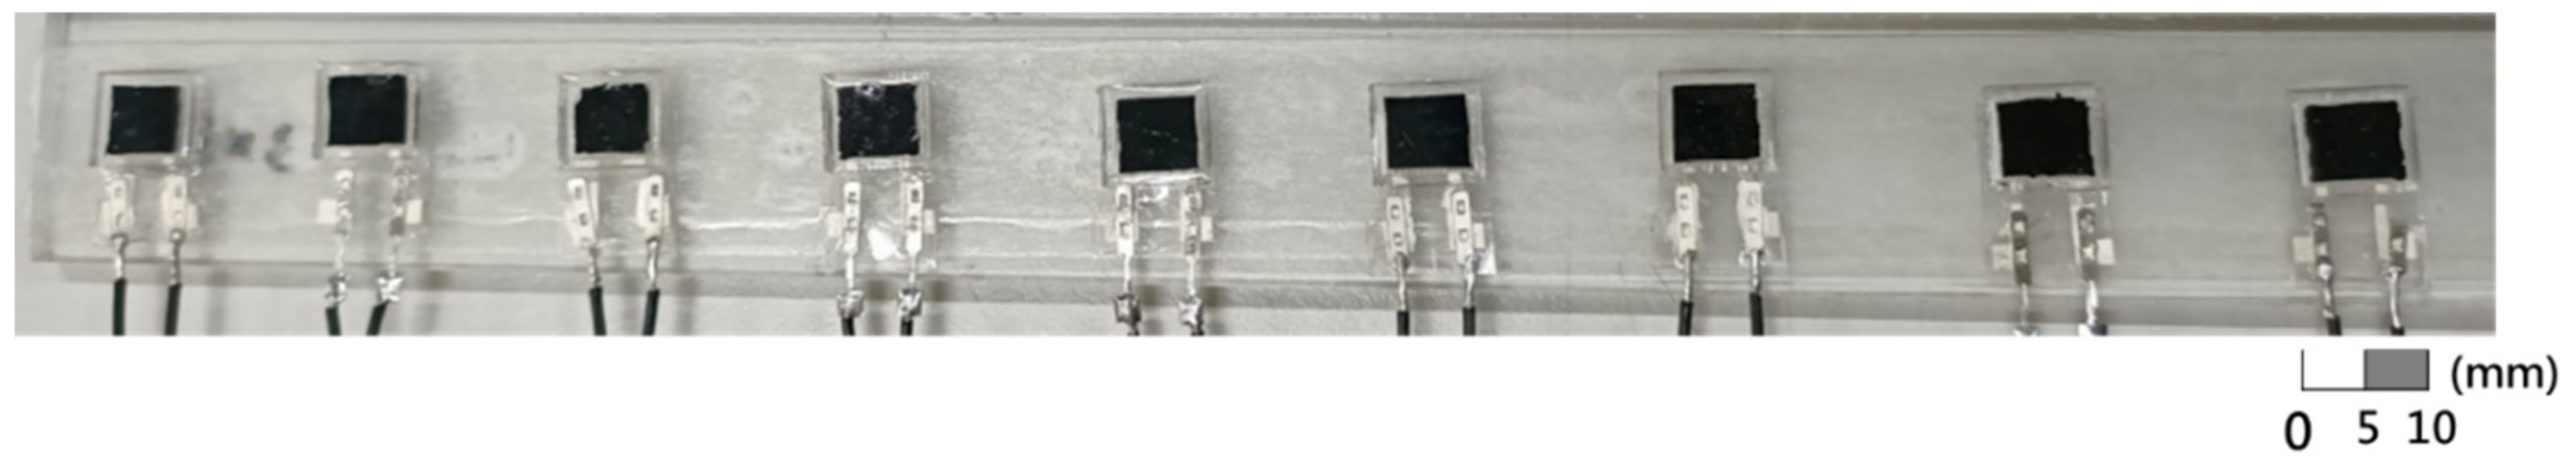
Figure 14.
Batch production of the 7 wt.% MWCNT doped sensors.
Figure 14.
Batch production of the 7 wt.% MWCNT doped sensors.
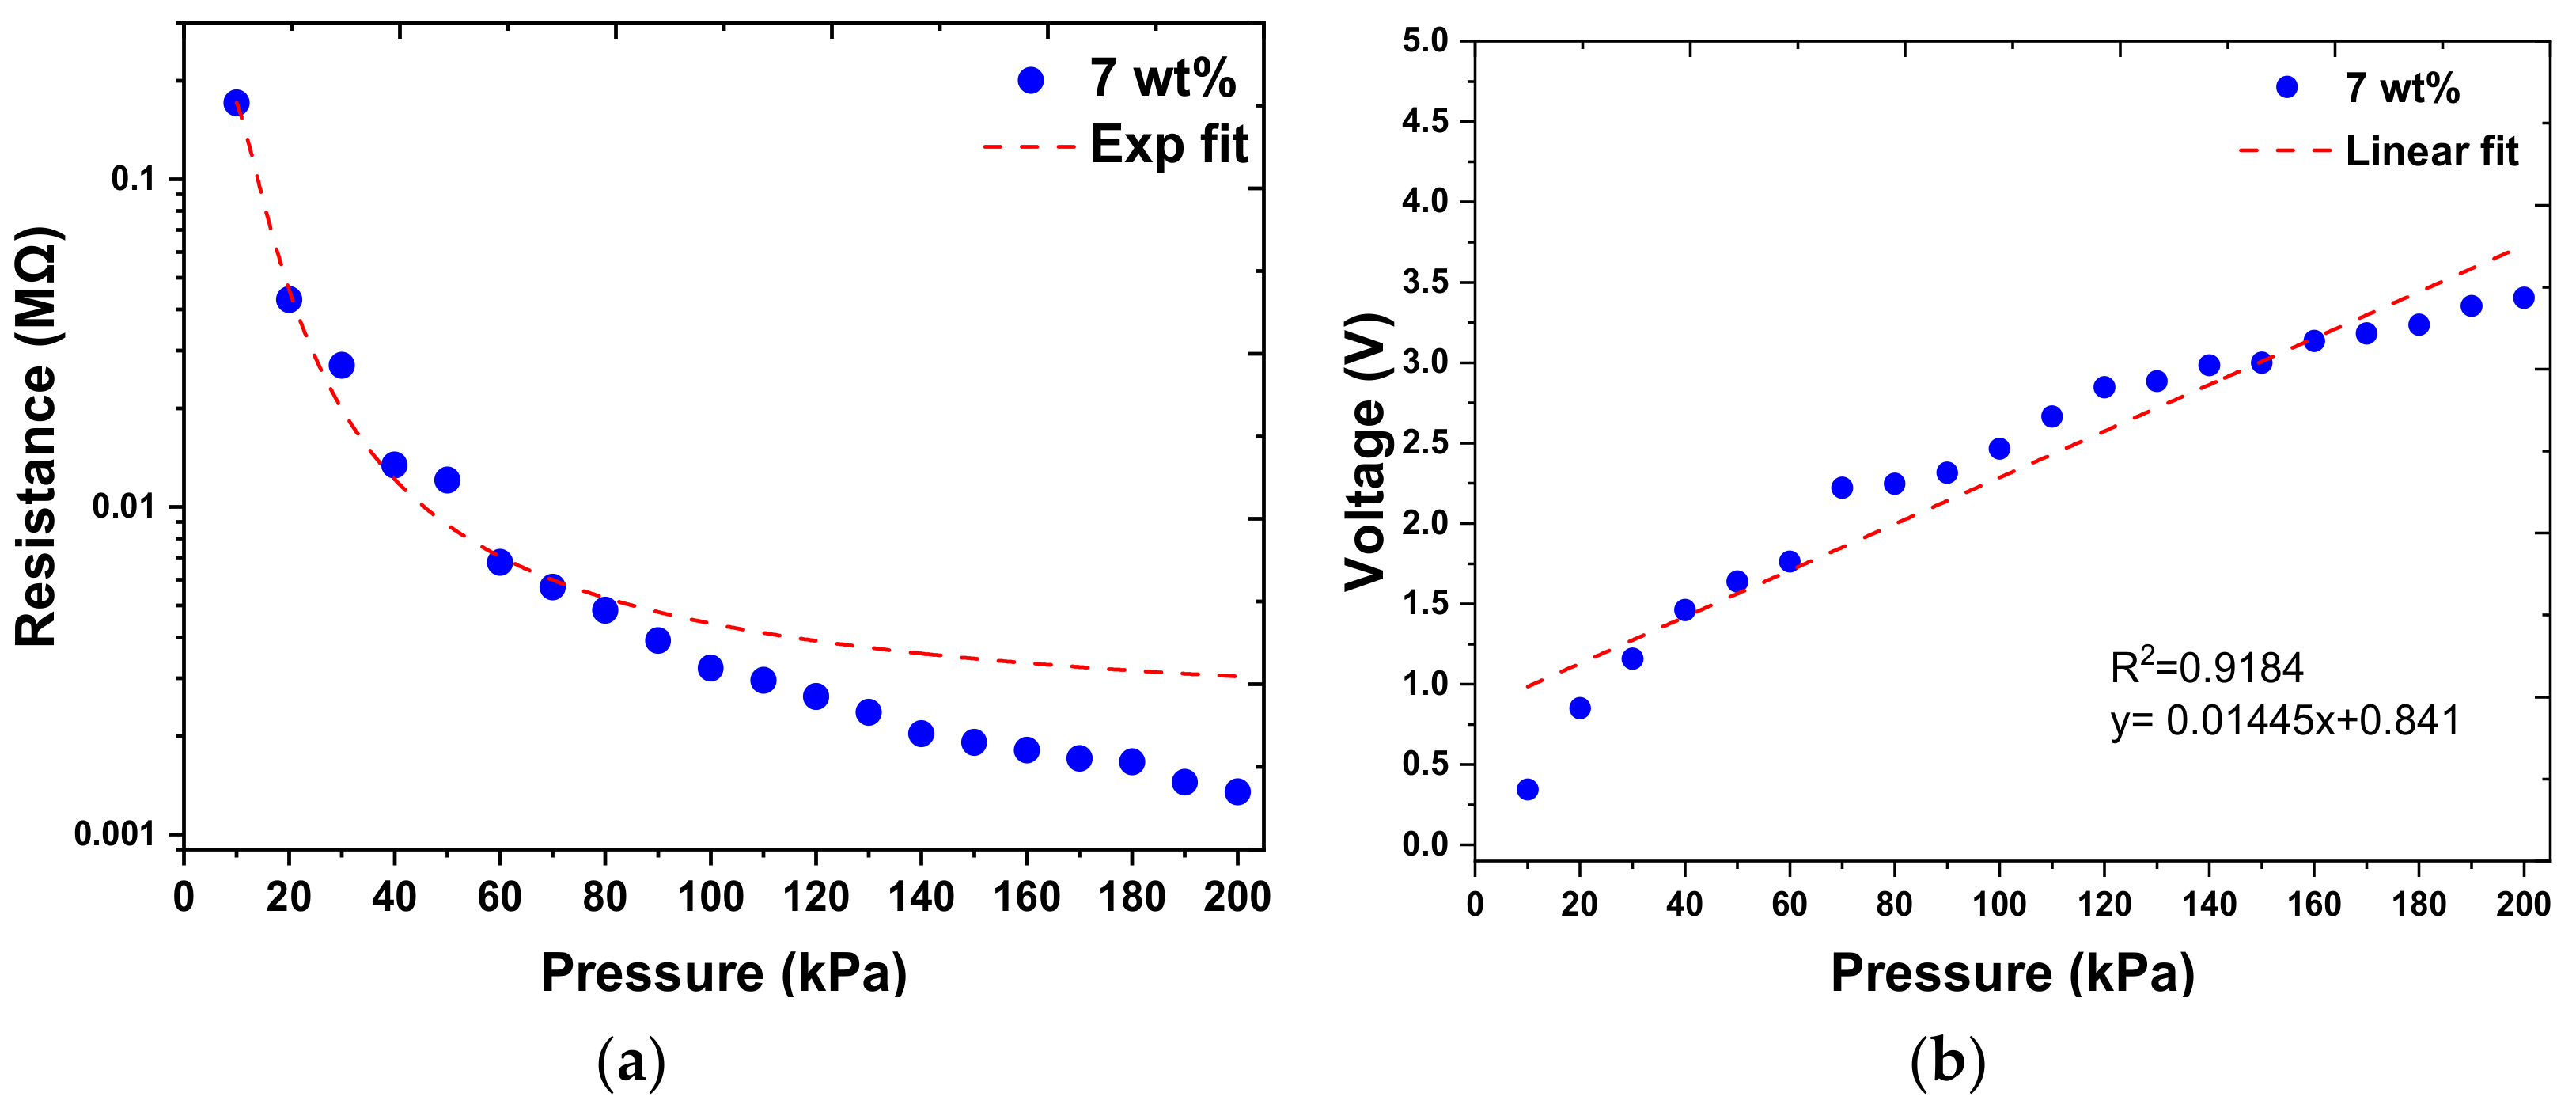
Figure 15.
Pressure vs. resistance/voltage output for the sensors made with 7 wt.% MWCNT doping ratio. (a) Pressure vs. resistance response and (b) pressure vs. voltage response.
Figure 15.
Pressure vs. resistance/voltage output for the sensors made with 7 wt.% MWCNT doping ratio. (a) Pressure vs. resistance response and (b) pressure vs. voltage response.
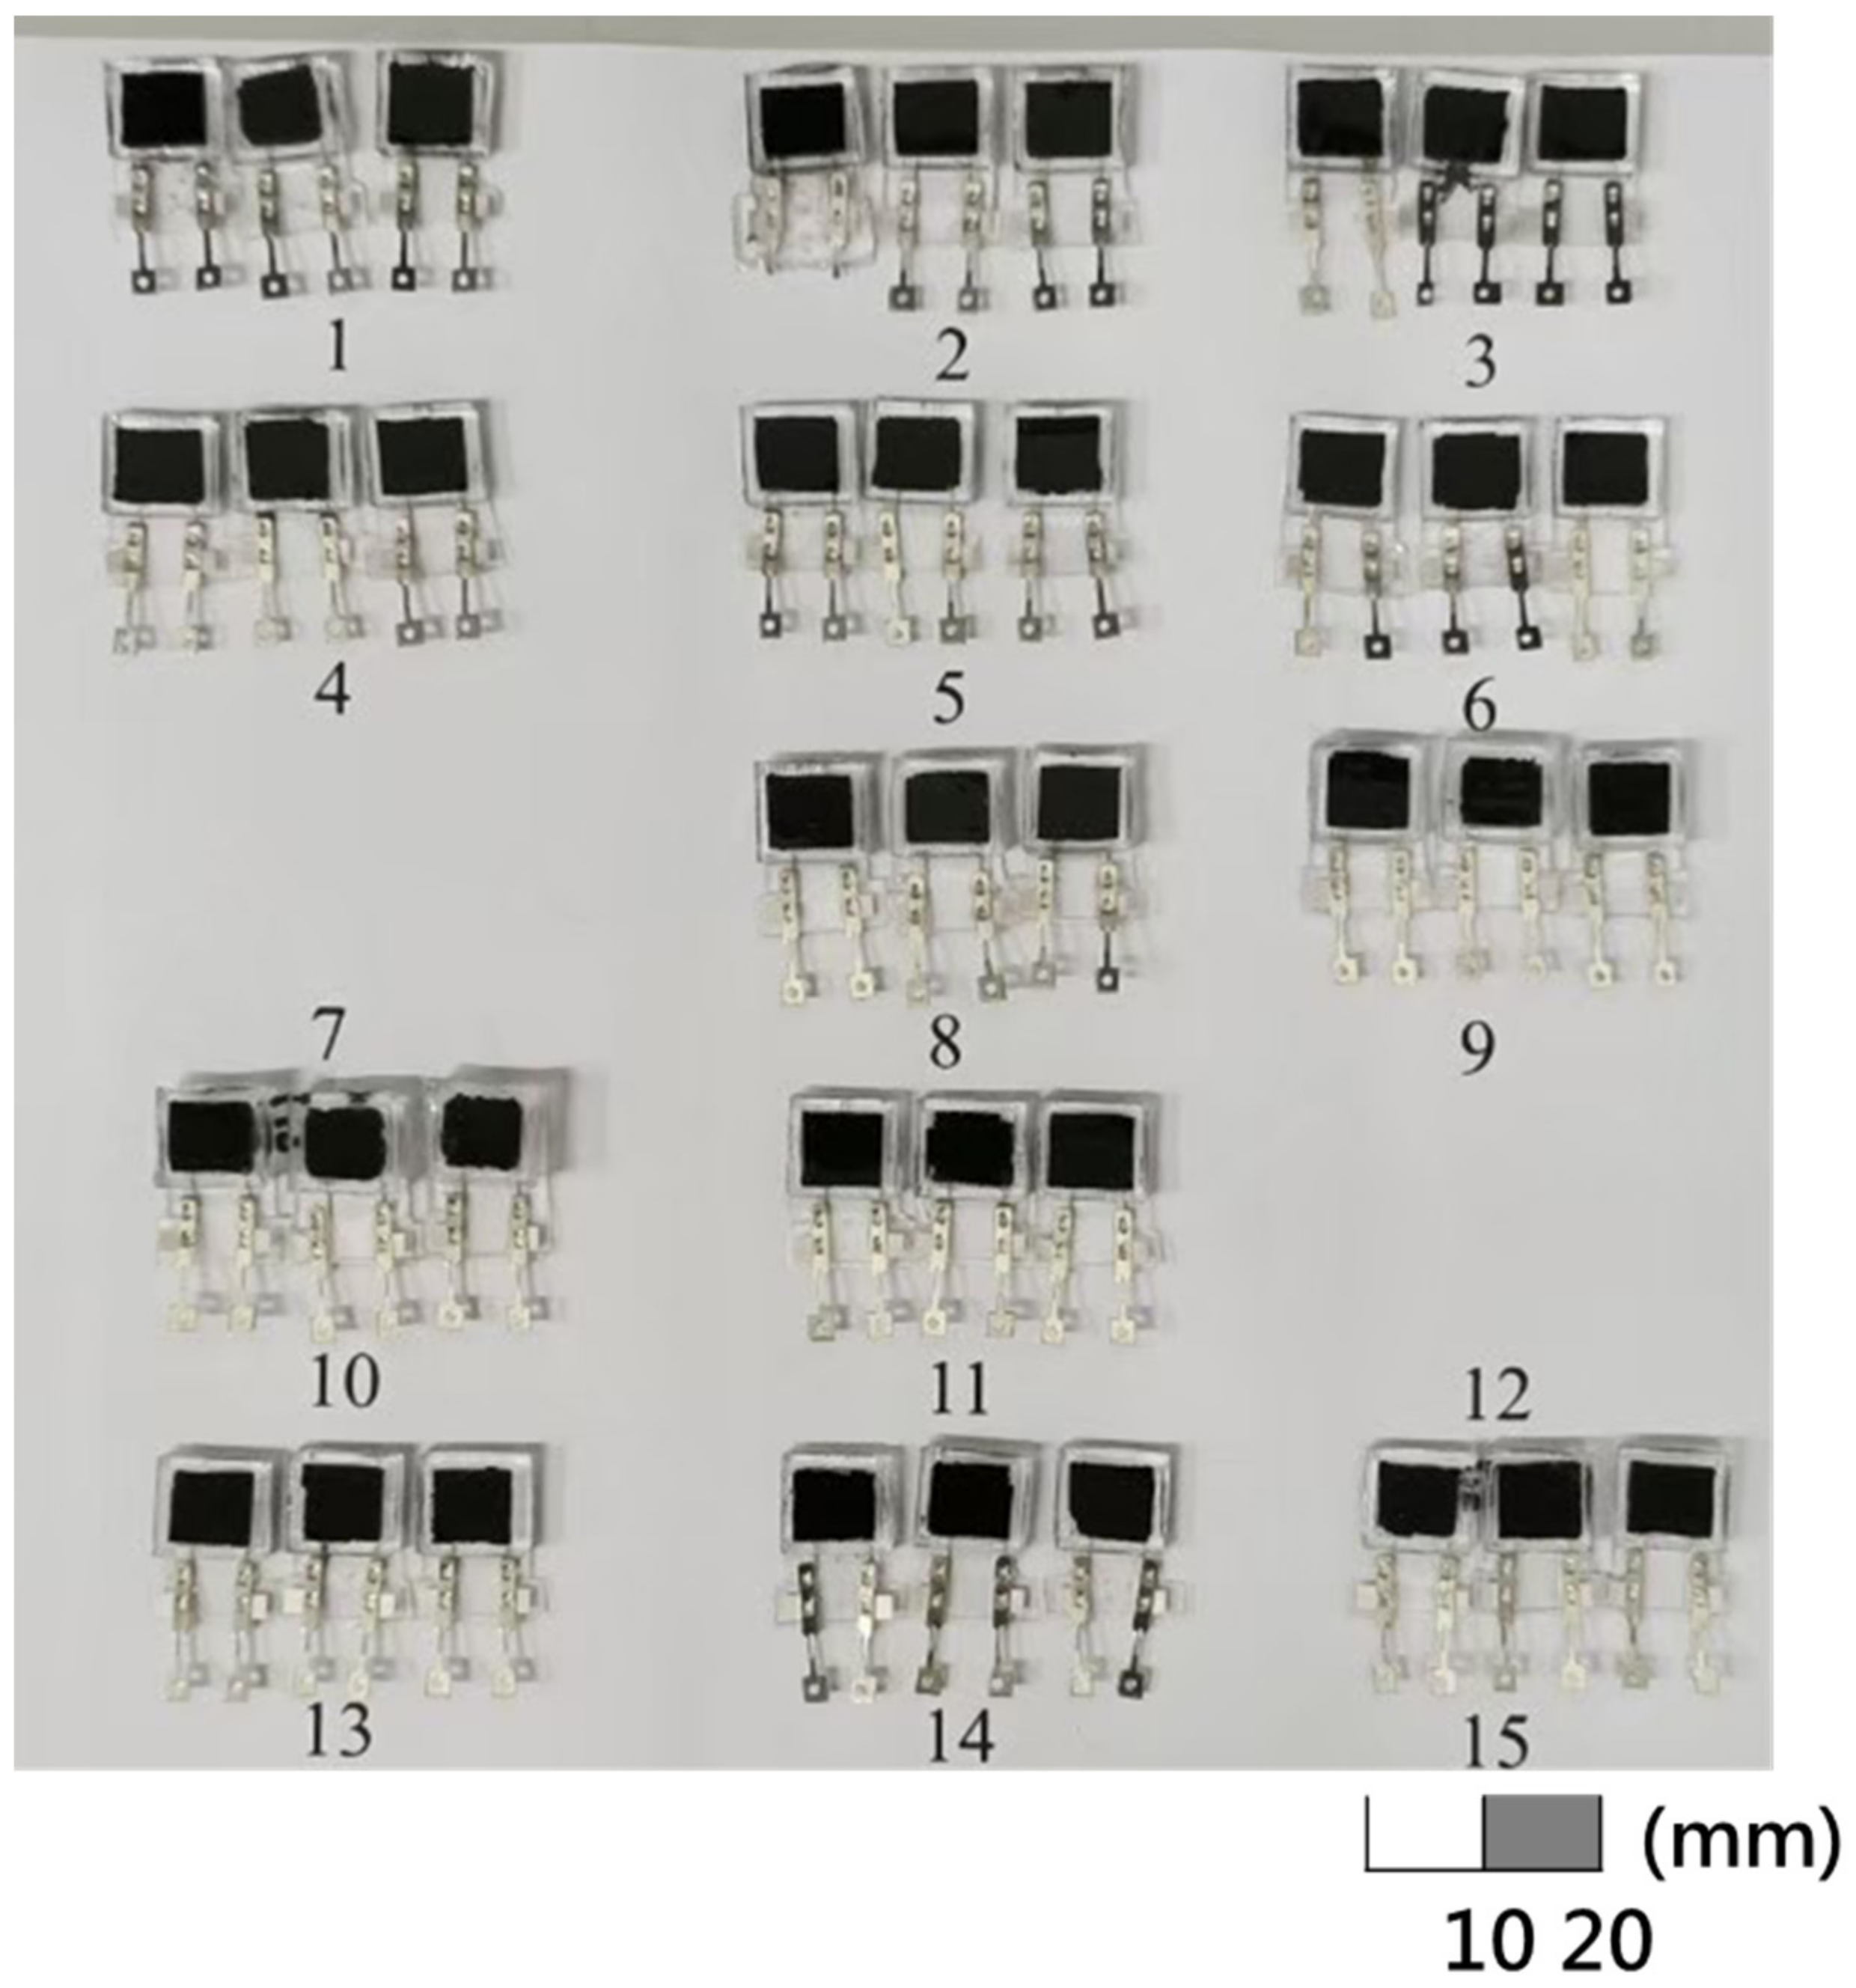
Figure 16.
Picture of sensors in experiments 1–15 of different grid structure design.
Figure 16.
Picture of sensors in experiments 1–15 of different grid structure design.
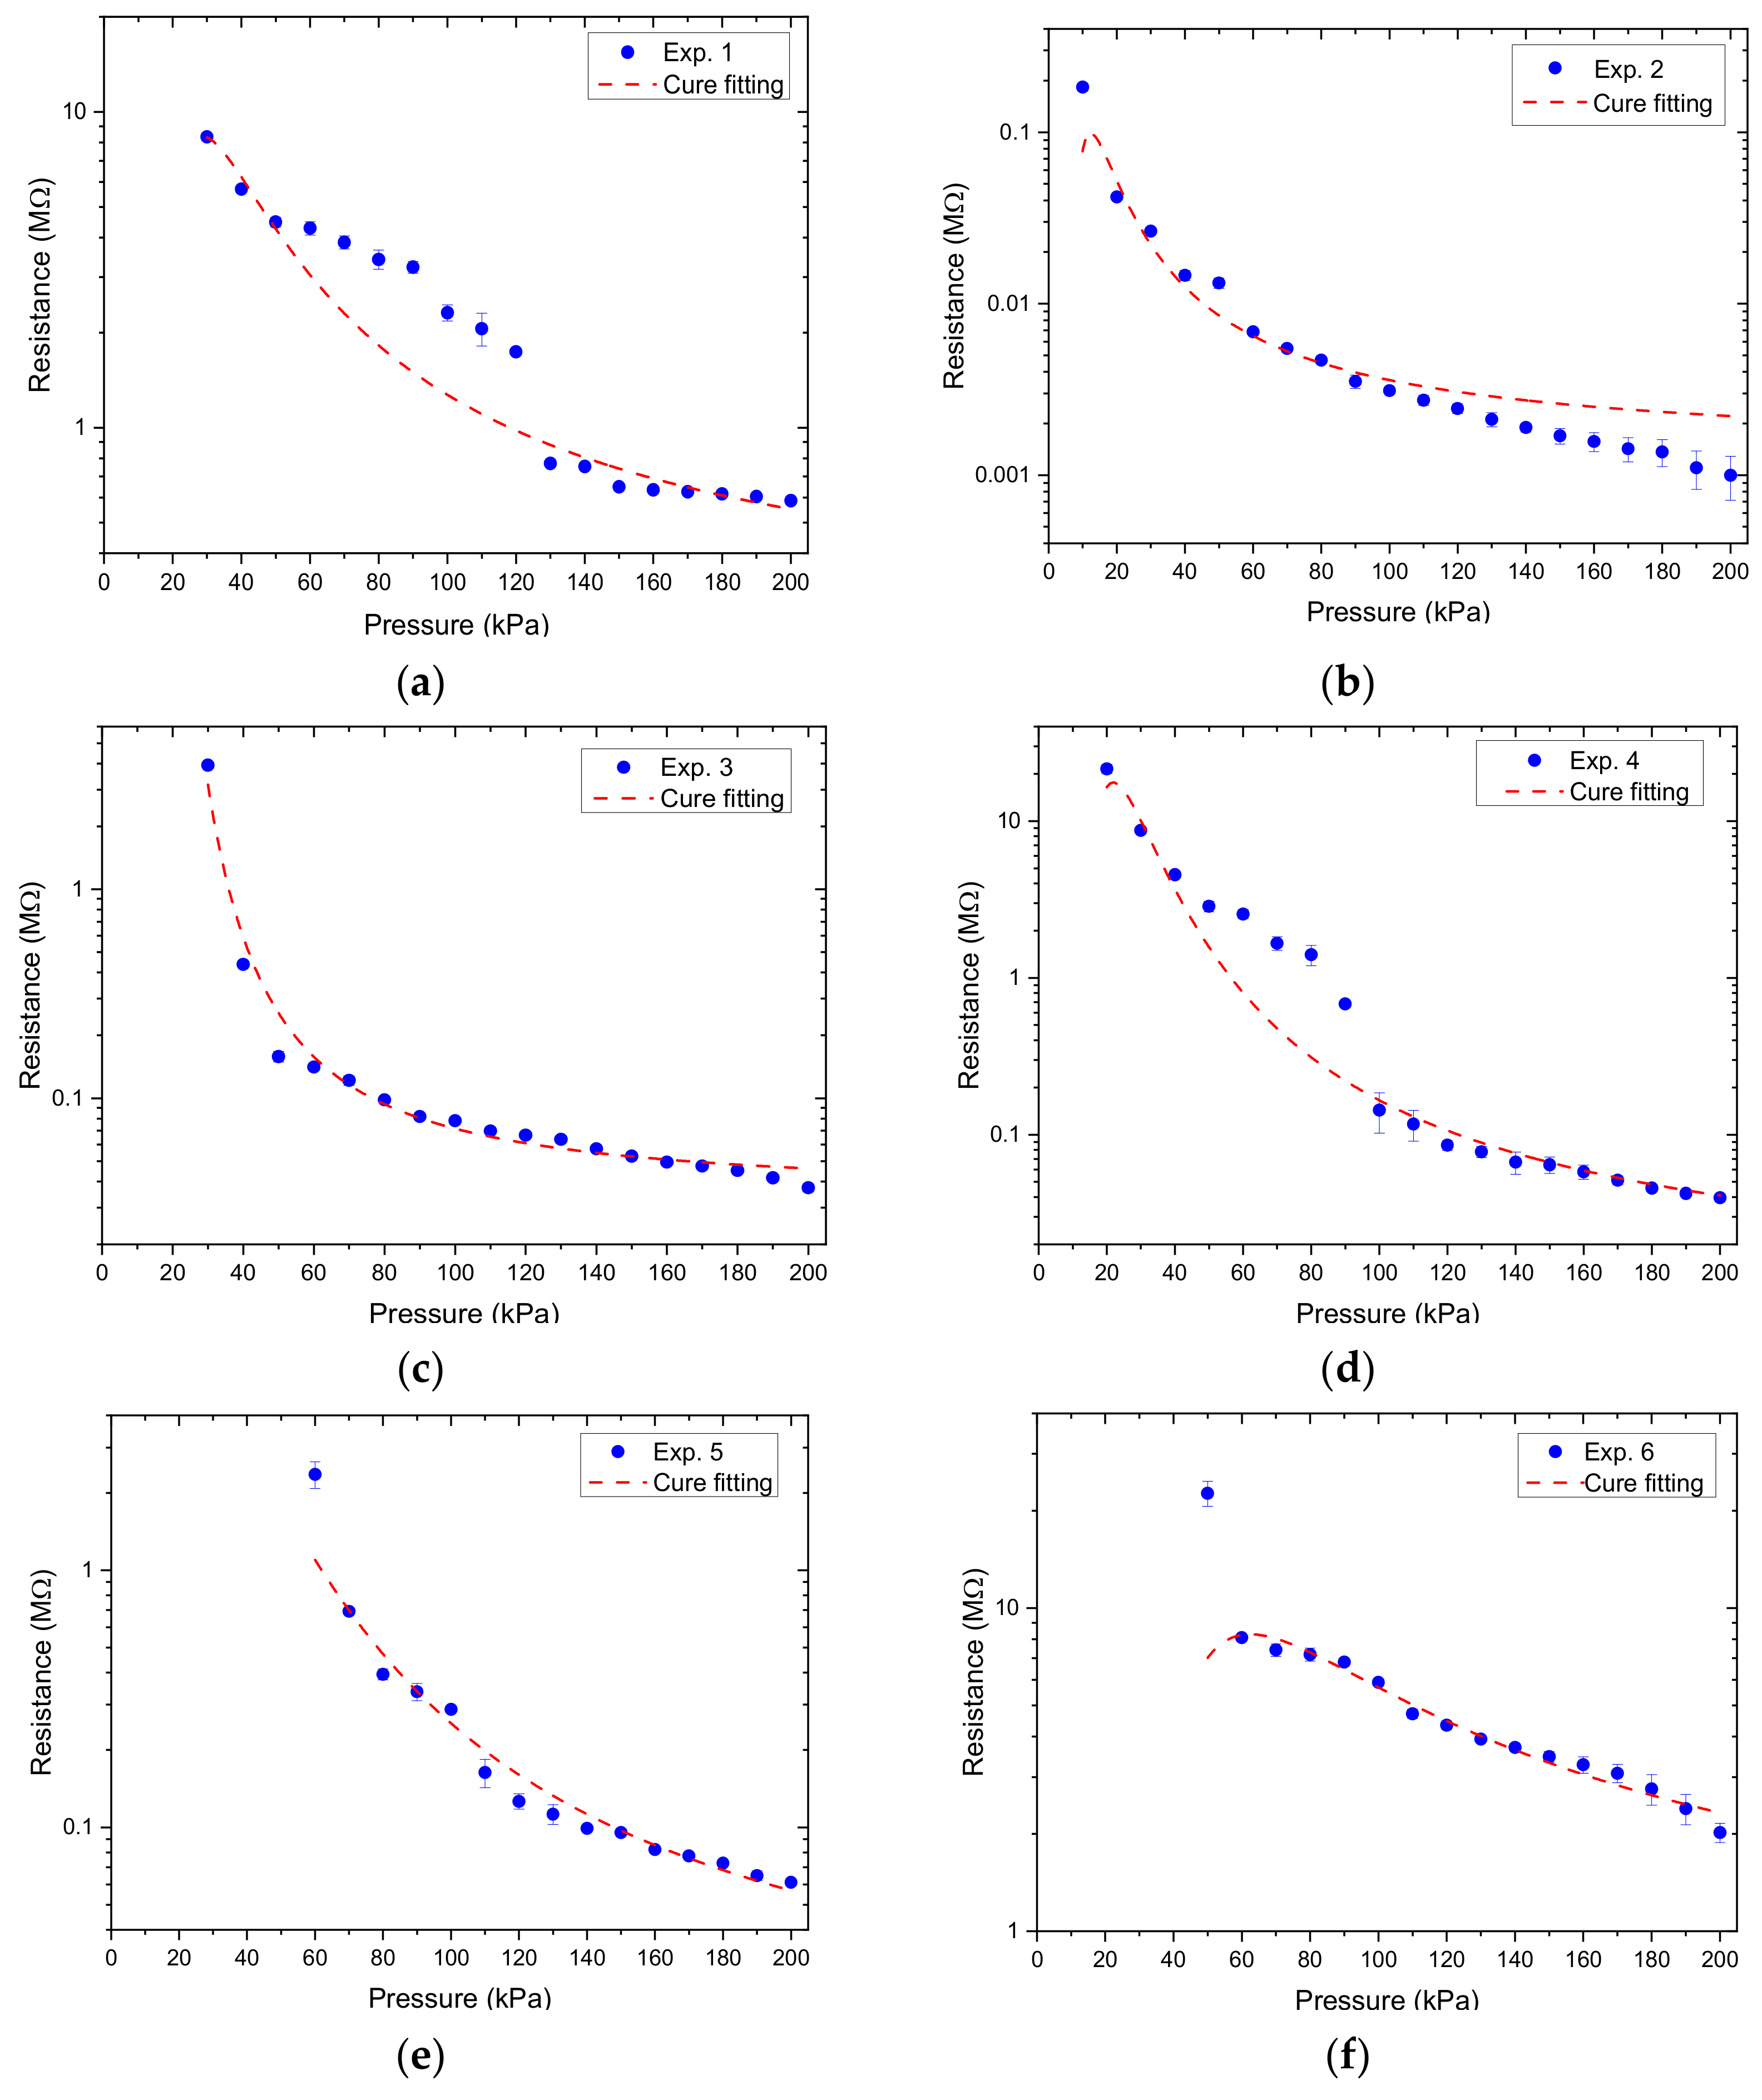
Figure 17.
The resistance output as a function of applied pressure for different grid microstructures in which (a–m) corresponds to experiments 1–15.
Figure 17.
The resistance output as a function of applied pressure for different grid microstructures in which (a–m) corresponds to experiments 1–15.
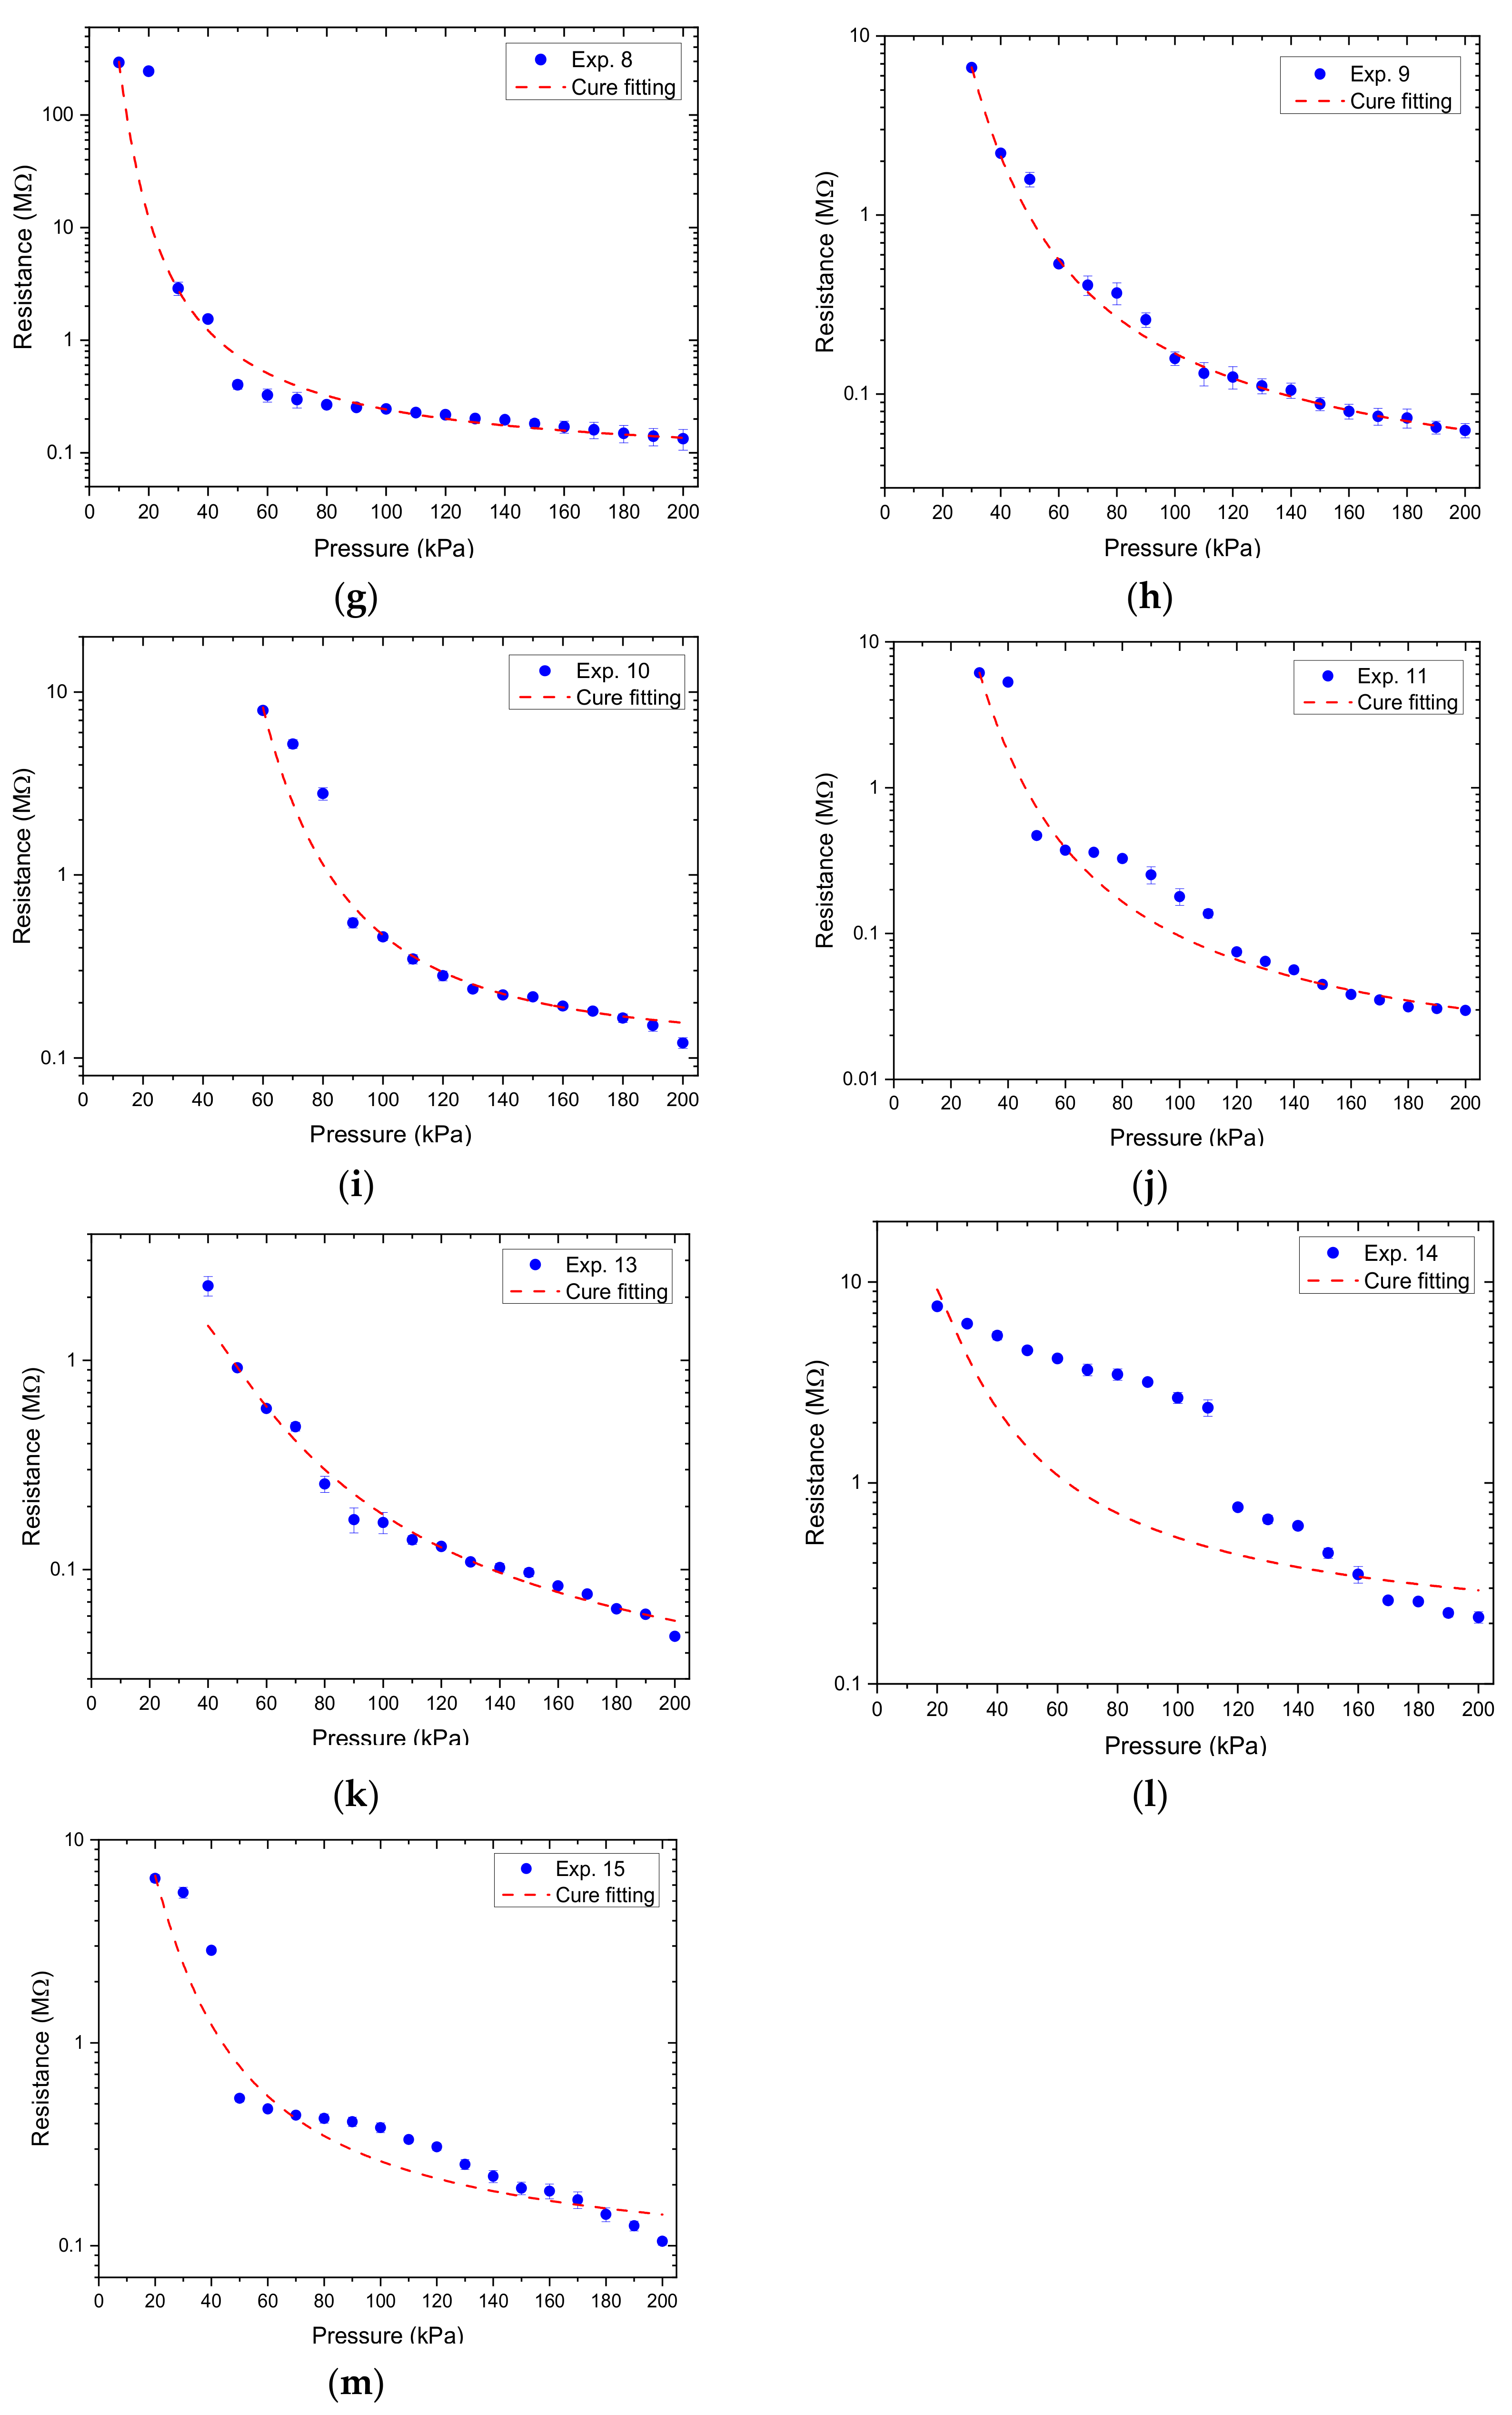
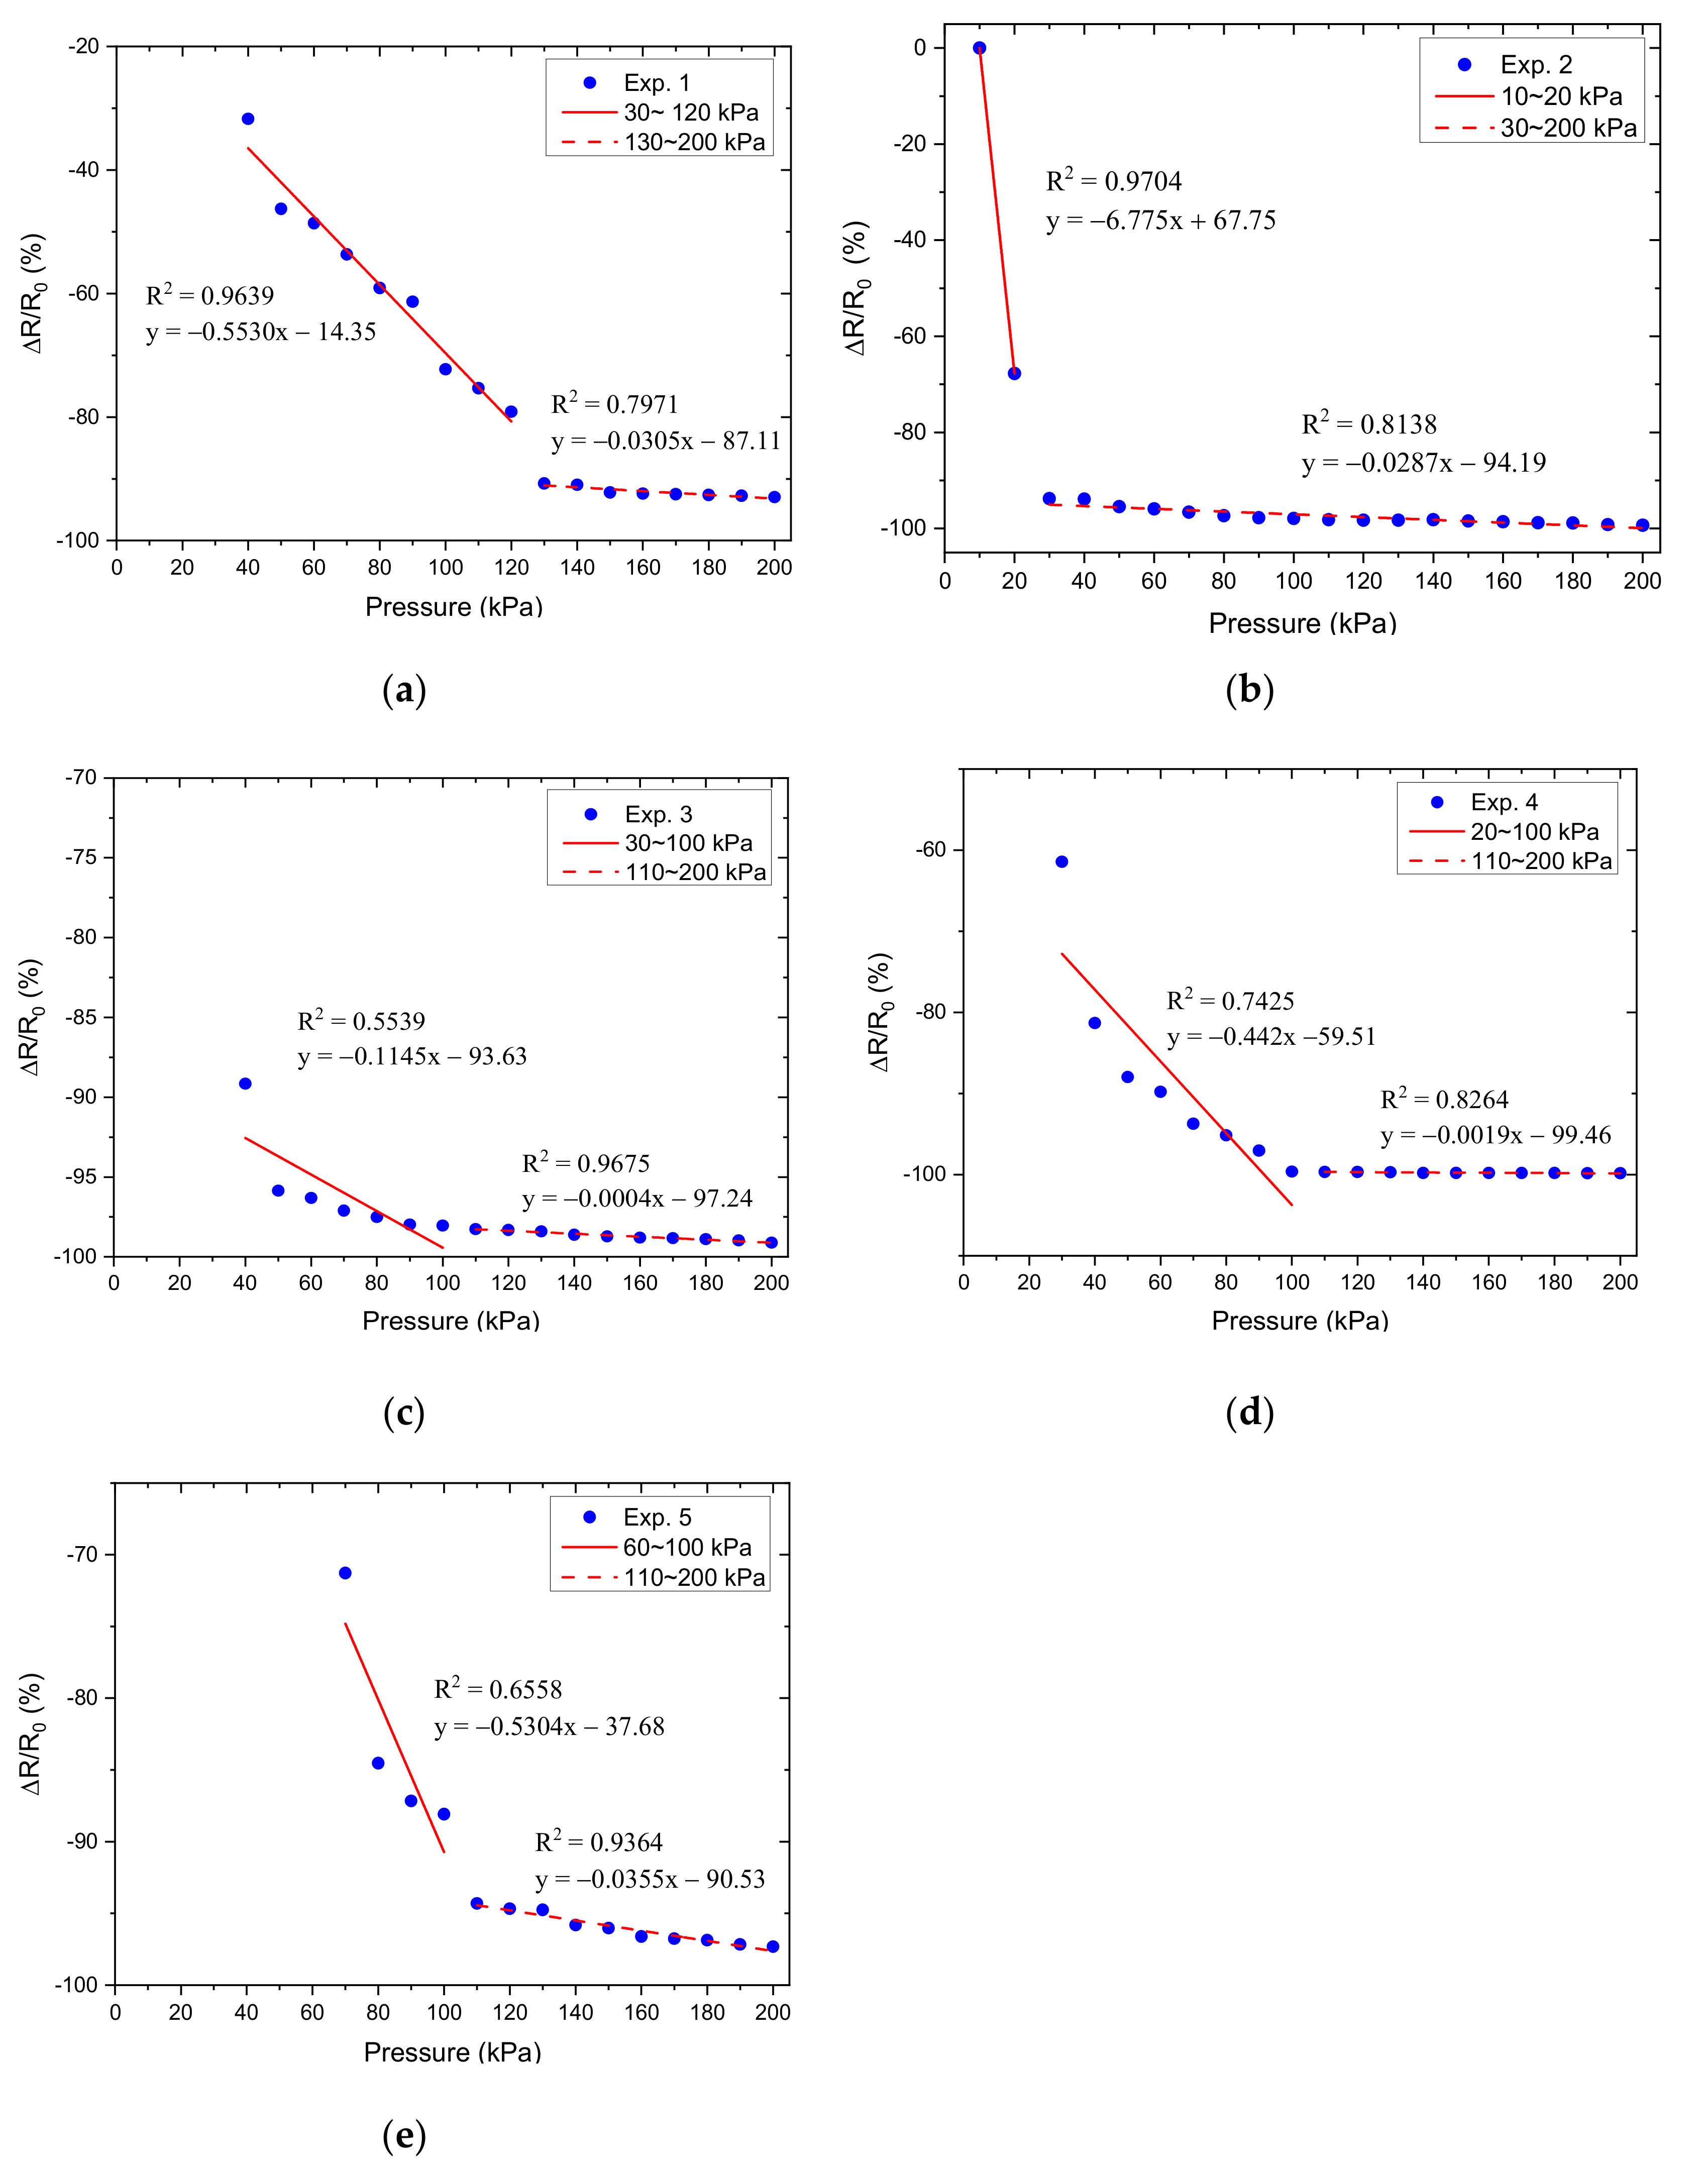
Figure 18.
The relative resistance change as a function of applied pressure for different grid microstructures in which (a–e) corresponds to experiments 1–5.
Figure 18.
The relative resistance change as a function of applied pressure for different grid microstructures in which (a–e) corresponds to experiments 1–5.
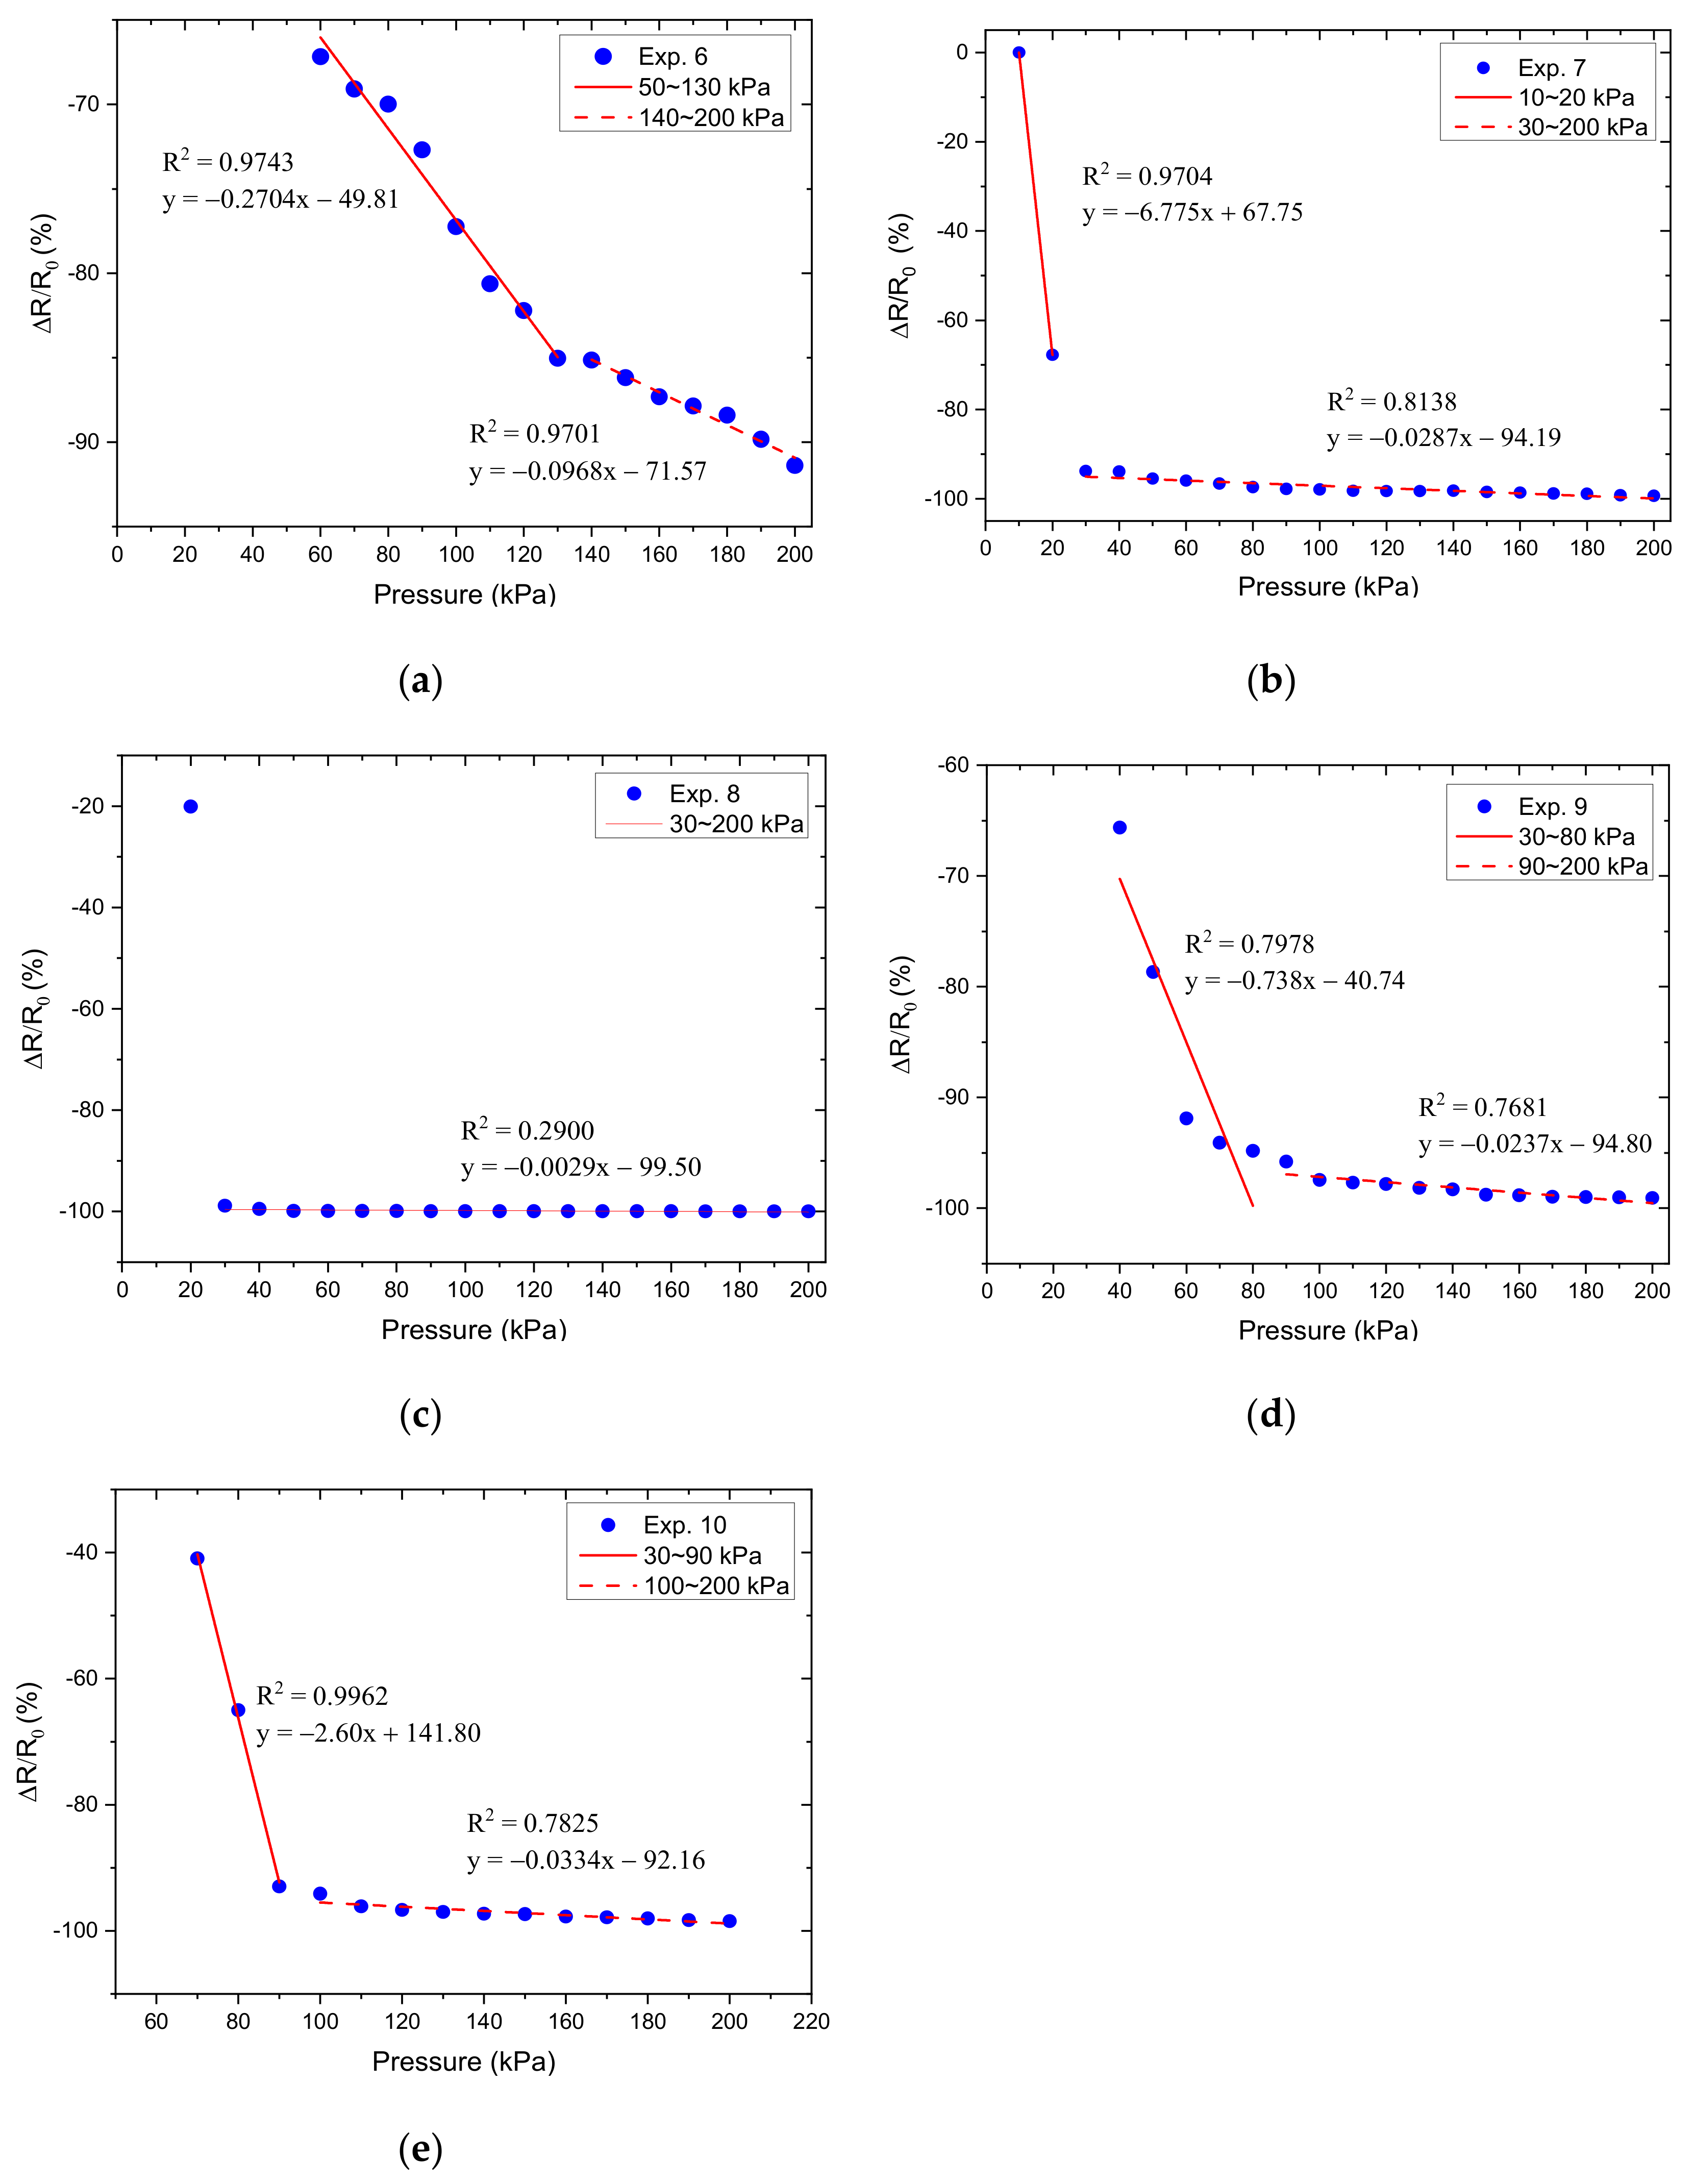
Figure 19.
The relative resistance change as a function of applied pressure for different grid microstructures in which (a–e) corresponds to experiments 6–10.
Figure 19.
The relative resistance change as a function of applied pressure for different grid microstructures in which (a–e) corresponds to experiments 6–10.
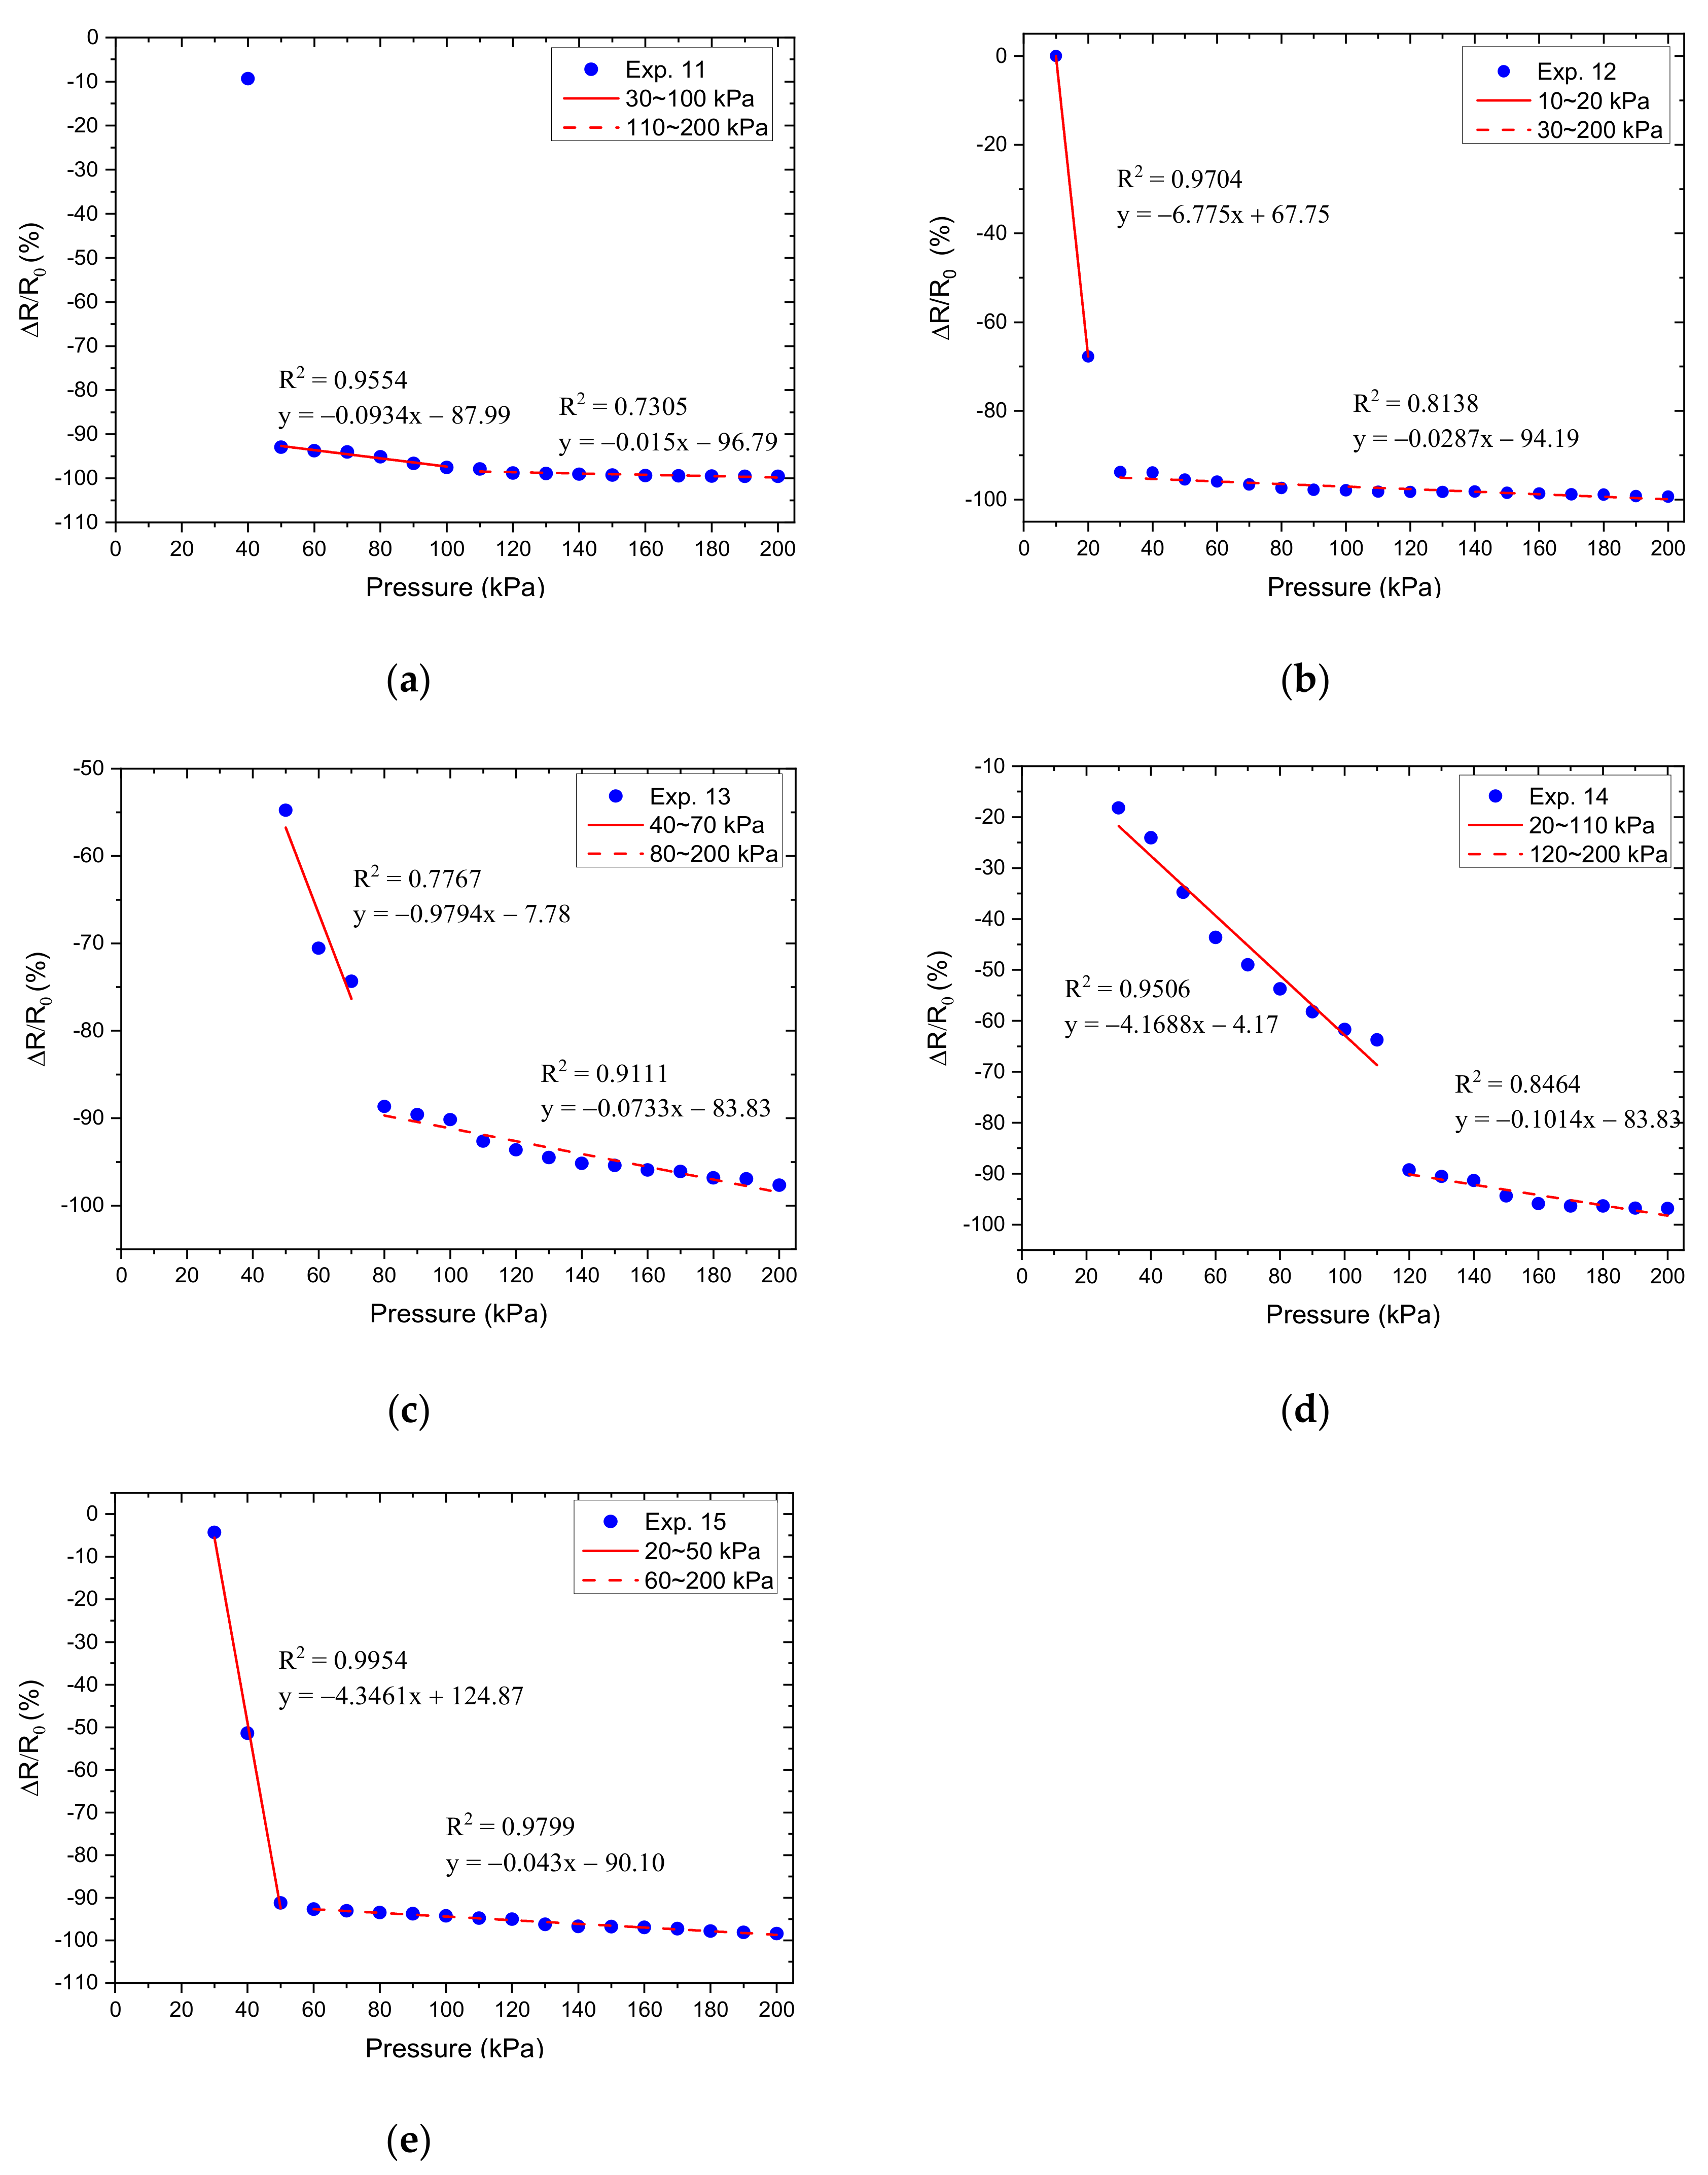
Figure 20.
The relative resistance changes as a function of applied pressure for different grid microstructures in which (a–e) corresponds to experiments 11–15.
Figure 20.
The relative resistance changes as a function of applied pressure for different grid microstructures in which (a–e) corresponds to experiments 11–15.
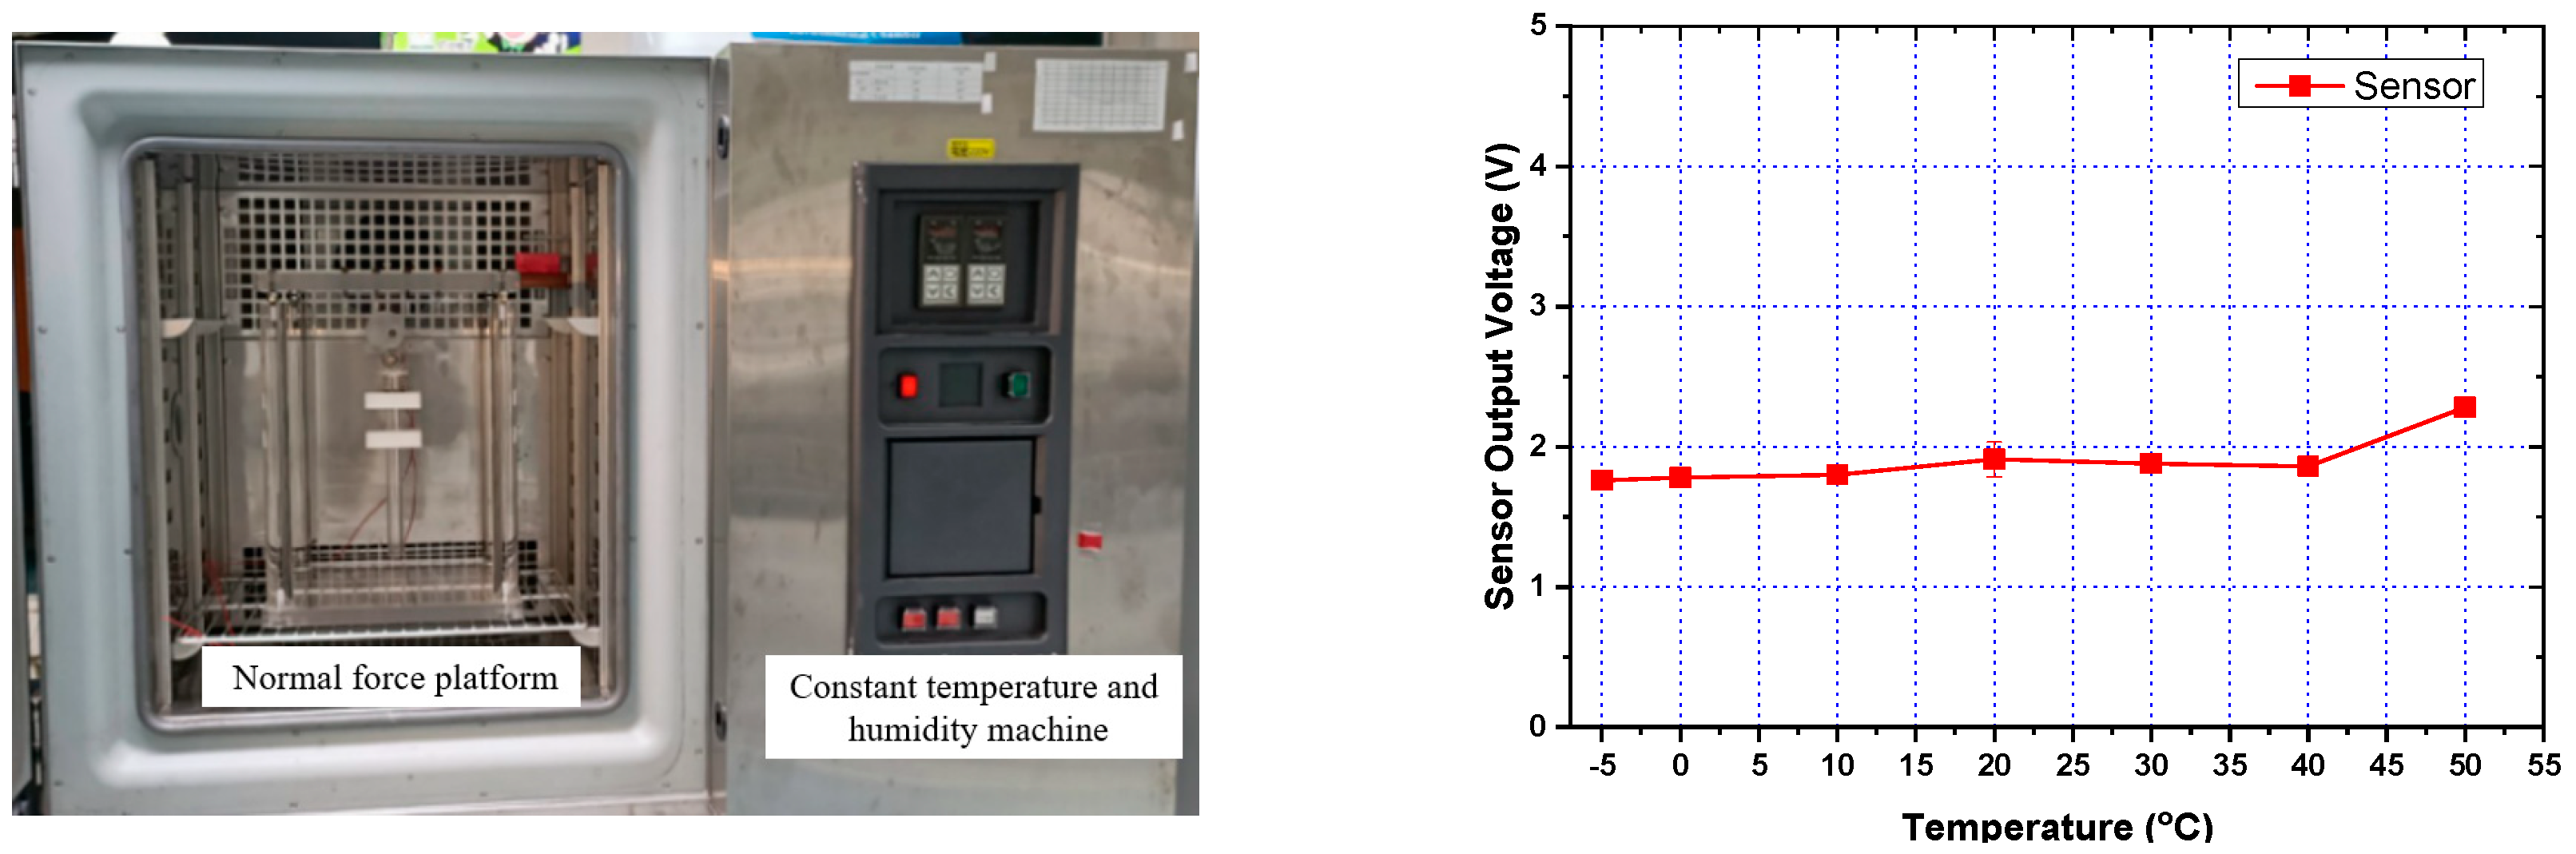
Figure 21.
Picture of the humidity–controlled temperature chamber and the voltage output of the sensor in response to temperature changes.
Figure 21.
Picture of the humidity–controlled temperature chamber and the voltage output of the sensor in response to temperature changes.
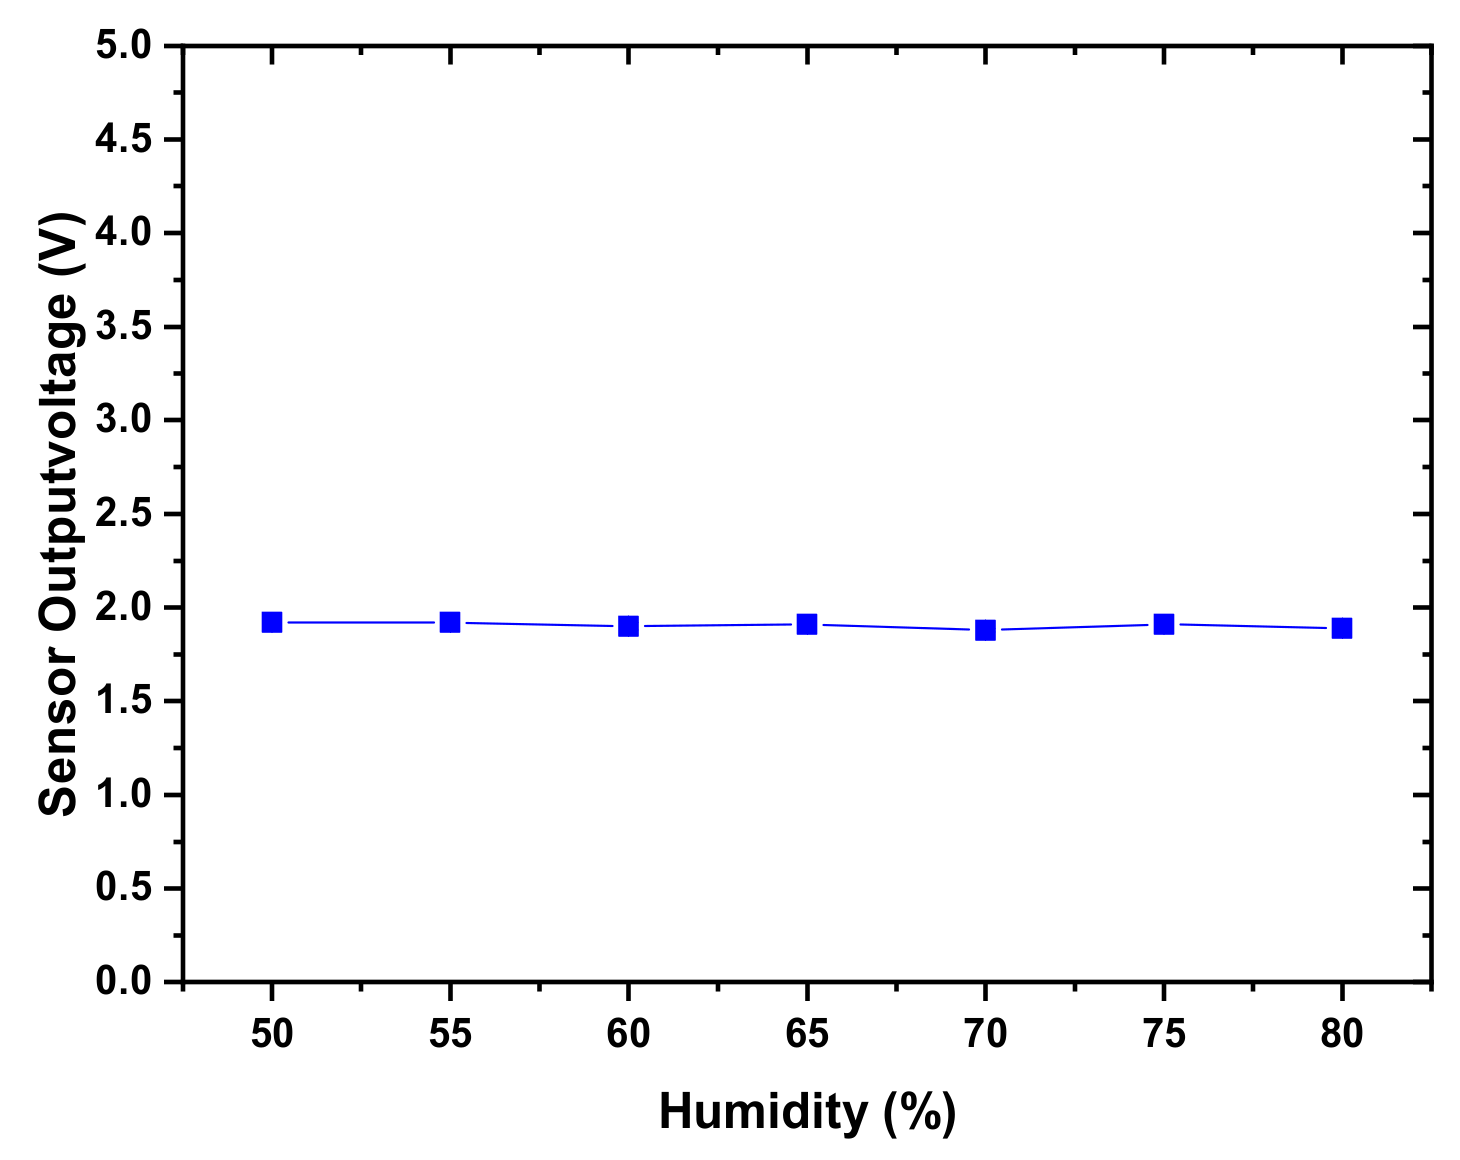
Figure 22.
The voltage output of the sensor in response to humidity changes.
Figure 22.
The voltage output of the sensor in response to humidity changes.
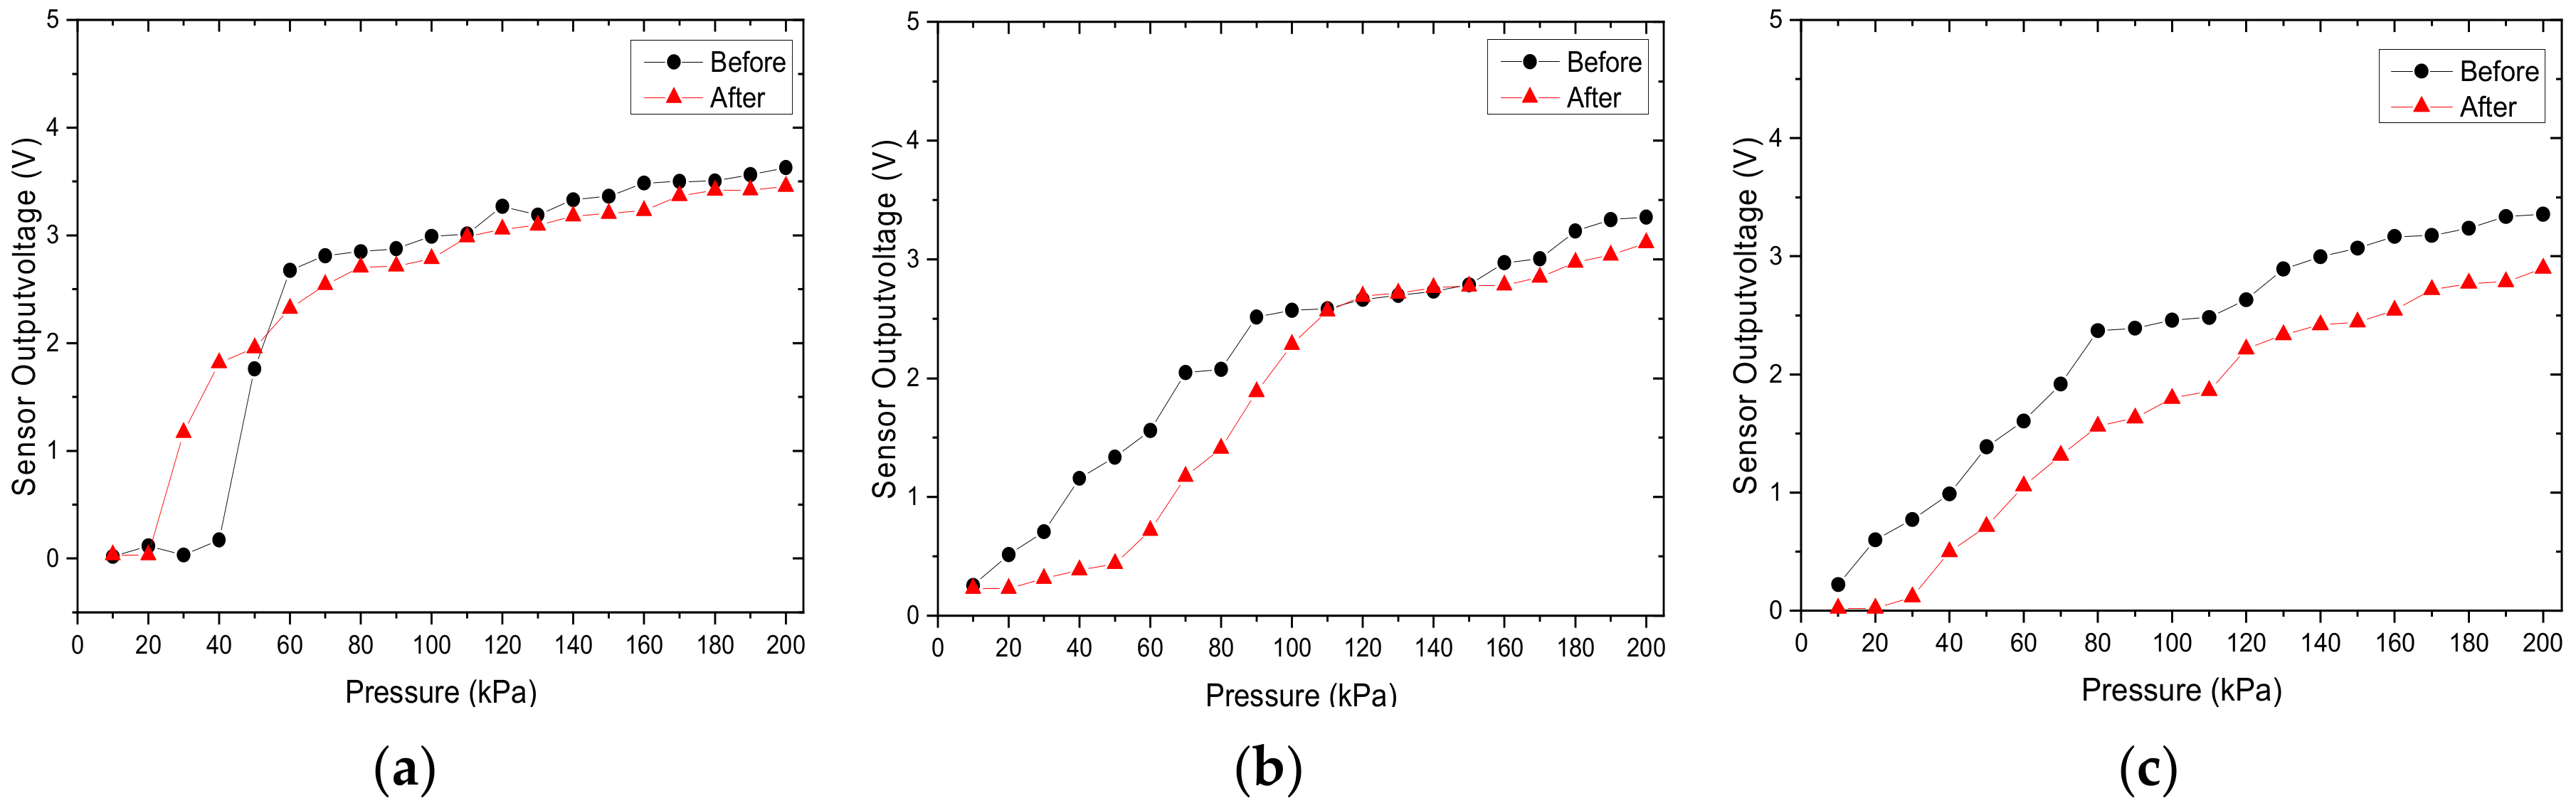
Figure 23.
The difference in voltage output signal before and after 100 cycles of thermal testing for (a) sensor 1, (b) sensor 2, (c) sensor 3.
Figure 23.
The difference in voltage output signal before and after 100 cycles of thermal testing for (a) sensor 1, (b) sensor 2, (c) sensor 3.
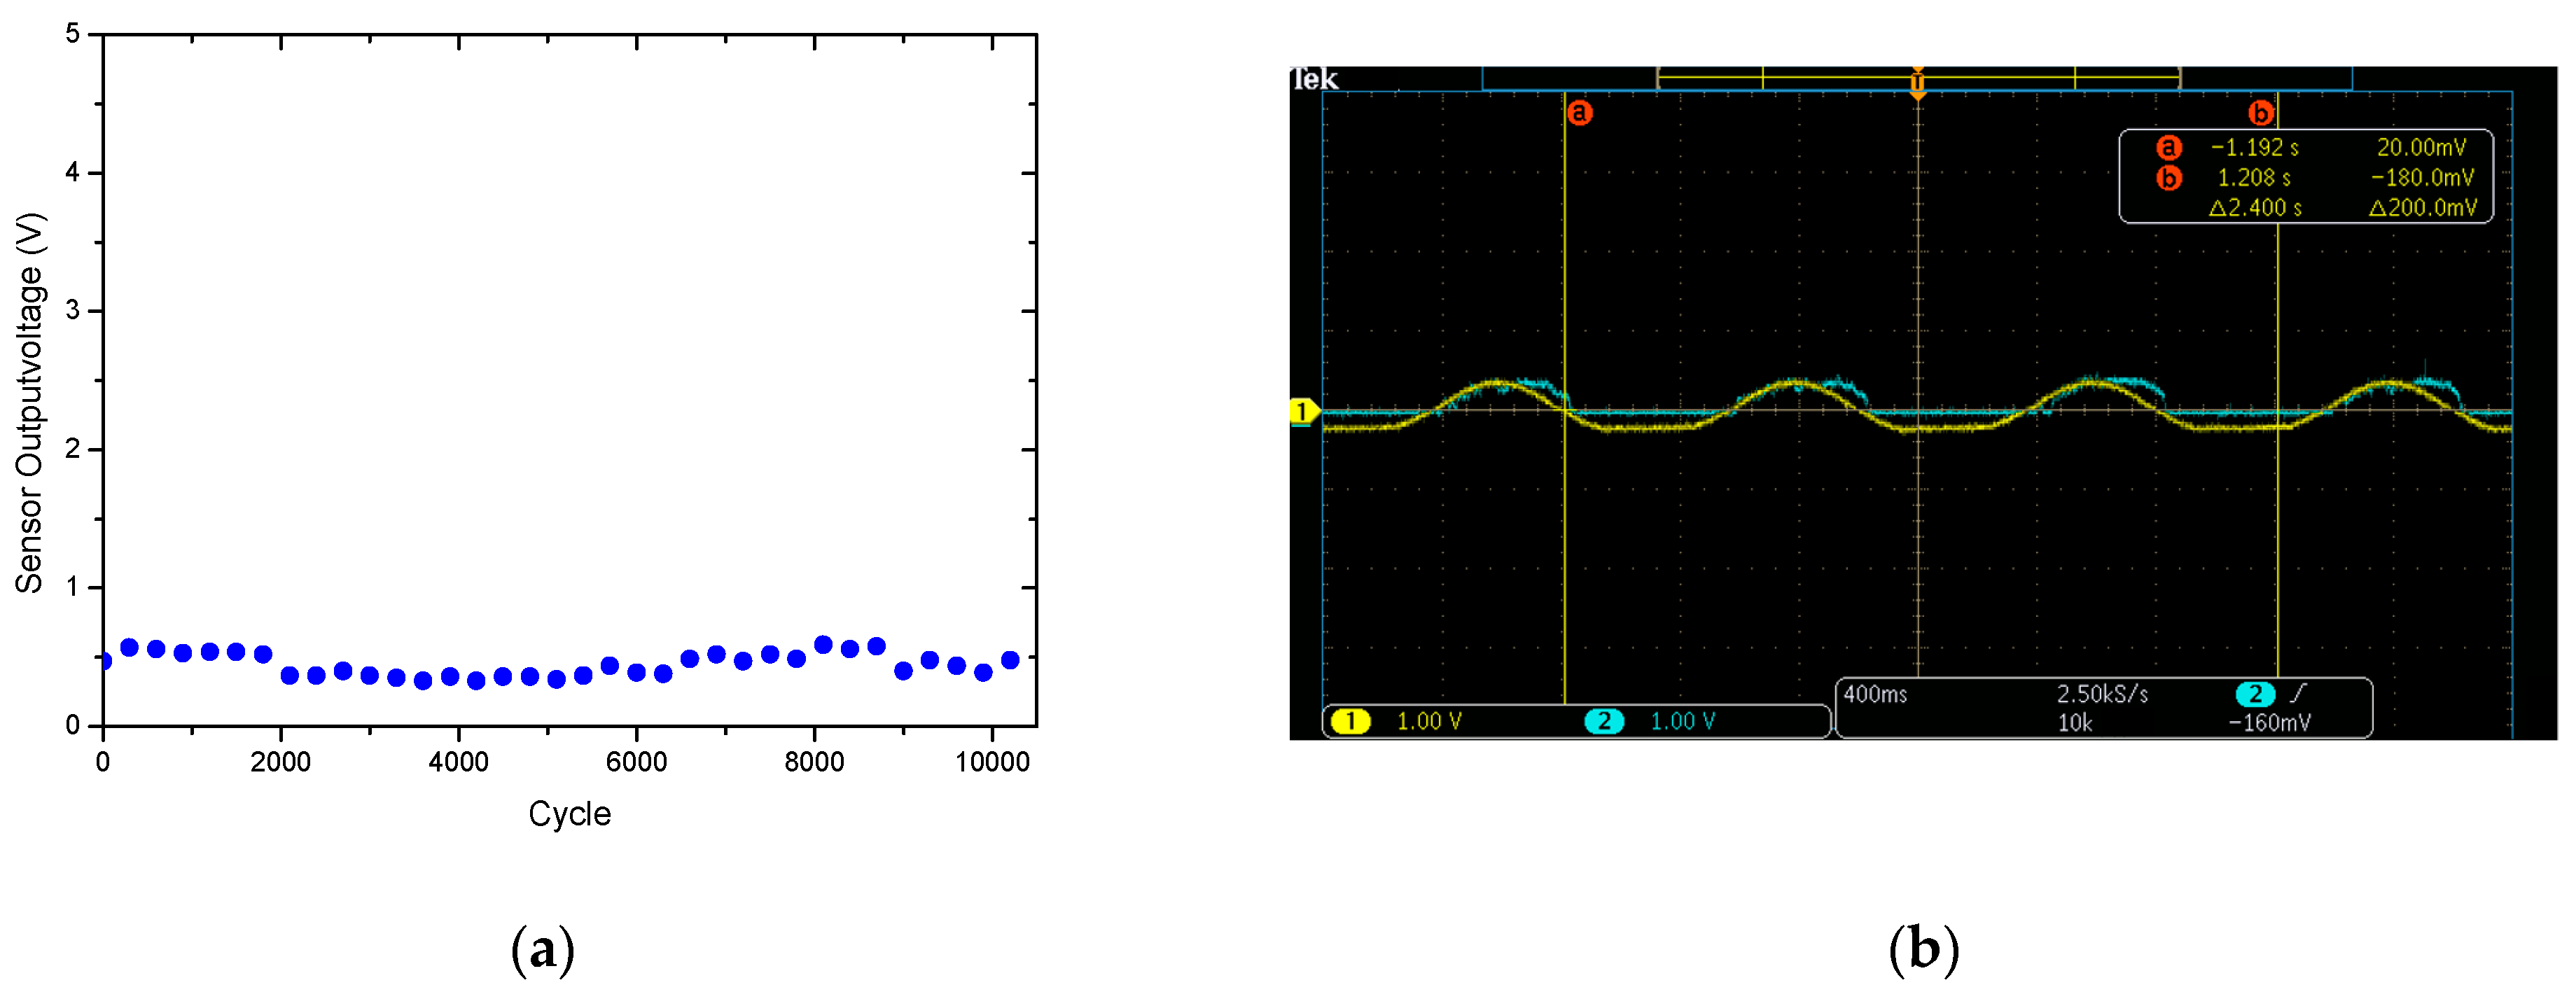
Figure 24.
(a) Life cycle testing of the sensor and (b) the observed response delay time.
Figure 24.
(a) Life cycle testing of the sensor and (b) the observed response delay time.
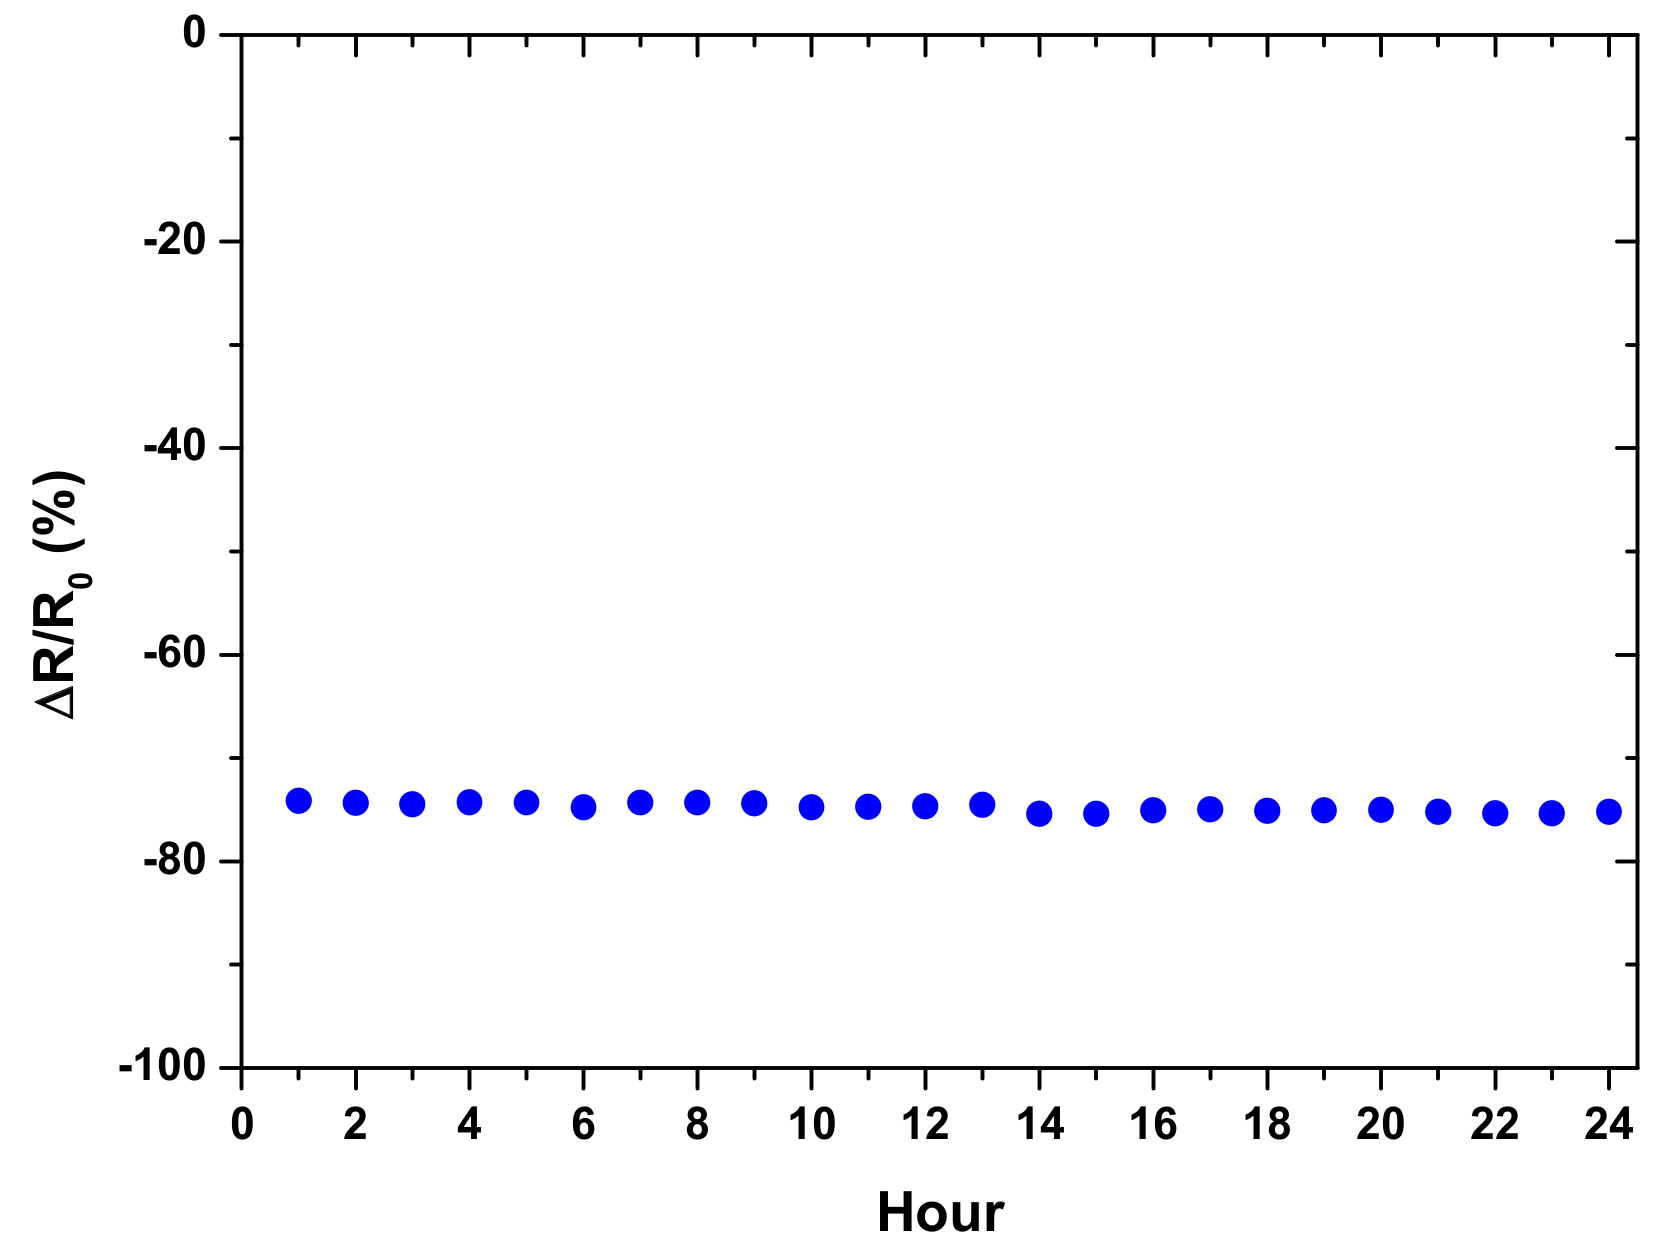
Figure 25.
Sensor stability testing under constant loading for 24 h.
Figure 25.
Sensor stability testing under constant loading for 24 h.
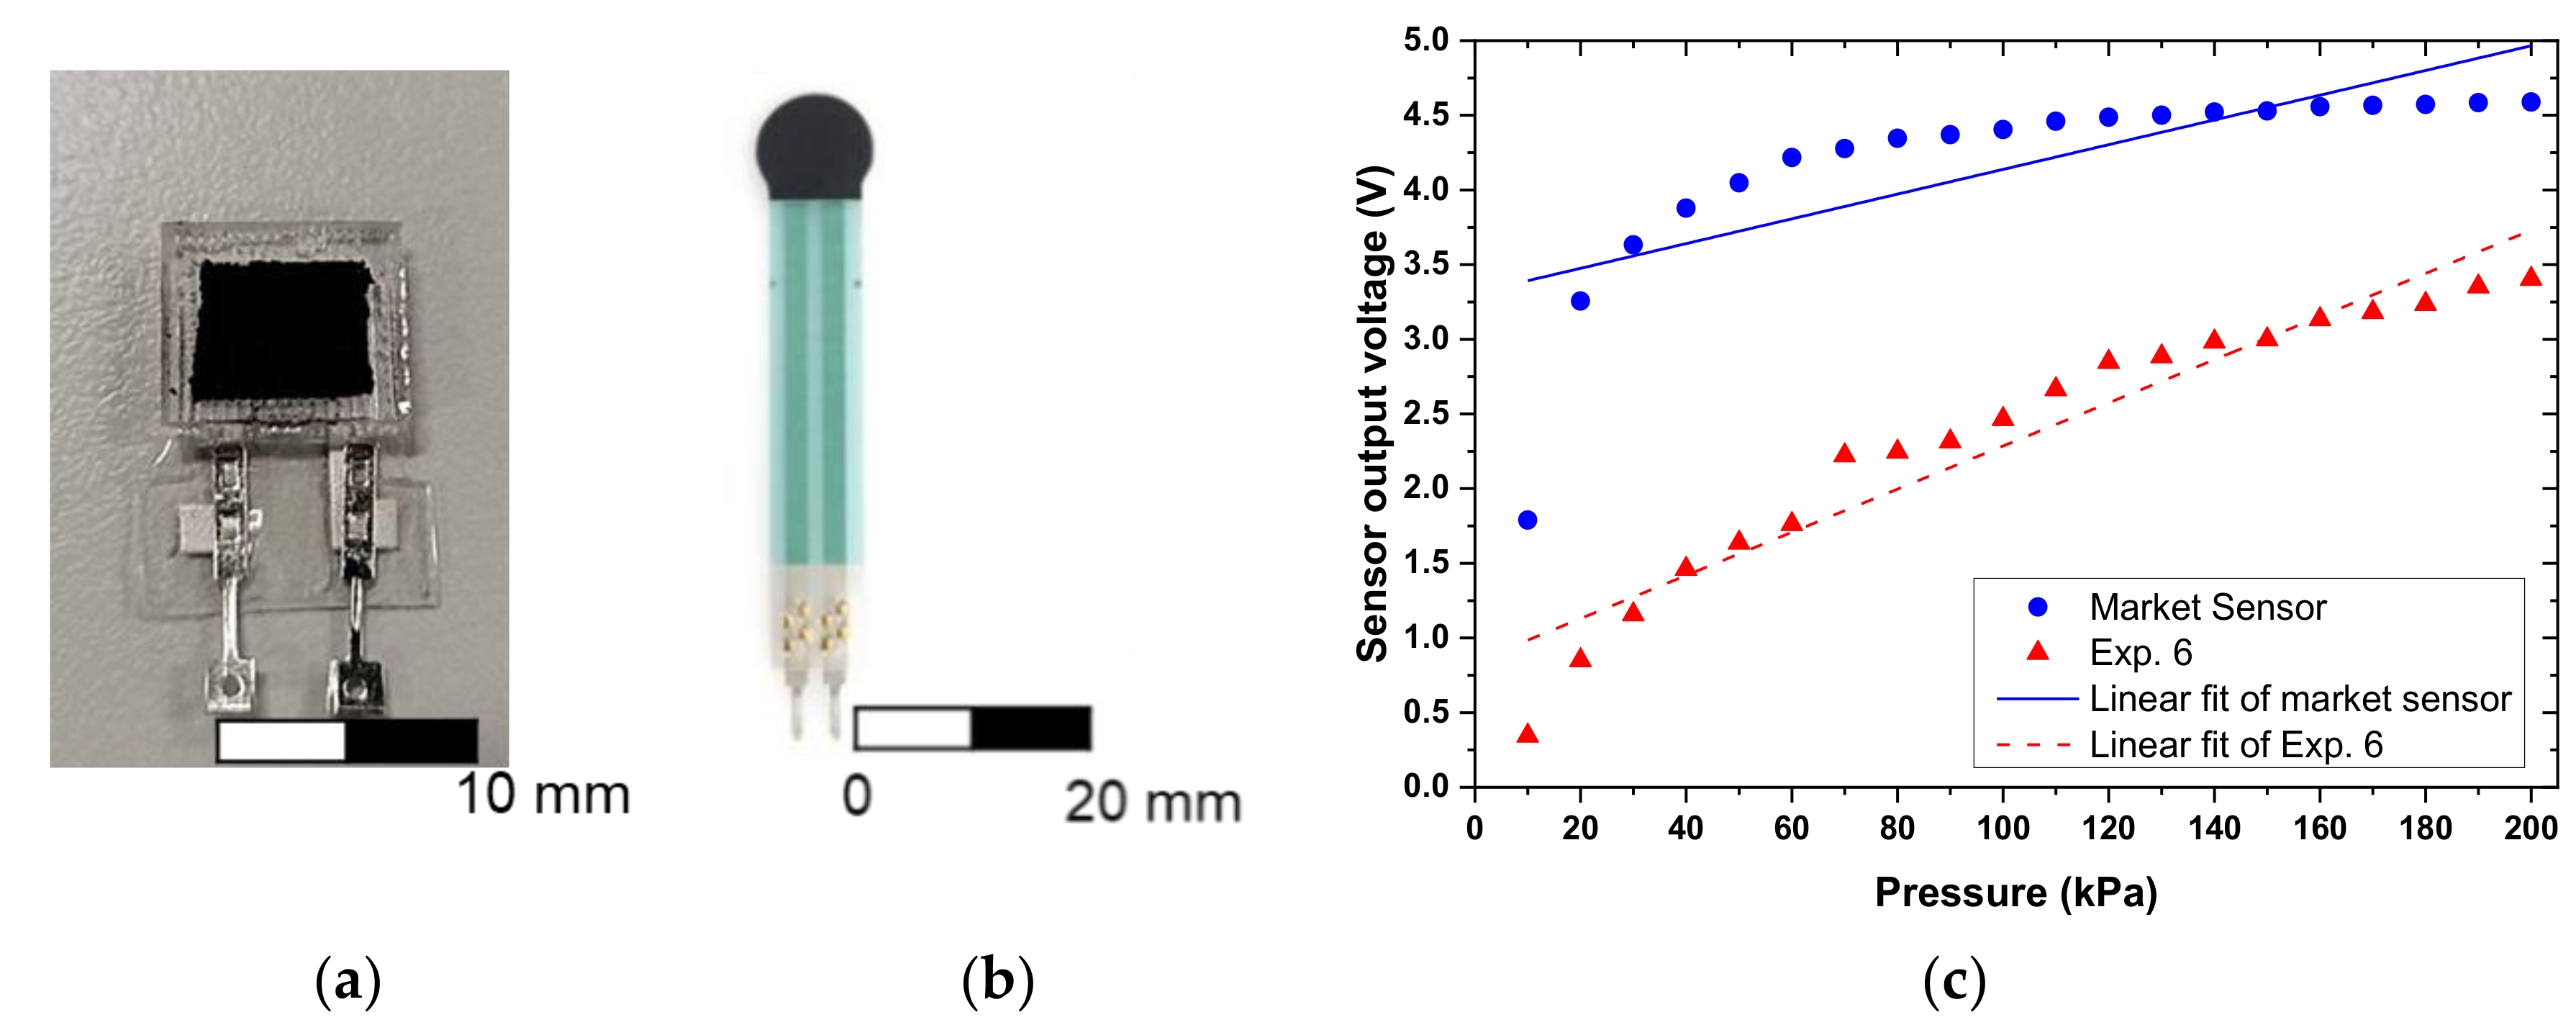
Figure 26.
An image of the (a) proposed tactile sensor and (b) commercially available piezoresistive force sensor. (c) Comparison of the sensor response observed for the proposed tactile sensor and commercial sensor in the pressure range of 0–200 kPa.
Figure 26.
An image of the (a) proposed tactile sensor and (b) commercially available piezoresistive force sensor. (c) Comparison of the sensor response observed for the proposed tactile sensor and commercial sensor in the pressure range of 0–200 kPa.
Table 1.
Parameter design for different doping ratios of multi–walled carbon nanotubes (MWCNTs).
Table 1.
Parameter design for different doping ratios of multi–walled carbon nanotubes (MWCNTs).
| Parameter | Value |
|---|
| Constant | PDMS–A (g) | 2.5 |
| PDMS–B (g) | 0.25 |
| THF (g) | 2.5 |
| Grid structure (mm) | Line width:line spacing:thickness = 1:1:1 |
| Variable | MWCNT (wt.%) | 1–10 |
Table 2.
Parameter design for sensing layer with different grid microstructures.
Table 2.
Parameter design for sensing layer with different grid microstructures.
| Exp. | Width | Spacing | Thickness |
|---|
| 1. | 1 | 0.5 | 1 |
| 2. | 1 | 1 | 1 |
| 3. | 1 | 1.5 | 1 |
| 4. | 1 | 2 | 1 |
| 5. | 1 | 2.5 | 1 |
| 6. | 1 | 1 | 0.5 |
| 7. | 1 | 1 | 1 |
| 8. | 1 | 1 | 1.5 |
| 9. | 1 | 1 | 2 |
| 10. | 1 | 1 | 2.5 |
| 11. | 0.5 | 1 | 1 |
| 12. | 1 | 1 | 1 |
| 13. | 1.5 | 1 | 1 |
| 14. | 2 | 1 | 1 |
| 15. | 2.5 | 1 | 1 |
Table 3.
Correlation coefficient of exponential function for different MWCNT doping ratios.
Table 3.
Correlation coefficient of exponential function for different MWCNT doping ratios.
| wt.% | a | b1 | b2 |
|---|
| 4 | 0.33118 | 125.14319 | −667.60896 |
| 5 | 0.04174 | 95.26003 | −191.07812 |
| 6 | 0.0192 | 151.27168 | −474.64186 |
| 7 | 0.00205 | 80.11371 | −358.80076 |
| 8 | 0.002 | 81.15095 | −365.69916 |
| 9 | 0.01307 | 37.2995 | 403.70409 |
| 10 | 0.01266 | 33.31928 | 490.72404 |
Table 4.
Linear regression analysis of different MWCNT wt.% sensors.
Table 4.
Linear regression analysis of different MWCNT wt.% sensors.
| wt.% | 10–20 kPa | 30–200 kPa |
|---|
| Sensitivity (kPa−1) | R2 | Sensitivity (kPa−1) | R2 |
|---|
| 4 | −8.95 | 0.8319 | −0.0331 | 0.5491 |
| 5 | −9.477 | 0.8055 | −0.00476 | 0.2688 |
| 6 | −10.359 | 0.9344 | −0.00125 | 0.3507 |
| 7 | −6.821 | 0.9704 | −0.029 | 0.8138 |
| 8 | −7.778 | 0.6014 | −0.014 | 0.4568 |
| 9 | −0.014 | 0.5199 | −0.002 | 0.3683 |
| 10 | −7.653 | 0.4128 | −0.00023 | 0.1436 |
Table 5.
The correlation coefficient of the exponential function model for different grid microstructures.
Table 5.
The correlation coefficient of the exponential function model for different grid microstructures.
| Exp. | a | b1 | b2 |
|---|
| 1 | 0.20616 | 212.29945 | −3043.20202 |
| 2,7,12 | 0.00132 | 106.45368 | −657.2801 |
| 3 | 0.03394 | 48.34052 | 2633.01675 |
| 4 | 0.00841 | 334.8633 | −3666.16773 |
| 5 | 0.00903 | 402.15957 | −6846.15007 |
| 6 | 0.56235 | 336.47136 | −10,517.0698 |
| 8 | 0.07494 | 121.37038 | −385.7058 |
| 9 | 0.02207 | 217.15394 | −1372.8885 |
| 10 | 0.12636 | −47.60155 | 17,890.96417 |
| 11 | 0.00874 | 12.91022 | −4.61696 |
| 13 | 0.01395 | 304.97847 | −4756.9036 |
| 14 | 0.15182 | 136.69884 | −1093.34007 |
| 15 | 0.07457 | 134.33184 | −889.65462 |
Table 6.
Linear regression analysis for different grid microstructures.
Table 6.
Linear regression analysis for different grid microstructures.
| Variable | Exp. | Pressure Interval (kPa) | R2 | Sensitivity (kPa−1) |
|---|
| Spacing | 1 | 30–120 | 0.9639 | −0.5530 |
| 130–200 | 0.7971 | −0.0305 |
| 2 | − | − | − |
| 30–200 | 0.8138 | −0.0287 |
| 3 | 30–100 | 0.5539 | −0.1145 |
| 110–200 | 0.9675 | −0.0004 |
| 4 | 20–100 | 0.7425 | −0.442 |
| 110–200 | 0.8264 | −0.0019 |
| 5 | 60–100 | 0.6558 | −0.5304 |
| 110–200 | 0.9364 | −0.0355 |
| Thickness | 6 | 50–130 | 0.9743 | −0.2704 |
| 140–200 | 0.9701 | −0.0968 |
| 7 | − | − | − |
| 30–200 | 0.8138 | −0.0287 |
| 8 | − | − | − |
| 30–200 | 0.2900 | −0.0029 |
| 9 | 30–80 | 0.7978 | −0.738 |
| 90–200 | 0.7681 | −0.0237 |
| 10 | − | − | − |
| 100–200 | 0.7825 | −0.0334 |
| Width | 11 | 30–100 | 0.9554 | −0.0934 |
| 110–200 | 0.7305 | −0.015 |
| 12 | − | − | − |
| 30–200 | 0.8138 | −0.0287 |
| 13 | − | − | − |
| 80–200 | 0.9111 | −0.0733 |
| 14 | 20 –110 | 0.9506 | −4.1688 |
| 120–200 | 0.8464 | −0.1014 |
| 15 | − | − | − |
| 60–200 | 0.9799 | −0.043 |
Table 7.
Thermal cycling test condition.
Table 7.
Thermal cycling test condition.
| Test Conditions | Parameter |
|---|
| Temperature range | −5–50 °C |
| Duration of exposure | 10 min |
| Ramp time | 10 min |
| Cycle time | 40 min |
| Number of cycles | 100 times |
Table 8.
Comparison of the observed error and sensitivity for the proposed sensor and the commercially available sensor.
Table 8.
Comparison of the observed error and sensitivity for the proposed sensor and the commercially available sensor.
| | Proposed Sensor | Commercial Sensor |
|---|
| Error (%) | 1.56 | 2 |
| Sensitivity (V/kPa) | 0.01445 | 0.00828 |


 ,
, 


