1. Introduction
Nonlinearities of microelectromechanical system (MEMS) resonators have been recognized as a limitation to their normal operation. As a result, the presence of nonlinear behavior in MEMS resonators can compromise their performance. As such, several techniques and resonator architectures have been proposed to reduce or compensate for the influence of nonlinearity [
1,
2,
3]. On the other hand, nonlinear behavior is usually desired in vibration insulators [
4,
5] and vibration energy harvesters (VEH), as they can leverage a larger displacement and a broader bandwidth [
6,
7,
8]. Such relatively large displacement is also highly desirable for the conception of active time differentiators for terahertz applications [
9,
10]. Moreover, nonlinear resonators have been the subject of recent interest for the design and development of nonlinear MEMS accelerometers, resonator switches, and logic gates [
11,
12,
13,
14].
To exert nonlinear phenomena in MEMS devices, specific design guidelines are required. The expression of such nonlinear stiffness phenomena can be regrouped into two categories: spring softening and spring hardening. In the first case, increasing of the amplitude of the excitation will lead to a reduction of the resonant frequency, while in the second case, this increase of the amplitude of the excitation will lead to an augmentation of the resonant frequency. In terms of practical application of the nonlinear phenomenon in MEMS devices, there does not appear to be a preference for either type of nonlinearity for specific applications, as softening- and hardening-type VEH, resonators, and switches have been presented in the literature [
15,
16,
17]. However, it can be expected that in the future, as more and more of these devices are designed, preferences for targeted applications will appear. This highlights the necessity of developing clear guidelines and structures, allowing the designers to choose either spring softening or hardening of the MEMS devices.
Characterization of nonlinear MEMS performance is important to verify the accuracy of the simulations and determine the actual properties of the devices. However, such nonlinear MEMS devices typically exhibit strong hysteresis phenomena. Such hysteresis renders the characterization more complex, as it causes the performance of the MEMS devices to depend on the previous state. Characterization methods that reduce the impact of hysteresis in nonlinear resonators have been developed. Among them, “FREEVIB” presented in [
18,
19] and “FORCEVIB” presented in [
19,
20] are the most prominent. However, such characterization methods are time-consuming, complex to implement, sensitive to noise, and generally reserved for macro-sized structures. For these reasons, alternatives to such methods have been presented [
21,
22]. The application of such a method to nonlinear MEMS resonators as presented in [
23], and remains the exception. Accordingly, characterization methods that reduce the impact of hysteresis are not widely employed in the literature touching on the design and development of nonlinear MEMS resonators, as can be observed in [
6,
7,
8,
11,
12,
13,
14,
15,
16,
17,
24,
25,
26,
27]. Therefore, developing experimental characterization methods that allow for mitigation, or at least relative control of such hysteresis in nonlinear MEMS resonators is desirable.
In the literature, several architectures that favor the nonlinear behavior in MEMS resonators have been proposed. However, few of these studies investigate both the softening and hardening responses of the same design. Accordingly, the aim of this work is to study the impacts of different anchoring schemes on the frequency response of piezoelectric MEMS nonlinear resonators, and develop a characterization method allowing for relative control of the hysteresis. In this regard, by using two different topologies, the presence of hardening and softening behaviors in the nonlinear MEMS resonator are studied. The findings of this study highlight the necessity of controlling the characterization of nonlinear MEMS resonators as a function of the end application. In such a system, the characterization approach greatly impacts the performance of the MEMS devices in terms of efficiency and operational frequency range. Thus, the contributions of this work can be listed as follows:
A MEMS resonator architecture allowing the designer to readily control the type of nonlinearity, that is, yielding either spring hardening or softening;
An experimental testing methodology allowing the monitoring and control of the hysteresis in the nonlinear resonators; and
Recommendations for the characterization of nonlinear resonators.
The remaining parts of this paper are structured as follows: a general background on how to induce the nonlinearity in the MEMS resonators is presented in
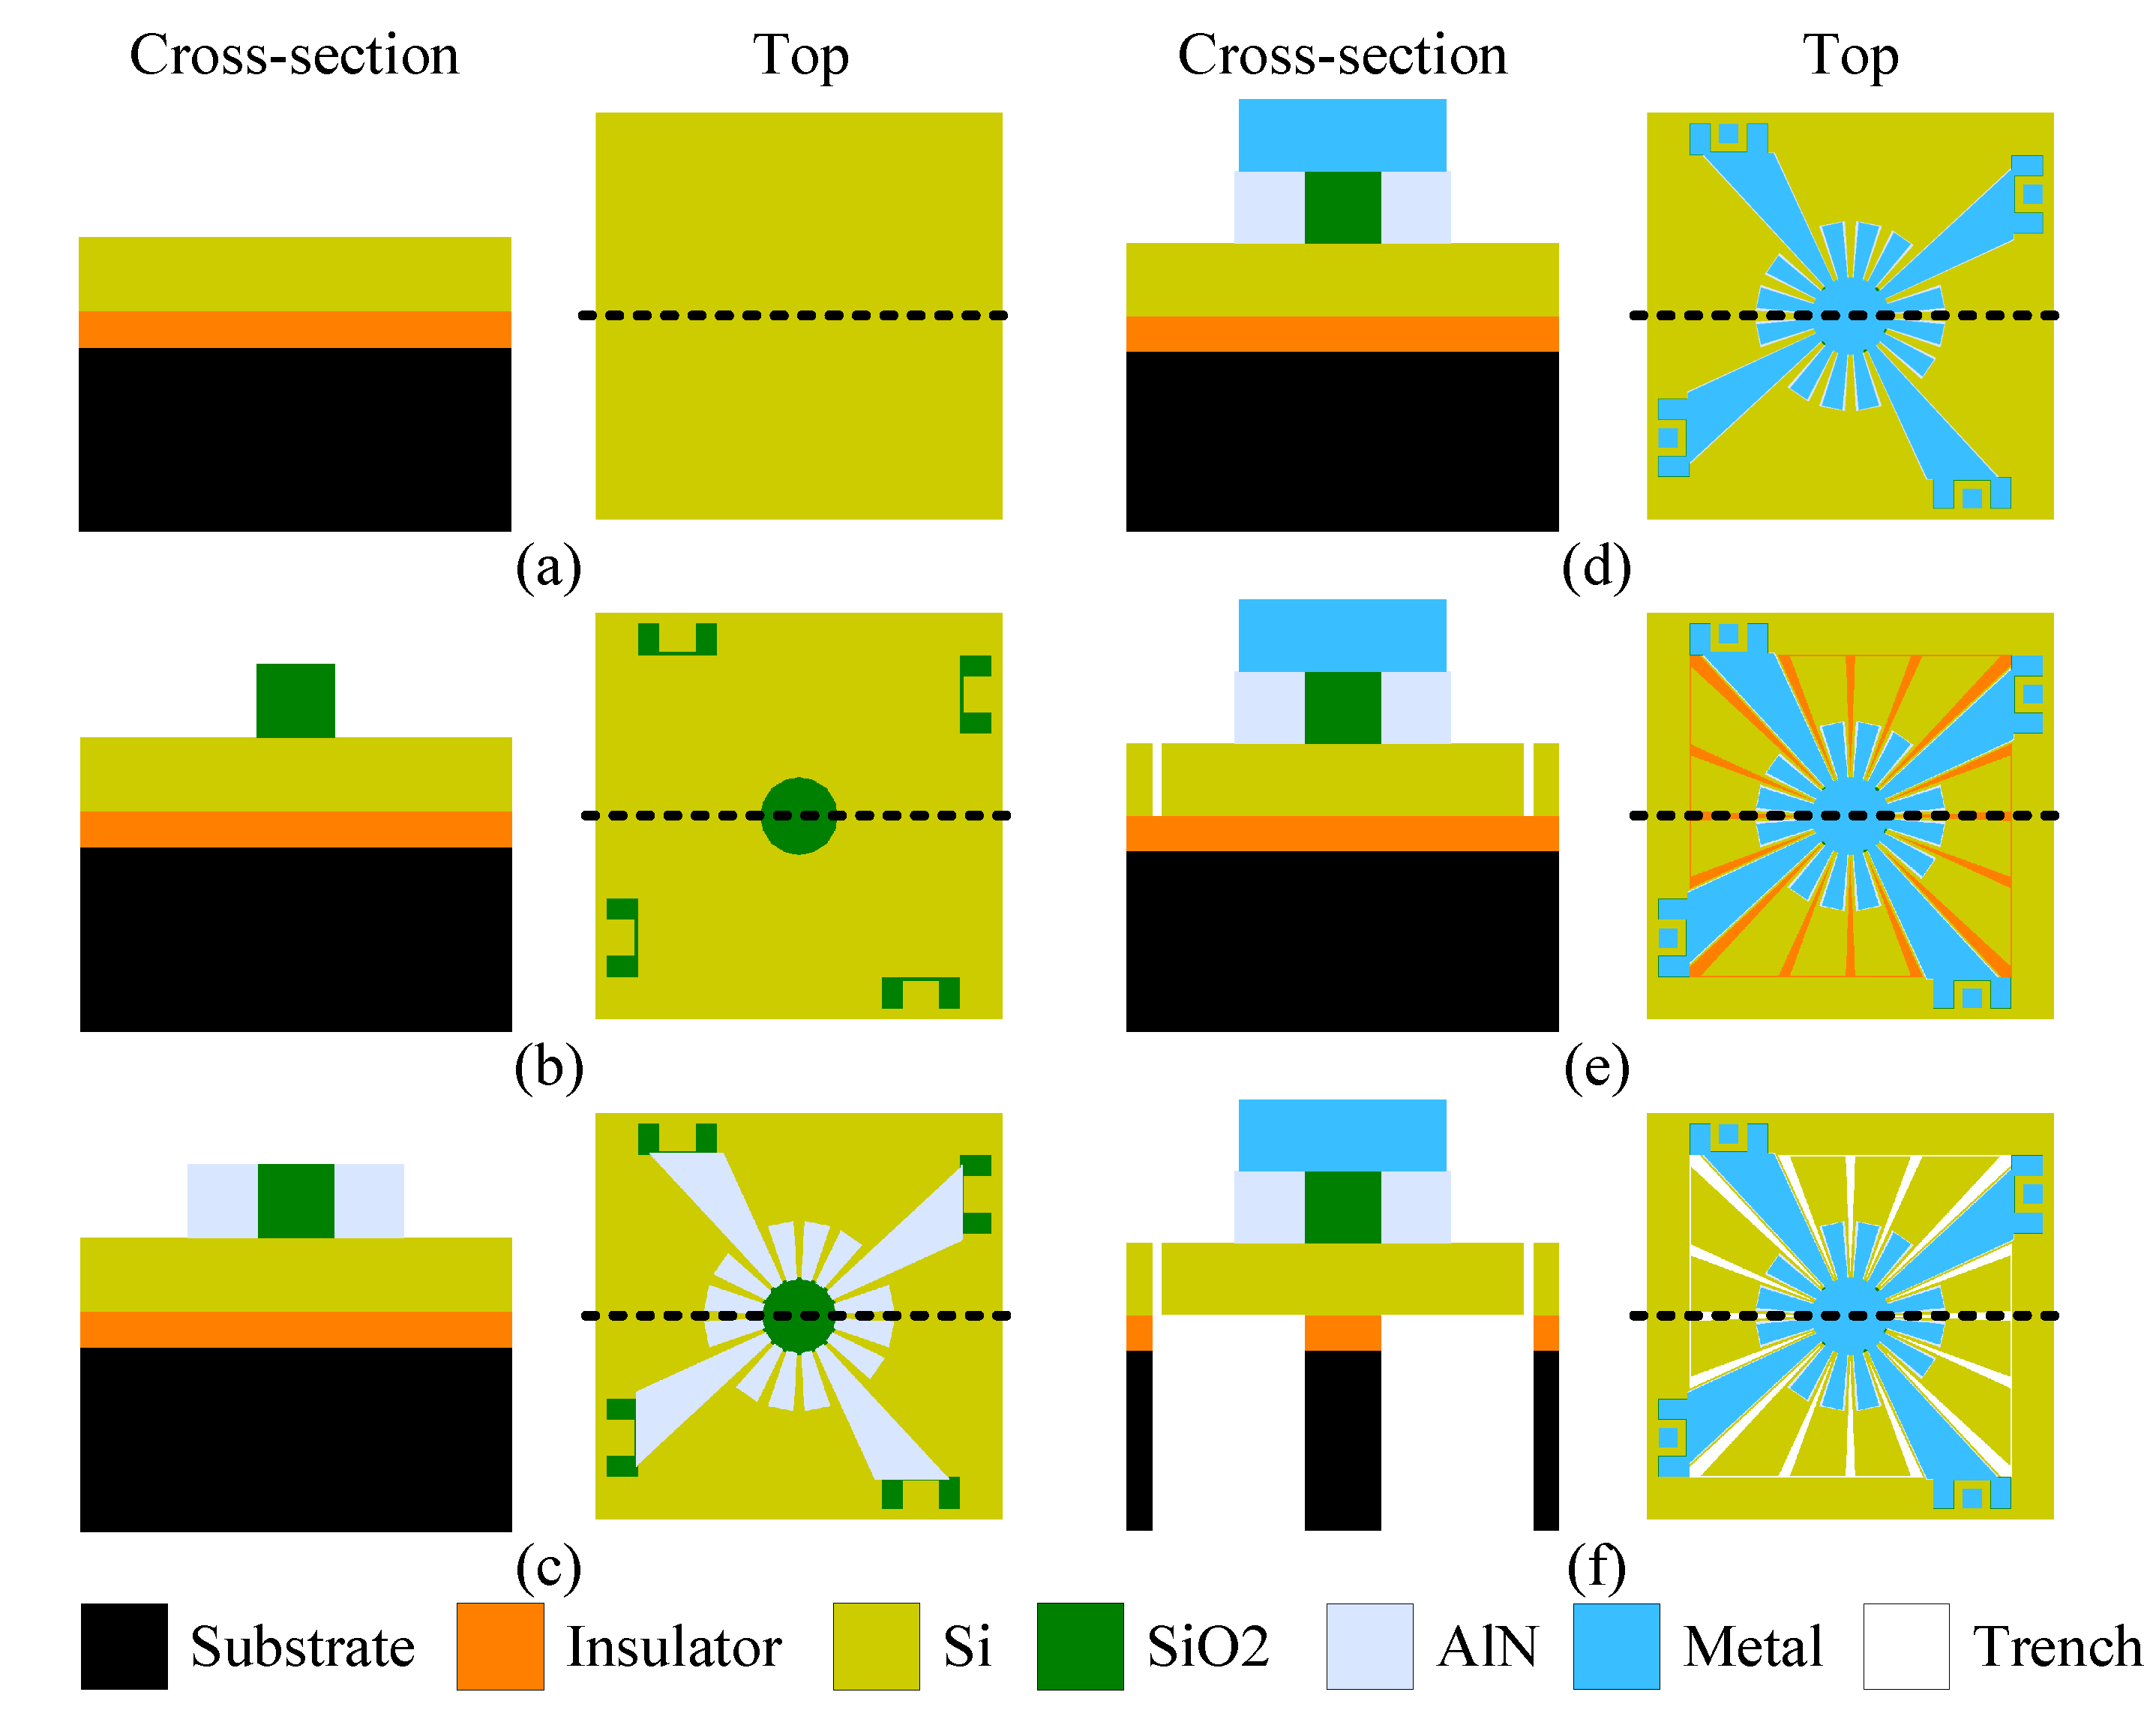
Section 2. The design and fabrication process of the studied structures is summarized in
Section 3. In
Section 4, the performance of nonlinear MEMS resonators as a function of the excitation signal is discussed, and the influence of the hysteresis is shown.
Section 5 provides a comprehensive comparison of the practical implementation of such changes in the performance of MEMS resonators. Finally, a conclusion is presented.
4. Experimental Results
4.1. Description of the Experimental Test Setup
To characterize the hysteresis and nonlinearity behaviors of the MEMS resonators described in
Section 3, the following approach was carried out. The prototyped SD resonators were electrically excited, while their mechanical responses were measured by an optical vibrometer. It is worth mentioning that in the case of MEMS piezoelectric transducers, a mechanical or an electrical excitation will yield similar behavior in frequency. In the present case, an electrical excitation was used, since a simpler measurement setup is required for that purpose.
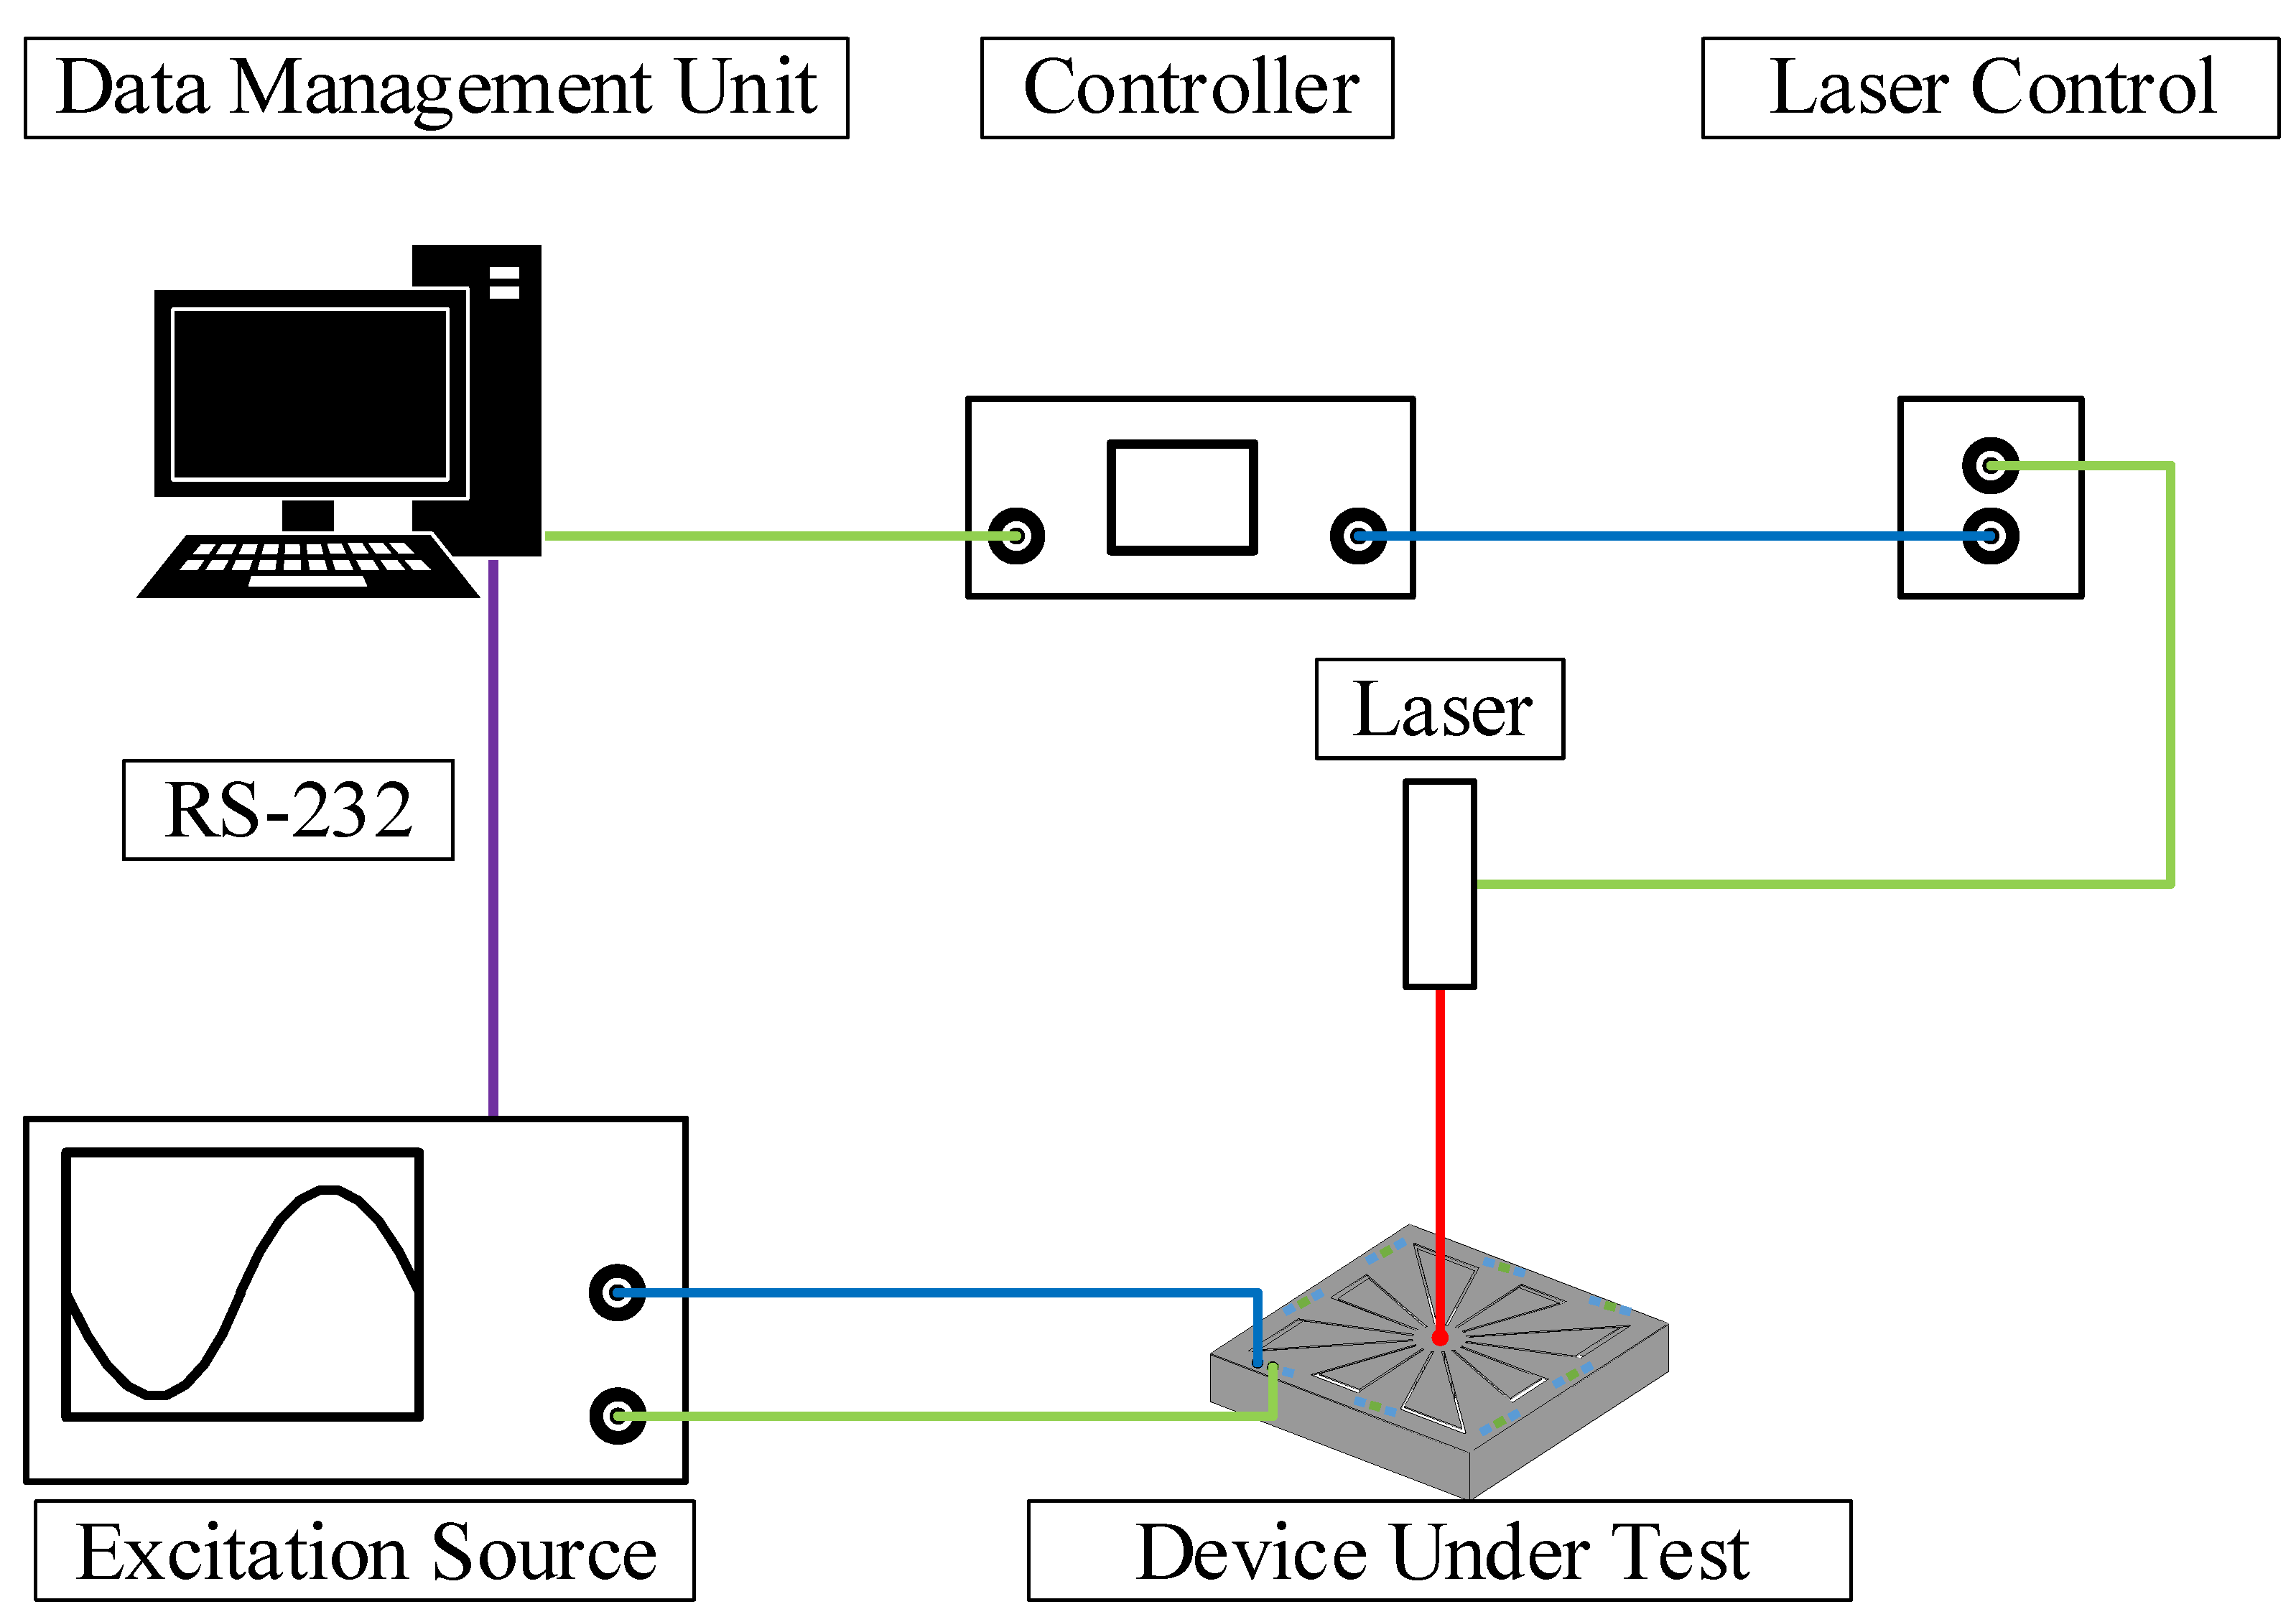
The vibrometer used for the experimental test setup was acquired from Polytec, Irvine, CA, USA, and includes a data management system, a vibrometer controller (OFV-2570), and a laser unit (OFV-534). This test setup is presented in
Figure 6. In order to satisfy the Nyquist-Shannon sampling theorem, the sampling frequency
for all the measurements was set to be
. To excite the prototyped MEMS resonators, a function generator type 33250A from Keysight, Santa Rosa, CA, USA was used. This function generator was controlled by the serial interface to provide the desired voltage excitation signal. As marked in
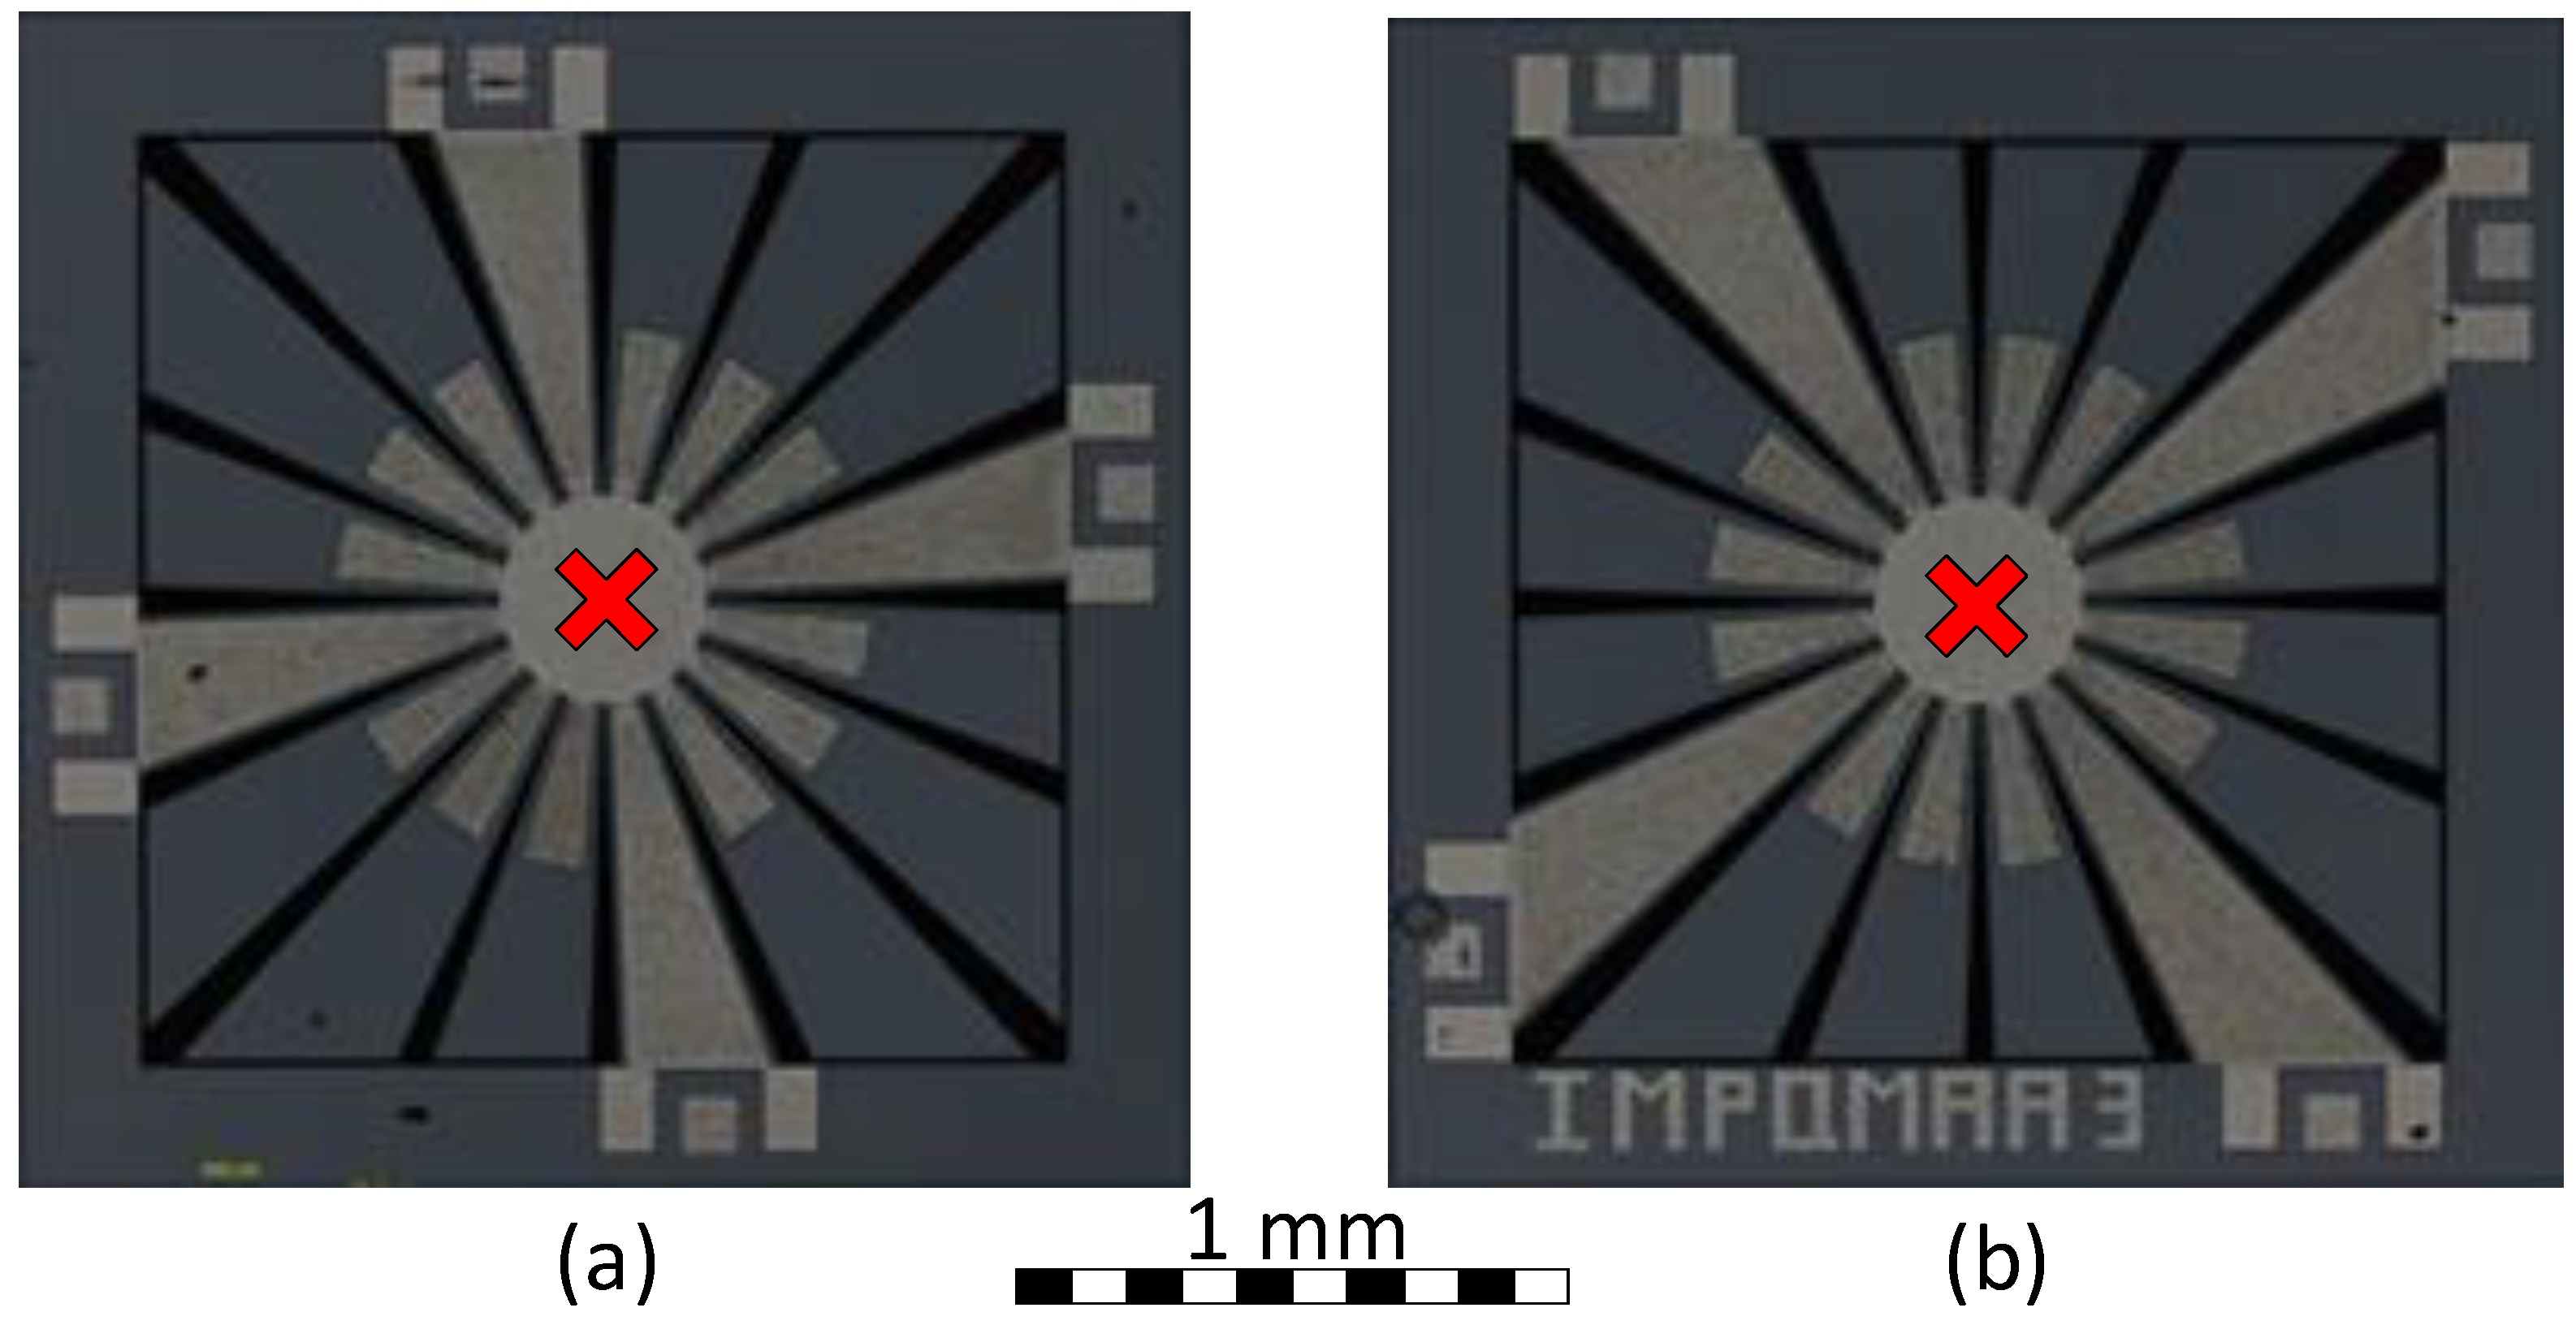
Figure 5, the deflection of the central mass was considered as the measurement point. The deflection measurements of the free cantilevers will yield a similar response with a higher velocity due to the increased degree of freedom of such cantilevers, as shown in [
27]. This can also be directly observed using the measurement of the mode shape of both variants presented in
Appendix A.
4.2. Description of the Excitation Signals
The MEMS resonators were excited by using three different excitation voltage signals—namely, pulsed sweep (), where the excitation frequency is discretely swept, continuous sweep forward (), where the excitation frequency was swept in an ascending manner, and continuous sweep backward (), where the excitation frequency was swept in a descending manner. The nature of these excitation voltage signals are described in further detail below.
In the nonlinear regime, the hysteresis is dependent on the prior state of the vibrating system. To eliminate the hysteresis effect in the characterization of the MEMS resonator, a pulsed sweep was defined. When excited with a -type excitation, the MEMS devices are excited at a particular frequency , for a given duration of ; afterwards, the devices are turned off for a duration of . The value of is sequentially swept between and , the lower and the higher excitation frequencies, respectively. The excitation frequencies are thus discrete, and the resolution of this is equal to the distance between two consecutive excitation frequencies, .
The has been carried out following three main variations. In the first one, the excitation frequencies’ steps are applied in an increasing order. Then in the second, the excitation frequencies’ steps are applied in a decreasing order. Finally, in the third, the excitation frequencies’ steps are applied in a random order. These sweeps have been named pulsed sweep forward (), pulsed sweep backward (), and pulsed sweep random (), respectively. By performing these three pulsed sweeps, the test setup can be validated, and the hysteresis effect of the characterization can be eliminated (i.e., by using a sufficient duration to eliminate the hysteresis in the system). The minimal duration of varies with each resonator, as it is a function of the quality factor Q and the resonant frequency of the resonator. Both of these parameters are responsible for the decay time of the resonator . Experimental results have shown that if is greater than 10 , then the hysteresis effect of the characterization is effectively eliminated. It should be noted that the resolution in frequency for this characterization mode is equal to , and is affected by neither the sampling frequency nor the duration of the excitation (provided that the Nyquist-Shannon sampling theorem is respected).
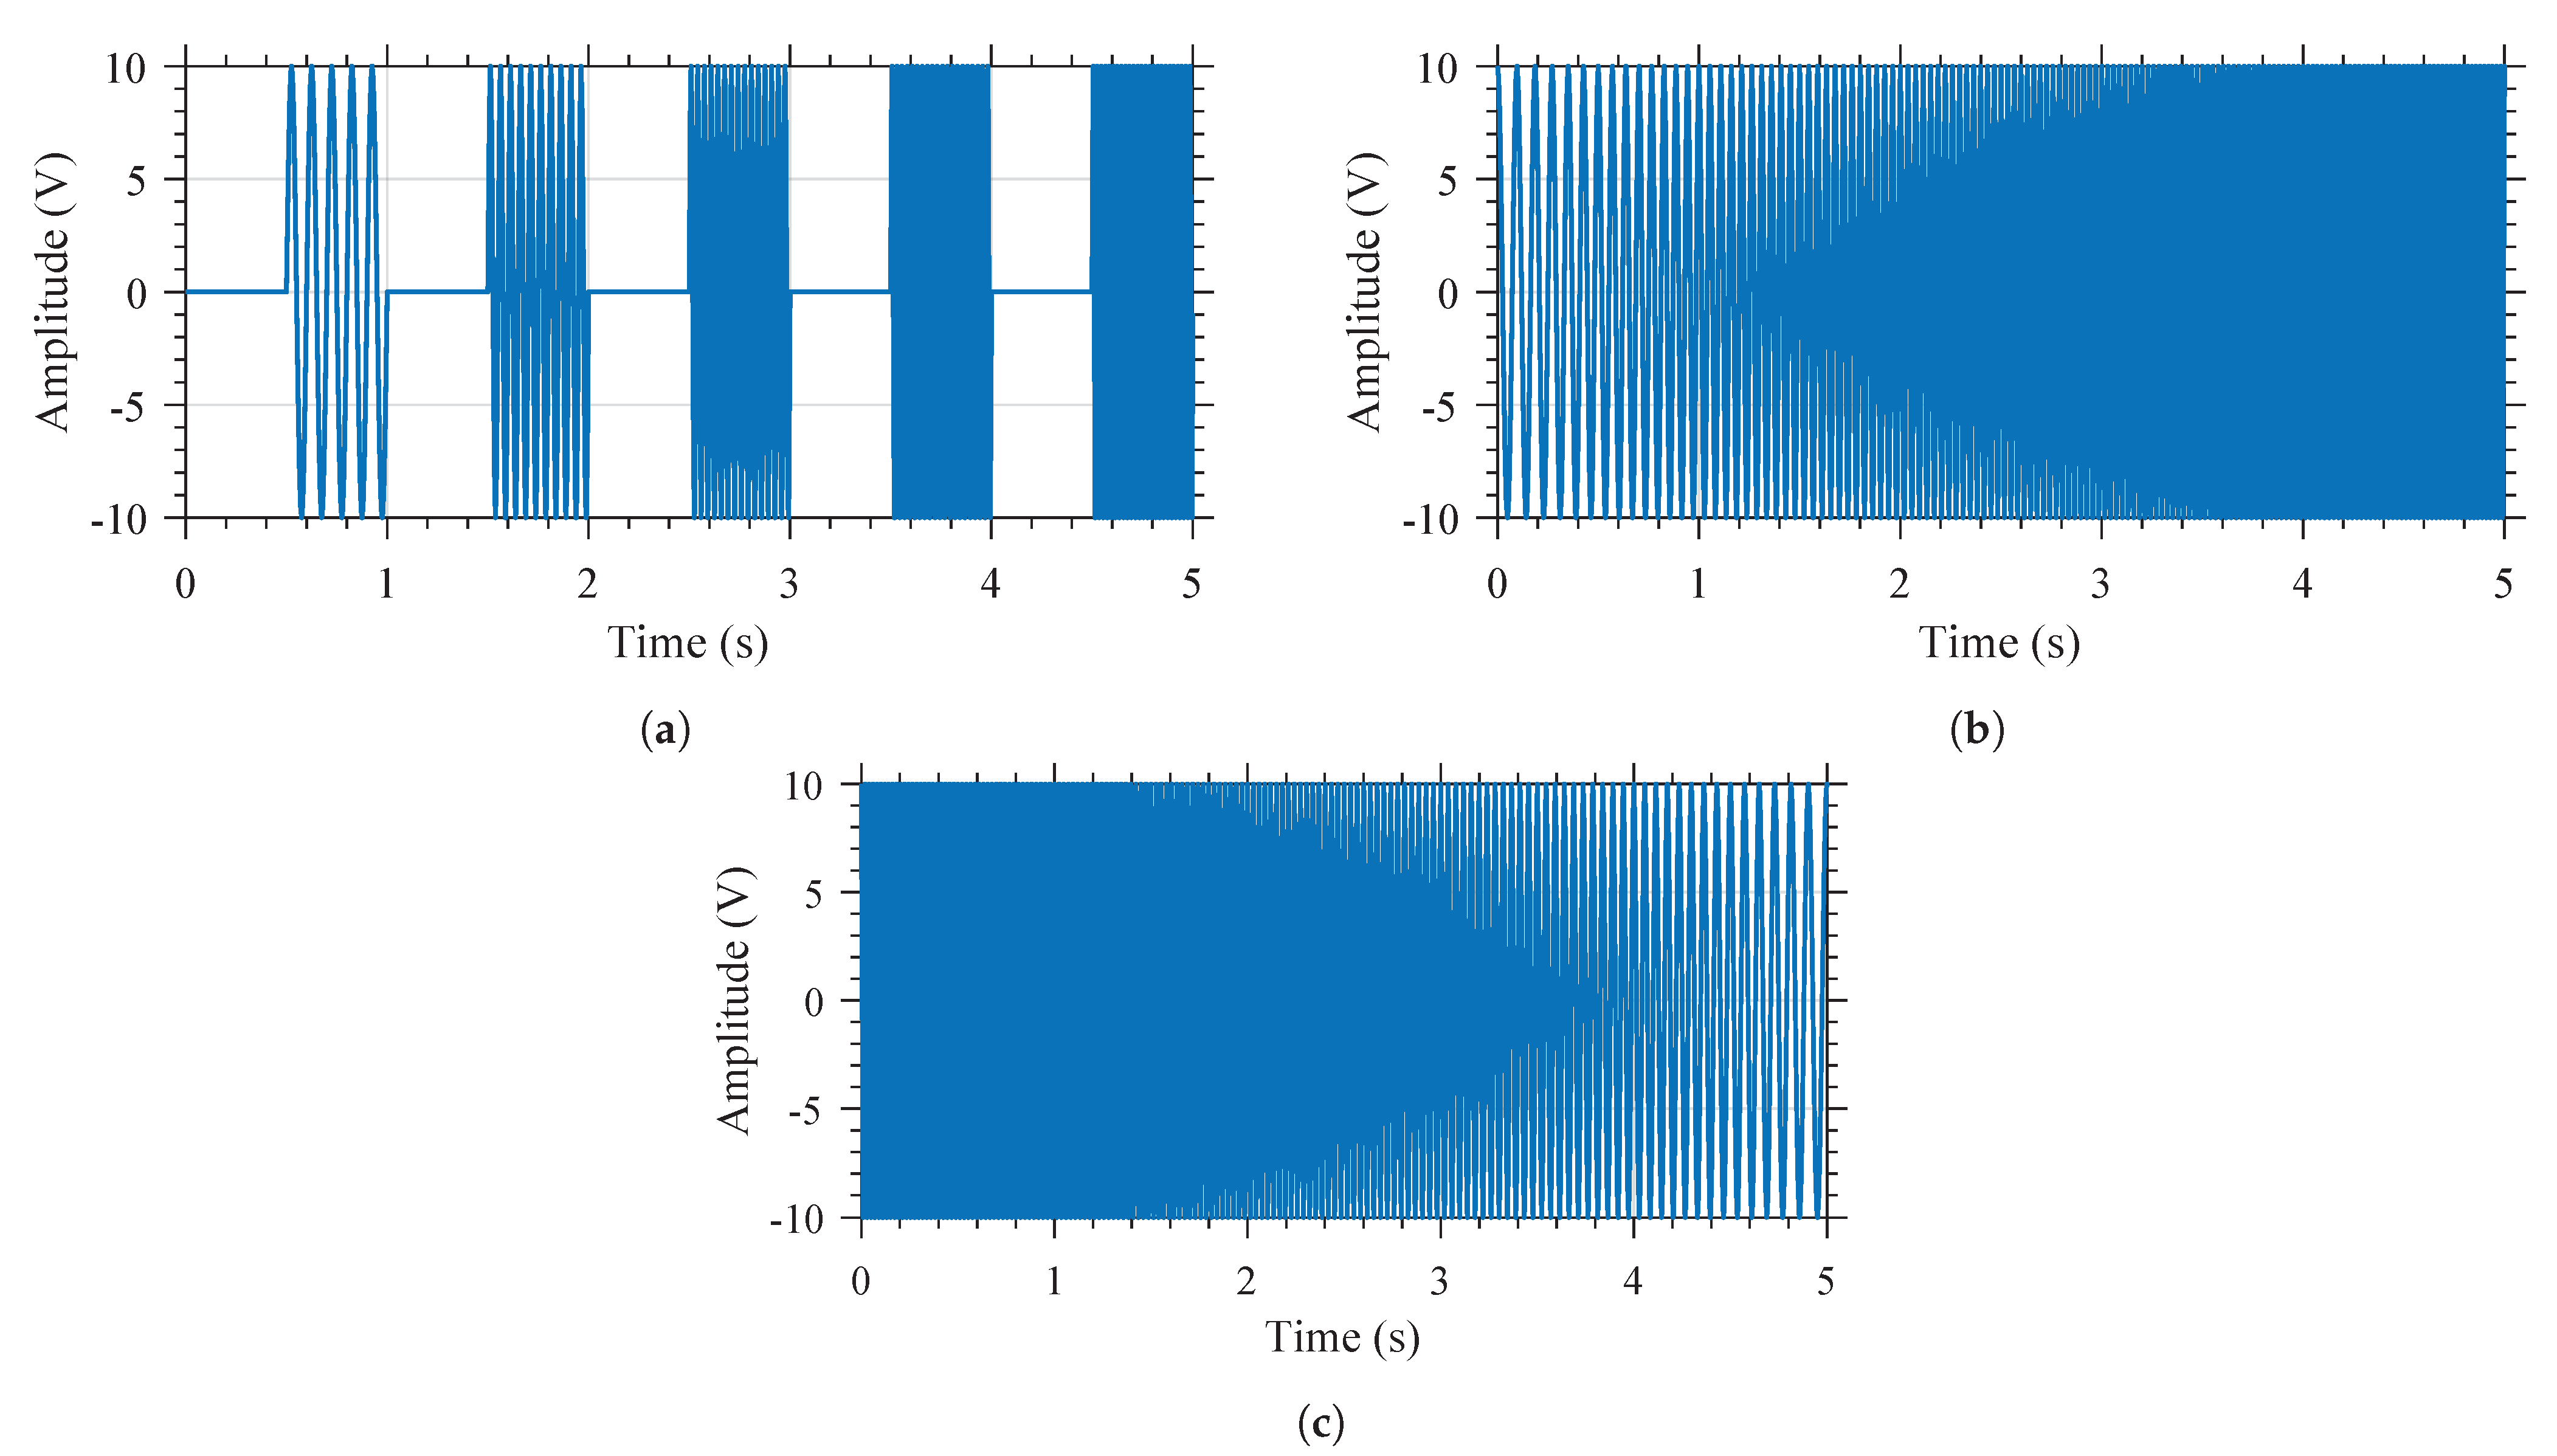
An illustration of the excitation signal for the (
) is shown in
Figure 7a. In this case, the amplitude of the excitation signal is set to be 20
, while
and
are 10
and 50
, respectively.
is 10
. The duration of
and
are identical, that is,
. The overall excitation is carried out over a duration of
.
In order to exert the hysteresis behavior of the devices, two continuous sweep excitation signals were used, where the frequency was swept continuously in an ascending manner, named continuous sweep forward (
), and in a descending manner, named continuous sweep backward (
). For these excitation signal sweeps, the start and end frequencies of the sweep (
and
), as well as the duration of the excitation
are set. These parameters result in a sweep rate
and a resolution in frequency
.
can be expressed as:
However, experimental results have shown that varying the value of
from 8
/
up to 6250
/
does not have an influence on the behavior in frequency of the resonators. On the other hand,
is entirely dependent on the sampling frequency
and the number of points considered for the FFT operation
, and can be expressed as:
As the value is a function of the duration of the excitation, reducing the value of will increase the value of , and therefore reduce the ability to accurately characterize the behavior of the nonlinear MEMS resonator. This effect can be partially compensated by using zero-padding on the measured signal, as this operation will artificially augment the number of points considered for the FFT operation.
An illustration of the excitation signal for the
and
is shown in
Figure 7b,c, respectively. With reference to this figure, the amplitude of the excitation signal is 20
. The lower and higher frequencies are 10
and 50
, respectively. The excitation duration is
.
It is worth reminding that the term of “frequency response” and “resonant frequency” are somehow inaccurate for the nonlinear resonators, as the hysteresis effect comes into action. Hence more accurately described, the behavior in frequency of the resonators in presented, as caused by a defined stimulus. In the case of nonlinear resonators, contrary to linear resonators, the resonant frequency varies as a function of the amplitude of the excitation signal and the type of excitation provided to the resonator (i.e., while for a linear resonator knowing the amplitude and frequency of the excitation is enough to determine the displacement of the resonator, in the case of nonlinear resonators, the previous state should also be specified to allow such determination). Hence, the term “resonant frequency” will not be used, and instead the term frequency at which the maximum velocity is reached () will be used. This effect will be demonstrated in the following sections, where the responses of the devices over frequency to different excitation amplitude levels and to the excitation signal types described above will be shown.
4.3. Signal Parameters for Each of the Excitation Signals
To allow for a comparison of the continuous sweeps forward and backward (
and
) signals, the sweep parameters have been carefully chosen to allow a relative comparison between each of them. These parameters are presented in
Table 2. These parameters have been chosen to provide a wideband excitation signal but also allow for relative comparison between the two excitation schemes, as the value of
,
, and
are kept constant to 500
, 8
/
, and 2
, respectively.
In the case of the PS excitation, the parameters of the signal for both devices are presented in
Table 3. These parameters have been chosen to provide a large band excitation signal, and also to allow a relative comparison between the (
and
) excitation signals.
For these three types of excitation, (, , and ), measurements will be performed for different signal amplitudes, namely, 5 , 10 , 15 , and 20 .
4.4. Summary of the Measurement Results
The measurement results in the time and frequency domains when modifying the amplitude of the excitation signal for both variants can be found in
Appendix B for the
- and
-type excitation. In the case of the
-type excitation, the measurement results in the frequency domain when modifying the amplitude of the excitation signal and the order of the excitation of the frequencies for both variants can be found in
Appendix C.
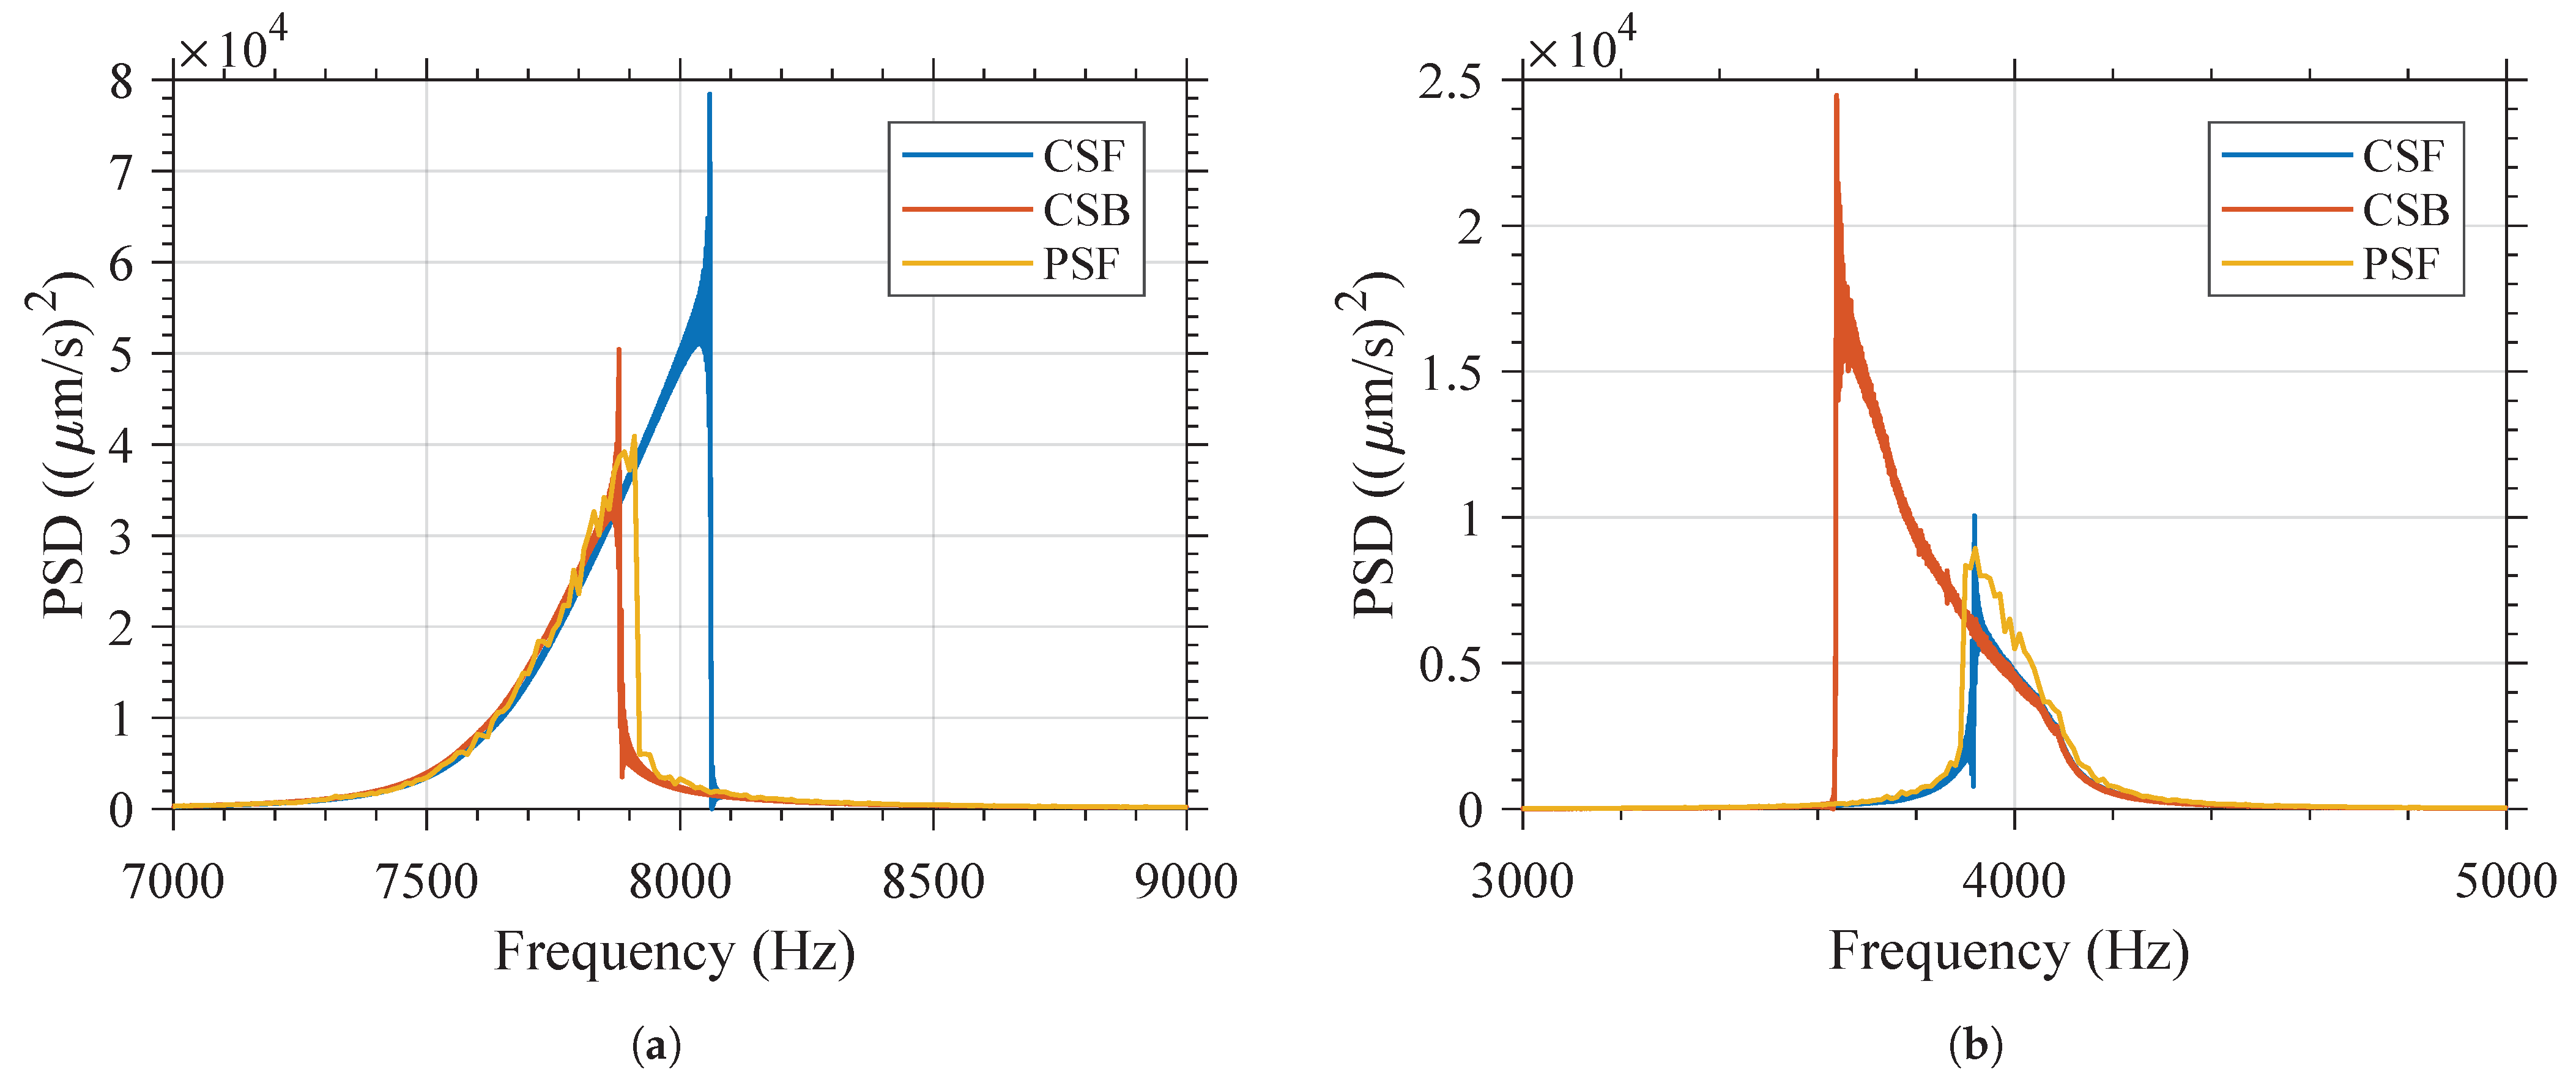
Figure 8 presents a summary of the measurement results for each variant under
-,
-, and
-type excitation. In this figure, the amplitude of the excitation voltage is 20
. The influence of the type of excitation on the behavior in frequency of the resonator can be clearly seen.
In
Table 4, the measurement results are summarized. The influence on the amplitude of the excitation voltage and the type of excitation signal on the maximal velocity reached, the frequency at which the maximum velocity is reached (
), and bandwidth of both variants are presented. The measurement results using the pulsed sweep (
)-type excitation have been summarized in the columns
, as
-,
-, and
-type excitation yield similar results. In this table, the bandwidth has been defined as the full width at half maximum (FHWM) (i.e., the frequency range in which the amplitude is equal or greater than 50% of the maximal velocity reached).
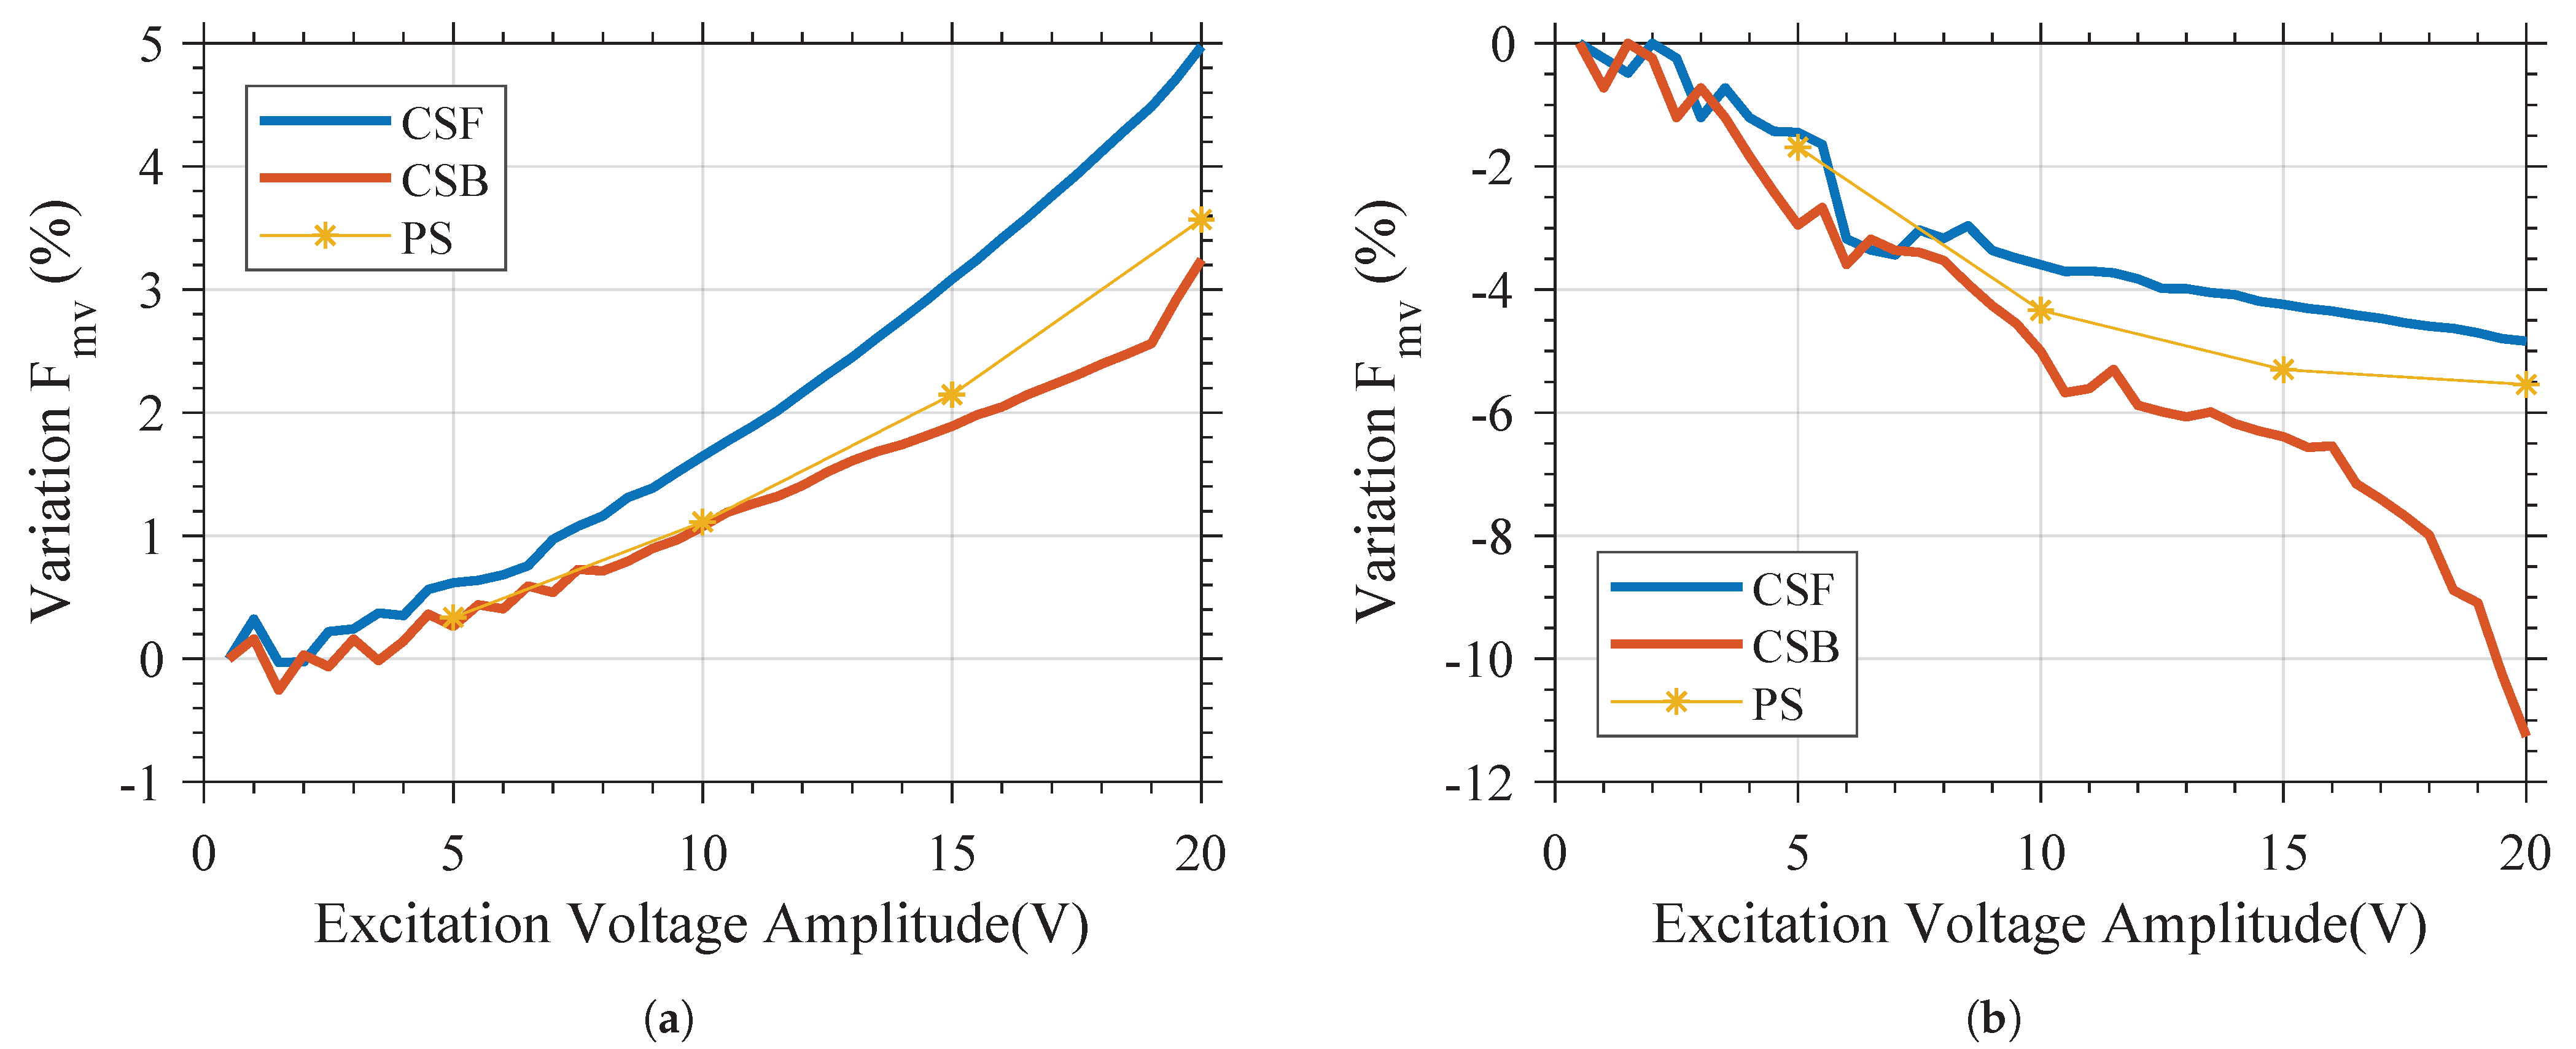
Contrary to the behavior of a linear resonator, for which the variation of the amplitude and type of the excitation signal does not result in variation of the resonant frequency, it can be seen that the behavior of both the variants in the frequency domain is highly dependent on the amplitude and type of the excitation signal. For all excitation types, increasing the amplitude of the excitation signal results in a higher
for Variant 1, but in a lower
for Variant 2. As shown in
Figure 9, if the amplitude of the excitation voltage is constant, it can be observed that the reduction of
for Variant 2 is greater than the increase of the
of Variant 1. This is in line with the simulation results shown in
Figure 3. As shown in that figure, at a constant force, the difference between the deflection of Variant 2 and linear behavior is greater than the difference between the deflection of Variant 1 and linear behavior.
It can be concluded that Variant 1 exhibits a hardening-type spring softening, while Variant 2 exhibits a softening-type spring softening. It is also shown that if the amplitude of the excitation signal is too low (below ≈ 3 ), the amplitude of the excitation voltage does not have a strong influence on , and both devices appear to behave linearly as the displacement of the central proof mass is too small to induce the geometrical nonlinearity.
The frequency behavior of the device can be modified according to the excitation technique. As for Variant 1, as shown in
Figure 8a, it can be clearly seen that when the SD device is subjected to the
excitation signal, it has a larger displacement amplitude in comparison to the
excitation signal; while on the contrary for Variant 2, as shown in
Figure 8b, it can be seen that when the SD device is subjected to the
excitation signal, it has a larger displacement amplitude in comparison to the
excitation signal.
It is also interesting to note from
Figure 8 that the characterization using the pulsed sweep (
)-type excitation (i.e.,
,
, or
) will have similar behavior to the characterization using
-type excitation, but a slightly higher maximal velocity and
for Variant 1. A similar observation can be made regarding Variant 2 and
-type excitation. This can also be seen in
Figure 9, where the variation in the
is plotted versus the excitation voltage, showing that as the amplitude is increased, the
-type excitation for Variant 1 and the
-type excitation for Variant 2 yield a resonant frequency that diverges significantly from that obtained using
excitation. These variations are not linked to the resolution in frequency of the
signal.
Consequently, as it has been simulated and measured, the SD structure has the potential to exhibit different nonlinear behavior depending on the selected anchoring scheme. Moreover, it has been shown that using a -type excitation can allow for relative control of the hysteresis in nonlinear resonators.
5. Discussion
Nonlinear resonators are being considered for the realization of VEH, resonators, switches, and logic gates. Depending on the end application, the excitation of the nonlinear resonators will vary. If the nonlinear resonators are employed as actuators or sensors, they will be electrically driven at a defined frequency, such that the behavior in frequency of these nonlinear resonators will be closer to the results obtained with the -type excitation.
If the nonlinear resonators are destined for energy-harvesting applications, they will be subjected to the vibrations in the ambient. Due to their nature, mechanical vibrations cannot be predicted, and therefore, the characterization of VEH using a method that will give different results depending on the previous state of the system will lead to inaccurate results.
Therefore, pulse swept signals have been chosen as the reference, as in the case of a
excitation, the hysteresis effect is removed from the characterization. To compare the effect of such excitation signals on the characterization of the same resonator (Variant 1 or 2), the amplitude of the excitation signal was set to 20
, and the three different signals were applied: (
,
, and
). For the pulsed sweep, for simplicity, only the
results are presented, as it has been previously demonstrated that it will yield a similar response to the other
methods (
or
). The resulting maximal velocity,
, bandwidth, quality factor, and resonance amplitude are presented in
Table 5 for both variants. As explained previously, the reference has been set to the performances of the devices when excited with a
-type excitation.
As such in the present case, characterizing a device presenting spring softening behavior with a instead of a -type excitation will lead to a global underestimation of its characteristics, as the maximal velocity, , and bandwidth will be underestimated by 1.31%, 0.05%, and 13.64%, respectively. This will lead to an overestimation of the quality factor of 16.67%. On the contrary, characterizing a device presenting spring softening behavior with a instead of a -type excitation will lead to a general overestimation of its characteristics, as the maximal velocity and bandwidth will be overestimated by 86.81%, and 33.64%, respectfully, as well as an underestimation of both and of the quality factor by 7.19% and 33.33%, respectively.
On the other hand, characterizing a device presenting spring-hardening behavior with a instead of a -type excitation will lead to a global overestimation of its characteristics, as the maximal velocity, , and bandwidth will be overestimated by 23.28%, 1.87%, and 10%, respectively. This will lead to an underestimation of the quality factor of 7.14%. Characterizing a device presenting spring-hardening behavior with a instead of a -type excitation will lead to a global underestimation of its characteristics, as the maximal velocity, , and bandwidth will be underestimated by 0.81%, 0.39%, and 21.07%, respectively. This will lead to an overestimation of the quality factor of 28.57%.
In the case of energy harvesters, this overestimation is particularly of interest, as the maximum output power is directly linked to the maximum displacement, and therefore, the velocity reached by the resonator, and the operation range of the resonator is linked to the bandwidth of the resonance. Therefore, a figure of merit (FOM) has been defined as the product of the amplitude of the velocity at resonance by the bandwidth of the resonance. This FOM is therefore expressed in
. This FOM allows for the realization of a compromise between the bandwidth and amplitude of the displacement at resonance, both weighted equally. Such FOM is presented in
Table 5 for both variants. This shows that the FOM can be skewed significantly depending on how the devices are characterized.
Similarly to what has been observed previously, characterizing a device presenting with nonlinear behavior with a -type excitation will lead to an underestimation (−15% in the present case) or an overestimation (36% in the present case) of its characteristics, depending on whether the device is presenting with spring softening- or spring hardening-type behavior.
On the other hand, characterizing a device presenting with nonlinear behavior with a excitation will lead to an overestimation (150% in the present case) or an underestimation (−22% in the present case) of its characteristics, depending on whether the device is presenting with spring softening- or hardening-type behavior.
Therefore, the authors recommend the characterization of nonlinear MEMS resonators to be performed using a -type excitation. However, the characterization of a nonlinear resonator with such excitation is a bit more complex to implement than the and excitations. As function generators are not readily suited to such an operation, it is necessary to remotely control the excitation frequency, using either a remote interface capability or arbitrary signal generation. A manual measurement of the frequency behavior, frequency by frequency, to carry out a PS excitation can also be carried out if test time is not a factor. In this work, automated test sequences were programmed using the signal generator interface to reduce the test time.
It should be noted that if -type excitation is not available to the designer, the type of excitation used should be specified to allow the reader to estimate whether the characteristics presented are either overestimated or underestimated. Exceptions to this recommendation can be made if the excitation signal of the nonlinear resonators is known to exhibit a sweep in frequency while in use in a given end-application, in which case the characterization using a or a -type excitation will lead to more accurate results depending on the type of the frequency sweep expected in the application.


